quantitative measurement and imaging of transport processes in plants and porous media by 1h nmr
TRANSCRIPT

Magnetic Resonance Imaging, Vol. 10, pp. 827-836, 1992 Printed in the USA. All rights reserved.
0730-725x/92 $5.00 + .oo Copyright 0 1992 Pergamon Press Ltd.
l Session: Plenary Lecture
QUANTITATIVE MEASUREMENT AND IMAGING OF TRANSPORT PROCESSES IN PLANTS AND POROUS MEDL4 BY ‘H NMR
T. J. SCHAAFSMA, H. VAN As, W.D. PALSTRA, J.E.M. SNAAR AND P.A. DE JAGER Department of Molecular Physics, Agricultural University, Dreijenlaan 3, 6703 HA Wageningen, The Netherlands
NMR and MRI have been applied to transport processes, that is, net flow and diffusion/perfusion, of water in whole plants, cells, and porous materials. By choosing proper time windows and pulse sequences, magnetic res- onance imaging can be made selective for each of the two transport processes. For porous media and plant cells the evolution of the spatial distribution of excited spins has been determined by q-space imaging, using a 20 MHz pulsed ‘I-l NMR imager. The results of these experiments are explained by including spinrelaxation and exchange at boundaries. A 10 MHz portable ‘H NMR spectrometer is described, particularly suitable to study the response of net flow in plants and canopies to changing external conditions.
Keywords: Quantitative flow measurements; Flow imaging; q-space imaging; Plants; Porous materials; Porta- ble NMR spectrometer.
INTRODUCTION
Transport of water in plants and of fluids in porous media involves several flow types: (1) unidirectional flow (mostly laminar) in plant vessels ‘s2 and pore chan- nels, (2) dispersion, when combined with net flow resulting in perfusion or percolation, occurring in biological tissues and organs as well as in porous struc- tures, and (3) (self) diffusion in cells and pores, fre- quently restricted by membranes or pore boundaries.
Dispersion results from flow through a porous me- dium, ideally if the molecular displacement vectors at the entrance and exit of the pore are uncorrelated. The molecular motion through the porous medium can be characterized as a random walk at a macro- scopic scale. As for diffusion, the square of the mo- lecular displacement is linearly dependent on time, with the dispersion coefficient as the proportionality constant in the long time limit. Generally, the disper- sion coefficient may be anisotropic and must be de- scribed by a dispersion tensor.
We define perfusion as a combination of dispersion and net average flow as a result of a pressure gradient, and percolation as net flow of a fluid under its own weight through a dispersive medium.
When applying NMR -either imaging or nonimag- ing- to water or fluids in biological systems or porous materials in general, some properties of these systems should be taken into account: (1) for biological tissues, in particular of plants, frequently there is a large ex- cess (up to = lOO-fold) of stationary phase (including diffusion) with respect to the mobile phase. If no spe- cial precautions are taken flow NMR signals will be obscured. (2) Net and random flow often occur simul- taneously. (3) Nuclear spins, labeled by an RF and/or magnetic field gradient pulse sequence, exhibit T1 and T2 relaxation at the walls of pores or cells. Their size distribution as well as the nature of the walls affect the rate of spin relaxation. Generally, the compartments in biological tissues give rise to multiexponential TI and T2 decay of the observed protons.3 (4) Due to the heterogeneous mass distribution at the microlevel, there are local differences in magnetic susceptibility, resulting in internal magnetic field gradients. Their ef- fects are particularly important at air-liquid and air- solid interfaces, as occur in many biological systems.
This paper discusses and illustrates a number of NMR methods - including imaging techniques-to se- lectively observe a particular type of flow (e.g., net flow) in the presence of other types of flow and/or a
Address correspondence to H. Van As, Department of Molecular Physics, Agricultural University, Dreijenlaan 3, 6703 HA Wageningen, The Netherlands.
827

828 Magnetic Resonance Imaging 0 Volume 10, Number 5, 1992
large excess of stationary phase, as illustrated by ex- amples from different areas of application. In addi- tion, it draws attention to some basic limitations of existing NMR methods for the measurement of flow characteristics in plant and porous materials. We have limited ourselves to discussing NMR of simple, mo- bile fluids and their imaging. For detailed NMR stud- ies of the various types of flow in humans or animals there may be additional complications, resulting from the special rheological properties of the mobile body fluids (e.g., non-Newtonian blood flow in narrow capillaries).
METHODS
NMR has been shown to be particularly suitable to study different types of flow in a variety of materi- als.4-7 There are two basically different approaches to quantitative NMR flow imaging: First, one may at- tempt to spatially resolve flow in more or less detail for each selected part of the object.8,9 The change of the NMR signal amplitude or its phase may be fol- lowed in time for a selected volume of interest. In its most elaborate form, this method results in a recon- structed flow image, containing the fluid velocity vec- tor for each voxel. Depending on the presence and type of space-encoding gradients, the selected volume may have the shape of a slice or cylinder parallel to the flow direction,“*” or perpendicular to it, employing inflow-outflow of labeled spins” or time-of-flight methods. l3
As pointed out by Callaghan et al., l4 any space- resolving method has the inherent disadvantage that the NMR signal-to-noise ratio, and thus the spatial res- olution, decreases with increasing magnetic field gradient.
Alternatively, displacement imaging is appropriate whenever spatial resolution of flow vectors is less im- portant than the distribution of displacements of the fluid through the medium, irrespective of the position of the volume element where the flow occurs. This type of imaging is particularly suitable for random fluid transport phenomena. Displacement imaging - also denoted as q-space imaging’5*‘6 -can be consid- ered a recent offspring from the pioneering work of Stejskal and Tanner, 17-20 Karger and Heink, and others, who used the pulsed gradient spin-echo (PGSE) method to investigate molecular diffusion and displace- ments in general. It has been demonstrated’6,2’*22 that the Fourier transform (FT) F( S(q)) of a plot of the echo amplitude S(q) versus q = (2n)-‘(yG6) in a PGSE experiment yields important information on the correlation length for random displacements in a po- rous medium.
It has been shown that
HS(q)l = s p(rVV;r’,A) dr
where
(1)
S(q) = P(r)P(r;r’,A) exp [2?riq. (r’ - r)] dr’dr ,
(2)
p(r) is the initial concentration of labeled spins in a voxel with coordinate r, and P(r;r’,A) is the condi- tional probability density that a labeled spin at r = r will be found at r = r’ at t = A.
Thus, the FT of the signal in q-space yields the dis- tribution function for displacements in the direction of q. This formalism is entirely analogous to conven- tional imaging in coordinate space. For this k-space imaging
with
and
FISWJ = p(r)
S(k) = s
p(r) exp (2rik.r) dr (4)
k = (2r)-‘(yGt) .
In contrast to k-space imaging, in q-space the resolu- tion is only limited by the maximum available value of q. I4 In a PGSE experiment the NMR signal exhibits a coherence peak for combinations of field gradient strength and phase-encoding period 6, corresponding to displacements corresponding to the average pore distance in porous media or to the average cell diam- eter in biological tissues. In fact q-space imaging has been suggested’4,‘6,22-24 to represent the void volume correlation function in the direction of the applied pulsed gradient and therefore gives access to the dy- namic porosity of the material at microscale, typically down to 1 pm.
For strongly heterogeneous objects q- and k-space imaging may be combined to q,k-space imaging in up to three dimensions, by applying readout gradients perpendicular to the pulsed gradient direction, that is, perpendicular to the displacement vector.
Discrimination of net and random flow and a sta- tionary phase can be achieved by their different effects on the spin dephasing in the xy plane perpendicular to Bo, during the phase-encoding period 6 and the phase-
‘H NMR and transport in plants and porous media 0 T.J. SCHAAFSMA ET AL. 829
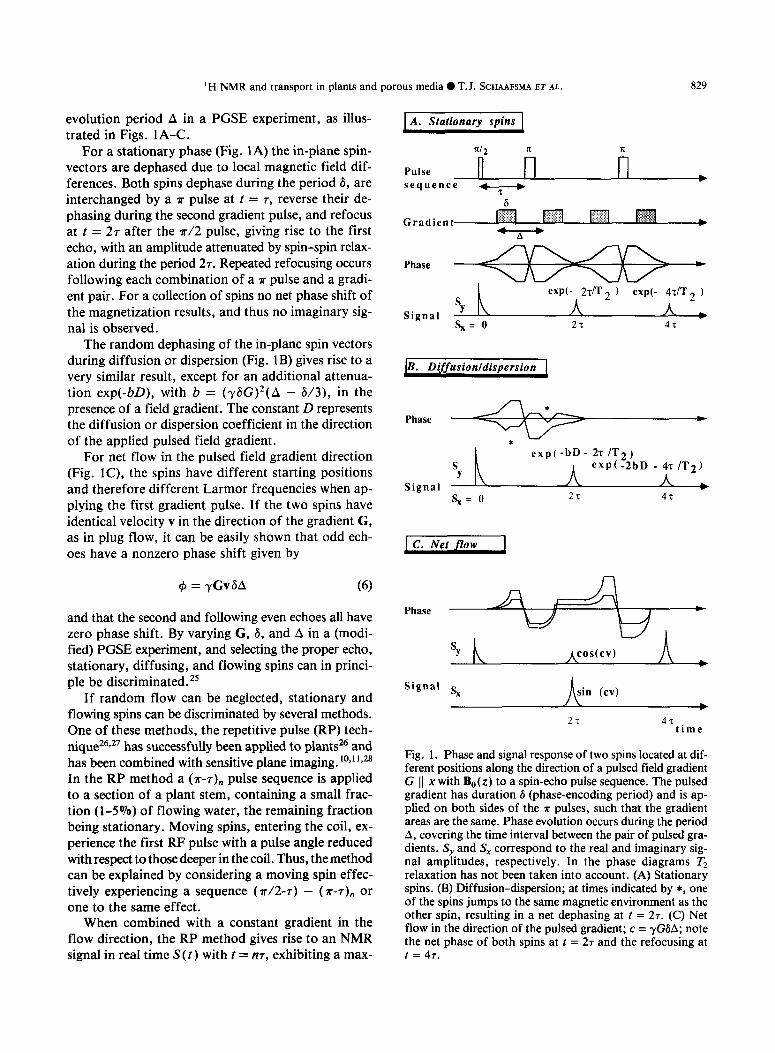
evolution period A in a PGSE experiment, as illus- trated in Figs. lA-C.
For a stationary phase (Fig. 1A) the in-plane spin- vectors are dephased due to local magnetic field dif- ferences. Both spins dephase during the period 6, are interchanged by a ?r pulse at t = T, reverse their de- phasing during the second gradient pulse, and refocus at t = 27 after the ?r/2 pulse, giving rise to the first echo, with an amplitude attenuated by spin-spin relax- ation during the period 27. Repeated refocusing occurs following each combination of a ?r pulse and a gradi- ent pair. For a collection of spins no net phase shift of the magnetization results, and thus no imaginary sig- nal is observed.
The random dephasing of the in-plane spin vectors during diffusion or dispersion (Fig. 1B) gives rise to a very similar result, except for an additional attenua- tion exp(-bD), with b = (r&G)*(A - 6/3), in the presence of a field gradient. The constant D represents the diffusion or dispersion coefficient in the direction of the applied pulsed field gradient.
For net flow in the pulsed field gradient direction (Fig. IC), the spins have different starting positions and therefore different Larmor frequencies when ap- plying the first gradient pulse. If the two spins have identical velocity v in the direction of the gradient G, as in plug flow, it can be easily shown that odd ech- oes have a nonzero phase shift given by
4 = yGv6A (6)
and that the second and following even echoes all have zero phase shift. By varying G, 6, and A in a (modi- fied) PGSE experiment, and selecting the proper echo, stationary, diffusing, and flowing spins can in princi- ple be discriminated.*’
If random flow can be neglected, stationary and flowing spins can be discriminated by several methods. One of these methods, the repetitive pulse (RP) tech- nique26,27 has successfully been applied to plants26 and has been combined with sensitive plane imaging.‘0*1’*28 In the RP method a (T-T), pulse sequence is applied to a section of a plant stem, containing a small frac- tion (l-5070) of flowing water, the remaining fraction being stationary. Moving spins, entering the coil, ex- perience the first RF pulse with a pulse angle reduced with respect to those deeper in the coil. Thus, the method can be explained by considering a moving spin effec- tively experiencing a sequence (n/2-7) - (T-T), or one to the same effect.
When combined with a constant gradient in the flow direction, the RP method gives rise to an NMR signal in real time S(t) with t = m, exhibiting a max-
A. Stationary spins
X’2
Pulse 1 i fi ) sequence
v
Signal 5
exp(- 2r/T 2 ) exp(- 4~1T~ )
A + sx= 0 2r 4r:
B. Diffusionldispersion
Phase n- *
* exp( -bD- 27 IT2)
s Y
exP( -2bD - 47 /T2)
Signal A & $= 0 27 47
C. Net flow I
Phase
sY
Signal s,
*
ä
A sin (cv)
27 47 time
Fig. 1. Phase and signal response of two spins located at dif- ferent positions along the direction of a pulsed field gradient G 11 x with B,(z) to a spin-echo pulse sequence. The pulsed gradient has duration 6 (phase-encoding period) and is ap- plied on both sides of the ?r pulses, such that the gradient areas are the same. Phase evolution occurs during the period A, covering the time interval between the pair of pulsed gra- dients. S, and S, correspond to the real and imaginary sig- nal amplitudes, respectively. In the phase diagrams Tz relaxation has not been taken into account. (A) Stationary spins. (B) Diffusion-dispersion; at times indicated by *, one of the spins jumps to the same magnetic environment as the other spin, resulting in a net dephasing at t = 27. (C) Net flow in the direction of the pulsed gradient; c = yGGA; note the net phase of both spins at t = 27 and the refocusing at t = 47.
830 Magnetic Resonance Imaging 0 Volume 10, Number 5, 1992
imum amplitude at t,, related to the average linear flow rate u (e.g., in mm/set) by
v = ca(-yG&)-’ (7)
with c a calibration constant, determined from a con- trol experiment using an aqueous solution with the same composition as the plant sap, flowing through a capillary. The initial slope of the S(t) curve has been shown26 to be proportional to the volumetric flow rate Q (e.g., in pl/sec). In practice, at 20 MHz, lower limits are found to be = 1 mm/set for u and 5 $/set for Q for single-scan recordings.
A one-dimensional version of spatially resolved NMR flow measurement can be realized when flow is monitored at various positions of an extended object. This method has been applied to a plant within a crop canopy, 29-33 using a miniaturized IO-MHz ‘H spec- trometer, described below in more detail, permitting quantitative measurement of the distribution of sap stream and plant tissue water content with the canopy at variable height above ground level.
EXAMPLES
Whole Plants Measurements of sap stream and water content in
whole plants under controlled physiological conditions can provide crucial information on the photosynthetic productivity and water balance under otherwise non- limiting conditions, that is, when the plant operates under optimum illumination, temperature, air humid- ity, and CO2 content. The complex relations between these variables in an intact plant34935 can be studied in the laboratory, using NMR to monitor the sap stream through the xylem vessels and the surrounding tissue water content.36*37 For field applications, such studies are necessary but insufficient, since the environmen- tal conditions of a plant in a crop canopy generally are different from those for isolated, single plants in a lab- oratory experiment. In a crop, the spectral distribution and light intensity falling on the plant leaves vary be- tween the top layer and the ground level. In addition the microclimate around the plant may show large variations with height, depending on the crop density, the age of the plants, and the macroclimate in the greenhouse. Conventional methods to monitor the plant water status have been widely applied to plants in crops, but are tedious and of limited use.
A portable lo-MHz ‘H NMR spectrometer (“bio- flowmeter”) has been constructed, allowing applica- tion to plants in a crop. The bioflowmeter uses a permanent Alnico magnet (30 kg, dimensions 22 x
24 x 28 cm) equipped with a magnetic field gradient in
the flow direction, a single RF coil, folding around the plant stem, a field-frequency lock, using the station- ary tissue water signal, and Bruker Minispec electron- ics (Bruker Gmbh, Karlsruhe) for generating (T-T),, and CPMG-sequences for measuring flow and T2, re- spectively, as well as for detecting the response of the spin system. The bioflowmeter is menu-driven from an IBM-compatible PC computer for unguarded opera- tion for prolonged periods of time.38 Constructional details and performance are described elsewhere.29
The bioflowmeter has been applied to intact cucum- ber plants in a computer-controlled greenhouse envi- ronment, and the results are shown in Fig. 2. During a 24-hr period, solar radiation (Fig. 2A), relative hu- midity (Fig. 2B), transpiration by weight balance, and uptake by measuring the level of the nutrient solution (Fig. 2C) were continuously monitored. At 13 hr, the top windows of the greenhouse were opened, resulting in a drop of the relative humidity and - as expected - a sharp rise in transpiration and uptake. NMR mea- surements of the sap stream (Q and u, Fig. 2D and E, respectively) closely follow the independently mea- sured transpiration and uptake. In addition to flow, the water content of the stem tissue surrounded by the RF coil can be determined from the effective spin-spin relaxation time of the tissue using a CPMG pulse sequence.
The time resolution of the bioflowmeter is approx- imately 5 set for each data point, superior to existing non-NMR methods. The value of Q (in pl/sec) turns out to correspond closely to the transpiration rate ex- pressed in grams per hour. A full measuring cycle con- sists of the sequence: lock, CPMG T2 measurement to determine tissue water content, and flow measure- ment, using the RP method, as discussed in the meth- ods section.
Figure 3 presents eight 200-MHz proton images of celery stems with stepwise increasing gradients in the long direction of the stems. No attempt has been made to quantitate these images, since they are only intended to yield qualitative information, based on contrast. In the series of images from top left to bottom right, the signal amplitude of protons of tissue water in the left half of the largest stem starts out at a high value (yel- low, top left image) where the tissue has been bruised and drops to a low value (gray) at the bottom right im- age. In the same series, protons of water in a limited number of xylem vessels, a few hundred micrometers across, can be seen to have almost constant signal am- plitude. This is contrary to what is expected, assum- ing restricted diffusion of water in the tissue and almost free diffusion in the xylem vessels (see the next section). In fact, for restricted diffusion the slope of the signal amplitude versus G2 at constant 6, A, and 7

‘H NMR and transport in plants and porous media 0 T.J. SCHAAFSMA ET AL. 831
b
6
_- . . . . . , , . , I , . , . . . , 0 4 8 a_ 12 16 20 24
-rIilBC(lllS)
Fig. 2. Recording of transpiration of an intact hydrocultured cucumber plant (Cucumis sutivus L.) in a greenhouse environ- ment with simultaneous measurement of the environmental conditions. (A) Ambient solar radiation. (B) Relative humidity, measured close to (---) and far from (-) the plant. (C) Transpiration (-) and uptake (---) of water. (D) Volumetric flow rate Q. (E) Linear flow rate v. (D) and (E) Measured with the portable NMR bioflowmeter described in the text. (Courtesy J.E.A. Reinders, H. van As, P.A. de Jager, R.C.P.M. van de Sanden, and T. J. Schaafsma.)
should be less than that for free diffusion, contrary to what is observed. This points to the dominant role of T2 for the two kinds of protons, which may have faster T2 relaxation in cells than in vessels. For a cor- rect interpretation of images of water in plants, the different sizes of the compartments containing the ob- served protons should be taken into account by vary- ing A.
Plant Cells Figure 4 represents the profile for the displacement
of water in yeast cells in the direction of the field gradient, as a result of one-dimensional q-space STE imaging, reproduced from the work of Cory and Gar- roway,22 with a spatial resolution of 2.75 pm and dis- placement periods A = 5, 20, and 100 msec. For all three times, the profiles almost coincide, as expected

832 Magnetic Resonance Imaging 0 Volume 10, Number 5, 1992
Fig. 3. 200-MHz (MSL200, Bruker GmbH, Karlsruhe, Germany) ‘H images of a cut section of celery stems. In a series of images starting at the top left of the first row and ending at the bottom right of the second row, a magnetic field gradient along the (average) stem axis was increased from 0 to 70 mT/m in 10 mT/m steps in a PGSE experiment. The color code is yellow, red, blue, gray, and black for maximum to zero signal amplitude. (Courtesy of W.D. Palstra.)
for restricted diffusion of water in the cells. Recalling that the allowed displacements range from -I to +I for a cell of width 1, the full width at half maximum corresponds to an average cell diameter of about 5 pm. The authors have obtained this result without invok- ing any model for the cell. Assuming that the self-dif- fusion constant of water within the cell is 6.8 x 10m6 cm*/sec,” an r.m.s. displacement of =2 pm is calcu- lated for A = 5 msec, that is, smaller than the average cell diameter. Yet, the displacement profile for A = 5 msec almost coincides with that for longer displace- ment periods.
- 5ms 20 Ins
_ 100 ms
r I I I I 1 -20 -10 0 10 20
displacement microns
Fig. 4. P(r,A) versus the displacement for yeast cells. (Re- produced with permission from Ref. 22.)
In biological systems, the walls (membranes) sur- rounding compartments cannot be considered to be in- ert for magnetization (wall relaxation, permeable walls). To demonstrate wall effects, a model for re- stricted diffusion in a spherical volume, including T2 relaxation at the cell wall3 has been applied. This model uses the product of the cell radius a and the pa- rameter h = H/D, where H (in m/set) is the magnetic sink strength of the cell wall. A finite bulk T2 spin re- laxation is assumed.3 For ah = 0 there is no cell wall T2 relaxation and labeled spins are totally reflected into the bulk volume. On the other hand, for ah = 00, the cell wall is assumed to cause complete T2 relax- ation of spins arriving at the cell wall, that is, it can be considered as totally absorbing. For totally reflecting walls, as a rule, the apparent diffusion constant Deff is larger than for totally absorbing walls. In both cases, Deff is smaller than for free diffusion. Taking the Fourier transform of the PGSE amplitude versus yG6 yields the spherical displacement profiles, shown in Fig. 5. For a totally reflecting wall (Fig. 5A), the av- erage displacement has not reached the cell walls at A = 5 msec; at A = 20 and 100 msec diffusion is re- stricted by the cell boundaries. For totally absorbing walls (Fig. 5B), the profiles coincide for A = 5 msec and L 20 msec. The simulated profile, using the aver- age yeast cell diameter, ” agrees very well with the ex- perimental profile obtained by Cory and Garroway.** This simulation demonstrates that cell wall relaxation should be included to obtain a congruent relation be- tween the displacement profile and the cell diameter.

‘H NMR and transport in plants and porous media 0 T.J. SCHAAFSMA ET AL. 833
(A) 40 -
-A5ms
-A 20 ms
-A 100 ms
30 -
(W 50 -
-ASms
-A 20 ms
40 -
30 -
20 -
1 8.0 1O-6
displacement (m)
Fig. 5. Simulation of P(r,A) versus the displacement r for water in spherical cells using D = 2.35. 10e5 cm2/sec and the di- ameter of yeast cells as in Ref. 17. Spin-spin relaxation of water protons in contact with cell walls: (A) T2 = 03 (total reflec- tion of labeled spins); (B) T2 = 0 (total absorption of labeled spins). (Courtesy of J.E.M. Snaar, H. van As.)
Dispersion in a Glass Bead- Water Model System In many-but not all-respects, porous materials
behave analogously to biological cells with respect to diffusion measurements, using PGSE or similar meth- ods. In contrast to cell walls, the pore surface spin-spin relaxation generally is not the dominating dephasing mechanism, but the pore-pore migration, character- ized by the dispersion coefficient D’ of labeled spins. Figure 6 shows the displacement profile for transver- sal dispersion of water flowing through a tube con- taining an unconsolidated sample of glass beads. The
results show that (1) there is no flow perpendicular to the tube axis, as expected, and (2) the profile can be described by a sum of two Gaussians, one of which representing molecular diffusion dominates at short values of the displacement period A, the other yield- ing the transversal dispersion coefficient D;. In the direction of flow, the profile is found to consist of a superposition of a dispersion profile with the longitu- dinal dispersion coefficient D[ depending on the aver- age net flow rate u and a Gaussian with a maximum at an average displacement u-A .24

834 Magnetic Resonance Imaging 0 Volume 10, Number 5, 1992
P(r,A)
-5.0 1o-4 -3.0 io-4 -1.0 lO-4 I.0 1o-4 3.0 1o-4 5.0 1o-4
Transversal displacement, x, (m)
Fig. 6. P( r, A) versus the transversal displacement x = 2s( +G)-’ of magnetically labeled protons of water in a model sys- tem of glass beads (I#I = 290 pm); u = 4.06 mm/set with A = 50, 70, 90, 110, 130, 150, 160, and 190 msec for the subsequent curves from top to bottom. (Courtesy of W.D. Palstra, H. van As.)
DISCUSSION
Monitoring the water status of whole plants, includ- ing the water potential and flow through the stem by means of NMR, is still in its infancy. Yet the results obtained so far under carefully controlled laboratory conditions and in a greenhouse environment have demonstrated its potential for basic physiological stud- ies 36*37*39 and as an automated, fast-response, and se- leciive sensor for measuring water content and flow in greenhouse crops. 29-33 Monitoring of the crop physi- ology, using one or more “speaking plants,“@ may not only be useful as a greenhouse input control and feedback, but also to verify crop growth models,41 in particular, when combined with other methods.’
Water transport and content are among the most important variables controlling the complex mecha- nism of growth and (re)production in plants.34p35 With the advent of NMR microscopy8*16,23*42*43 at the cellular level, information on the distribution and movement of water in the various parts of plants has become available. Such data are extremely important for understanding the physiology of normal as well as diseased plants. There are as yet relatively few exam- ples of plant MR144-46 compared with those in the medical field. Also, contrast in plant images is not yet well understood.
The PGSE method has been used for quite some
time to characterize flow and diffusion in porous ma- terials. 17-21*47-so Q-space imaging is particularly suit- able to determine random flow characteristics in porous media and biological materials. As demonstrated by a few examples from different areas of application, NMR imaging making use of pulsed gradients is a powerful method to discriminate stationary spins, uni- directional flow, diffusion, and perfusion. In addition, the use of pulsed gradients permits higher gradient coil currents and therefore higher values than for constant gradients. Therefore internal gradients, set up by lo- cal susceptibility differences within the object, can more easily be made negligibly small with respect to the externally applied gradients.
The PGSE method is selective for T2 processes, whereas a modified version, the pulsed gradient-stim- ulated spin-echo method (PGSTE), is selective for T, processes. Since the potential of q-space imaging is limited by T2 processes, this may be important for ex- tending q-space imaging and related methods for prob- ing the dynamic porosity p* at the pore scale.
The value of p* may deviate from the macroscopic value p measured, for example, by determining the void volume by measuring the difference in weight of dry samples and those completely saturated with fluid, since dead ends do not contribute to the displacement profile. Also, parallel connections between pores may contribute differently to p and p*. Depending on the

‘H NMR and transport in plants and porous media 0 T.J. SCHAAFSMA ET AL. 835
nature of the porous material, spin relaxation at pore walls -or more seriously-in connecting channels, may considerably affect the value of p’, whereas p
would be insensitive to this effect. Only for materials having sufficiently slow spin relaxation at the liquid- solid interface can displacement profiles be determined over a significant distance.
Acknowledgments-The authors thank the Koninklijke/Shell Laboratory Amsterdam for making available NMR equipment and Mr. Y.S. Ykema and Ms. S.W. van der Wiel for technical assistance in preparing the manuscript. The research presented in this paper has been supported by a grant (87010 AG) from the Koninklijke/Shell Laboratory Amsterdam, the Koninklijke/Shell Exploration and Pro- duction Laboratory, and the Netherlands Foundation for Techni- cal Research, Technical Division of the Netherlands Scientific Organization (grant WAW 07.0068).
1.
2.
3.
4.
5.
6.
7.
8.
9.
10.
11.
12.
13.
REFERENCES
Baker, J.M.; van Bavel, C.H.M. Measurement of mass flow of water in the stems of herbaceous plants. Plant Cell Environ. 10:777-782; 1987. Milburn, J.A. Water Flow in Plants. London: Longman Group; 1979. Brownstein, K.R.; Tarr, C.E. Importance of classical diffusion in NMR studies in biological cells. Phys. Rev. A19:2446-2453; 1979. Van As, H.; Schaafsma, T. J. Flow in nuclear magnetic resonance imaging. In: S.B. Petersen, R.N. Muller, P.A. Rinck (Eds.). An Introduction to Biomedical Nuclear Magnetic Resonance. Stuttgart: Georg Thieme Verlag: 1985: pp. 68-96. Hemminga, M.A. Measurement of flow characteristics using NMR. In: T.L. James, A. Margulis (Eds.). Bio- medical Magnetic Resonance. San Francisco: Radiology Research and Education Foundation; 1984: pp. 157-184. Le Bihan, D.; Turner, R.; Moonen, C.T.W.; Pekar, J. Imaging of diffusion and microcirculation with gradi- ent sensitization: Design, strategy, and significance. J. Magn. Reson. Imaging 1:7-28; 1991. Le Bihan, D. Molecular diffusion nuclear magnetic res- onance imaging. Magn. Res. Q. 7:1-30; 1991. Xia, Y.; Callaghan, P.T. Measurement of velocity and diffusion profiles by NMR microscopy. Bull. Magn. Reson. 11:384; 1989. Moran, P.R. A flow velocity zeugmatographic interlace for NMR imaging in humans. Magn. Reson. Imaging 1: 197-204; 1982. Guilfoyle, D.N.; Gibbs, P.; Ordridge, R.J.; Mansfield, P. Real-time flow measurements using echo-planar im- aging. Magn. Reson. Med. 18:1-S; 1991. Mansfield, P. Multiplanar image formation using NMR spin echoes. J. Phys. Chem. Solid State Phys. lO:LSS- L58; 1977. Singer, J.R. Blood flow rates by NMR measurements. Science 130:1652-1653; 1959. Chart, F.; Macovski, A.; Nishimura, D. Perfusion im-
14.
15.
16.
17.
18.
19.
20.
21.
22.
23.
24.
25.
26.
27.
28.
29.
30.
aging by remote excitation. Book of Abstracts: Society of Magnetic Resonance in Medicine 1988. Berkeley, CA: Society of Magnetic Resonance in Medicine; 1988: p. 899. Callaghan, P.T.; Coy, A.; MacGowan, D.; Packer, K.J.; Zelaya, F.O. Diffraction-like effects in NMR diffusion studies of fluids in porous solids. Nature 351:467-469; 1991. Redpath, T.W.; Norris, D.G.; Jones, R.A.; Hutchison, J.M.S. A new method of NMR flow imaging. Phys. Med. Biol. 29:891; 1984. Callaghan, P.T.; Eccles, C.D.; Xia, Y. NMR microscopy of dynamic displacements: k-space and q-space imaging. J. Phys. E: Sci. Instrum. 21:820-822; 1988. Tanner, J.E.; Stejskal, E.O. Restricted self-diffusion of protons in colloidal systems by the pulsed-gradient, spin- echo method. J. Chem. Phys. 49:1768-1777; 1968. Tanner, J.E. Use of the stimulated echo in NMR diffu- sion studies. J. Chem. Phys. 52:2523-2526; 1970. Tanner, J.E. Transient diffusion in a system partitioned by permeable barriers: Application to NMR measure- ments with a pulsed field gradient. J. Chem. Phys. 69: 1748-1754; 1978. Stejskal, E.O.; Tanner, J.E. Spin diffusion measure- ments: Spin echoes in the presence of a time-dependent field gradient. J. Chem. Phys. 42:288-292; 1965. Karger, J.; Heink, W. The propagator representation of molecular transport in microporous crystallites. J. Mag. Reson. 51:1-7; 1983. Cory, D.G.; Garroway, A.N. Measurement of transla- tional displacement probabilities by NMR: An indica- tor of compartmentation. Magn. Reson. Med. 14:435- 444; 1990. Callaghan, P.T.; Eccles, C.D. Diffusion-limited resolu- tion in nuclear magnetic microscopy. J. Mag. Reson. 78: l-8; 1988. Callaghan, P.T.; MacGowan, D.; Packer, K.J.; Zelaya, F.O. High-resolution q-space imaging in porous struc- tures. J. Mag. Reson. 90:177-182; 1990. Snaar, J.E.M.; van As, H. Discrimination of different kinds of motion by modified stimulated-echo NMR. J. Mag. Reson. 87:132-140; 1990. Van As, H.; Schaafsma, T.J. Noninvasive measurement of plant water flow by nuclear magnetic resonance. Bio- phys. J. 45:469-472; 1984. Van As, H.; Schaafsma, T.J. Measurement of flow by the NMR repetitive pulse method. J. Mag. Reson. 74: 526-534; 1987. Van As, H.; Kleijn, J.M.; de Jager, P.A.; Schaafsma, T. J. A novel method for spatially resolved flow measure- ments. J. Mag. Reson. 62:511-517; 1985. Van As, H.; Reinders, J.E.A.; de Jager, P.A.; van de Sanden, P.A.C.M.; Schaafsma, T.J. In situ plant water balance studies with a portable NMR spectrometer. Unpublished. De Jager, P.A.; Reinders, J.E.A.; van As, H. Pulsed NMR system for automatic in vivo flow measurements. Proceedings of the 8th European Experimental NMR Conference, Spa, Belgium; 1986; pp. 53-54.

836 Magnetic Resonance Imaging 0 Volume 10, Number 5, 1992
31. Van As, H. NMR in horticulture: In situ water balance studies using NMR. Acta Horticulturae: 304:103-l 13; 1992.
32. van de Sanden, P.A.C.M.; Reinders, J.E.A.; de Jager, P.A.; van As, H. Stem sap flow, measured using pro- ton nuclear magnetic resonance, in comparison with transpiration and water uptake of cucumber in a green- house climate. Acta Horticulturae: 304:237-245; 1992.
33. de Jager, P.A.; Reinders, J.E.A.; Polder, G.; van As, H. A portable NMR spectrometer for automatic mea- surements in plants. Book of Abstracts, 9th European Experimental NMR Conference, Bad Aussee, Austria, 1988.
41. Gijzen, H.; Goudriaan, J. A flexible and explanatory model of light distribution and photosynthesis in row crops. Agric. Forest Meteoroi. 48:1-20; 1989.
42. Callaghan, P.T.; Xia, Y. Velocity and diffusion imaging in dynamic NMR microscopy. J. Msg. Reson. 91:326- 352; 1991.
43. Eccles, C.D.; Callaghan, P.T. High-resolution imaging. The NMR microscope. J. Mug. Reson. 68:393-398; 1986.
44. Connelly, A.; Lohman, J.A.B. ; Loughman, B.C.; Qui- quampoix, H.; Ratcliffe, R.G. High resolution imaging of plant tissues by NMR. J. Exp. Bot. 38:1713-1723; 1987.
34. Slatyer, R.O. Plant-Water Relationships. London: Ac- ademic Press; 1967.
35. Slavik, B. Methods of studying plant water relations. Ecological Studies. Berlin: Springer-Verlag; 1974: pp. 223-235.
36. Reinders, J.E.A.; van As, H.; Schaafsma, T.J.; de Jager, P.A.; Sheriff, D.W. Water balance in Cucumis plants, measured by nuclear magnetic resonance: I. J. Exp. Bot. 39:1199-1210; 1988.
37. Reinders, J.E.A.; van As, H.; Schaafsma, T.J.; Sheriff, D.W. Water balance in Cucumis plants, measured by nu- clear magnetic resonance; II. J. Exp. Bot. 39: 121 l-1220; 1988.
45. Brown, J.M.; Kramer, P.J.; Cofer, G.P.; Johnson, G.A. Use of nuclear magnetic resonance microscopy for non- invasive observations of root-soil water relations. Theor. Appl. Climatol. 42:229-236; 1990.
46. Johnson, G.A.; Brown, J.; Kramer, P.J. Magnetic res- onance microscopy of changes in water content in stems of transpiring plants. Proc. Natl. Acad. Sci. U.S.A. 84: 2752-2755; 1987.
47. Gallegos, D.P.; Smith, D.M. A NMR technique for the analysis of pore structure: Determination of continuous pore size distributions. J. CON. Interface Sci. 122:143- 153; 1988.
38. Polder, G.; de Jager, P.A.; van As, H. ASYST software for a PC controlled NMR spectrometer. Am. Labora- tory 21: 108-l 10; 1989.
48. Palstra, W.D.; van As, H.; Salverda, P.; Schaafsma, T. J. NMR measurement of hydrodynamic dispersion in glass bead phantoms in the presence of net flow. Unpublished.
39. Reinders, J.E.A. A nuclear magnetic resonance study of 49. Cotts, R.M.; Hoch, M.J.R.; Sun, T.; Marker, J.T. plant-water relationships. Ph.D. Thesis. Agricultural Pulsed field gradient stimulated echo methods for im- University, Wageningen, The Netherlands, 1987. proved NMR diffusion measurements in heterogeneous
40. Hashimoto, Y.; Morimoto, T.; Fukuyama, T. Some systems. J. Mug. Reson. 83:252-266; 1989.
speaking plant approach to the synthesis of control sys- 50. Packer, K.J.; Zelaya, F.O. Observations of diffusion of
tem in the greenhouse. Acta Horticulturae 174:219-226; fluids in porous solids by pulsed field gradient NMR.
1985. Colloids Surfaces 36:221-227; 1989.