quantitation of tmt-labeled peptides using higher … · quantitation using isobaric mass tags...
TRANSCRIPT
Quantitation of TMT-Labeled Peptides Using Higher-Energy Collisional Dissociation on the Velos Pro Ion Trap Mass SpectrometerRoger G. Biringer, Julie A. Horner, Rosa Viner, Andreas F. R. Hühmer, August Specht Thermo Fisher Scientific, San Jose, California, USA
Application Note: 520
Key Words
•VelosPro Dual-PressureLinear Ion Trap
•ProteomeDiscoverer
•TMTisobarictagquantitation
•TrapHCD
IntroductionAbsolute and relative quantitation of proteins have be-come mainstays in proteomics research.1 Spectral count-ing, amine- and sulfhydryl-reactive isobaric tags (TMT2, CysTMT™, and iTRAQ3), absolute protein quantitation (AQUA)4, stable isotope labeling by amino acid in cell culture (SILAC)5, as well as various label-free methods, are in common use. Each has advantages and disadvantages. Quantitation using isobaric mass tags provides a unique advantage by allowing simultaneous analysis (multiplex-ing) of up to six (TMT™) or eight (iTRAQ®) samples in a single experiment. The result is a significant improvement in sample throughput.
The TMT and iTRAQ technologies are based on the release of low-mass reporter ions during fragmentation, allowing simultaneous identification and quantitation of peptide ions. Both MS3 and pulsed-Q dissociation (PQD) methods6 are well established as robust and sensitive linear ion trap applications of these technologies. More recently, higher-energy collisional dissociation (HCD) performed on hybrid ion trap/Orbitrap™ mass spectrometers has been shown to produce superior quality MS/MS data for both identification and quantitation.7 This triple quadrupole-like fragmentation produces higher-intensity low-mass reporter ions than other technologies resulting in enhancement of both accuracy and precision of quantita-tion. Until recently, the HCD technology has been limited to Orbitrap instrumentation.
The Thermo Scientific Velos Pro dual-pressure linear ion trap mass spectrometer features an option for HCD fragmentation without the need for a separate HCD cell. Instead, the Velos Pro™ instrument uses an RF-only octopole for Trap HCD. During Trap HCD, the precursor ions are isolated in the high-pressure cell and then passed to the octopole at high energy, facilitating fragmentation. The fragments then are sent back to the dual-pressure trap for analysis. All of this occurs without the precursor m/z dependent low mass cutoff limitation that is normally seen with conventional resonance excitation CID frag-mentation. The result is dramatically higher reporter ion intensities than achievable with PQD leading to better ion statistics and better quantitation.
GoalThe first goal of this work was to optimize Trap HCD for relative quantitation and identification of TMT-labeled peptides on a Velos Pro linear ion trap mass spectrometer.
After the optimization, the second goal was to benchmark the Trap HCD technology for comparison to PQD and CID.
Experimental Conditions
SamplePreparationA tryptic digest of a reductively alkylated equal-molar mixture of twelve proteins (human transferrin, chicken lysozyme, bovine beta-lactoglobulin, bovine serum albumin, rabbit glyceraldehyde-3-phosphate dehydro-genase, horse myoglobin, horse cytochrome C, bovine alpha-lactalbumin, ovalbumin, bovine carbonic anhydrase, bovine beta-casein, and bovine alpha-casein) was split into six identical fractions. Each fraction was labeled with a different Thermo Scientific Pierce TMT-6plex label accord-ing to manufacturer’s protocol.8 Appropriate volumes of each labeled protein mixture were combined to produce both equal-molar and variable-molar ratios of the six tags (Table 1).
LC-MS/MSMethodSetUpLC: Thermo Scientific EASY-nLC
MS: Thermo Scientific Velos Pro dual-pressure linear ion trap with nanospray ion source
Column: Magic C18, 75-µm x 150-mm packed tip
Mobile Phase A: 0.1% formic acid in water
Mobile Phase B: 0.1% formic acid in acetonitrile
Flow rate: 300 nL/min
Gradient: 2%-30% B in 90 minutes
TheVelosPromassspectrometerwasoperatedasfollows:MS/MS: Top 10 data dependent HCD
Scan rate full MS: Enhanced, zoom, or normal
Charge screening: On
Normalized collision energy: 10%-50%
Repeat count: 1, dynamic exclusion: 15 s
Capillary temperature: 250 ºC
Full AGC target: 30000
MSn AGC target: 10000-50000
Maximum Injection time MSn: 200 msec, 1-2 µscans
Maximum injection time MS: 50 msec
Full MS mass range: 400-1400
MS/MS mass range: 50-1500
Isolation width: 0.8, 1.2 or 2.0 amu

Database Search and QuantitationThermo Scientific Proteome Discoverer software version 1.3 with SEQUEST® search engine was used in all experi-ments for both quantitation and identification (Figure 1). Data were filtered with Percolator to a medium confidence level or better and to include only those quantitations that give data for all six reporter ions. The data were searched using the following parameters:
Fixed modifications: TMT 6plex +229.163 Da (K and peptide N-terminal)
Carboxyamidomethyl (C)
Precursor mass tolerance: 1.0 Da
Fragment mass tolerance: 1.0 Da
Enzyme: Trypsin (full cleavage)
Maximum missed cleavages: 2
Quantitation isolation window: 0.3 Da, most confident centroid
Database: Custom database containing 12 proteins
For benchmark experiments, data from three technical replicates were evaluated simultaneously as replicates. Data from optimization experiments were evaluated inde-pendently.
Results and Discussion
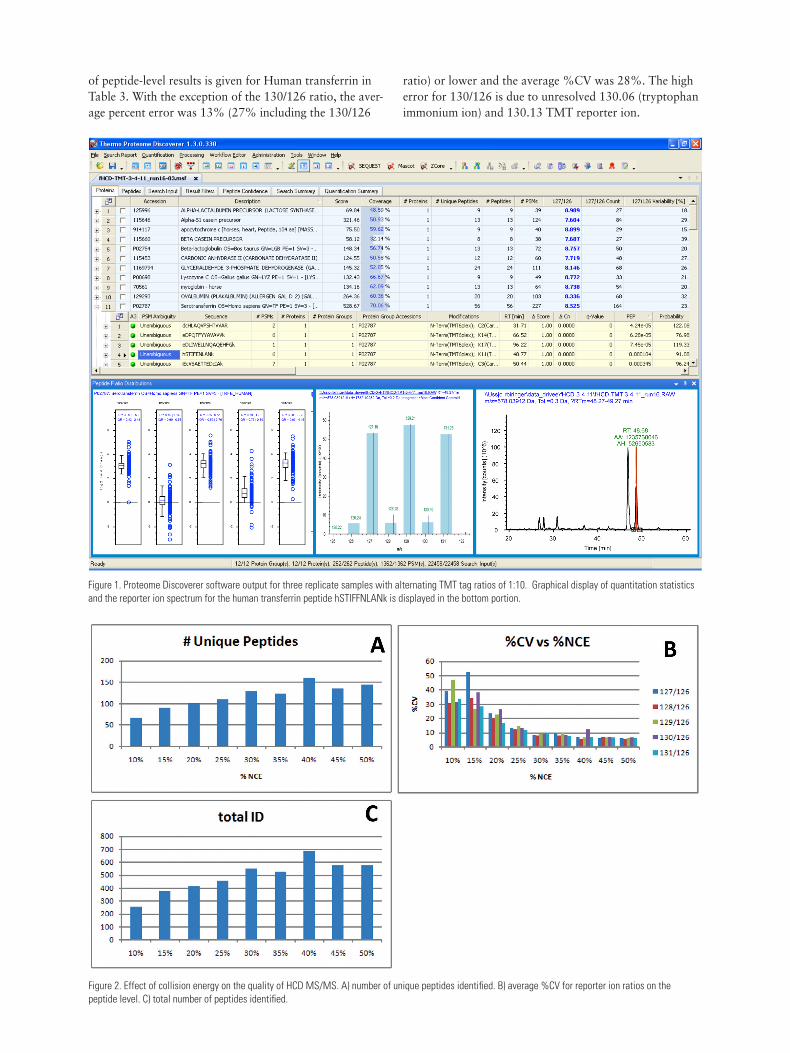
EffectofCollisionEnergyontheQualityofHCDMS/MSAnalyses using TMT and other isobaric mass tags require a collision energy that strikes a balance between the energy necessary to generate the reporter ion and the energy necessary to generate fragmentation spectra. Increas-ing the collision energy increases the number of reporter ions released, but may result in over-fragmentation of the peptide, reducing the quality of the fragmentation spectra and lowering result confidence. Collision energy for Trap HCD is automatically normalized based on the m/z and charge. Normalized collision energies (%NCE) for all charge states were examined from 10% to 50% in 5% increments. The numbers of distinct peptides quantified increased with increasing %NCE, maximizing in the 30% to 50% region (Figure 2A). The precision of quantitation across all peptides and reporters improved with increasing %NCE and leveled-off around 50% (Figure 2B). This was a direct result of the efficiency of reporter ion production (Figure 3C). With %NCE set in this range, high-intensity reporter ions and sufficient numbers of structurally deter-mining fragment ions were observed (Figure 2), allowing reliable peptide identification.
OptimizationofPrecisionandAccuracyPrecision and accuracy are the defining metrics for all quantitative analyses. Quantitation of TMT-labeled pep-tides is defined by the relative intensities and variability of intensities of the reporter ions. The number of micro-scans averaged prior to detection has a direct effect on the MS/MS signal-to-noise. Normally, signal quality improves with increasing micro-scans due to improved statistics and thus the accuracy and precision of the measurements
improves. The improvement in signal quality comes at a cost, as increasing the number of microscans reduces the number of measurements per unit time. This can result in a reduction in the number of peptides/proteins identified and associated quantitations depending on scan speed, chromatographic peak width, and sample complexity. We have observed (data not shown) that for the low-complex-ity samples and chromatographic elution times employed in these experiments, the numbers of identifications and quantitations were equivalent for data obtained with either 1 or 2 micro-scans, and 3 micro-scans produced a slightly reduced number of identifications.
It is well established that co-isolation of contaminating precursor ions has a leveling effect on reporter ion ratios. For this reason, it is advantageous to use the narrow-est isolation width that does not significantly impact the numbers of identifications and quantitations. We exam-ined isolation widths of 0.8, 1.2, and 2.0 Da and found no significant effect on the numbers of identifications and quantitations. However, quantitative precision and accu-racy was better with narrow isolation widths.
MSn AGC targets were varied between 10000 and 50000 to examine the effect on precision and accuracy. It was found that a target of 50000 resulted in the highest reporter ion amplitude, best precision, and accuracy of quantitation.
BenchmarkingthePerformanceofanVelosProMSEquippedwithTrapHCDAs noted above, precision and accuracy are the defining metrics for all quantitative analyses. However, an addition-al metric that must be considered is the dynamic range of quantitation within a single scan. This intra-scan dynamic range defines the limits of use for differential analysis of biologically relevant data. To examine precision, accuracy, and intra-scan dynamic range, TMT-labeled peptides were prepared in alternating ratios of 1:10 (Table 1) and analyzed under the optimal experimental conditions defined by the previous experiments (n=3). A global representation of the results, where results were averaged over all data sets and proteins, is given in Figure 4. For all but the 130/126 ratio, the error was less than 13%. The precision averaged around 6% across all data. A more biologically relevant representation of these metrics is the data for individual proteins (Table 2), as expression differences for individual proteins is most of interest to biologists. Since each protein-level metric is defined by the intrinsic peptide-level statistics, an examina-tion of peptide-level data is informative. A typical example
Table 1. Amounts of each reporter injected in optimization and benchmarking experiments.
fmolInjected
126 127 128 129 130 131
Equalmolar 500 500 500 500 500 500
1:10 Ratio 50 500 50 500 50 500
of peptide-level results is given for Human transferrin in Table 3. With the exception of the 130/126 ratio, the aver-age percent error was 13% (27% including the 130/126
ratio) or lower and the average %CV was 28%. The high error for 130/126 is due to unresolved 130.06 (tryptophan immonium ion) and 130.13 TMT reporter ion.
Figure 1. Proteome Discoverer software output for three replicate samples with alternating TMT tag ratios of 1:10. Graphical display of quantitation statistics and the reporter ion spectrum for the human transferrin peptide hSTIFFNLANk is displayed in the bottom portion.
Figure 2. Effect of collision energy on the quality of HCD MS/MS. A) number of unique peptides identified. B) average %CV for reporter ion ratios on the peptide level. C) total number of peptides identified.
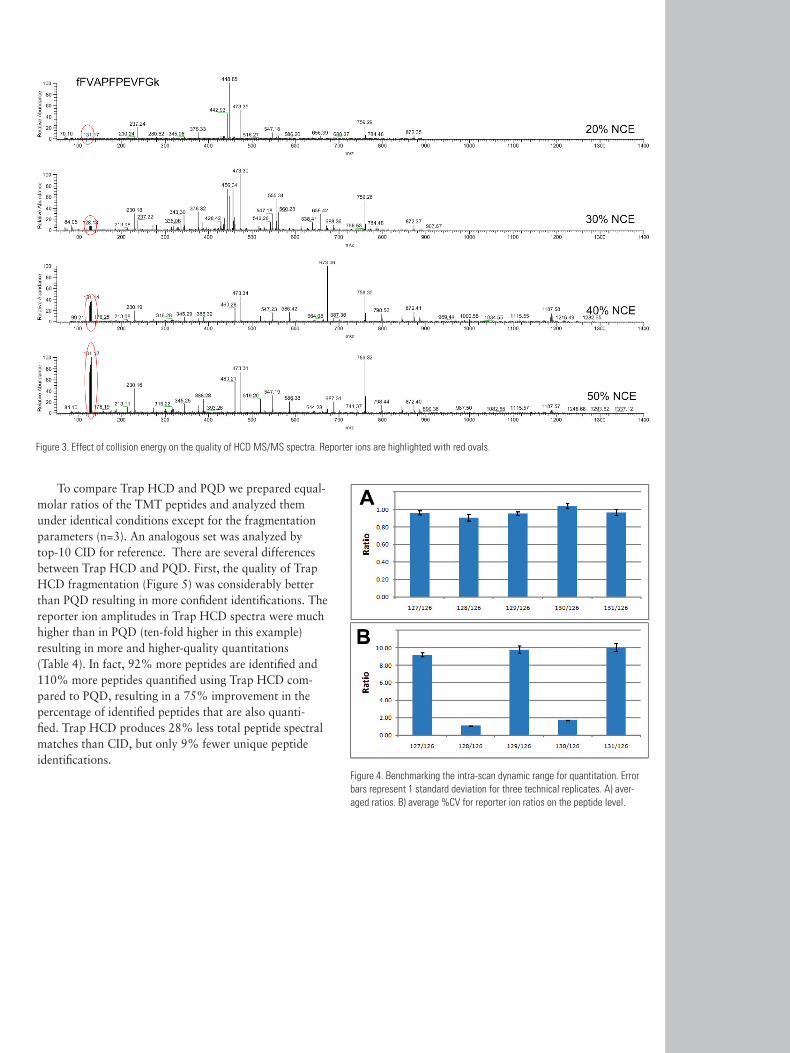
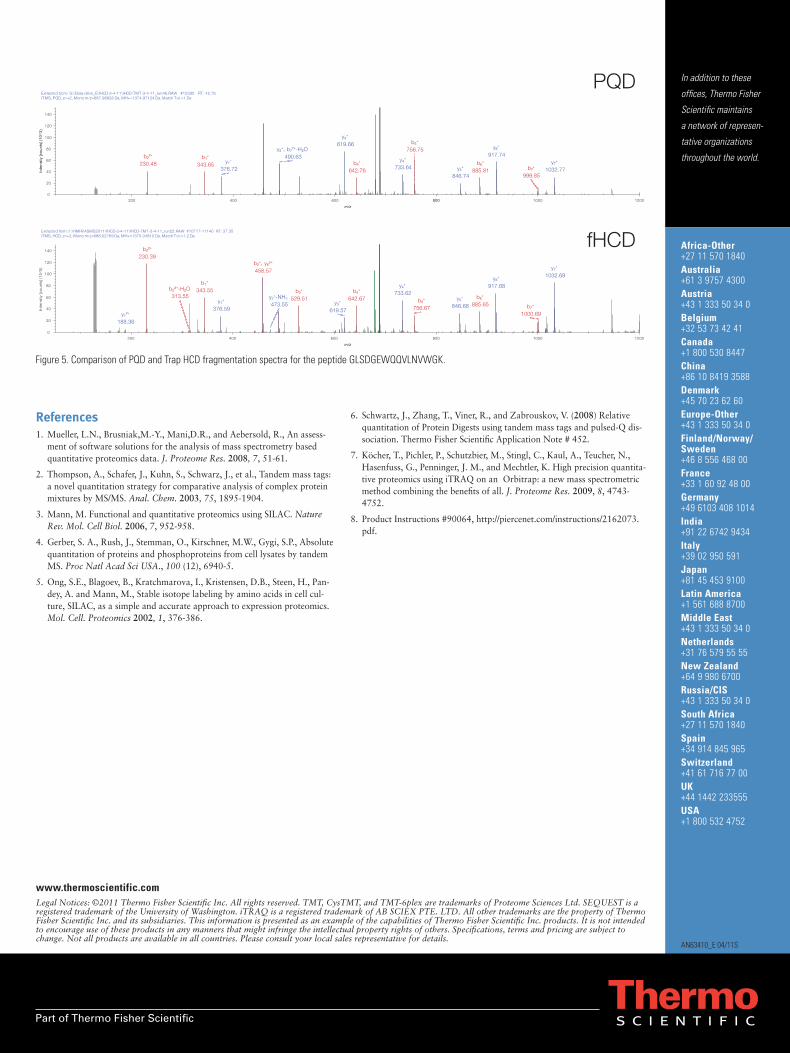
To compare Trap HCD and PQD we prepared equal-molar ratios of the TMT peptides and analyzed them under identical conditions except for the fragmentation parameters (n=3). An analogous set was analyzed by top-10 CID for reference. There are several differences between Trap HCD and PQD. First, the quality of Trap HCD fragmentation (Figure 5) was considerably better than PQD resulting in more confident identifications. The reporter ion amplitudes in Trap HCD spectra were much higher than in PQD (ten-fold higher in this example) resulting in more and higher-quality quantitations (Table 4). In fact, 92% more peptides are identified and 110% more peptides quantified using Trap HCD com-pared to PQD, resulting in a 75% improvement in the percentage of identified peptides that are also quanti-fied. Trap HCD produces 28% less total peptide spectral matches than CID, but only 9% fewer unique peptide identifications.
Figure 3. Effect of collision energy on the quality of HCD MS/MS spectra. Reporter ions are highlighted with red ovals.
Figure 4. Benchmarking the intra-scan dynamic range for quantitation. Error bars represent 1 standard deviation for three technical replicates. A) aver-aged ratios. B) average %CV for reporter ion ratios on the peptide level.
127/126 128/126 129/126 130/126 131/126 Avg.Ratio %Error %CV Avg.Ratio %Error %CV Avg.Ratio %Error %CV Avg.Ratio %Error %CV Avg.Ratio %Error %CV
Carbonic Anhydrase 9.1 -9.1 3.4 1.2 19.7 6.9 9.9 -0.9 1.6 1.7 67.6 2.7 9.9 -0.5 2.9
Alpha-casein 8.6 -14.1 9.0 1.1 6.6 6.8 9.3 -6.7 10.3 1.6 58.6 5.3 9.2 -8.0 6.8
Beta-Casein 8.6 -14.2 10.1 1.2 18.0 4.2 9.9 -1.5 10.9 1.7 75.0 2.7 9.8 -2.2 9.7
GAPDH 8.6 -13.8 9.4 1.1 5.5 4.7 9.2 -8.1 11.4 1.7 68.0 5.2 9.5 -4.7 14.1
Alpha-Lactalbumin 9.3 -7.0 8.0 1.3 32.1 9.8 10.6 5.8 3.5 2.0 96.7 6.6 10.9 8.5 13.3
Ovalbumin 9.0 -9.8 6.8 1.1 11.7 5.3 9.3 -7.1 8.5 1.7 70.2 1.1 9.7 -2.7 10.4
BSA 9.7 -2.9 4.9 1.0 -3.4 4.1 7.7 -22.7 11.9 1.4 44.0 5.6 8.1 -19.2 9.6
Myoglobin 9.3 -7.1 4.2 1.2 19.7 4.7 10.2 1.7 4.1 1.9 85.5 4.8 10.6 6.0 5.5
Cytochrome C 8.8 -11.7 7.2 1.1 9.2 8.6 9.5 -5.0 7.9 1.7 68.5 4.5 9.8 -1.6 7.9
Lysozyme 9.1 -9.0 3.2 1.2 18.2 12.3 10.0 -0.2 3.8 1.9 89.5 7.8 10.5 5.2 4.9
Beta-lactoglobin 9.3 -6.8 5.2 1.2 19.6 7.9 10.6 6.0 4.0 1.8 84.1 8.9 10.7 7.2 4.2
Transferrin 9.1 -8.9 5.6 1.1 13.1 1.6 10.1 0.7 4.4 1.8 75.8 2.1 10.2 2.3 4.4
Average 9.0 6.8† 6.4 1.1 12.1† 5.8 9.7 5.5† 6.9 1.7 72.2† 4.8 9.9 7.3† 7.8
Expected 10 1 10 1 10
fmol injected 500 50 500 50 500
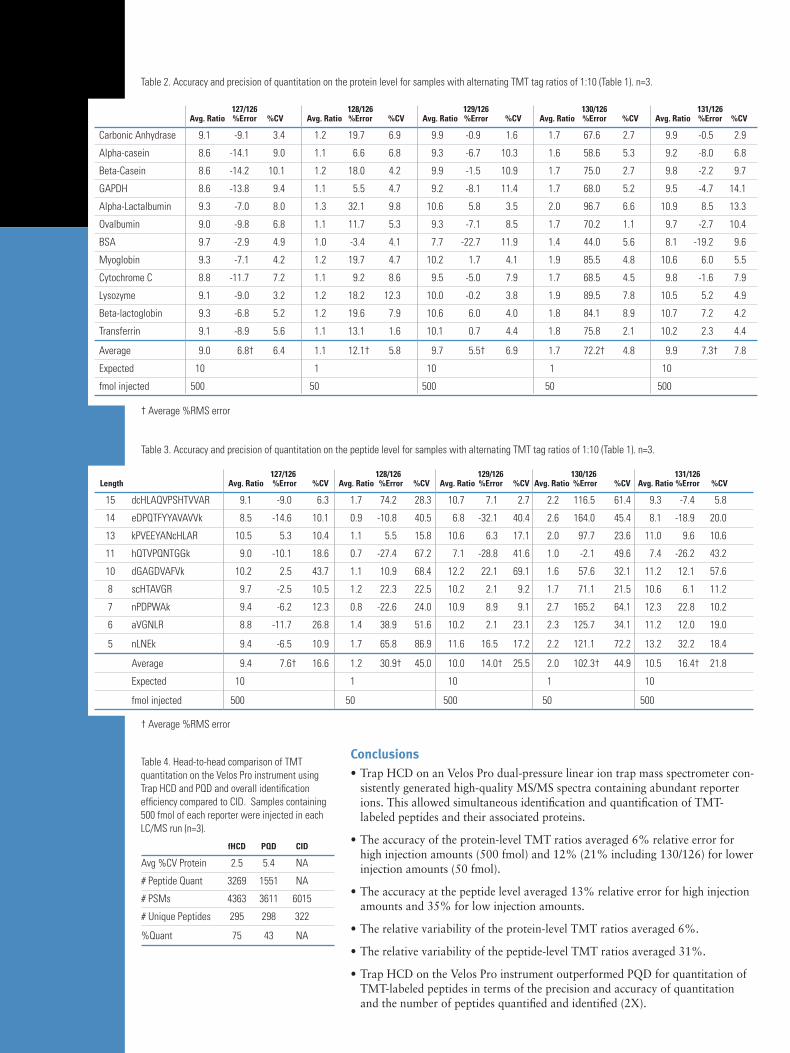
Table 2. Accuracy and precision of quantitation on the protein level for samples with alternating TMT tag ratios of 1:10 (Table 1). n=3.
127/126 128/126 129/126 130/126 131/126 Length Avg.Ratio %Error %CV Avg.Ratio %Error %CV Avg.Ratio %Error %CV Avg.Ratio %Error %CV Avg.Ratio%Error %CV
15 dcHLAQVPSHTVVAR 9.1 -9.0 6.3 1.7 74.2 28.3 10.7 7.1 2.7 2.2 116.5 61.4 9.3 -7.4 5.8
14 eDPQTFYYAVAVVk 8.5 -14.6 10.1 0.9 -10.8 40.5 6.8 -32.1 40.4 2.6 164.0 45.4 8.1 -18.9 20.0
13 kPVEEYANcHLAR 10.5 5.3 10.4 1.1 5.5 15.8 10.6 6.3 17.1 2.0 97.7 23.6 11.0 9.6 10.6
11 hQTVPQNTGGk 9.0 -10.1 18.6 0.7 -27.4 67.2 7.1 -28.8 41.6 1.0 -2.1 49.6 7.4 -26.2 43.2
10 dGAGDVAFVk 10.2 2.5 43.7 1.1 10.9 68.4 12.2 22.1 69.1 1.6 57.6 32.1 11.2 12.1 57.6
8 scHTAVGR 9.7 -2.5 10.5 1.2 22.3 22.5 10.2 2.1 9.2 1.7 71.1 21.5 10.6 6.1 11.2
7 nPDPWAk 9.4 -6.2 12.3 0.8 -22.6 24.0 10.9 8.9 9.1 2.7 165.2 64.1 12.3 22.8 10.2
6 aVGNLR 8.8 -11.7 26.8 1.4 38.9 51.6 10.2 2.1 23.1 2.3 125.7 34.1 11.2 12.0 19.0
5 nLNEk 9.4 -6.5 10.9 1.7 65.8 86.9 11.6 16.5 17.2 2.2 121.1 72.2 13.2 32.2 18.4
Average 9.4 7.6† 16.6 1.2 30.9† 45.0 10.0 14.0† 25.5 2.0 102.3† 44.9 10.5 16.4† 21.8
Expected 10 1 10 1 10
fmol injected 500 50 500 50 500
Table 3. Accuracy and precision of quantitation on the peptide level for samples with alternating TMT tag ratios of 1:10 (Table 1). n=3.
fHCD PQD CID
Avg %CV Protein 2.5 5.4 NA
# Peptide Quant 3269 1551 NA
# PSMs 4363 3611 6015
# Unique Peptides 295 298 322
%Quant 75 43 NA
Table 4. Head-to-head comparison of TMT quantitation on the Velos Pro instrument using Trap HCD and PQD and overall identification efficiency compared to CID. Samples containing 500 fmol of each reporter were injected in each LC/MS run (n=3).
Conclusions•TrapHCDonanVelosProdual-pressurelineariontrapmassspectrometercon-
sistently generated high-quality MS/MS spectra containing abundant reporter ions. This allowed simultaneous identification and quantification of TMT-labeled peptides and their associated proteins.
•Theaccuracyoftheprotein-levelTMTratiosaveraged6%relativeerrorforhigh injection amounts (500 fmol) and 12% (21% including 130/126) for lower injection amounts (50 fmol).
•Theaccuracyatthepeptidelevelaveraged13%relativeerrorforhighinjectionamounts and 35% for low injection amounts.
•Therelativevariabilityoftheprotein-levelTMTratiosaveraged6%.
•Therelativevariabilityofthepeptide-levelTMTratiosaveraged31%.
•TrapHCDontheVelosProinstrumentoutperformedPQDforquantitationofTMT-labeled peptides in terms of the precision and accuracy of quantitation and the number of peptides quantified and identified (2X).
† Average %RMS error
† Average %RMS error
Part of Thermo Fisher Scientific
www.thermoscientific.comLegal Notices: ©2011 Thermo Fisher Scientific Inc. All rights reserved. TMT, CysTMT, and TMT-6plex are trademarks of Proteome Sciences Ltd. SEQUEST is a registered trademark of the University of Washington. iTRAQ is a registered trademark of AB SCIEX PTE. LTD. All other trademarks are the property of Thermo Fisher Scientific Inc. and its subsidiaries. This information is presented as an example of the capabilities of Thermo Fisher Scientific Inc. products. It is not intended to encourage use of these products in any manners that might infringe the intellectual property rights of others. Specifications, terms and pricing are subject to change. Not all products are available in all countries. Please consult your local sales representative for details.
AN63410_E 04/11S
In addition to these
offices, Thermo Fisher
Scientific maintains
a network of represen
tative organizations
throughout the world.
Africa-Other +27 11 570 1840Australia +61 3 9757 4300Austria +43 1 333 50 34 0Belgium +32 53 73 42 41Canada +1 800 530 8447China +86 10 8419 3588Denmark +45 70 23 62 60 Europe-Other +43 1 333 50 34 0Finland/Norway/ Sweden +46 8 556 468 00France +33 1 60 92 48 00Germany +49 6103 408 1014India +91 22 6742 9434Italy +39 02 950 591Japan +81 45 453 9100LatinAmerica +1 561 688 8700MiddleEast +43 1 333 50 34 0Netherlands +31 76 579 55 55NewZealand +64 9 980 6700Russia/CIS +43 1 333 50 34 0SouthAfrica +27 11 570 1840Spain +34 914 845 965Switzerland +41 61 716 77 00UK +44 1442 233555USA +1 800 532 4752
Figure 5. Comparison of PQD and Trap HCD fragmentation spectra for the peptide GLSDGEWQQVLNVWGK.
References1. Mueller, L.N., Brusniak,M.-Y., Mani,D.R., and Aebersold, R., An assess-
ment of software solutions for the analysis of mass spectrometry based quantitative proteomics data. J. Proteome Res. 2008, 7, 51-61.
2. Thompson, A., Schafer, J., Kuhn, S., Schwarz, J., et al., Tandem mass tags: a novel quantitation strategy for comparative analysis of complex protein mixtures by MS/MS. Anal. Chem. 2003, 75, 1895-1904.
3. Mann, M. Functional and quantitative proteomics using SILAC. Nature Rev. Mol. Cell Biol. 2006, 7, 952-958.
4. Gerber, S. A., Rush, J., Stemman, O., Kirschner, M.W., Gygi, S.P., Absolute quantitation of proteins and phosphoproteins from cell lysates by tandem MS. Proc Natl Acad Sci USA., 100 (12), 6940-5.
5. Ong, S.E., Blagoev, B., Kratchmarova, I., Kristensen, D.B., Steen, H., Pan-dey, A. and Mann, M., Stable isotope labeling by amino acids in cell cul-ture, SILAC, as a simple and accurate approach to expression proteomics. Mol. Cell. Proteomics 2002, 1, 376-386.
6. Schwartz, J., Zhang, T., Viner, R., and Zabrouskov, V. (2008) Relative quantitation of Protein Digests using tandem mass tags and pulsed-Q dis-sociation. Thermo Fisher Scientific Application Note # 452.
7. Köcher, T., Pichler, P., Schutzbier, M., Stingl, C., Kaul, A., Teucher, N., Hasenfuss, G., Penninger, J. M., and Mechtler, K. High precision quantita-tive proteomics using iTRAQ on an Orbitrap: a new mass spectrometric method combining the benefits of all. J. Proteome Res. 2009, 8, 4743-4752.
8. Product Instructions #90064, http://piercenet.com/instructions/2162073.pdf.
800
b2²+-H2O313.55 y2
+-NH3
473.55
y12+
188.36
b7+
1000.69
y3+
619.57
y1+
376.59
b5+
756.67
y5+
846.68
b6+
885.65
b4+
642.67b3
+
529.51
y4+
733.62
b1+
343.55
y6+
917.68
y7+
1032.69
b2+, y6²+
458.57
b2²+
230.39
200 400 600 800 1000 1200
m/z
0
20
40
60
80
100
120
140
Extracted from: F:\HMRI\ASMS2011\fHCD-3-4-11\fHCD-TMT-3-4-11_run22.RAW #10717-11140 RT: 37.35 ITMS, HCD, z=+2, Mono m/z=688.02769 Da, MH+=1375.04810 Da, Match Tol.=1.2 Da
b7+
999.85
b5+
756.75
y5+
846.74
b6+
885.81b4
+
642.76
y7+
1032.77
y1+
376.72
y4+
733.64
b1+
343.65
b22+
230.48
y2+, b7
2+-H2O490.63
y6+
917.74
y3+
619.66
200 400 600 1000 1200
m/z
0
20
40
60
80
100
120
140
Extracted from: G:\Data-drive_E\fHCD-3-4-11\fHCD-TMT-3-4-11_run46.RAW #12390 RT: 42.76 ITMS, PQD, z=+2, Mono m/z=687.98926 Da, MH+=1374.97124 Da, Match Tol.=1 Da
Inte
nsi
ty [
cou
nts
] (1
03̂
)In
ten
sity
[co
un
ts]
(10
^3)
PQD
fHCD