quantitation of human milk proteins and their...
TRANSCRIPT
RESEARCH PAPER
Quantitation of human milk proteins and their glycoforms usingmultiple reaction monitoring (MRM)
Jincui Huang1,2 & Muchena J. Kailemia1 & Elisha Goonatilleke1 & Evan A. Parker1 &
Qiuting Hong1,2 & Rocchina Sabia3 & Jennifer T. Smilowitz2,4 & J. Bruce German2,4&
Carlito B. Lebrilla1,2
Received: 28 June 2016 /Revised: 26 September 2016 /Accepted: 11 October 2016 /Published online: 29 October 2016# Springer-Verlag Berlin Heidelberg 2016
Abstract Human milk plays a substantial role in the childgrowth, development and determines their nutritional andhealth status. Despite the importance of the proteins andglycoproteins in human milk, very little quantitative informa-tion especially on their site-specific glycosylation is known.As more functions of milk proteins and other componentscontinue to emerge, their fine-detailed quantitative informa-tion is becoming a key factor in milk research efforts. Thepresent work utilizes a sensitive label-free MRM method toquantify seven milk proteins (α-lactalbumin, lactoferrin, se-cretory immunoglobulin A, immunoglobulin G, immunoglob-ulin M, α1-antitrypsin, and lysozyme) using their unique pep-tides while at the same time, quantifying their site-specific N-glycosylation relative to the protein abundance. The method ishighly reproducible, has low limit of quantitation, and ac-counts for differences in glycosylation due to variations inprotein amounts. The method described here expands our
knowledge about human milk proteins and provides vital de-tails that could be used in monitoring the health of the infantand even the mother.
Keywords Humanmilk .MRM .Glycoproteomics . UPLC .
Mass spectrometry
Introduction
Human milk contains abundant biologically active compo-nents, including proteins, endogenous peptides, lipids, carbo-hydrates, and minerals, which contribute to the nutritional andphysiological wellbeing of newborns [1–7]. Human milk pro-teins provide primary nutrients for the infant and also protectthem against infections via antimicrobial and immune-modulatory activities that helps build immunity of thebreast-fed infant [8, 9]. Accurate and sensitive quantitationof human milk proteins is expected to contribute to our under-standing of the milk biogenesis and their benefits to theneonates.
The vast majority of human milk proteins are glycosylated.It has been reported that glycosylation helps to reduce thenumber of pathogenic infections and promotes the develop-ment of the intestinal epithelium [7, 10]. Glycosylation is acommon but complicated protein post-translational modifica-tion (PTM). It plays key roles in many biological functions,such as stabilizing the glycoprotein structure, mediating cellsignaling and cell–cell recognition events, and modulatingmicrobial adhesion and invasion during infection [11–14].
α-Lactalbumin (α-Lact) is one of the most abundant pro-teins in milk. Proteolytic fragments of α-Lact have prebioticproperties useful in stimulating the growth of beneficial bac-teria besides its well-known roles in lactose biosynthesis [15,16]. Lactoferrin (LF) is a major glycoprotein in human milk
Published in the topical collection Glycomics, Glycoproteomics andAllied Topics with guest editors Yehia Mechref and David Muddiman.
Electronic supplementary material The online version of this article(doi:10.1007/s00216-016-0029-4) contains supplementary material,which is available to authorized users.
* Carlito B. [email protected]
1 Department of Chemistry, University of California,Davis, CA 95616, USA
2 Foods for Health Institute, University of California, 1 Shields Ave,Davis, CA 95616, USA
3 Department of Drug Chemistry and Technologies, University ofRome, Piazzale Aldo Moro 5, 00185 Rome, Italy
4 Department of Food Science and Technology, University ofCalifornia, 392 Old Davis Road, Davis, CA 95616, USA
Anal Bioanal Chem (2017) 409:589–606DOI 10.1007/s00216-016-0029-4
with several physiological functions including bacteriostatic,antiviral, and antibacterial [4, 7–9]. The dominant antibody inhuman milk, secretory immunoglobulin A (sIgA), has immu-nological properties and anti-pathogenic activities [17]. It isknown that glycans on sIgA bind to pathogens that threatenthe health of the newborns [18–20]. Besides sIgA, there areother immunoglobulins in human milk that are also glycosyl-ated such as immunoglobulin G (IgG) and immunoglobulinM(IgM). α1-Antitrypsin (A1AT), with three N-glycosites, ispresent in human milk as a protease inhibitor. It is believedthat A1AT can help limit protein digestion during early infan-cy when its concentration is relative high. As a result, A1ATcan also facilitate the action of other bioactive proteins [21,22]. Lysozyme (LZ), while not glycosylated, is another pro-tective milk protein. It is an enzyme that breaks β1,4 bondsbetween GlcNAc residues, thus playing a key role in the de-fense of mucus membrane against infections [23].
Despite the numerous studies on milk proteins, nutritiveand protective functions, their simultaneous quantitation hasnot been performed nor has the extent of their glycosylationlevel been fully characterized. The analytical methods avail-able for the determination of milk protein concentration in-clude gel electrophoresis [24], capillary electrophoresis [6,25], liquid chromatography [26], and immunological tech-niques [27–29]. However, these methods are less accurate,less reproducible, and sample processing procedures are labo-rious and time-consuming. Multiple reaction monitoring(MRM) technology has found utility in the quantitation ofproteins in complex mixtures [30–32]. Its remarkable sensi-tivity and selectivity enable the detection and quantification oflow abundant substances in complex mixtures. Quantitativeprotein assays have been developed with targeted MRMmethods to analyze protein concentrations in human plasma[33], human serum [34], and bovine milk [35]. However,MRM has not been used to monitor multiple proteins in hu-man milk simultaneously. Our group has recently reported anovel MRM method for quantifying serum IgG and itsglycoforms simultaneously [36]. This method yields both pro-tein concentration and site-specific glycosylation quantitationin a single experiment, thereby enabling unprecedented in-sight into glycosylation.
In this study, we employ the power of MRM, for the firsttime, to obtain label-free quantitation of the seven most abun-dant whey proteins: α-lactalbumin, lactoferrin, secretory im-munoglobulin A (slGA), immunoglobulin G (IgG), immuno-globulin M (IgM), α1-antitrypsin (A1AT), and lysozyme(LZ). By quantifying unique peptides from each protein, weachieved high reproducibility and low limits of quantitation(LOQ). Furthermore, the site-specific glycosylation of fiveglycoproteins (LF, sIgA, IgG, IgM, and A1AT) were deter-mined. Quantitation of the glycoforms was performed by nor-malizing glycopeptides MS response to the protein abun-dances. This approach removes the contribution of protein
concentration to glycan abundances and allows for the simul-taneous monitoring of glycosylation across several proteinsand several sites. The analytical platform was tested for itsreproducibility and LOQ in a 96-well plate format. The studyprovides the foundation of a general method for the rapid-throughput analysis with quantitation of human milk proteinsand their glycoforms. The method can be used to profile thechanges in levels of proteins and glycosylation between milksamples.
Experimental procedures
Materials and chemicals
Analytical standards including human milk proteins IgG, LF,α-Lact, IgM, sIgA, and A1AT from human plasma were pur-chased from Sigma-Aldrich (St. Louis, MO). Human neutro-phil lysozyme was purchased from Lee Biosolutions (St.Louis, MO). Human IgA was purchased from Calbiochem(Chicago, IL). Sequencing grade modified trypsin (Cat.#V5111) and dithiothreitol (DTT) were purchased fromPromega (Madison, WI). Iodoacetamide (IAA) CAS 74-88-4 was purchased from Sigma-Aldrich (St. Louis, MO).
Human milk samples
Milk samples were collected from three healthy donors en-rolled in the UCDavis Lactation Study who gave birth to terminfants (>38 weeks). Milk samples were collected on day 28–30 postpartum from one breast and transferred into polypro-pylene Falcon tubes and frozen immediately in their kitchenfreezers (−20 °C) until weekly sample pick up by the studystaff. Samples were transported to the lab on dry ice and storedin −80 °C until processing.
Tryptic digestion
Trypsin digestion was first carried out on the seven individualprotein standards to profile their peptides and glycopeptides.A 50-μg sample of each protein was dissolved/diluted with50 mMNH4HCO3 prior to reduction and alkylation with 2 μLof 550 mM dithiothreitol (DTT) (60 °C, 50 min) and 4 μL of450 mM iodoacetamide (IAA) (1 h, in dark) respectively.Then, 1 μg of trypsin in 10 μL of 50 mM NH4HCO3 wasadded, and each protein was digested in a 37 °C water bathfor 18 h. The resulting peptide samples were used directly forQ-TOFmass spectrometry (MS) analysis without further sam-ple cleanup.
For rapid throughput quantitation, accurate amounts of pro-tein standards (LF, α-Lact, IgG, and A1AT) were weighedusing a micro-balance (Mettler Toledo, XP26) and dissolvedin 50 mM NH4HCO3 to make 4 mg/mL stock solution. A
590 J. Huang et al.
50-μL LF stock solution, 50-μL α-Lact, 5-μL A1AT, and5-μL IgG stock solution were combined to make the standardprotein mixture. A 100-μg sample of IgA (62.5 μL conc.1.6 mg/mL), 20 μg of IgM (18.2 μL conc. 1.1 mg/mL), and20 μg (18.2 μL conc. 1.1 mg/mL) of LZ solution were thenadded into the previous solution to make the final standardprotein mixture. The standard protein mixture (∼209 μL) wastransferred to a single well in a 96-well plate. For tryptic di-gestion, 175 μL of 50 mM NH4HCO3 was added to 25 μL ofwhole milk in the same 96-well plate with the standard proteinmixture. The milk samples and standard mixtures were re-duced with 2 and 4 μL of 550 mM dithiothreitol (DTT)followed by incubation for 50 min at 60 °C. A 4 and 8-μL450 mM iodoacetamide (IAA) was then added to the milksamples and the standard mix, respectively, followed bycarboxymethylation by incubation for 60 min at room temper-ature in the dark. Two micrograms of trypsin in 20 μL of50 mM NH4HCO3 was added to the samples, prior to thedigestion for 18 h at 37 °C in an incubator (Fisher Scientific,Pittsburgh, PA).
The digests were purified on C18 96-well cartridge plate(Glygen, Columbia, MD). The C18 plate was preconditionedsuccessively with two volumes (200 μL for each volume) ofpure water in 0.1 % TFA, two volumes of 100 % acetonitrile(ACN), and three volume of pure water in 0.1 % TFA, byadding each solvent and centrifuging the plate in Eppendorf5810R centrifuge (Eppendorf, Hauppauge, NY) at 1700 rpmin room temperature. The tryptic digests were loaded on theplate and then washed with three volumes of pure water in0.1 % TFA by centrifugation, prior to eluting with two vol-umes of 40 % ACN in 0.1 % TFA and one column of 80 %ACN in 0.1 % TFA and dried to completion.
Instrumentation
A nano-HPLC-Chip Q-TOF instrument using the Agilent1200 series microwell-plate autosampler (maintained at 6 °Cby the thermostat), capillary pump, nano pump, HPLC-Chipinterface, and the Agilent 6520 Q-TOF MS (AgilentTechnologies, Inc., Santa Clara, CA) were used in this study.
For the peptides and glycopeptides, a reverse-phase nano-HPLC Chip (G4240-62001, Agilent Technologies, Inc., SantaClara, CA) with a 40-nL enrichment column and43 × 0.075 mm ID analytical column was used. The columnwas packed with ZORBAX C18 (5 μm pore size) stationaryphase. The mobile phase for tryptic peptides consisted of0.1 % formic acid in 3 % ACN in water (v/v) as solvent Aand 0.1 % formic acid in 90 % ACN in water (v/v) as solventB. The nano pump gradient was performed on the analyticalcolumn to separate the tryptic peptides with a flowrate at0.4 μL /min. The peptides were eluted in 60 min with thefollowing gradient: 3 % B (0.00–2.50 min), 3 to 16 % B(2.50–20.00 min), 16 to 44 % B (20.00–30.00 min), 44 to
100 % B (30.00–35.00 min), and 100 % B (35.00–45.00 min) and re-equilibrated at 3 % B from 45.01 to 60 min.
The Agilent 6520 Q-TOF MS was operated in the positiveion mode for MS and MS/MS of the tryptic peptides. Therecorded mass ranges were m/z 500–3000 for MS only andm/z 50–3000 for MS/MS. Acquisition rates were 7.99 spectra/s for MS scan and 3 spectra/s for MS/MS scan. The drying gastemperature was set at 325 °C with a flow rate of 4 L/min. Allmass spectra were internally calibrated using the G1969-85000 ESI tuning mix (Agilent Technologies, Inc., SantaClara, CA), with reference masses at m/z 922.010, and1521.971 in the positive ion mode. In MS/MS mode, the col-lision energies for the tryptic peptides were calculated as fol-lows:
V collision eVð Þ ¼ 3:6m=z
100Da
� �−4:8
The peptide samples were analyzed and quantified usingan Agilent 1290 infinity LC system coupled to an Agilent6490 triple quadrupole mass spectrometer (AgilentTechnologies, Santa Clara, CA) using a 96-well injectionplate (Eppendorf, Hauppauge, NY). An Agilent Eclipseplus C18 (RRHD 1.8 μm, 2.1 x 100 mm) was used forUPLC separation.
The standard protein mix was diluted serially in nano purewater to obtain a calibration curve for protein quantitation.The human milk samples were reconstituted with 100 μLnano pure water. A 1.0-μL sample was injected for each run.Three replicate injections were performed for each proteinstandard mix to evaluate the instrument repeatability. Onenano pure water blank was run after every four sample runsto observe potential carry overs.
The mobile phase for tryptic peptides consisted of 0.1 %formic acid in 3 % ACN in water (v/v) as solvent A and 0.1 %formic acid in 90 % ACN in water (v/v) as solvent B. The 16-min gradient was as follows: 0 min at 2.0 % B, 1.5 min at15.0 % B, 3 min at 25 % B, 4 min at 30 % B until 7 min,10 min at 35 % B, 11 min at 40 % B, and 12 min at 100 % B;the column was washed at 100 % B from 12.1 to 14 min andre-equilibrated at 2.0 % B from 14.1 to 16 min.
The MS was operated in the positive mode. Q1 and Q3were operated at unit resolution. The optimal parameters usedwere as follows: drying gas (N2) temperature and sheath gas(N2) temperature 290 °C, drying gas flow rate 11 L/min,sheath gas flow rate 12 L/min, nebulizer pressure 30 psi, cap-illary voltage 1800 V, and fragmentor voltage 280 V. RF volt-age amplitude of high pressure and low pressure ion funnelwere 100 and 60 V, respectively.
The dynamic MRM mode was used, whereby the transi-tions were monitored only when the target analyte was eluted.The cycle time was fixed at 500 ms, while the dwell timedepended on the number of concurrent transitions monitored.
Quantitation of human milk proteins and glycoproteins 591
The MRM results were analyzed using AgilentMassHunter Quantitative Analysis B.6.0 software. The peakareas were integrated by the software and used for quantita-tion. The limit of detection (LOD) and limit of quantitation(LOQ) were defined as S/N ≥3 and 10, respectively.
Data processing
Tryptic peptide MS/MS data from Q-TOF MS were analyzedusing X! Tandem (www.thegpm.org). X! Tandem was set tosearch the Swissprot human proteome database. X! Tandemwas searched with a fragment ion mass tolerance of 80 ppmand a parent ion tolerance of 100 ppm with one trypsin missedcleavages allowed. Iodoacetamide derivative of cysteine wasspecified in X! Tandem as a fixed modification. Deaminationof asparagine and glutamine, oxidation of methionine, andtryptophan were specified in X! Tandem as variablemodifications. Peptides for each protein in the standardprotein mix were selected based on the peptide profile.Glycopeptide identification from glycoproteins (LF, sIgA,IgG, IgM, and antitrypsin) was performed using in-house soft-ware, GPFinder. Carbohydrate oxonium ions, such as, m/z204.08 (HexNAc), m/z 366.14 (Hex1HexNAc1), m/z 292.09(Neu5Ac), and m/z 657.24 (Hex1HexNAc1Neu5Ac1) wereused as diagnostic fragments for glycopeptides. The glyco-peptide compositions were assigned on the basis of their exactmass and the fragmentation pattern.
Results and discussion
Peptide and glycopeptide profiling
Standard LF, α-Lact, sIgA, IgG, IgM, A1AT, and LZ weredigested using trypsin prior to the analysis with LC-Q-TOFMS/MS to evaluate the fragmentation behavior of the respec-tive peptides and glycopeptides. During the protein digestion,DTTwas used to reduce the cysteine disulfide bonds. The free–SH groups were subsequently alkylated using IAA to pre-vent them from reforming. All the observed cysteine residueswere Carbamidomethylated. Our group has reported the pep-tide selection for quantitation of serum IgG [36]. fA similarstrategy was applied for the other six proteins in milk.However, the predominant immunoglobulin in breast milk,sIgA, is a protein complex consisting of two identical IgAmonomers (IgA1 or IgA2), joined together via a 16-kDa jointchain (J chain), and a secretory component (SC). It is notpossible to find a common peptide for all the four polypep-tides; therefore, quantitation was not possible for sIgA.Instead, IgA standard was used to obtain IgA concentrationin human milk. The tryptic peptides YLTWASR andVAAEDWK, which are common to both IgA1 and IgA2,were selected for quantitation of IgA. In Fig. S1a (see
Electronic Supplementary Material, ESM), the MSMS spec-trum of the tryptic peptide YLTWASR is shown, thereby il-lustrating the abundances of b- and y-ions. Abundant b- and/or y-ions were selected for the MRM analysis. PeptidesTPLTATLSK for IgA1, DASGATFTWTPSSGK for IgA2,GSVTFHCALGPEVANVAK for SC, and IIVPLNNR forthe J chain were used for glycosylation quantitation. The tan-dem mass spectra of the SC and J chain peptides are shown inFig. S1b and S1c (see ESM).
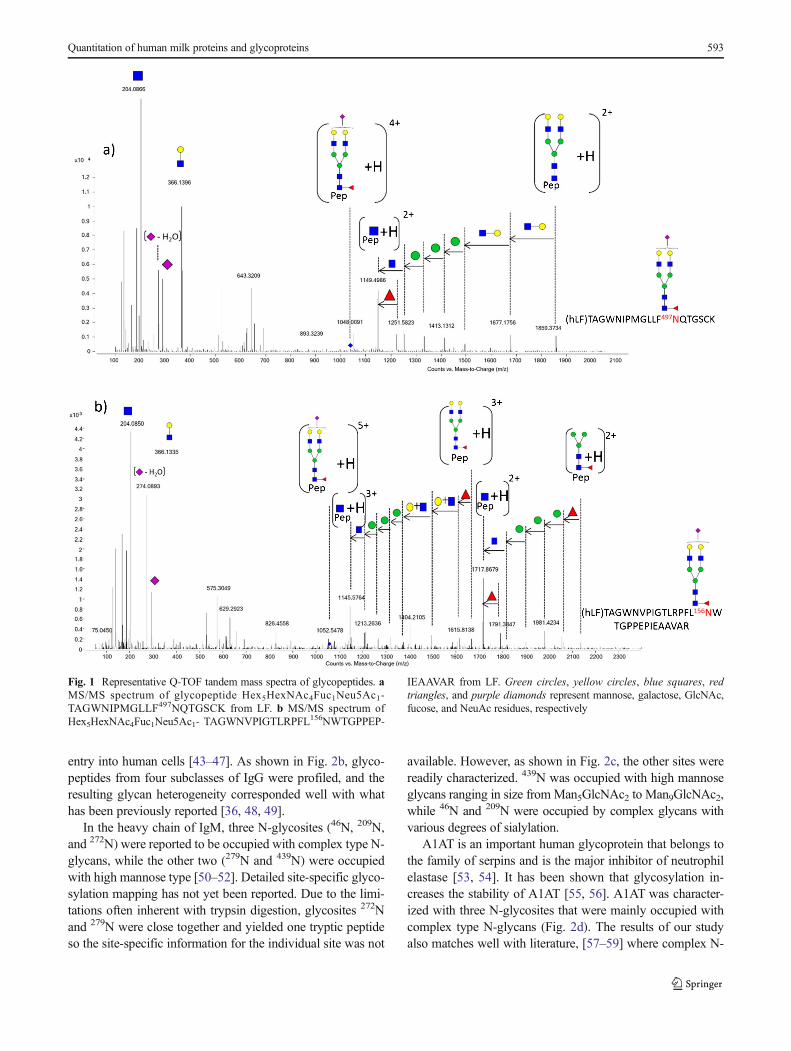
Compositions of glycopeptides obtained from trypsin di-gestion were assigned based on the MS/MS data and the ac-curate precursor ionmassmeasurement. Previous studies fromour group on the analysis of tryptic glycopeptides withcollision-induced dissociation (CID) experiments revealed de-tailed and comprehensive glycan compositional informationfor IgG subclasses [36]. Glycosidic bond cleavages (B- and Y-type ions) were the major products including m/z 292.09(Neu5Ac), 274.08 (Neu5Ac–H2O), 204.08 (HexNAc),366.14 (Hex+HexNAc), and 657.24 (Hex+HexNAc+Neu5Ac). Tandem spectra of glycopeptides from two N-glycosites of LF with the same glycan composition aredepicted in Fig. 1a, b. Due to the labile nature of sialic acidresidues and their positions at the terminus, the initial loss ofsialic acid was commonly observed with the sialylated glyco-peptides. Following the sequential neutral losses of Neu5Ac,Hex and HexNAc loss leads to the glycopeptide fragment(peptide+HexNAc). The presence of the peptide+HexNAc isvaluable for validating the assignment of parent glycopeptide[37, 38]. Glycopeptides from each glycoprotein were exam-ined in the similar manner, thereby revealing the site-specificglycosyation with trypsin digestion.
Figure 2 shows the site heterogeneity of the five glycopro-teins (LF, IgG, IgM, A1AT, and sIgA). LF is an abundant milkglycoprotein with three potential glycosylation sites, of whichtwo sites are highly occupied (156N and 497N) while a third site(642N) is rarely occupied [39, 40]. LF has long been imbuedwith the role of bacterial defense by acting as decoys andoccupying binding sites on bacteria, thereby prohibiting themfrom binding to host cells [39–42]. Less known are the roles ofglycosylation in this function. Previous binding studies ofbacteria to host epithelial cells in our lab show that LF blocksthe binding of pathogens to host cells [7]. For example, cleav-ing all the N-glycans diminishes its ability to blockEscherichia coli. Removing fucose increases the ability ofSalmonella typhimurium to bind to epithelial cells while re-moving sialic acid increases the ability of Salmonellaenteritidis to adhere to host cells. The efficacy of LF is medi-ated by specific glycan structures. However, the site-specificglycosylation of LF was still not fully elucidated. Here inFig. 2a, glycan site heterogeneity of LF is shown. The twomajor N-glycosites were characterized with mainly sialylatedglycans, which most times may act as receptors for manyviruses and pathogenic bacteria, enabling the viruses to gain
592 J. Huang et al.
entry into human cells [43–47]. As shown in Fig. 2b, glyco-peptides from four subclasses of IgG were profiled, and theresulting glycan heterogeneity corresponded well with whathas been previously reported [36, 48, 49].
In the heavy chain of IgM, three N-glycosites (46N, 209N,and 272N) were reported to be occupied with complex type N-glycans, while the other two (279N and 439N) were occupiedwith high mannose type [50–52]. Detailed site-specific glyco-sylation mapping has not yet been reported. Due to the limi-tations often inherent with trypsin digestion, glycosites 272Nand 279N were close together and yielded one tryptic peptideso the site-specific information for the individual site was not
available. However, as shown in Fig. 2c, the other sites werereadily characterized. 439N was occupied with high mannoseglycans ranging in size from Man5GlcNAc2 to Man9GlcNAc2,while 46N and 209N were occupied by complex glycans withvarious degrees of sialylation.
A1AT is an important human glycoprotein that belongs tothe family of serpins and is the major inhibitor of neutrophilelastase [53, 54]. It has been shown that glycosylation in-creases the stability of A1AT [55, 56]. A1AT was character-ized with three N-glycosites that were mainly occupied withcomplex type N-glycans (Fig. 2d). The results of our studyalso matches well with literature, [57–59] where complex N-
Fig. 1 Representative Q-TOF tandem mass spectra of glycopeptides. aMS/MS spectrum of glycopeptide Hex5HexNAc4Fuc1Neu5Ac1-TAGWNIPMGLLF497NQTGSCK from LF. b MS/MS spectrum ofHex5HexNAc4Fuc1Neu5Ac1- TAGWNVPIGTLRPFL156NWTGPPEP-
IEAAVAR from LF. Green circles, yellow circles, blue squares, redtriangles, and purple diamonds represent mannose, galactose, GlcNAc,fucose, and NeuAc residues, respectively
Quantitation of human milk proteins and glycoproteins 593
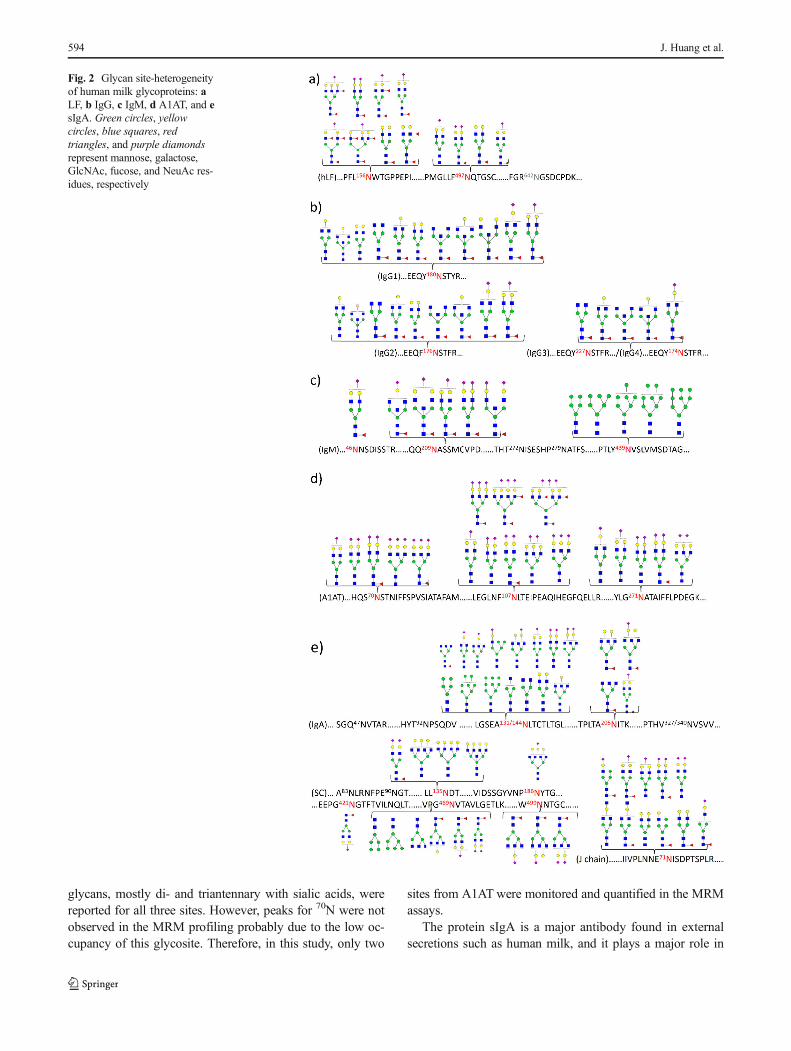
glycans, mostly di- and triantennary with sialic acids, werereported for all three sites. However, peaks for 70N were notobserved in the MRM profiling probably due to the low oc-cupancy of this glycosite. Therefore, in this study, only two
sites from A1ATwere monitored and quantified in the MRMassays.
The protein sIgA is a major antibody found in externalsecretions such as human milk, and it plays a major role in
Fig. 2 Glycan site-heterogeneityof human milk glycoproteins: aLF, b IgG, c IgM, d A1AT, and esIgA. Green circles, yellowcircles, blue squares, redtriangles, and purple diamondsrepresent mannose, galactose,GlcNAc, fucose, and NeuAc res-idues, respectively
594 J. Huang et al.
the protection of mucosal surfaces [60, 61]. In Fig. 2e, the site-specific glycosylation was determined using trypsin digestionfor each component of sIgA including the secretory compo-nent, IgA1, IgA2, and the J chain. Due to either the resistanceof many glycoproteins to undergo tryptic digestion or the rel-atively large size of glycopeptides, glycans at several siteswere not observed. The results obtained with the trypsin,while incomplete matched well with those using non-specific proteases. Furthermore, the goal of this study was toquantify the proteins and their glycoforms; therefore, the morespecific protease trypsin was selected and characterized toyield reproducible glycopeptides.
Configuration and Optimization of MRM Assay
The main concern with using QqQ mass spectrometers fortargeted analysis is the low mass selection resolution thatmay cause interference by other ions particularly in a compli-cated matrix such as milk [32]. To reduce the chances ofpotential interferences, two peptides for each protein wereselected to increase specificity and selectivity of the quantita-tive assay in human milk. The selection for peptides followedseveral rules that have been discussed in a recent study fromour laboratory [36]. Firstly, the selected peptides should beunique to the protein and unmodified by other PTMs, suchas deamination and oxidation. Secondly, two peptides fromeach protein are chosen for quantitation in MRM. The excep-tion of the second rule was LZ where the short length yieldedonly one peptide with no potential PTMs.
MRM transitions were optimized for these peptides fortheir quantifier, qualifier, retention time, and collision energy.For IgG and sIgA, the peptides common to all four IgG sub-types and to both IgA1/IgA2 were selected for overall quan-titation. For example, the quasimolecular ion ([M + 2H]2+m/z409.7) for the IgA1/2 peptide VAAEDWKwas selected as theprecursor ion, while m/z 648.3 was selected as the fragmention. Additionally, a second transition from the same precursorion to fragment ion m/z 719.4 was used as qualifier. It isunlikely that an interference may share both quantifier andqualifier, giving the method high specificity and selectivitywith the targeted peptides. A dynamic MRM method wasapplied to specifically monitor one analyte at a time, whichreduced the number of concurrent transitions. The retentiontime for the above peptide was determined to be 2 min, and theoptimized fragmentation voltage was 9 eV. Every MRM tran-sition was optimized with a specific retention time to reducethe duty cycle. Summarized in Table 1a are the transitions forall peptides monitored with their precursor mass, productmass, retention time, and fragmentation voltage.
Reproducibility of the selected peptides was determined byrelative standard deviation (RSD) of the peak areas based ontriplicates performed on different days (Table 1a). The RSD
were generally below 10 % illustrating the high repeatabilityof the method.
As shown in Fig. 1, oxonium ions corresponding to smallglycan fragments m/z 204.08 (HexNAc) and m/z 366.14 (Hex+HexNAc)were abundant and therefore chosen as the product ionfor most of the glycopeptide MRM transitions. However, forsome of the high mannose-containing glycopeptides, the frag-ment peptide+HexNAc was found to yield better responses. Forexample, for the site 439N of IgM,which contains primarily high-mannose type N-glycans, the product ion selected correpondedto m/z 1284.7 (STGKPTLY439NVSLVMSDTAGTCY+HexNAc). Listed in Table 1b are the glycopeptides from the fiveglycoproteins discussed above including more than 100 glyco-peptides. It should be noted that the retention times of the gly-copeptides on C18 stationary phases rely mainly on the peptidemoiety of the glycoconjugates. Therefore, glycopeptides thatoriginate from the same site and thus share the same peptidegenerally elute closely together. Due to the limitations in dutycycles, one transition was selected for each glycopeptide moni-tored. Dynamic MRM help reduced the effects of co-elution ofthe glycopeptides and increased the sensitivity of the analysis.
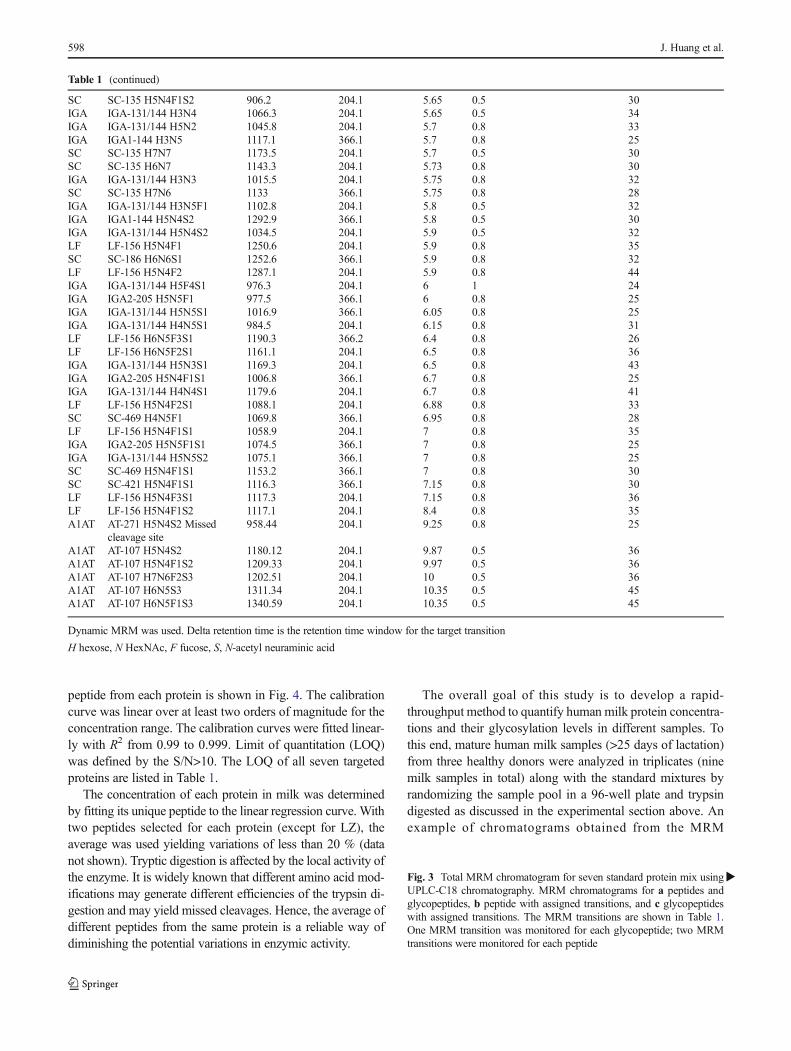
An example chromatogram obtained from the MRM tran-sitions of the standard protein mixture is shown in Fig. 3.Good separation was obtained within the 16 min UPLC gra-dient. Most of the glycopeptides eluted after 4 min while thenonglycosylated peptides eluted between 2 and 4 min(Fig. 3a). This difference fortunately reduced the charge com-petition during electrospray ionization resulting in higher gly-copeptide sensitivity because peptides ionize more readilythan glycopeptides.[62–64] Due to the ionization differences,the peptides MS signal (shown in black in Fig. 3a) are signif-icantly higher than the glycopeptides MS signal. Good sepa-ration between the peptides and glycopeptides is critical forMRMof glycopeptides. Peptide peaks from the seven proteinsand glycopeptide peaks from the five glycoproteins are shownin Fig. 3b, c, respectively. This method provides a general andsensitive analysis that can be used for a large number of pro-teins and their glycoforms.
Quantitation of Human Milk Proteins
The relative abundances of the seven proteins in milk variesconsiderably from ∼20 % for α-Lact and LF, ∼10 % for sIgA,∼5 % for LZ, and <1.0 % for IgG, IgM, and A1AT [65, 66].Different concentrations of each standard protein were pre-pared to produce a standard mixture (as 1× stock solution)consisting of 4.0 mg/mL for α-Lact and LF, 2.0 mg/mL forIgA, 0.4 mg/mL for LZ, IgG, IgM, and A1AT. In order toquantitate the targeted proteins, a series dilution of the stan-dard protein mix was used to build the calibration curve from5000×, 2000×, 1000×, 500×, 100×, 50×, 20×, 10×, 5×, 2×,and 1× (ESM Table S1). A 1.0-μL volume of each dilutionwas analyzed. The resulting calibration curves using one
Quantitation of human milk proteins and glycoproteins 595
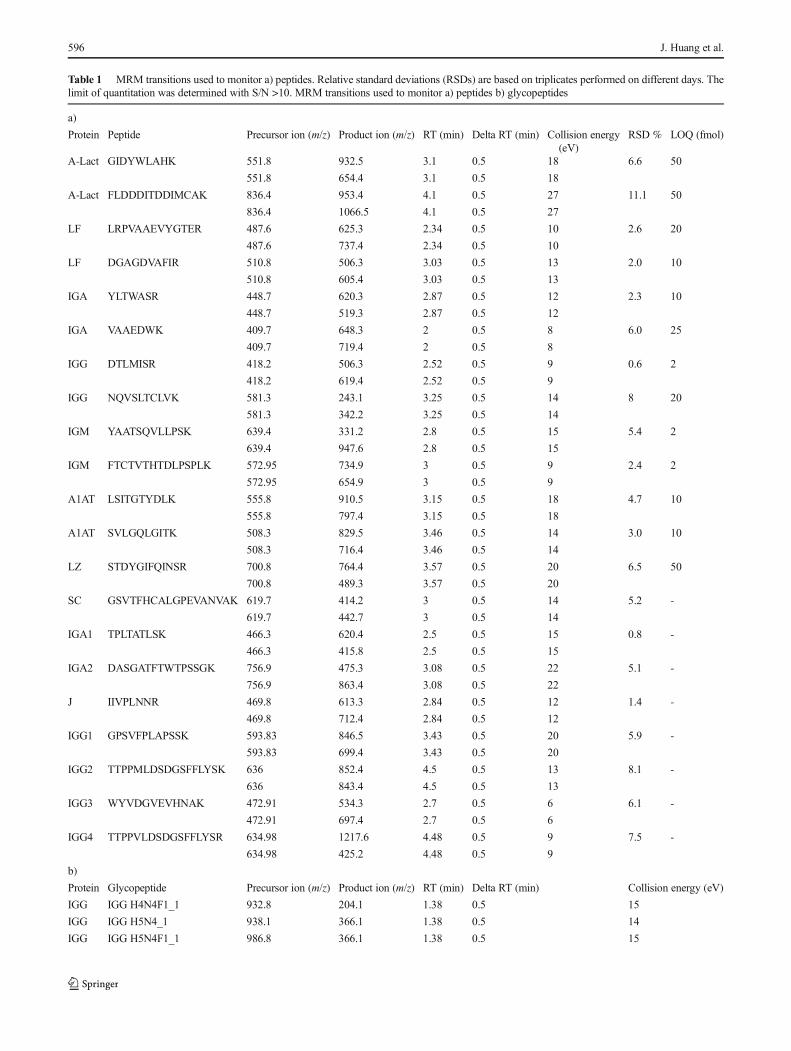
Table 1 MRM transitions used to monitor a) peptides. Relative standard deviations (RSDs) are based on triplicates performed on different days. Thelimit of quantitation was determined with S/N >10. MRM transitions used to monitor a) peptides b) glycopeptides
a)
Protein Peptide Precursor ion (m/z) Product ion (m/z) RT (min) Delta RT (min) Collision energy(eV)
RSD % LOQ (fmol)
A-Lact GIDYWLAHK 551.8 932.5 3.1 0.5 18 6.6 50
551.8 654.4 3.1 0.5 18
A-Lact FLDDDITDDIMCAK 836.4 953.4 4.1 0.5 27 11.1 50
836.4 1066.5 4.1 0.5 27
LF LRPVAAEVYGTER 487.6 625.3 2.34 0.5 10 2.6 20
487.6 737.4 2.34 0.5 10
LF DGAGDVAFIR 510.8 506.3 3.03 0.5 13 2.0 10
510.8 605.4 3.03 0.5 13
IGA YLTWASR 448.7 620.3 2.87 0.5 12 2.3 10
448.7 519.3 2.87 0.5 12
IGA VAAEDWK 409.7 648.3 2 0.5 8 6.0 25
409.7 719.4 2 0.5 8
IGG DTLMISR 418.2 506.3 2.52 0.5 9 0.6 2
418.2 619.4 2.52 0.5 9
IGG NQVSLTCLVK 581.3 243.1 3.25 0.5 14 8 20
581.3 342.2 3.25 0.5 14
IGM YAATSQVLLPSK 639.4 331.2 2.8 0.5 15 5.4 2
639.4 947.6 2.8 0.5 15
IGM FTCTVTHTDLPSPLK 572.95 734.9 3 0.5 9 2.4 2
572.95 654.9 3 0.5 9
A1AT LSITGTYDLK 555.8 910.5 3.15 0.5 18 4.7 10
555.8 797.4 3.15 0.5 18
A1AT SVLGQLGITK 508.3 829.5 3.46 0.5 14 3.0 10
508.3 716.4 3.46 0.5 14
LZ STDYGIFQINSR 700.8 764.4 3.57 0.5 20 6.5 50
700.8 489.3 3.57 0.5 20
SC GSVTFHCALGPEVANVAK 619.7 414.2 3 0.5 14 5.2 -
619.7 442.7 3 0.5 14
IGA1 TPLTATLSK 466.3 620.4 2.5 0.5 15 0.8 -
466.3 415.8 2.5 0.5 15
IGA2 DASGATFTWTPSSGK 756.9 475.3 3.08 0.5 22 5.1 -
756.9 863.4 3.08 0.5 22
J IIVPLNNR 469.8 613.3 2.84 0.5 12 1.4 -
469.8 712.4 2.84 0.5 12
IGG1 GPSVFPLAPSSK 593.83 846.5 3.43 0.5 20 5.9 -
593.83 699.4 3.43 0.5 20
IGG2 TTPPMLDSDGSFFLYSK 636 852.4 4.5 0.5 13 8.1 -
636 843.4 4.5 0.5 13
IGG3 WYVDGVEVHNAK 472.91 534.3 2.7 0.5 6 6.1 -
472.91 697.4 2.7 0.5 6
IGG4 TTPPVLDSDGSFFLYSR 634.98 1217.6 4.48 0.5 9 7.5 -
634.98 425.2 4.48 0.5 9
b)
Protein Glycopeptide Precursor ion (m/z) Product ion (m/z) RT (min) Delta RT (min) Collision energy (eV)
IGG IGG H4N4F1_1 932.8 204.1 1.38 0.5 15
IGG IGG H5N4_1 938.1 366.1 1.38 0.5 14
IGG IGG H5N4F1_1 986.8 366.1 1.38 0.5 15
596 J. Huang et al.
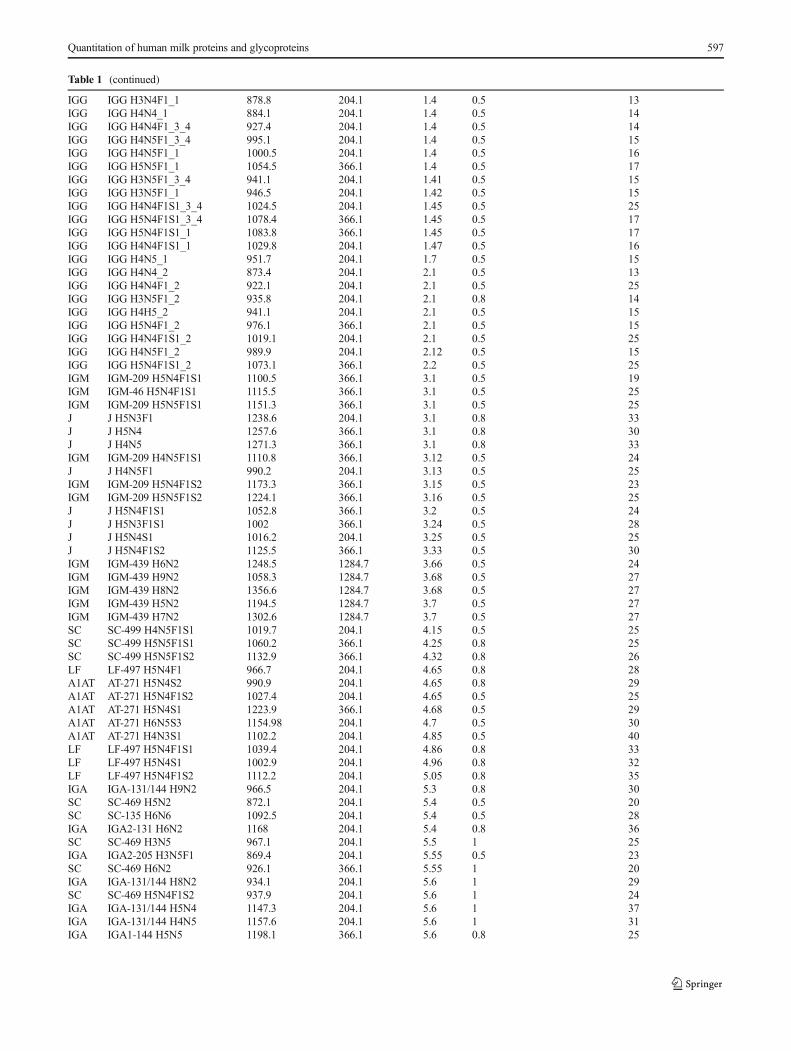
Table 1 (continued)
IGG IGG H3N4F1_1 878.8 204.1 1.4 0.5 13IGG IGG H4N4_1 884.1 204.1 1.4 0.5 14IGG IGG H4N4F1_3_4 927.4 204.1 1.4 0.5 14IGG IGG H4N5F1_3_4 995.1 204.1 1.4 0.5 15IGG IGG H4N5F1_1 1000.5 204.1 1.4 0.5 16IGG IGG H5N5F1_1 1054.5 366.1 1.4 0.5 17IGG IGG H3N5F1_3_4 941.1 204.1 1.41 0.5 15IGG IGG H3N5F1_1 946.5 204.1 1.42 0.5 15IGG IGG H4N4F1S1_3_4 1024.5 204.1 1.45 0.5 25IGG IGG H5N4F1S1_3_4 1078.4 366.1 1.45 0.5 17IGG IGG H5N4F1S1_1 1083.8 366.1 1.45 0.5 17IGG IGG H4N4F1S1_1 1029.8 204.1 1.47 0.5 16IGG IGG H4N5_1 951.7 204.1 1.7 0.5 15IGG IGG H4N4_2 873.4 204.1 2.1 0.5 13IGG IGG H4N4F1_2 922.1 204.1 2.1 0.5 25IGG IGG H3N5F1_2 935.8 204.1 2.1 0.8 14IGG IGG H4H5_2 941.1 204.1 2.1 0.5 15IGG IGG H5N4F1_2 976.1 366.1 2.1 0.5 15IGG IGG H4N4F1S1_2 1019.1 204.1 2.1 0.5 25IGG IGG H4N5F1_2 989.9 204.1 2.12 0.5 15IGG IGG H5N4F1S1_2 1073.1 366.1 2.2 0.5 25IGM IGM-209 H5N4F1S1 1100.5 366.1 3.1 0.5 19IGM IGM-46 H5N4F1S1 1115.5 366.1 3.1 0.5 25IGM IGM-209 H5N5F1S1 1151.3 366.1 3.1 0.5 25J J H5N3F1 1238.6 204.1 3.1 0.8 33J J H5N4 1257.6 366.1 3.1 0.8 30J J H4N5 1271.3 366.1 3.1 0.8 33IGM IGM-209 H4N5F1S1 1110.8 366.1 3.12 0.5 24J J H4N5F1 990.2 204.1 3.13 0.5 25IGM IGM-209 H5N4F1S2 1173.3 366.1 3.15 0.5 23IGM IGM-209 H5N5F1S2 1224.1 366.1 3.16 0.5 25J J H5N4F1S1 1052.8 366.1 3.2 0.5 24J J H5N3F1S1 1002 366.1 3.24 0.5 28J J H5N4S1 1016.2 204.1 3.25 0.5 25J J H5N4F1S2 1125.5 366.1 3.33 0.5 30IGM IGM-439 H6N2 1248.5 1284.7 3.66 0.5 24IGM IGM-439 H9N2 1058.3 1284.7 3.68 0.5 27IGM IGM-439 H8N2 1356.6 1284.7 3.68 0.5 27IGM IGM-439 H5N2 1194.5 1284.7 3.7 0.5 27IGM IGM-439 H7N2 1302.6 1284.7 3.7 0.5 27SC SC-499 H4N5F1S1 1019.7 204.1 4.15 0.5 25SC SC-499 H5N5F1S1 1060.2 366.1 4.25 0.8 25SC SC-499 H5N5F1S2 1132.9 366.1 4.32 0.8 26LF LF-497 H5N4F1 966.7 204.1 4.65 0.8 28A1AT AT-271 H5N4S2 990.9 204.1 4.65 0.8 29A1AT AT-271 H5N4F1S2 1027.4 204.1 4.65 0.5 25A1AT AT-271 H5N4S1 1223.9 366.1 4.68 0.5 29A1AT AT-271 H6N5S3 1154.98 204.1 4.7 0.5 30A1AT AT-271 H4N3S1 1102.2 204.1 4.85 0.5 40LF LF-497 H5N4F1S1 1039.4 204.1 4.86 0.8 33LF LF-497 H5N4S1 1002.9 204.1 4.96 0.8 32LF LF-497 H5N4F1S2 1112.2 204.1 5.05 0.8 35IGA IGA-131/144 H9N2 966.5 204.1 5.3 0.8 30SC SC-469 H5N2 872.1 204.1 5.4 0.5 20SC SC-135 H6N6 1092.5 204.1 5.4 0.5 28IGA IGA2-131 H6N2 1168 204.1 5.4 0.8 36SC SC-469 H3N5 967.1 204.1 5.5 1 25IGA IGA2-205 H3N5F1 869.4 204.1 5.55 0.5 23SC SC-469 H6N2 926.1 366.1 5.55 1 20IGA IGA-131/144 H8N2 934.1 204.1 5.6 1 29SC SC-469 H5N4F1S2 937.9 204.1 5.6 1 24IGA IGA-131/144 H5N4 1147.3 204.1 5.6 1 37IGA IGA-131/144 H4N5 1157.6 204.1 5.6 1 31IGA IGA1-144 H5N5 1198.1 366.1 5.6 0.8 25
Quantitation of human milk proteins and glycoproteins 597
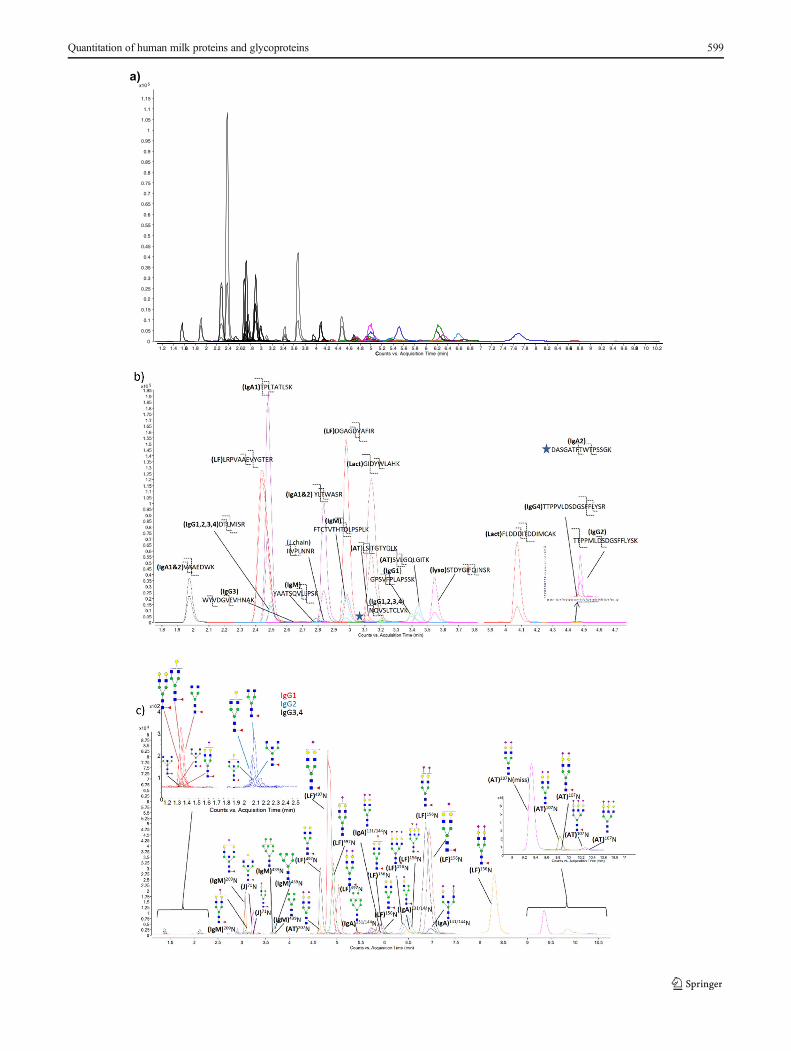
peptide from each protein is shown in Fig. 4. The calibrationcurve was linear over at least two orders of magnitude for theconcentration range. The calibration curves were fitted linear-ly with R2 from 0.99 to 0.999. Limit of quantitation (LOQ)was defined by the S/N>10. The LOQ of all seven targetedproteins are listed in Table 1.
The concentration of each protein in milk was determinedby fitting its unique peptide to the linear regression curve. Withtwo peptides selected for each protein (except for LZ), theaverage was used yielding variations of less than 20 % (datanot shown). Tryptic digestion is affected by the local activity ofthe enzyme. It is widely known that different amino acid mod-ifications may generate different efficiencies of the trypsin di-gestion and may yield missed cleavages. Hence, the average ofdifferent peptides from the same protein is a reliable way ofdiminishing the potential variations in enzymic activity.
The overall goal of this study is to develop a rapid-throughput method to quantify human milk protein concentra-tions and their glycosylation levels in different samples. Tothis end, mature human milk samples (>25 days of lactation)from three healthy donors were analyzed in triplicates (ninemilk samples in total) along with the standard mixtures byrandomizing the sample pool in a 96-well plate and trypsindigested as discussed in the experimental section above. Anexample of chromatograms obtained from the MRM
Table 1 (continued)
SC SC-135 H5N4F1S2 906.2 204.1 5.65 0.5 30IGA IGA-131/144 H3N4 1066.3 204.1 5.65 0.5 34IGA IGA-131/144 H5N2 1045.8 204.1 5.7 0.8 33IGA IGA1-144 H3N5 1117.1 366.1 5.7 0.8 25SC SC-135 H7N7 1173.5 204.1 5.7 0.5 30SC SC-135 H6N7 1143.3 204.1 5.73 0.8 30IGA IGA-131/144 H3N3 1015.5 204.1 5.75 0.8 32SC SC-135 H7N6 1133 366.1 5.75 0.8 28IGA IGA-131/144 H3N5F1 1102.8 204.1 5.8 0.5 32IGA IGA1-144 H5N4S2 1292.9 366.1 5.8 0.5 30IGA IGA-131/144 H5N4S2 1034.5 204.1 5.9 0.5 32LF LF-156 H5N4F1 1250.6 204.1 5.9 0.8 35SC SC-186 H6N6S1 1252.6 366.1 5.9 0.8 32LF LF-156 H5N4F2 1287.1 204.1 5.9 0.8 44IGA IGA-131/144 H5F4S1 976.3 204.1 6 1 24IGA IGA2-205 H5N5F1 977.5 366.1 6 0.8 25IGA IGA-131/144 H5N5S1 1016.9 366.1 6.05 0.8 25IGA IGA-131/144 H4N5S1 984.5 204.1 6.15 0.8 31LF LF-156 H6N5F3S1 1190.3 366.2 6.4 0.8 26LF LF-156 H6N5F2S1 1161.1 204.1 6.5 0.8 36IGA IGA-131/144 H5N3S1 1169.3 204.1 6.5 0.8 43IGA IGA2-205 H5N4F1S1 1006.8 366.1 6.7 0.8 25IGA IGA-131/144 H4N4S1 1179.6 204.1 6.7 0.8 41LF LF-156 H5N4F2S1 1088.1 204.1 6.88 0.8 33SC SC-469 H4N5F1 1069.8 366.1 6.95 0.8 28LF LF-156 H5N4F1S1 1058.9 204.1 7 0.8 35IGA IGA2-205 H5N5F1S1 1074.5 366.1 7 0.8 25IGA IGA-131/144 H5N5S2 1075.1 366.1 7 0.8 25SC SC-469 H5N4F1S1 1153.2 366.1 7 0.8 30SC SC-421 H5N4F1S1 1116.3 366.1 7.15 0.8 30LF LF-156 H5N4F3S1 1117.3 204.1 7.15 0.8 36LF LF-156 H5N4F1S2 1117.1 204.1 8.4 0.8 35A1AT AT-271 H5N4S2 Missed
cleavage site958.44 204.1 9.25 0.8 25
A1AT AT-107 H5N4S2 1180.12 204.1 9.87 0.5 36A1AT AT-107 H5N4F1S2 1209.33 204.1 9.97 0.5 36A1AT AT-107 H7N6F2S3 1202.51 204.1 10 0.5 36A1AT AT-107 H6N5S3 1311.34 204.1 10.35 0.5 45A1AT AT-107 H6N5F1S3 1340.59 204.1 10.35 0.5 45
Dynamic MRM was used. Delta retention time is the retention time window for the target transition
H hexose, N HexNAc, F fucose, S, N-acetyl neuraminic acid
�Fig. 3 Total MRM chromatogram for seven standard protein mix usingUPLC-C18 chromatography. MRM chromatograms for a peptides andglycopeptides, b peptide with assigned transitions, and c glycopeptideswith assigned transitions. The MRM transitions are shown in Table 1.One MRM transition was monitored for each glycopeptide; two MRMtransitions were monitored for each peptide
598 J. Huang et al.
a) 5x10
0
0.05
0.1
0.15
0.2
0.25
0.3
0.35
0.4
0.45
0.5
0.55
0.6
0.65
0.7
0.75
0.8
0.85
0.9
0.95
1
1.05
1.1
1.15
1.2 1.4 1.66 1.8 2 2.2 2.4 2.62 .8 3 3.2 3.4 3.6 3.8C
4 4.2 4.4 4.6 4.8 5Counts vs. Acquisition Time (m
5.2 5.4 5.6 5.8 6 6.2in)6.4 6.6 6.8 7 7.2 7.4 7.6 7.8 8 8.2 8.4 8.66 8.8 9 9.2 9.4 9.6 9.88 10 10.2
Quantitation of human milk proteins and glycoproteins 599
transitions of human milk digest are shown in ESM Fig. S2aand S2b for the selected peptides and glycopeptides,respectively.
The concentrations of the targeted proteins were calculatedfrom the calibration curves with the mean concentration andintraday reproducibility as shown in Table 2a. Parallel
experiments were performed on two other days to determinethe interday reproducibility (Table 2a). High reproducibility ofprotein quantitation in human milk was obtained with lessthan 10 % RSD from intraday analysis and slightly higherfrom interday analysis. The concentrations of the seven pro-teins from three mature milk samples α-Lact (3.1 ± 0.4 g/L),
Fig. 4 Peptide calibration curves for protein quantitation. a α-lact, b LF,c IgA1/2, d IgG1234, e IgM, f A1AT, and g LZ. The response can befitted to a quadratic equation (dashed in blue). The dynamic rang was
over 1000. The linear fit (dashed in red) generated an equation with R2
from 0.99 to 0.999. The linear range was more than 100
600 J. Huang et al.
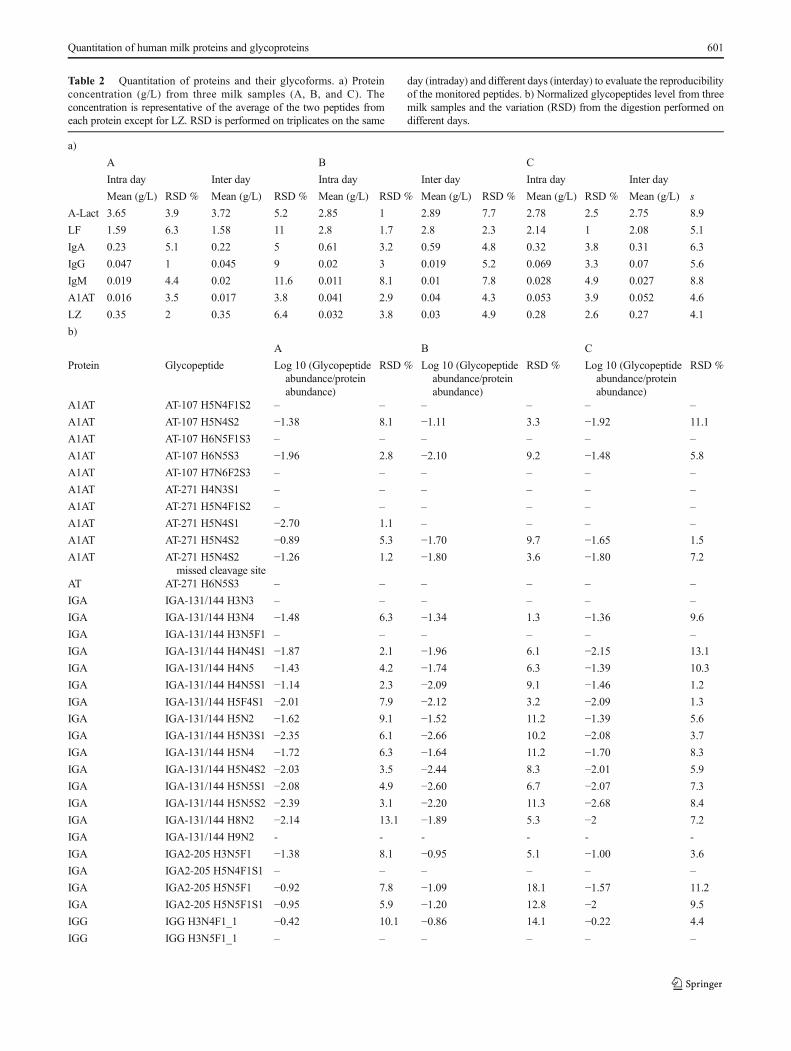
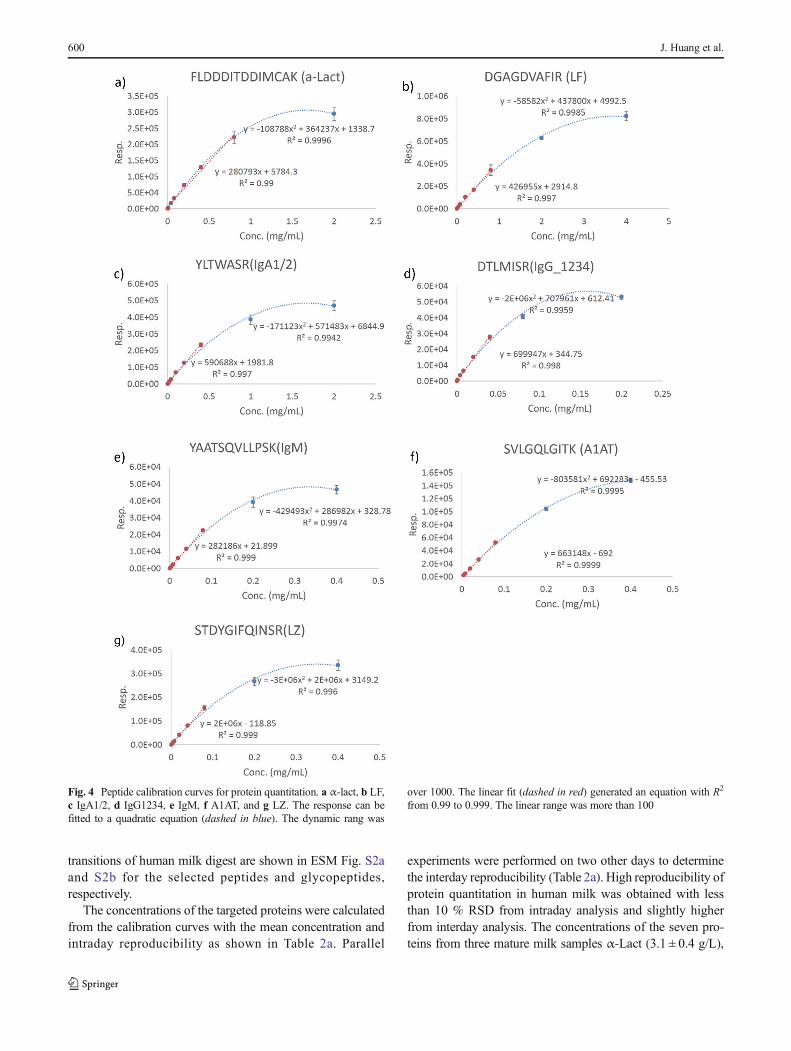
Table 2 Quantitation of proteins and their glycoforms. a) Proteinconcentration (g/L) from three milk samples (A, B, and C). Theconcentration is representative of the average of the two peptides fromeach protein except for LZ. RSD is performed on triplicates on the same
day (intraday) and different days (interday) to evaluate the reproducibilityof the monitored peptides. b) Normalized glycopeptides level from threemilk samples and the variation (RSD) from the digestion performed ondifferent days.
a)
A B C
Intra day Inter day Intra day Inter day Intra day Inter day
Mean (g/L) RSD % Mean (g/L) RSD % Mean (g/L) RSD % Mean (g/L) RSD % Mean (g/L) RSD % Mean (g/L) s
A-Lact 3.65 3.9 3.72 5.2 2.85 1 2.89 7.7 2.78 2.5 2.75 8.9
LF 1.59 6.3 1.58 11 2.8 1.7 2.8 2.3 2.14 1 2.08 5.1
IgA 0.23 5.1 0.22 5 0.61 3.2 0.59 4.8 0.32 3.8 0.31 6.3
IgG 0.047 1 0.045 9 0.02 3 0.019 5.2 0.069 3.3 0.07 5.6
IgM 0.019 4.4 0.02 11.6 0.011 8.1 0.01 7.8 0.028 4.9 0.027 8.8
A1AT 0.016 3.5 0.017 3.8 0.041 2.9 0.04 4.3 0.053 3.9 0.052 4.6
LZ 0.35 2 0.35 6.4 0.032 3.8 0.03 4.9 0.28 2.6 0.27 4.1
b)
A B C
Protein Glycopeptide Log 10 (Glycopeptideabundance/proteinabundance)
RSD % Log 10 (Glycopeptideabundance/proteinabundance)
RSD % Log 10 (Glycopeptideabundance/proteinabundance)
RSD %
A1AT AT-107 H5N4F1S2 – – – – – –
A1AT AT-107 H5N4S2 −1.38 8.1 −1.11 3.3 −1.92 11.1
A1AT AT-107 H6N5F1S3 – – – – – –
A1AT AT-107 H6N5S3 −1.96 2.8 −2.10 9.2 −1.48 5.8
A1AT AT-107 H7N6F2S3 – – – – – –
A1AT AT-271 H4N3S1 – – – – – –
A1AT AT-271 H5N4F1S2 – – – – – –
A1AT AT-271 H5N4S1 −2.70 1.1 – – – –
A1AT AT-271 H5N4S2 −0.89 5.3 −1.70 9.7 −1.65 1.5
A1AT AT-271 H5N4S2missed cleavage site
−1.26 1.2 −1.80 3.6 −1.80 7.2
AT AT-271 H6N5S3 – – – – – –
IGA IGA-131/144 H3N3 – – – – – –
IGA IGA-131/144 H3N4 −1.48 6.3 −1.34 1.3 −1.36 9.6
IGA IGA-131/144 H3N5F1 – – – – – –
IGA IGA-131/144 H4N4S1 −1.87 2.1 −1.96 6.1 −2.15 13.1
IGA IGA-131/144 H4N5 −1.43 4.2 −1.74 6.3 −1.39 10.3
IGA IGA-131/144 H4N5S1 −1.14 2.3 −2.09 9.1 −1.46 1.2
IGA IGA-131/144 H5F4S1 −2.01 7.9 −2.12 3.2 −2.09 1.3
IGA IGA-131/144 H5N2 −1.62 9.1 −1.52 11.2 −1.39 5.6
IGA IGA-131/144 H5N3S1 −2.35 6.1 −2.66 10.2 −2.08 3.7
IGA IGA-131/144 H5N4 −1.72 6.3 −1.64 11.2 −1.70 8.3
IGA IGA-131/144 H5N4S2 −2.03 3.5 −2.44 8.3 −2.01 5.9
IGA IGA-131/144 H5N5S1 −2.08 4.9 −2.60 6.7 −2.07 7.3
IGA IGA-131/144 H5N5S2 −2.39 3.1 −2.20 11.3 −2.68 8.4
IGA IGA-131/144 H8N2 −2.14 13.1 −1.89 5.3 −2 7.2
IGA IGA-131/144 H9N2 - - - - - -
IGA IGA2-205 H3N5F1 −1.38 8.1 −0.95 5.1 −1.00 3.6
IGA IGA2-205 H5N4F1S1 – – – – – –
IGA IGA2-205 H5N5F1 −0.92 7.8 −1.09 18.1 −1.57 11.2
IGA IGA2-205 H5N5F1S1 −0.95 5.9 −1.20 12.8 −2 9.5
IGG IGG H3N4F1_1 −0.42 10.1 −0.86 14.1 −0.22 4.4
IGG IGG H3N5F1_1 – – – – – –
Quantitation of human milk proteins and glycoproteins 601
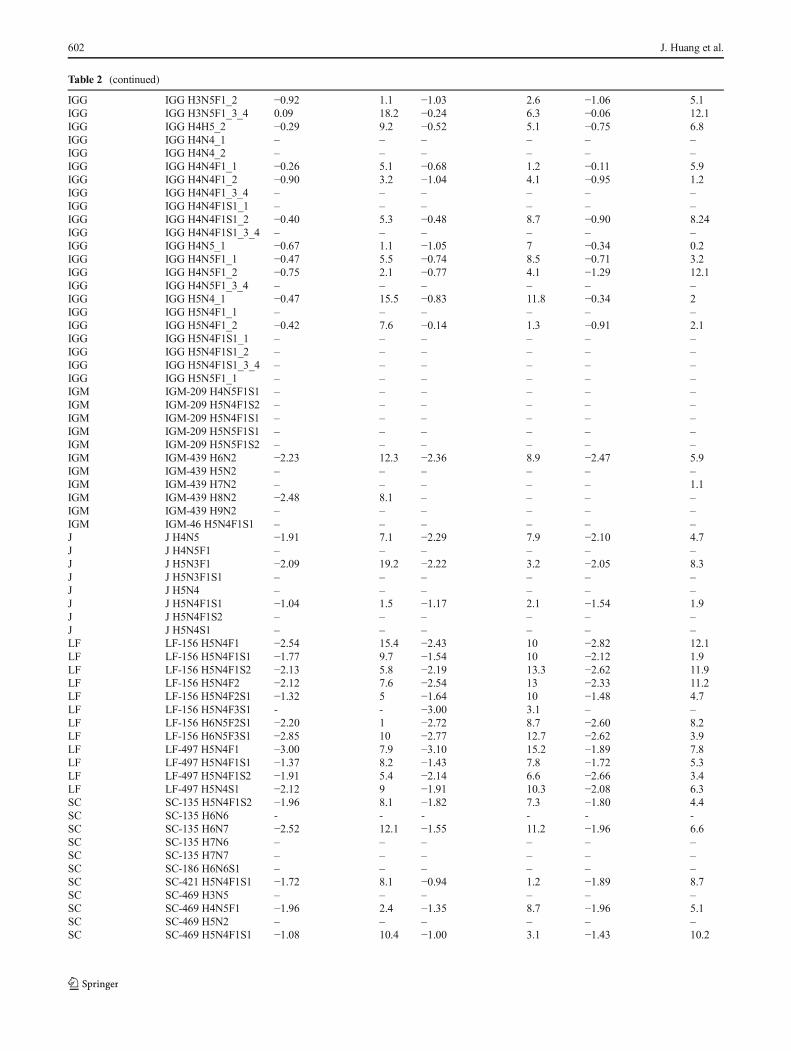
Table 2 (continued)
IGG IGG H3N5F1_2 −0.92 1.1 −1.03 2.6 −1.06 5.1IGG IGG H3N5F1_3_4 0.09 18.2 −0.24 6.3 −0.06 12.1IGG IGG H4H5_2 −0.29 9.2 −0.52 5.1 −0.75 6.8IGG IGG H4N4_1 – – – – – –IGG IGG H4N4_2 – – – – – –IGG IGG H4N4F1_1 −0.26 5.1 −0.68 1.2 −0.11 5.9IGG IGG H4N4F1_2 −0.90 3.2 −1.04 4.1 −0.95 1.2IGG IGG H4N4F1_3_4 – – – – – –IGG IGG H4N4F1S1_1 – – – – – –IGG IGG H4N4F1S1_2 −0.40 5.3 −0.48 8.7 −0.90 8.24IGG IGG H4N4F1S1_3_4 – – – – – –IGG IGG H4N5_1 −0.67 1.1 −1.05 7 −0.34 0.2IGG IGG H4N5F1_1 −0.47 5.5 −0.74 8.5 −0.71 3.2IGG IGG H4N5F1_2 −0.75 2.1 −0.77 4.1 −1.29 12.1IGG IGG H4N5F1_3_4 – – – – – –IGG IGG H5N4_1 −0.47 15.5 −0.83 11.8 −0.34 2IGG IGG H5N4F1_1 – – – – – –IGG IGG H5N4F1_2 −0.42 7.6 −0.14 1.3 −0.91 2.1IGG IGG H5N4F1S1_1 – – – – – –IGG IGG H5N4F1S1_2 – – – – – –IGG IGG H5N4F1S1_3_4 – – – – – –IGG IGG H5N5F1_1 – – – – – –IGM IGM-209 H4N5F1S1 – – – – – –IGM IGM-209 H5N4F1S2 – – – – – –IGM IGM-209 H5N4F1S1 – – – – – –IGM IGM-209 H5N5F1S1 – – – – – –IGM IGM-209 H5N5F1S2 – – – – – –IGM IGM-439 H6N2 −2.23 12.3 −2.36 8.9 −2.47 5.9IGM IGM-439 H5N2 – – – – – –IGM IGM-439 H7N2 – – – – – 1.1IGM IGM-439 H8N2 −2.48 8.1 – – – –IGM IGM-439 H9N2 – – – – – –IGM IGM-46 H5N4F1S1 – – – – – –J J H4N5 −1.91 7.1 −2.29 7.9 −2.10 4.7J J H4N5F1 – – – – – –J J H5N3F1 −2.09 19.2 −2.22 3.2 −2.05 8.3J J H5N3F1S1 – – – – – –J J H5N4 – – – – – –J J H5N4F1S1 −1.04 1.5 −1.17 2.1 −1.54 1.9J J H5N4F1S2 – – – – – –J J H5N4S1 – – – – – –LF LF-156 H5N4F1 −2.54 15.4 −2.43 10 −2.82 12.1LF LF-156 H5N4F1S1 −1.77 9.7 −1.54 10 −2.12 1.9LF LF-156 H5N4F1S2 −2.13 5.8 −2.19 13.3 −2.62 11.9LF LF-156 H5N4F2 −2.12 7.6 −2.54 13 −2.33 11.2LF LF-156 H5N4F2S1 −1.32 5 −1.64 10 −1.48 4.7LF LF-156 H5N4F3S1 - - −3.00 3.1 – –LF LF-156 H6N5F2S1 −2.20 1 −2.72 8.7 −2.60 8.2LF LF-156 H6N5F3S1 −2.85 10 −2.77 12.7 −2.62 3.9LF LF-497 H5N4F1 −3.00 7.9 −3.10 15.2 −1.89 7.8LF LF-497 H5N4F1S1 −1.37 8.2 −1.43 7.8 −1.72 5.3LF LF-497 H5N4F1S2 −1.91 5.4 −2.14 6.6 −2.66 3.4LF LF-497 H5N4S1 −2.12 9 −1.91 10.3 −2.08 6.3SC SC-135 H5N4F1S2 −1.96 8.1 −1.82 7.3 −1.80 4.4SC SC-135 H6N6 - - - - - -SC SC-135 H6N7 −2.52 12.1 −1.55 11.2 −1.96 6.6SC SC-135 H7N6 – – – – – –SC SC-135 H7N7 – – – – – –SC SC-186 H6N6S1 – – – – – –SC SC-421 H5N4F1S1 −1.72 8.1 −0.94 1.2 −1.89 8.7SC SC-469 H3N5 – – – – – –SC SC-469 H4N5F1 −1.96 2.4 −1.35 8.7 −1.96 5.1SC SC-469 H5N2 – – – – – –SC SC-469 H5N4F1S1 −1.08 10.4 −1.00 3.1 −1.43 10.2
602 J. Huang et al.
LF (2.2 ± 0.5 g/L), IgA (0.39 ± 0.12 g/L), IgG (0.045 ± 0.02 g/L), IgM (0.019 ± 0.007 g/L), A1AT (0.037 ± 0.015 g/L), andLZ (0.22 ± 0.13 g/L) include biological variations from thethree individuals.
Conventional methods including radial immunodiffusion,immunoelectrophoresis, enzyme-linked immunosorbent assay(ELISA), sodium dodecyl sulfate polyacrylamide gel electro-phoresis (SDS-PAGE), and microparticle-enhanced nephelo-metric immunoassay were the commonly used analyticalmethods to quantitate individual proteins in human milk [6,28, 29, 67–69]. Previous studies have shown similar concen-trations of these proteins using other techniques [65, 67–69].However, none of these methods monitor protein glycosyla-tion. Here, we present for the first time, a mass spectrometricmethod to quantify seven proteins along with their glycoformsin human milk.
The approach we developed takes protein abundances intoconsideration. Quantitation of glycosylation in milk proteins,where the vast majority of studies have been performed, iscurrently limited only to the ion abundances of glycans/glycopeptides [70, 71]. However, there has been no informa-tion on how the protein level affects measured glycan abun-dances. We have previously reported a method for IgG where
the glycopeptide signals were normalized to the protein abun-dances to remove the contribution of protein concentration[36]. Here, we expand this capability for several proteins inmilk. For LF, IgM, and A1AT, the glycopeptide signals werenormalized to the peptide yielding the higher ion abundance.For sIgA and IgG, because of their complexity with differentpolypeptides and subclasses, the glycopeptides were normal-ized to respective peptides on SC, IgA1, IgA2, J chain, IgG1,IgG2, and IgG3/4. The unique peptide from these polypep-tides that were monitored are listed in Table 1a. Glycopeptidesfrom IgA1 (144N) and IgA2 (131N) could not be distinguishedbecause the tryptic peptides are identical; thus, the signalswere normalized to the common peptide from IgA1/2.Similarly, glycopeptides from IgG3 and IgG4 could not bedistinguished; thus, the signals were normalized to the sumof the two peptides from IgG3 and IgG4. The normalizedglycopeptide level from the three milk samples with theirRSD is shown in Table 2b. A relatively higher RSD wasobserved for glycopeptides, which is expected. The variationis likely due to the incomplete trypsin digestion due to thepresence of glycan [72–74] that may block the cleavage site.Some of the glycopeptides were not quantified due to theirlow S/N (<10) (Table 2b). Because the concentration of these
Table 2 (continued)
SC SC-469 H5N4F1S2 −2.29 15.3 −1.66 11.2 −1.89 7.7SC SC-469 H6N2 −2.29 3.8 −1.96 3.3 −2.15 4.8SC SC-499 H4N5F1S1 – – – – – –SC SC-499 H5N5F1S1 −1.72 2.3 −1.85 8.1 −1.82 4SC SC-499 H5N5F1S2 −1.70 4.5 −1.49 7.1 −1.92 6.8
Any glycopeptide with S/N less than 10 was shown as B–^
H hexose, N HexNAc, F fucose, S, N-acetyl neuraminic acid
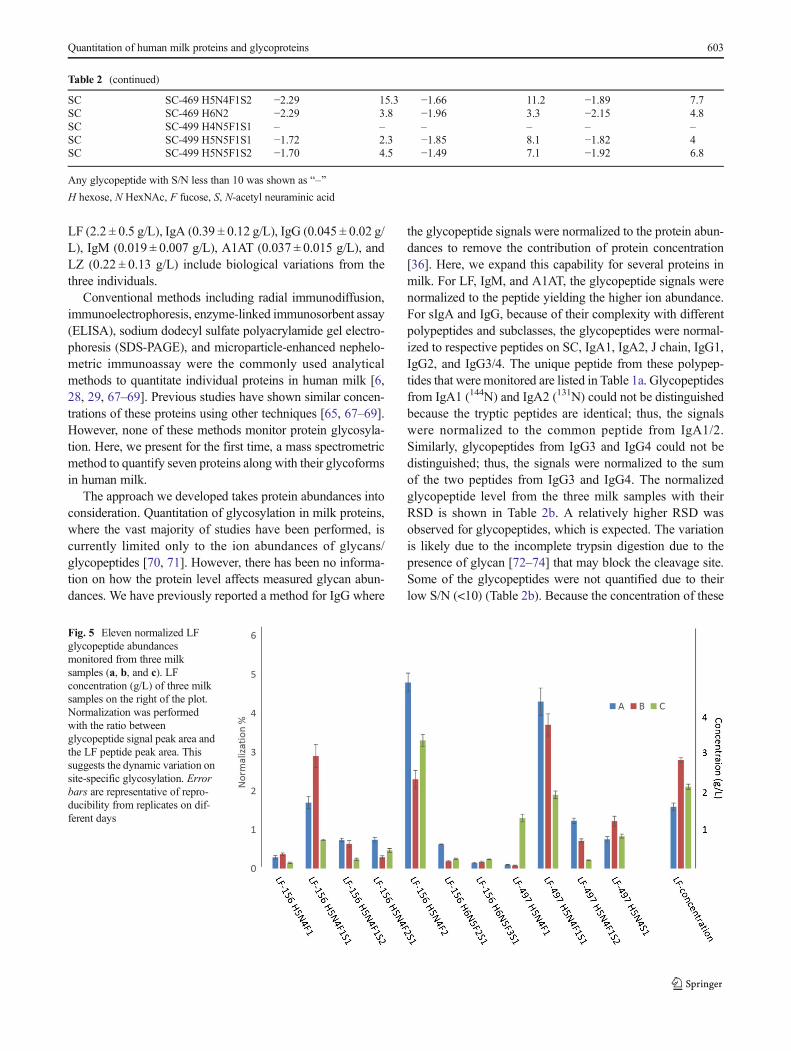
Fig. 5 Eleven normalized LFglycopeptide abundancesmonitored from three milksamples (a, b, and c). LFconcentration (g/L) of three milksamples on the right of the plot.Normalization was performedwith the ratio betweenglycopeptide signal peak area andthe LF peptide peak area. Thissuggests the dynamic variation onsite-specific glycosylation. Errorbars are representative of repro-ducibility from replicates on dif-ferent days
Quantitation of human milk proteins and glycoproteins 603
proteins in milk usually ranges some three orders of magni-tude, signals of glycopeptides from the less abundant proteinssuch as IgG and IgM were limited. However, quantitation ofthese glycopeptides could be achieved alternatively by theenrichment of the respective glycoproteins.
Differences in levels of glycosylation were observed fromthe three milk samples. For example, in Fig. 5, the 11 observedLF-glycopeptides are provided along with the concentrationof LF. There appears to be no correlation between glycosyla-tion and protein concentrations. However, the method illus-trates well the quantitation of protein and their site-specificglycosylation simultaneously, and it will facilitate the under-standing of function of glycosylation in human milk.
Conclusion
We have established an analytical method using MRM for thequantitation of milk proteins and their glycoforms in a rapidthroughput manner. The approach detailed here provides quan-titative analyses of proteins and the site-specific glycosylation.Quantitative glycosylation information at a given site is obtain-ed by normalization to the protein measured abundances,which was previously not feasible. High sensitivity and repro-ducibility were observed from this MRM analysis. The methoddeveloped in this study is currently being used to analyze largesample sets and will aid in elucidating the biological functionsof human milk glycoproteins during lactation.
Acknowledgments We are grateful for funds from the NationalInstitutes of Health (GM049077, HD061923, P42 ES02710,R01AT007079, and HD059127) and California Dairy ResearchFoundation Grant 06 LEC-01-NH. The Agilent QTOF MS instrumentwas obtained through a grant (S10RR027639).
Compliance with ethical standards
Conflict of interest The authors declare that there is no conflict ofinterest.
Informed consent Informed consents were obtained from all individ-ual participants.
Human and animal rights All the procedures related to human sam-ples were performed in accordance with policies, procedures, and regu-lations approved by the ethics committee at the University of California inDavis.
References
1. Lee H, Lerno LA, Choe Y, Chu CS, Gillies LA, Grimm R, et al.Multiple precursor ion scanning of gangliosides and sulfatides witha reversed-phase microfluidic chip and quadrupole time-of-flightmass spectrometry. Anal Chem. 2012;84(14):5905–12.doi:10.1021/ac300254d.
2. Ruhaak LR, Lebrilla CB. Advances in analysis of humanmilk oligosaccharides. Adv Nutr. 2012;3(3):406S–14.doi:10.3945/an.112.001883.
3. Totten SM, Zivkovic AM, Wu S, Ngyuen U, Freeman SL, RuhaakLR, et al. Comprehensive profiles of human milk oligosaccharidesyield highly sensitive and specific markers for determining secretorstatus in lactating mothers. J Proteome Res. 2012;11(12):6124–33.doi:10.1021/pr300769g.
4. Lönnerdal B. Bioactive proteins in human milk: mechanisms ofaction. J Pediatr. 2010;156(2):S26–30.
5. Dallas DC, Guerrero A, Khaldi N, Castillo PA, Martin WF,Smilowitz JT, et al. Extensive in vivo human milk peptidomicsreveals specific proteolysis yielding protective antimicrobial pep-tides. J Proteome Res. 2013;12(5):2295–304.
6. Froehlich JW, Dodds ED, Barboza M, McJimpsey EL, Seipert RR,Francis J, et al. Glycoprotein expression in human milk duringlactation. J Agric Food Chem. 2010;58(10):6440–8.
7. Barboza M, Pinzon J, Wickramasinghe S, Froehlich JW, Moeller I,Smilowitz JT, et al. Glycosylation of human milk lactoferrin ex-hibits dynamic changes during early lactation enhancing its role inpathogenic bacteria-host interactions. Mol Cell Proteomics.2012;11(6).
8. Liao Y, Jiang R, Lönnerdal B. Biochemical and molecular impactsof lactoferrin on small intestinal growth and development duringearly life11 This article is part of a Special Issue entitled Lactoferrinand has undergone the Journal’s usual peer review process.Biochem Cell Biol. 2012;90(3):476–84. doi:10.1139/o11-075.
9. Lönnerdal B. Nutritional and physiologic significance of humanmilk proteins. Am J Clin Nutr. 2003;77(6):1537S–43.
10. Zivkovic AM, German JB, Lebrilla CB, Mills DA. Human milkglycobiome and its impact on the infant gastrointestinal microbiota.Proc Natl Acad Sci. 2011;108(Supplement 1):4653–8.
11. Lasky LA. Selectins: interpreters of cell-specific carbohydrateinformation during inflammation. Science. 1992;258(5084):964–9.
12. Lowe JB. Glycosyltransferases and glycan structures contributingto the adhesive activities of L-, E-and P-selectin counter-receptors.In: Biochemical Society Symposia, 2002. London; Portland on be-half of The Biochemical Society; 1999, pp 33–46
13. Fukuda MN, Sasaki H, Lopez L, Fukuda M. Survival of recombi-nant erythropoietin in the circulation: the role of carbohydrates.Blood. 1989;73(1):84–9.
14. Shental-Bechor D, Levy Y. Folding of glycoproteins: toward un-derstanding the biophysics of the glycosylation code. Curr OpinStruct Biol. 2009;19(5):524–33.
15. Pellegrini A, Thomas U, Bramaz N, Hunziker P, von Fellenberg R.Isolation and identification of three bactericidal domains in the bo-vine α-lactalbumin molecule. Biochim Biophys Acta (BBA) GenSubj. 1999;1426(3):439–48.
16. Ebner K, Brodbeck U. Biological role ofα−lactalbumin: a review. JDairy Sci. 1968;51(3):317–22.
17. Norderhaug I, Johansen F, Schjerven H, Brandtzaeg P. Regulationof the formation and external transport of secretory immunoglobu-lins. Crit Rev Immunol. 1999;19(5–6):481–508.
18. Royle L, Roos A, Harvey DJ,WormaldMR, Van Gijlswijk-JanssenD, Redwan E-RM, et al. Secretory IgA N-and O-glycans provide alink between the innate and adaptive immune systems. J BiolChem. 2003;278(22):20140–53.
19. Wold AE, Mestecky J, Tomana M, Kobata A, Ohbayashi H, EndoT, et al. Secretory immunoglobulin A carries oligosaccharide recep-tors for Escherichia coli type 1 fimbrial lectin. Infect Immun.1990;58(9):3073–7.
20. Zauner G, Selman MH, Bondt A, Rombouts Y, Blank D, DeelderAM, et al. Glycoproteomic analysis of antibodies. Mol CellProteomics. 2013;12(4):856–65.
604 J. Huang et al.
21. ChowanadisaiW, Lönnerdal B.α1-Antitrypsin and antichymotrypsinin human milk: origin, concentrations, and stability. Am J Clin Nutr.2002;76(4):828–33.
22. Lonnerdal B. Bioactive proteins in human milk: mechanisms ofaction. (1097–6833 (Electronic))
23. Newburg DS, Walker WA. Protection of the neonate by the innateimmune system of developing gut and of human milk. Pediatr Res.2007;61(1):2–8.
24. Ng-Kwai-Hang K, Kroeker E. Rapid separation and quantificationof major caseins and whey proteins of bovine milk by polyacryl-amide gel electrophoresis. J Dairy Sci. 1984;67(12):3052–6.
25. Kinghorn NM, Norris CS, Paterson GR, Otter DE. Comparison ofcapillary electrophoresis with traditional methods to analyse bovinewhey proteins. J Chromatogr A. 1995;700(1):111–23.
26. Palmano KP, Elgar DF. Detection and quantitation of lactoferrin inbovine whey samples by reversed-phase high-performance liquidchromatography on polystyrene–divinylbenzene. J Chromatogr A.2002;947(2):307–11.
27. Hurley IP, Coleman RC, Ireland HE, Williams JH. Use of sandwichIgG ELISA for the detection and quantification of adulteration ofmilk and soft cheese. Int Dairy J. 2006;16(7):805–12.
28. Montagne PM, Trégoat VS, Cuillière ML, Béné MC, Faure GC.Measurement of nine human milk proteins by nephelometric im-munoassays: application to the determination of mature milk pro-tein profile. Clin Biochem. 2000;33(3):181–6.
29. Montagne P, Cuillière ML, Molé C, Béné MC, Faure G.Microparticle-enhanced nephelometric immunoassay of lysozymein milk and other human body fluids. Clin Chem. 1998;44(8):1610–5.
30. Kuzyk MA, Smith D, Yang J, Cross TJ, Jackson AM, Hardie DB,et al. Multiple reaction monitoring-based, multiplexed, absolutequantitation of 45 proteins in human plasma. Mol CellProteomics. 2009;8(8):1860–77.
31. Anderson L, Hunter CL. Quantitative mass spectrometric multiplereaction monitoring assays for major plasma proteins. Mol CellProteomics. 2006;5(4):573–88.
32. Keshishian H, Addona T, Burgess M, Kuhn E, Carr SA.Quantitative, multiplexed assays for low abundance proteins inplasma by targeted mass spectrometry and stable isotope dilution.Mol Cell Proteomics. 2007;6(12):2212–29.
33. Affolter M, Grass L, Vanrobaeys F, Casado B, Kussmann M.Qualitative and quantitative profiling of the bovine milk fat globulemembrane proteome. J Proteome. 2010;73(6):1079–88.
34. Shi T, Su D, Liu T, Tang K, Camp DG, Qian WJ, et al. Advancingthe sensitivity of selected reaction monitoring‐based targeted quan-titative proteomics. Proteomics. 2012;12(8):1074–92.
35. Zhang J, Lai S, Zhang Y, Huang B, Li D, Ren Y. Multiple reactionmonitoring-based determination of bovine α-lactalbumin in infantformulas and whey protein concentrates by ultra-high performanceliquid chromatography–tandem mass spectrometry using trypticsignature peptides and synthetic peptide standards. Anal ChimActa. 2012;727:47–53.
36. Hong Q, Lebrilla CB, Miyamoto S, Ruhaak LR. Absolute quan-titation of immunoglobulin G and its glycoforms using multiplereaction monitoring. Anal Chem. 2013;85(18):8585–93.doi:10.1021/ac4009995.
37. Nwosu CC, Seipert RR, Strum JS, Hua SS, An HJ, Zivkovic AM,et al. Simultaneous and extensive site-specific N-and O-glycosylation analysis in protein mixtures. J Proteome Res.2011;10(5):2612–24.
38. Huang J, Lee H, Zivkovic AM, Smilowitz JT, Rivera N, GermanJB, et al. Glycomic analysis of high density lipoprotein shows ahighly sialylated particle. J Proteome Res. 2014;13(2):681–91.doi:10.1021/pr4012393.
39. Baker HM, Baker EN. Lactoferrin and iron: structural and dynamicaspects of binding and release. Biometals. 2004;17(3):209–16.
40. Haridas M, Anderson B, Baker E. Structure of human diferriclactoferrin refined at 2.2 A resolution. Acta Crystallogr D BiolCrystallogr. 1995;51(5):629–46.
41. Legrand D. Lactoferrin, a key molecule in immune and inflamma-tory processes11. This article is part of Special Issue entitledLactoferrin and has undergone the Journal’s usual peer review pro-cess. BiochemCell Biol. 2011;90(3):252–68. doi:10.1139/o11-056.
42. Liao Y, Alvarado R, Phinney B, Lonnerdal B. Proteomic char-acterization of human milk whey proteins during a twelve-month lactation period. J Proteome Res. 2011;10(4):1746–54.doi:10.1021/pr101028k.
43. Blanchard H, Yu X, Coulson BS, von Itzstein M. Insight into hostcell carbohydrate-recognition by human and porcine rotavirus fromcrystal structures of the virion spike associated carbohydrate-binding domain (VP8*). J Mol Biol. 2007;367(4):1215–26.
44. Sela DA, Li Y, Lerno L, Wu S, Marcobal AM, German JB,et al. An infant-associated bacterial commensal utilizes breastmilk sialyloligosaccharides. J Biol Chem. 2011; 286(14).doi:10.1074/jbc.M110.193359
45. Pyburn TM, Bensing BA, Xiong YQ,Melancon BJ, Tomasiak TM,Ward NJ, et al. A structural model for binding of the serine-richrepeat adhesin GspB to host carbohydrate receptors. PLoS Pathog.2011;7(7), e1002112.
46. Viswanathan K, Chandrasekaran A, Srinivasan A, Raman R,Sasisekharan V, Sasisekharan R. Glycans as receptors for influenzapathogenesis. Glycoconj J. 2010;27(6):561–70.
47. Varki A. Glycan-based interactions involving vertebrate sialic-acid-recognizing proteins. Nature. 2007;446(7139):1023–9.
48. Wuhrer M, Stam JC, van de Geijn FE, Koeleman CA, Verrips CT,Dolhain RJ, et al. Glycosylation profiling of immunoglobulin G(IgG) subclasses from human serum. Proteomics. 2007;7(22):4070–81.
49. Ruhaak LR, Uh H-W, Beekman M, Koeleman CA, Hokke CH,Westendorp RG, et al. Decreased levels of bisecting GlcNAcglycoforms of IgG are associated with human longevity. PLoSOne. 2010;5(9), e12566.
50. Arnold JN, Wormald MR, Suter DM, Radcliffe CM, Harvey DJ,Dwek RA, et al. Human serum IgM glycosylation identification ofglycoforms that can bind to mannan-binding lectin. J Biol Chem.2005;280(32):29080–7.
51. Chapman A, Kornfeld R. Structure of the high mannose oligosac-charides of a human IgM myeloma protein. I. The major oligosac-charides of the two high mannose glycopeptides. J Biol Chem.1979;254(3):816–23.
52. Chapman A, Kornfeld R. Structure of the high mannose oligosac-charides of a human IgM myeloma protein. II. The minor oligosac-charides of high mannose glycopeptide. J Biol Chem. 1979;254(3):824–8.
53. Carrell RW, Jeppsson J-O, Laurell C-B, Brennan SO, Owen MC,Vaughan L, et al. Structure and variation of human alpha 1-antitrypsin. Nature. 1982;298(5872):329–34.
54. Gettins PG. Serpin structure, mechanism, and function. Chem Rev.2002;102(12):4751–804.
55. Sarkar A,Wintrode PL. Effects of glycosylation on the stability andflexibility of a metastable protein: the human serpin α 1−antitrypsin. Int J Mass Spectrom. 2011;302(1):69–75.
56. Kwon K-S, Kim J, Shin HS, Yu M-H. Single amino acid substitu-tions of alpha 1-antitrypsin that confer enhancement in thermalstability. J Biol Chem. 1994;269(13):9627–31.
57. Carrell R, Jeppsson J-O, Vaughan L, Brennan S, OwenM, BoswellD. Human α 1−antitrypsin: carbohydrate attachment and sequencehomology. FEBS Lett. 1981;135(2):301–3.
58. Kolarich D, Turecek PL, Weber A, Mitterer A, Graninger M,Matthiessen P, et al. Biochemical, molecular characterization, andglycoproteomic analyses of α1‐proteinase inhibitor products usedfor replacement therapy*. Transfusion. 2006;46(11):1959–77.
Quantitation of human milk proteins and glycoproteins 605
59. Kolarich D, Weber A, Turecek PL, Schwarz HP, Altmann F.Comprehensive glyco‐proteomic analysis of human α1‐antitrypsin and its charge isoforms. Proteomics. 2006;6(11):3369–80.
60. Woof JM, Kerr MA. IgA function–variations on a theme.Immunology. 2004;113(2):175–7.
61. Kerr M. The structure and function of human IgA. Biochem J.1990;271(2):285.
62. Rebecchi KR, Wenke JL, Go EP, Desaire H. Label-free quantita-tion: a new glycoproteomics approach. J Am Soc Mass Spectrom.2009;20(6):1048–59.
63. Roth Z, Yehezkel G, Khalaila I. Identification and quantification ofprotein glycosylation. Int J Carbohydrate Chem. 2012
64. Stavenhagen K, Hinneburg H, Thaysen‐Andersen M, HartmannL, Silva DV, Fuchser J, et al. Quantitative mapping of glyco-protein micro-heterogeneity and macro-heterogeneity: an eval-uation of mass spectrometry signal strengths using syntheticpeptides and glycopeptides. J Mass Spectrom. 2013;48(6):627–39.
65. Räihä NC. Nutritional proteins in milk and the protein requirementof normal infants. Pediatrics. 1985;75(1):136–41.
66. Hambraeus L, Lönnerdal B, Forsum E, Gebre‐Medhin M. Nitrogenand protein components of human milk. Acta Paediatr. 1978;67(5):561–5.
67. Cuillière M-L, Abbadi M, Molé C, Montagne P, Béné M-C, FaureG. Microparticle-enhanced nephelometric immunoassay of alpha-lactalbumin in human milk. J Immunoass Immunochem.1997;18(1):97–109.
68. Koenig Á, de Albuquerque Diniz EM, Barbosa SFC, Vaz FAC.Immunologic factors in human milk: the effects of gestational ageand pasteurization. J Hum Lact. 2005;21(4):439–43.
69. Rai D, Adelman AS, Zhuang W, Rai GP, Boettcher J, Lönnerdal B.Longitudinal changes in lactoferrin concentrations in humanmilk—a global systematic review. Crit Rev Food Sci Nutr. (just-accepted) 2013.
70. Smilowitz JT, Totten SM, Huang J, Grapov D, Durham HA,Lammi-Keefe CJ, et al. Human milk secretory immunoglobulin Aand lactoferrin N-glycans are altered in women with gestationaldiabetes mellitus. J Nutr. 2013;143(12):1906–12.
71. Nwosu CC, Aldredge DL, Lee H, Lerno LA, Zivkovic AM,German JB, et al. Comparison of the human and bovine milk N-glycome via high-performance microfluidic chip liquid chromatog-raphy and tandem mass spectrometry. J Proteome Res. 2012;11(5):2912–24.
72. Bezouška K, Sklenář J, Novák P, Halada P, Havlíček V, Kraus M,et al. Determination of the complete covalent structure of the majorglycoform of DQH sperm surface protein, a novel trypsin-resistantboar seminal plasma O-glycoprotein related to pB1 protein. ProteinSci. 1999;8(7):1551–6.
73. Cauchi MR, Henchal E, Wright PJ. The sensitivity of cell-associated dengue virus proteins to trypsin and the detection oftrypsin-resistant fragments of the nonstructural glycoprotein NS1.Virology. 1991;180(2):659–67.
74. Loo TW, Clarke DM. The human multidrug resistance P-glycoprotein is inactive when its maturation is inhibited: potentialfor a role in cancer chemotherapy. FASEB J. 1999;13(13):1724–32.
606 J. Huang et al.