quantifying sustainability of dairy farms with the ... · quantifying sustainability of dairy farms...
TRANSCRIPT
1
Quantifying sustainability of dairyfarms with the DAIRYMAN-Sustainability-Index (DSI)
Elsäßer et al., 2012
Authors
Martin Elsaesser, Thomas Jilg, Katja HerrmannLAZBW Aulendorf (Ge)
Jeff BoonenLycée Agricole Ettelbruck (Lu)
Lies DebruyneILVO Merelbeke (Be)
Scott LaidlawAFBI Belfast (Northern Ireland)
Frans AartsWUR Plant Research International (NL)
Elsaesser et al., 2015
2
Elsäßer et al., 2012
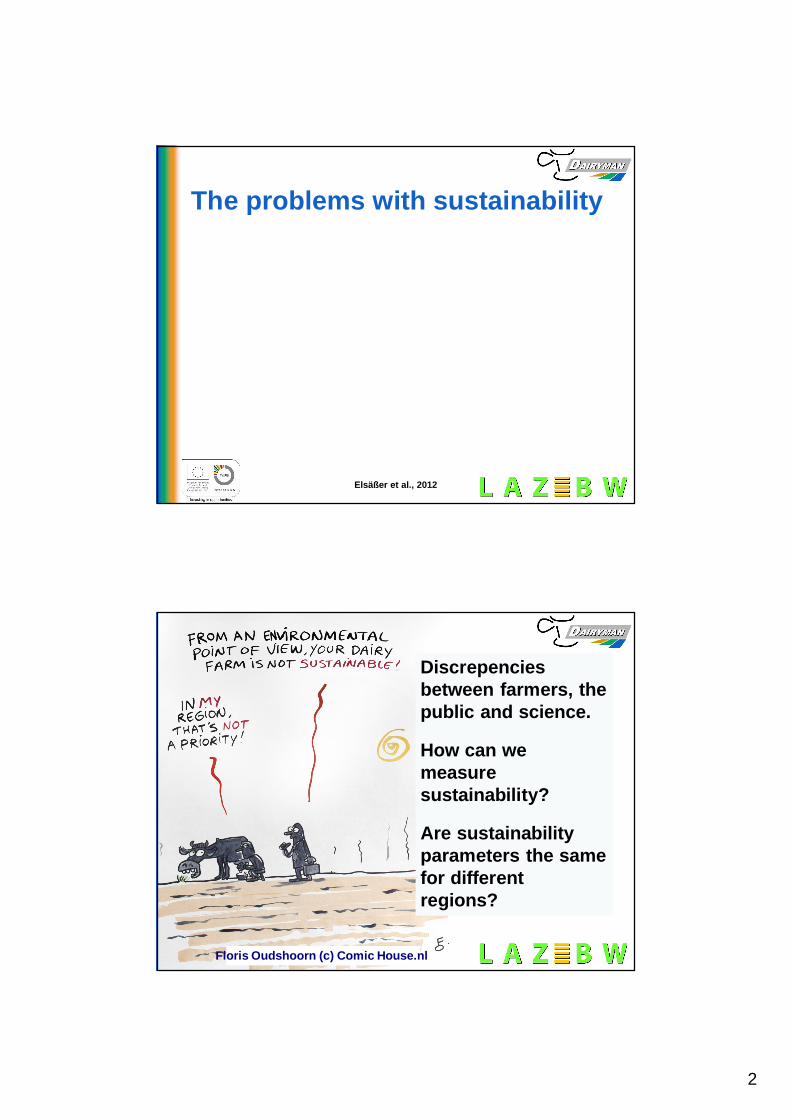
The problems with sustainability
Elsäßer et al., 20124Floris Oudshoorn (c) Comic House.nl
Discrepenciesbetween farmers, thepublic and science.
How can wemeasuresustainability?
Are sustainabilityparameters the samefor differentregions?
3
Elsäßer et al., 2012
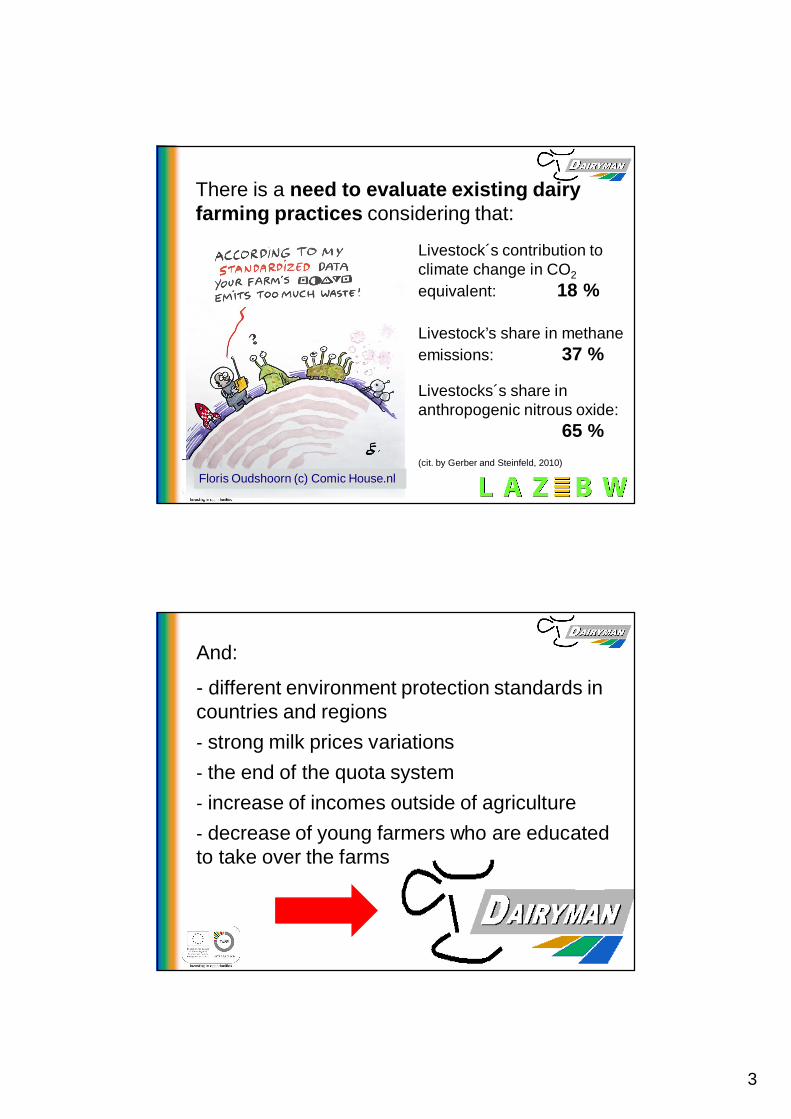
There is a need to evaluate existing dairyfarming practices considering that:
5
Livestock´s contribution toclimate change in CO2
equivalent: 18 %
Livestock’s share in methaneemissions: 37 %
Livestocks´s share inanthropogenic nitrous oxide:
65 %(cit. by Gerber and Steinfeld, 2010)
Floris Oudshoorn (c) Comic House.nl
Elsäßer et al., 2012
And:
- different environment protection standards incountries and regions- strong milk prices variations- the end of the quota system- increase of incomes outside of agriculture- decrease of young farmers who are educatedto take over the farms
4
Elsäßer et al., 2012
Floris Oudshoorn (c) Comic House.nl
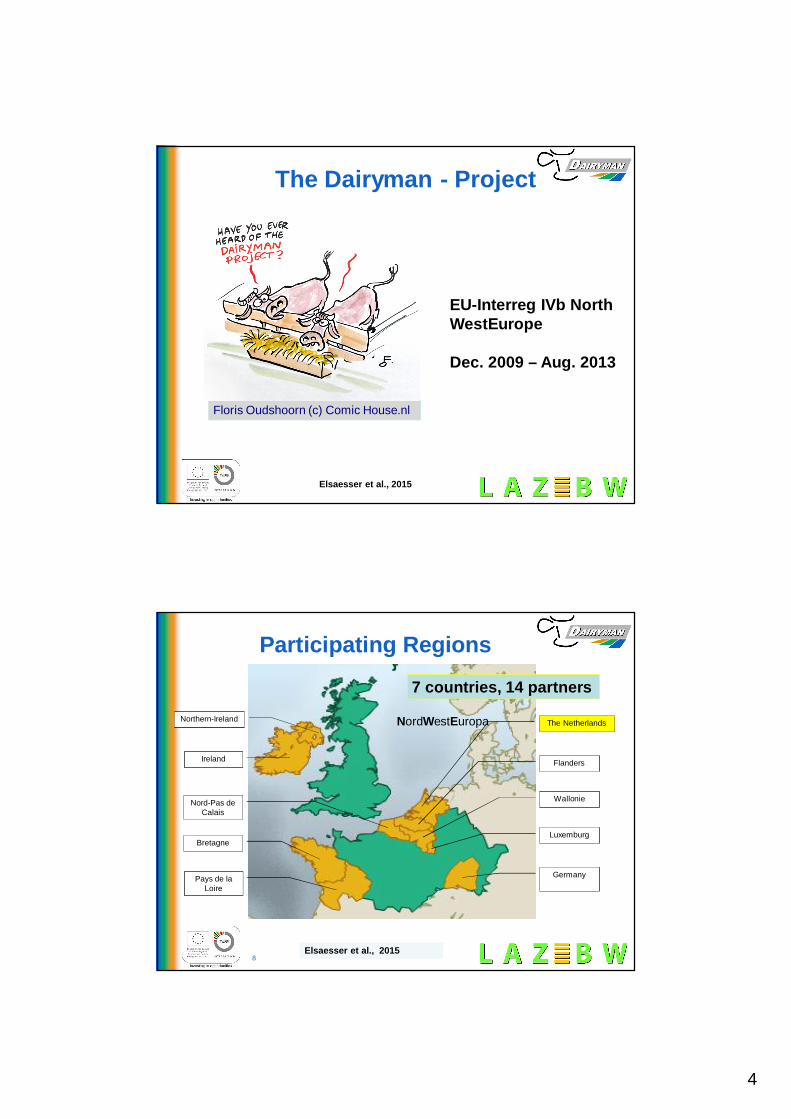
The Dairyman - Project
7
EU-Interreg IVb NorthWestEurope
Dec. 2009 – Aug. 2013
Elsaesser et al., 2015
Elsäßer et al., 2012
The Netherlands
Wallonie
Luxemburg
Germany
Northern-Ireland
Ireland
Pays de laLoire
Flanders
Nord-Pas deCalais
Bretagne
Participating Regions
NordWestEuropa
8Elsaesser et al., 2015
7 countries, 14 partners
5
Elsäßer et al., 2012
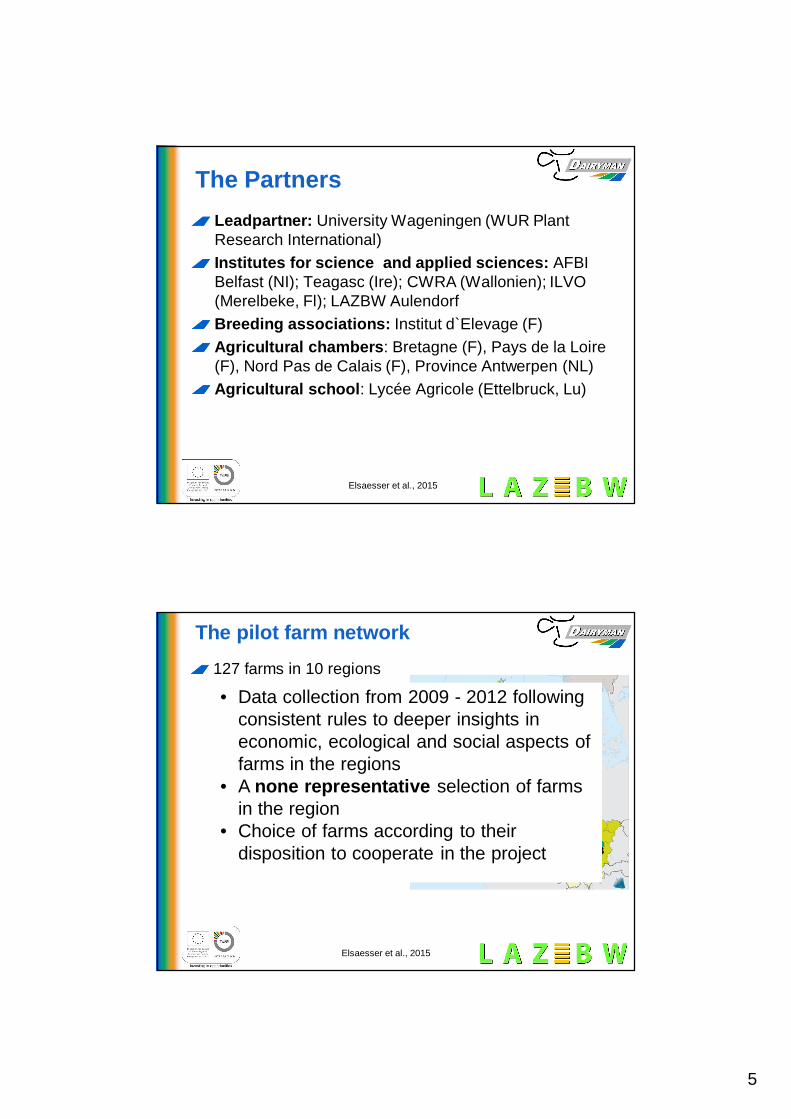
The PartnersLeadpartner: University Wageningen (WUR PlantResearch International)Institutes for science and applied sciences: AFBIBelfast (NI); Teagasc (Ire); CWRA (Wallonien); ILVO(Merelbeke, Fl); LAZBW AulendorfBreeding associations: Institut d`Elevage (F)Agricultural chambers: Bretagne (F), Pays de la Loire(F), Nord Pas de Calais (F), Province Antwerpen (NL)Agricultural school: Lycée Agricole (Ettelbruck, Lu)
Elsäßer et al., 2014Elsaesser et al., 2015
Elsäßer et al., 2012
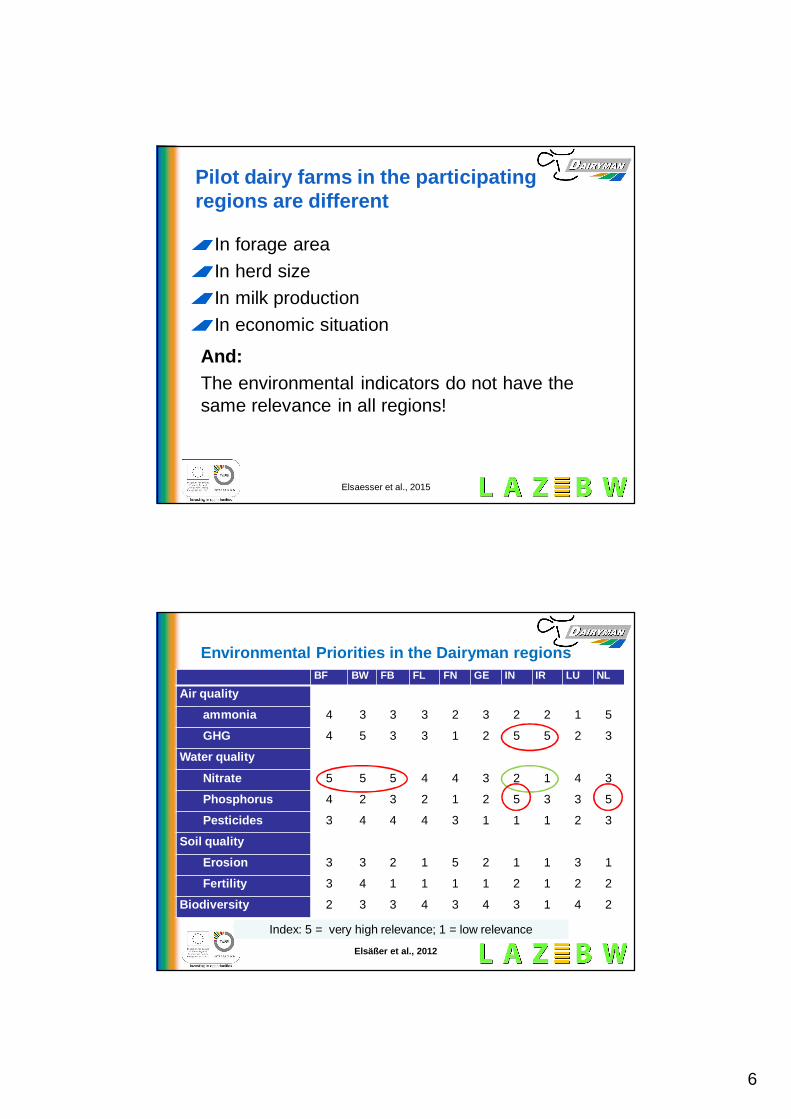
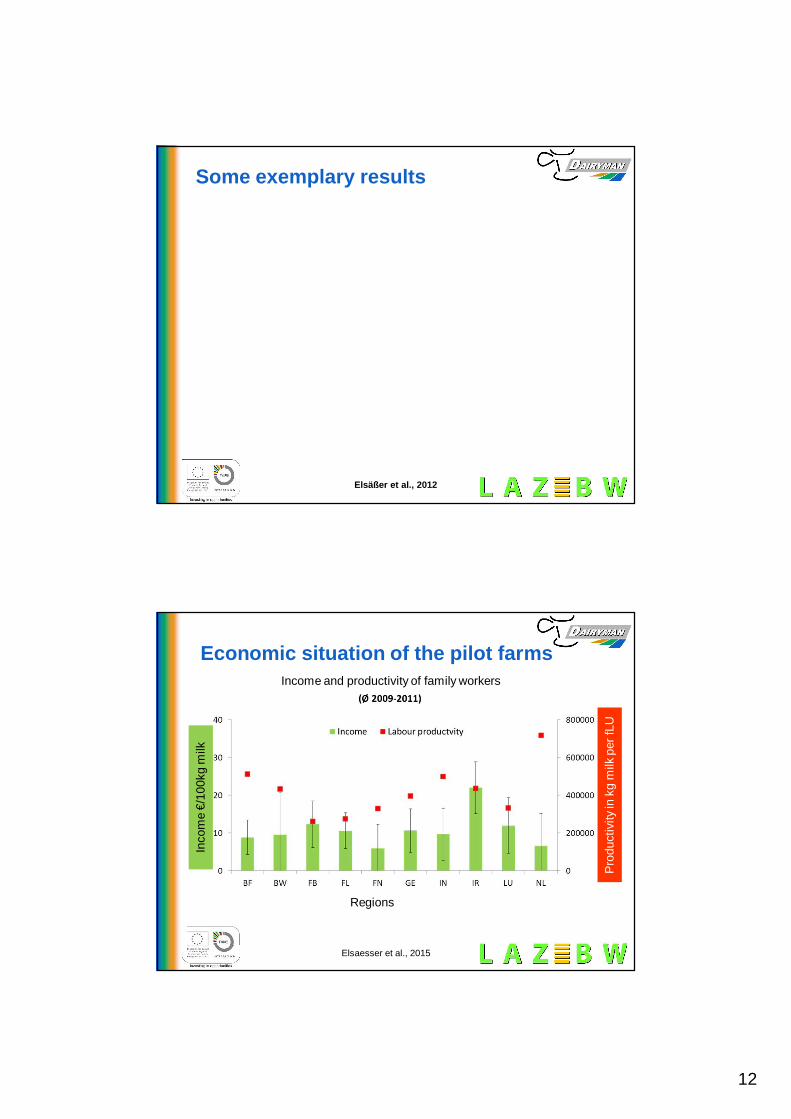
The pilot farm network127 farms in 10 regions
Flanders: BFWallonie: BWBretagne: FBPays de la Loire: FLNord-Pas de Calais: FNIreland: IRNorthern-Ireland: INBaden-Württemberg: GELuxemburg: LUThe Netherlands: NL
Elsäßer et al., 2014
• Data collection from 2009 - 2012 followingconsistent rules to deeper insights ineconomic, ecological and social aspects offarms in the regions
• A none representative selection of farmsin the region
• Choice of farms according to theirdisposition to cooperate in the project
Elsaesser et al., 2015
6
Elsäßer et al., 2012
Pilot dairy farms in the participatingregions are different
In forage areaIn herd sizeIn milk productionIn economic situation
11
And:The environmental indicators do not have thesame relevance in all regions!
Elsaesser et al., 2015
Elsäßer et al., 2012
Phosphorus
BF BW FB FL FN GE IN IR LU NL
Air qualityammonia 4 3 3 3 2 3 2 2 1 5
GHG 4 5 3 3 1 2 5 5 2 3
Water quality
Nitrate 5 5 5 4 4 3 2 1 4 3
Phosphorus 4 2 3 2 1 2 5 3 3 5
Pesticides 3 4 4 4 3 1 1 1 2 3
Soil qualityErosion 3 3 2 1 5 2 1 1 3 1
Fertility 3 4 1 1 1 1 2 1 2 2
Biodiversity 2 3 3 4 3 4 3 1 4 2
Index: 5 = very high relevance; 1 = low relevance
Environmental Priorities in the Dairyman regions
7
Elsäßer et al., 2012
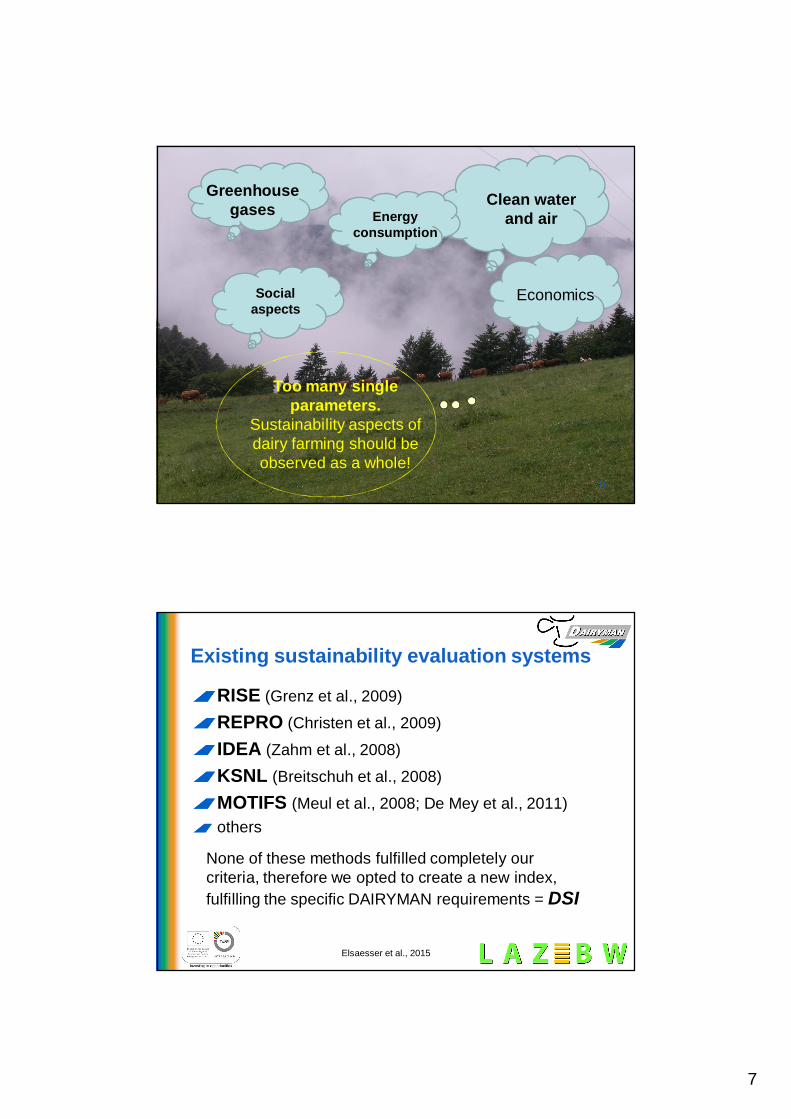
Too many singleparameters.
Sustainability aspects ofdairy farming should beobserved as a whole!
Greenhousegases Clean water
and air
13
Socialaspects
Energyconsumption
Economics
Elsäßer et al., 2012
Existing sustainability evaluation systems
RISE (Grenz et al., 2009)
REPRO (Christen et al., 2009)
IDEA (Zahm et al., 2008)
KSNL (Breitschuh et al., 2008)
MOTIFS (Meul et al., 2008; De Mey et al., 2011)others
None of these methods fulfilled completely ourcriteria, therefore we opted to create a new index,fulfilling the specific DAIRYMAN requirements = DSI
Elsaesser et al., 2015
8
Elsäßer et al., 2012
Stages in the DSI development process
1. Agreement on weighting of the ecological, economicand social aspects of sustainability
2. Choice of sustainability indicators3. Deciding on the contribution of each indicator within
the appropriate sustainability aspect (scoring)4. Benchmarking (Determination for targets to attain of
each indicator)Very long discussions
Elsäßer et al., 2012
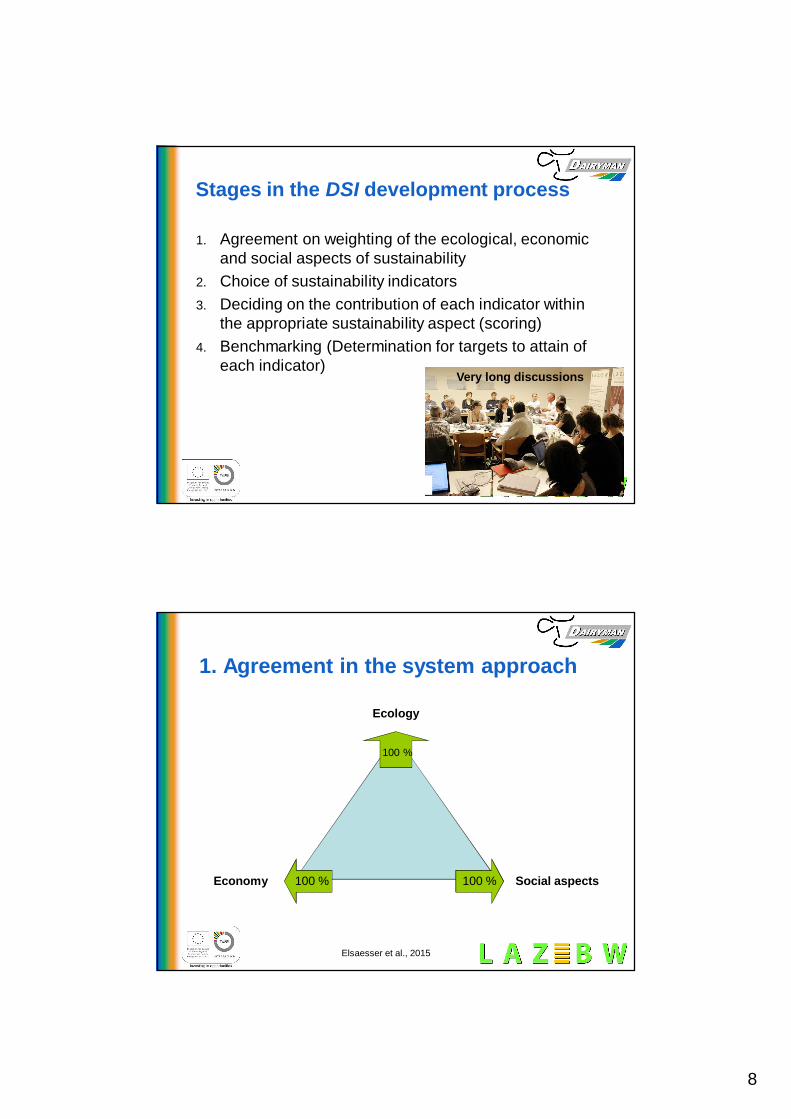
1. Agreement in the system approach
Ecology
Economy Social aspects100 % 100 %
100 %
Elsaesser et al., 2015
9
Elsäßer et al., 2012
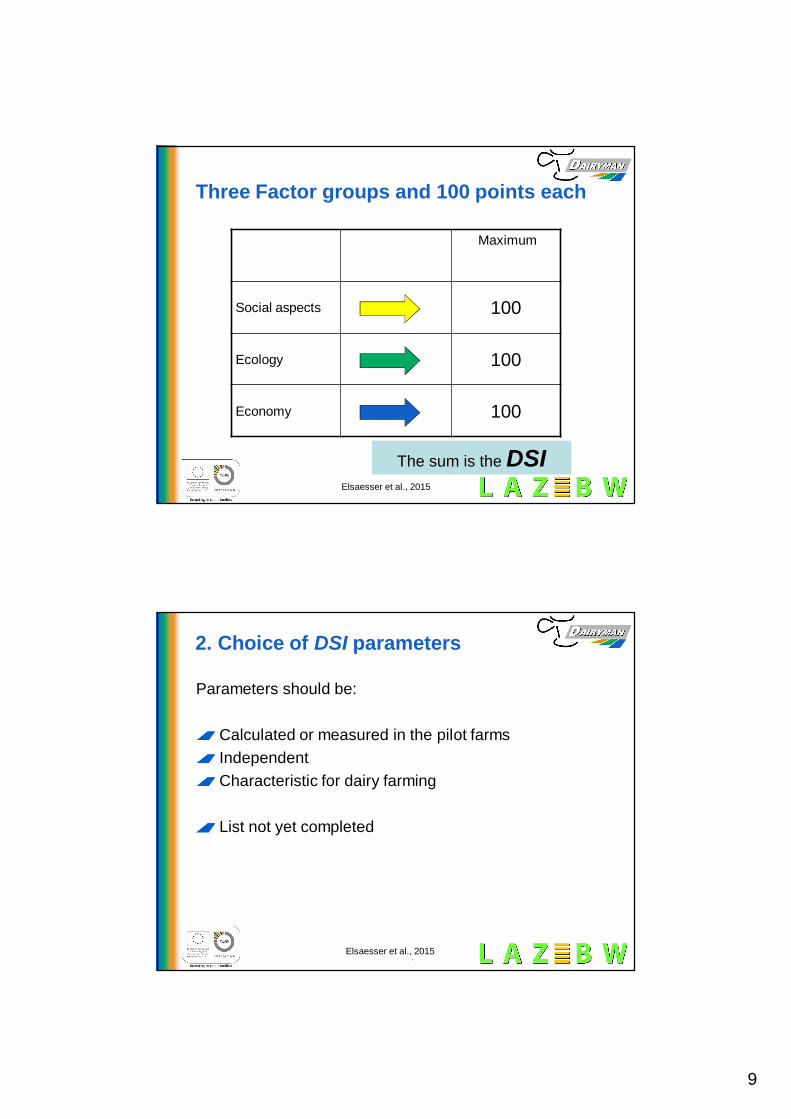
Three Factor groups and 100 points each
Maximum
Social aspects 100
Ecology 100
Economy 100
The sum is the DSIElsaesser et al., 2015
Elsäßer et al., 2012
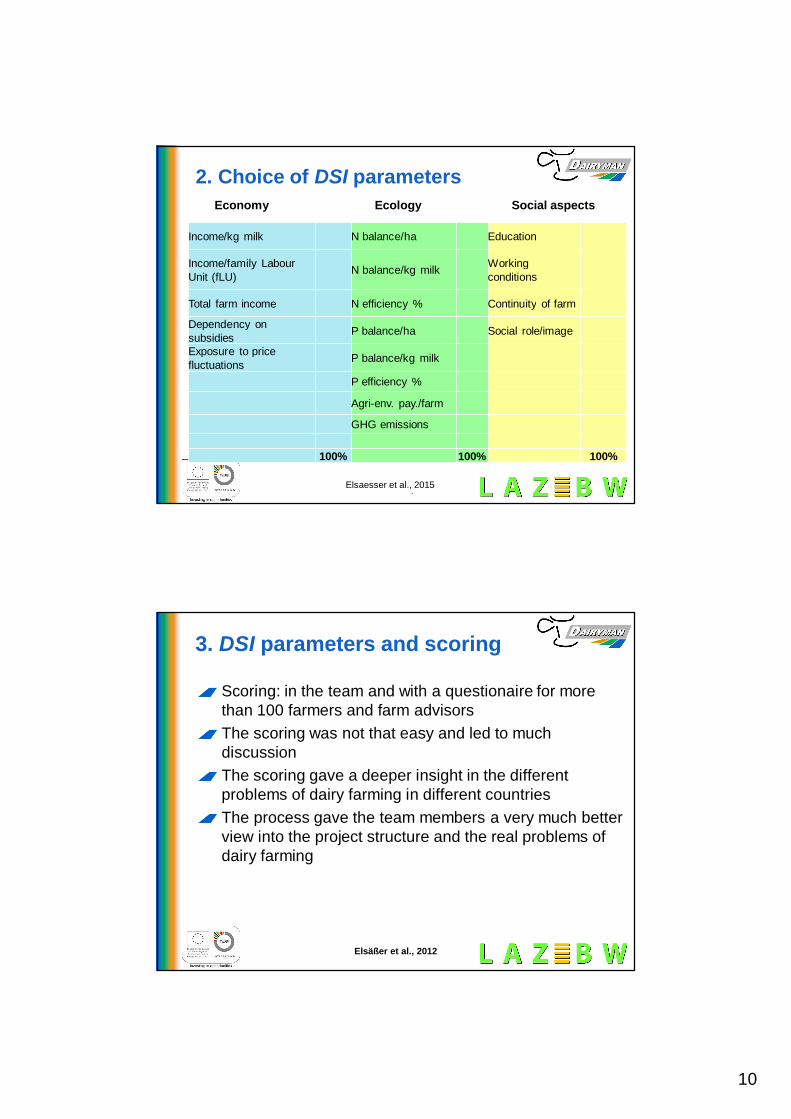
2. Choice of DSI parameters
Elsaesser et al., 2015Elsaesser et al., 2015
Parameters should be:
Calculated or measured in the pilot farmsIndependentCharacteristic for dairy farming
List not yet completed
10
Elsäßer et al., 2012
2. Choice of DSI parameters
Income/kg milk N balance/ha Education
Income/family LabourUnit (fLU) N balance/kg milk Working
conditions
Total farm income N efficiency % Continuity of farm
Dependency onsubsidies P balance/ha Social role/image
Exposure to pricefluctuations P balance/kg milk
P efficiency %
Agri-env. pay./farm
GHG emissions
100% 100% 100%
Economy Ecology Social aspects
Elsaesser et al., 2015Elsaesser et al., 2015
Elsäßer et al., 2012
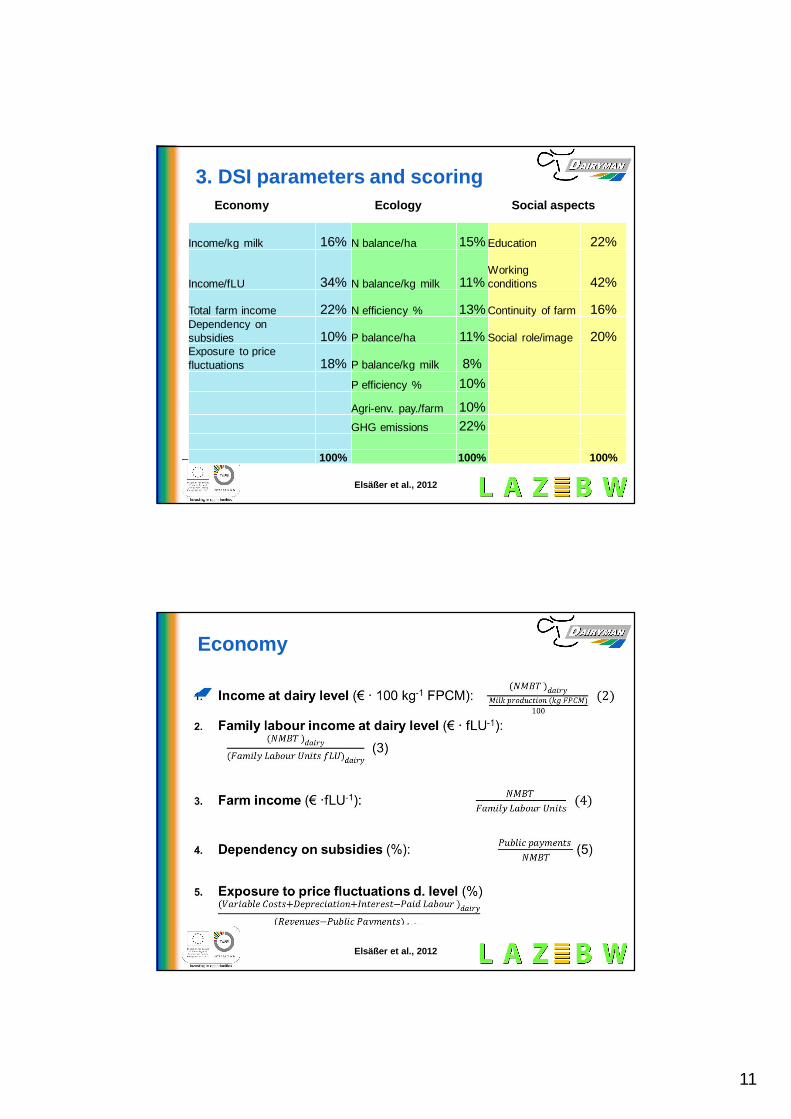
3. DSI parameters and scoring
Scoring: in the team and with a questionaire for morethan 100 farmers and farm advisorsThe scoring was not that easy and led to muchdiscussionThe scoring gave a deeper insight in the differentproblems of dairy farming in different countriesThe process gave the team members a very much betterview into the project structure and the real problems ofdairy farming
11
Elsäßer et al., 2012
3. DSI parameters and scoring
Income/kg milk 16% N balance/ha 15% Education 22%
Income/fLU 34% N balance/kg milk 11%Workingconditions 42%
Total farm income 22% N efficiency % 13% Continuity of farm 16%Dependency onsubsidies 10% P balance/ha 11% Social role/image 20%Exposure to pricefluctuations 18% P balance/kg milk 8%
P efficiency % 10%
Agri-env. pay./farm 10%GHG emissions 22%
100% 100% 100%
Economy Ecology Social aspects
Elsäßer et al., 2012
Economy
12
Elsäßer et al., 2012
Some exemplary results
Elsäßer et al., 201224
Economic situation of the pilot farms
Elsaesser et al., 2015
Inco
me
€/10
0kg
milk
Income and productivity of family workers
Prod
uctiv
ityin
kg
milk
per
fLU
Regions
13
Elsäßer et al., 2012
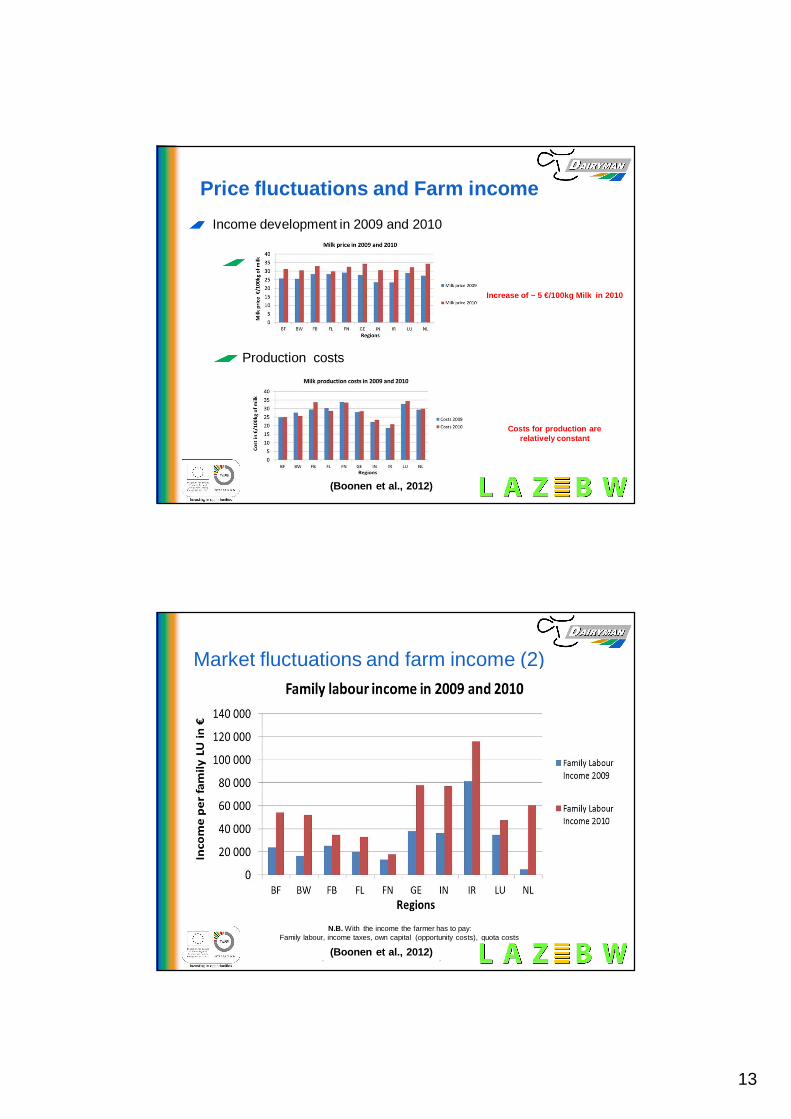
Price fluctuations and Farm incomeIncome development in 2009 and 2010
Milchpreis in den Dairyman-Regionen
Production costs
Increase of ~ 5 €/100kg Milk in 2010
Costs for production arerelatively constant
25(Boonen et al., 2012)(Boonen et al., 2012)
Elsäßer et al., 2012
Market fluctuations and farm income (2)Einkommensentwicklungin den Jahren 2009/2010
N.B. With the income the farmer has to pay:Family labour, income taxes, own capital (opportunity costs), quota costs
(Boonen et al., 2012)(Boonen et al., 2012)
14
Elsäßer et al., 2012
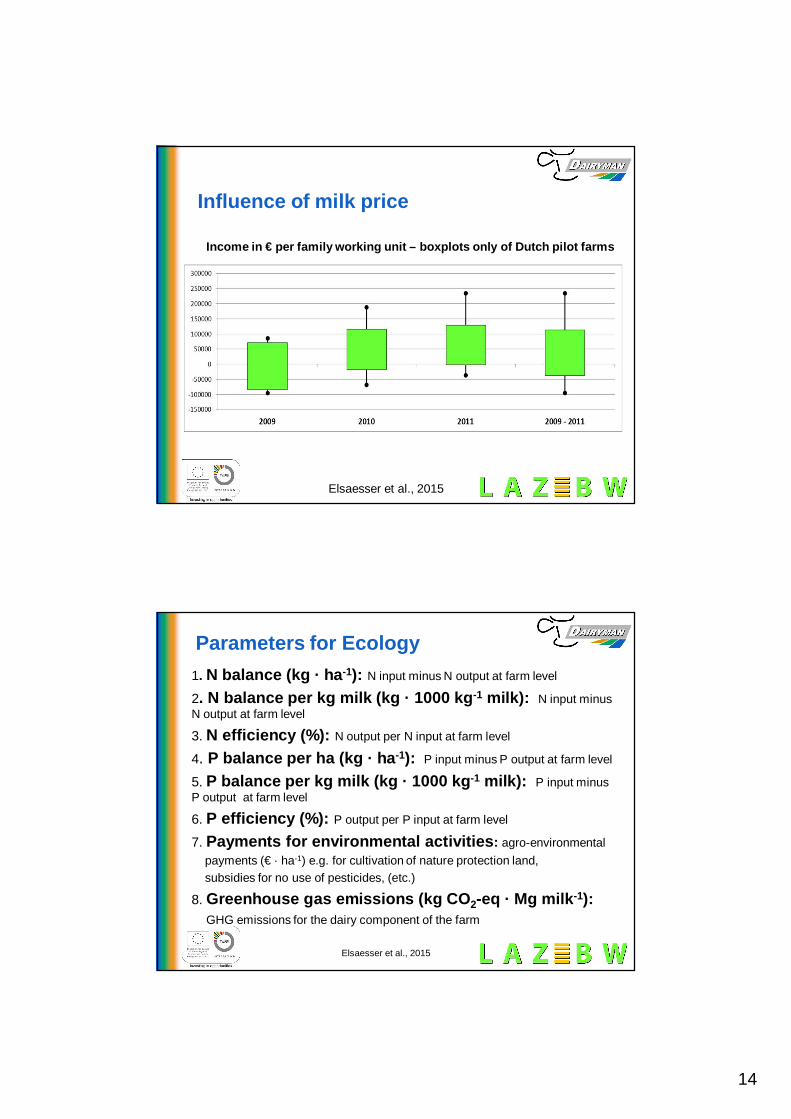
Influence of milk price
Income in € per family working unit – boxplots only of Dutch pilot farms
Elsaesser et al., 2015
Elsäßer et al., 2012
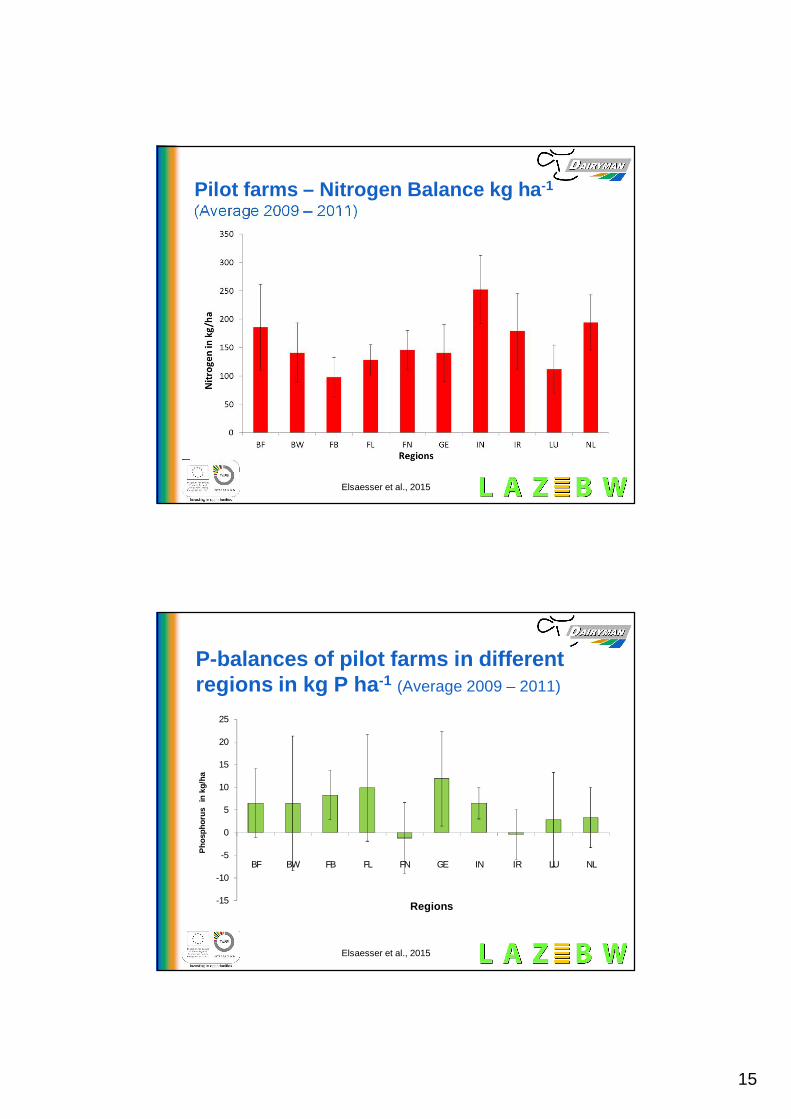
Parameters for Ecology1. N balance (kg · ha-1): N input minus N output at farm level
2. N balance per kg milk (kg · 1000 kg-1 milk): N input minusN output at farm level
3. N efficiency (%): N output per N input at farm level
4. P balance per ha (kg · ha-1): P input minus P output at farm level
5. P balance per kg milk (kg · 1000 kg-1 milk): P input minusP output at farm level
6. P efficiency (%): P output per P input at farm level
7. Payments for environmental activities: agro-environmentalpayments (€ · ha-1) e.g. for cultivation of nature protection land,subsidies for no use of pesticides, (etc.)
8. Greenhouse gas emissions (kg CO2-eq · Mg milk-1):GHG emissions for the dairy component of the farm
Elsaesser et al., 2015
15
Elsäßer et al., 2012
Pilot farms – Nitrogen Balance kg ha-1
(Average 2009 – 2011)
29Elsäßer et al., 2014Elsaesser et al., 2015
Elsäßer et al., 2012
-15
-10
-5
0
5
10
15
20
25
BF BW FB FL FN GE IN IR LU NL
Phos
phor
us i
n kg
/ha
Regions
P-balances of pilot farms in differentregions in kg P ha-1 (Average 2009 – 2011)
Elsaesser et al., 2015
16
Elsäßer et al., 2012
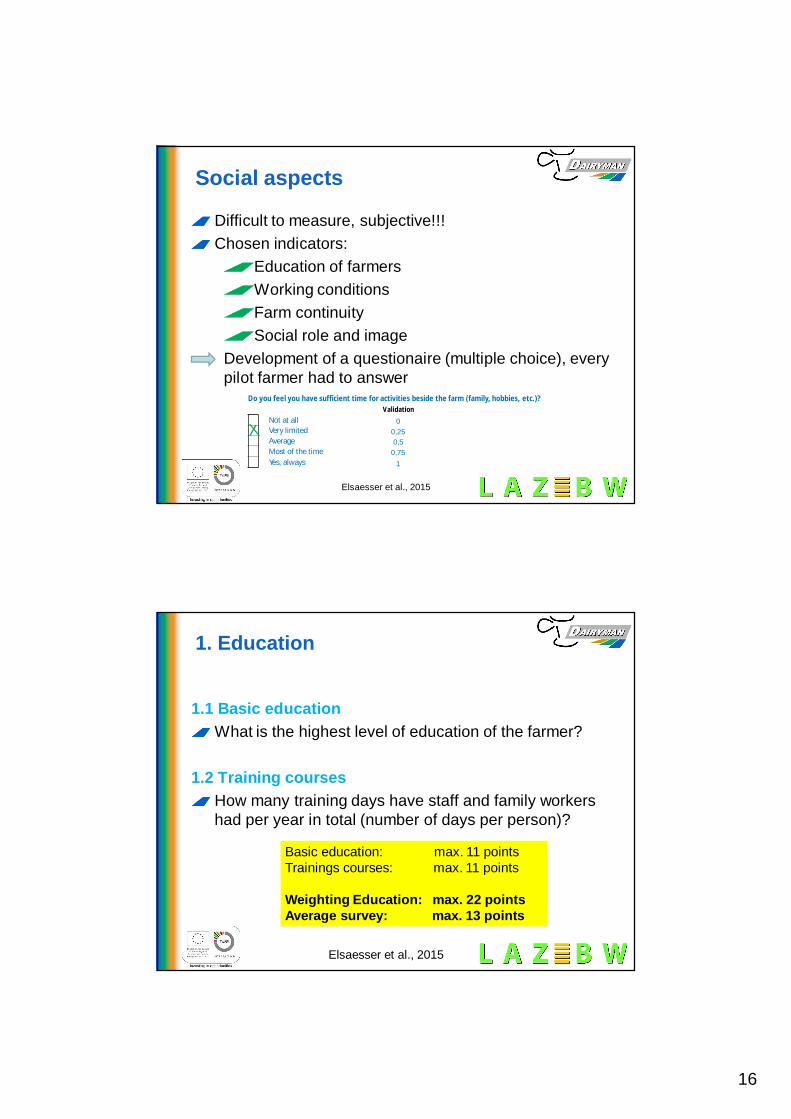
Difficult to measure, subjective!!!Chosen indicators:
Education of farmersWorking conditionsFarm continuitySocial role and image
Development of a questionaire (multiple choice), everypilot farmer had to answer
31
Do you feel you have sufficient time for activities beside the farm (family, hobbies, etc.)?Validation
Not at all 0Very limited 0,25Average 0,5Most of the time 0,75Yes, always 1
Social aspects
Elsaesser et al., 2015
Elsäßer et al., 2012
1. Education
1.1 Basic educationWhat is the highest level of education of the farmer?
1.2 Training coursesHow many training days have staff and family workershad per year in total (number of days per person)?
Basic education: max. 11 pointsTrainings courses: max. 11 points
Weighting Education: max. 22 pointsAverage survey: max. 13 points
Elsaesser et al., 2015
17
Elsäßer et al., 2012
2. Working conditions:weighting
Work load: max. 6 pointsPersonal satisfaction: max. 19 pointsHolidays: max. 6 pointsFree time: max. 6 pointsHealth issues: max. 5 points
Weighting working conditions: max. 42 points
Elsäßer et al., 2012
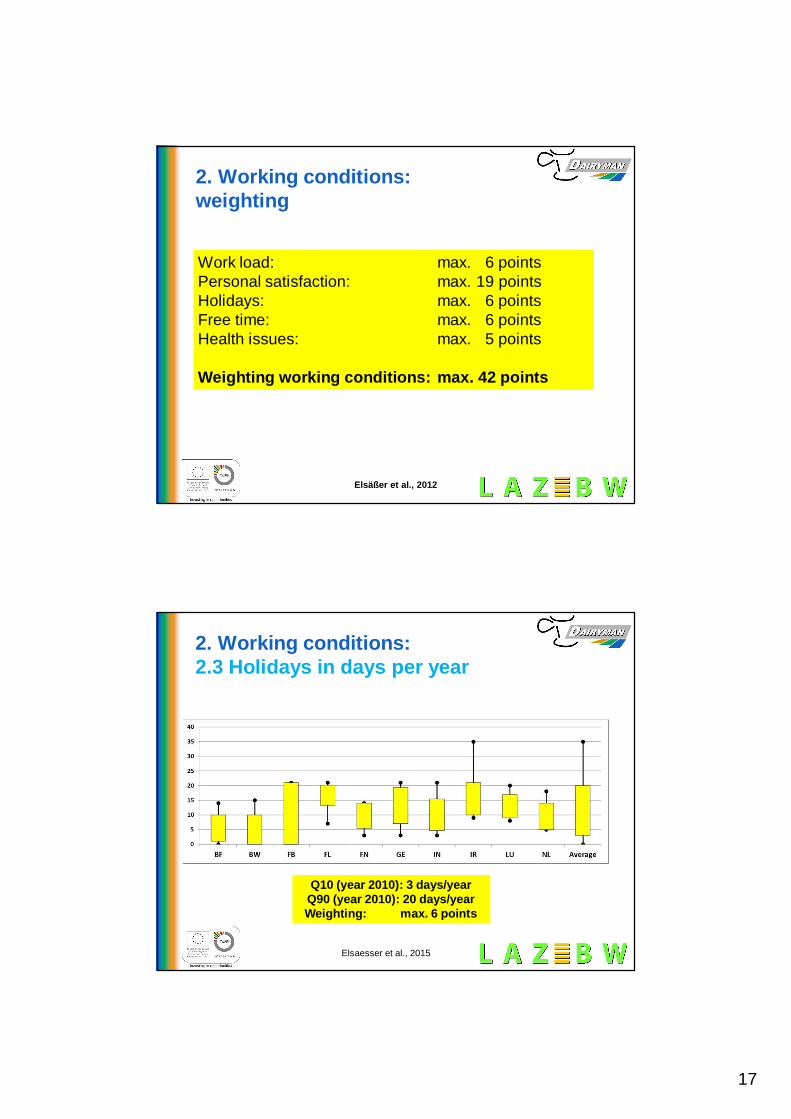
2. Working conditions:2.3 Holidays in days per year
Q10 (year 2010): 3 days/yearQ90 (year 2010): 20 days/yearWeighting: max. 6 points
Elsaesser et al., 2015
18
Elsäßer et al., 2012
4. Social role and image
How many people visit your farm per year (e.g. farmwalks, open days, etc.)?How many means / instruments of communication /publicity do you use to reach general public / improvemutual understanding (e.g. open days, farm walks,information boards, website, farm shop, farmers’markets, research / demonstration projects)?How is your relation to other farmers in your area?How are you / your farm business accepted by theregional population?
Each question: max. 5 pointsWeighting social role: max. 20 pointsAverage survey: max. 13 points
Elsaesser and Herrmann 2013Elsaesser et al., 2015
Elsäßer et al., 2012Elsäßer et al., 2014
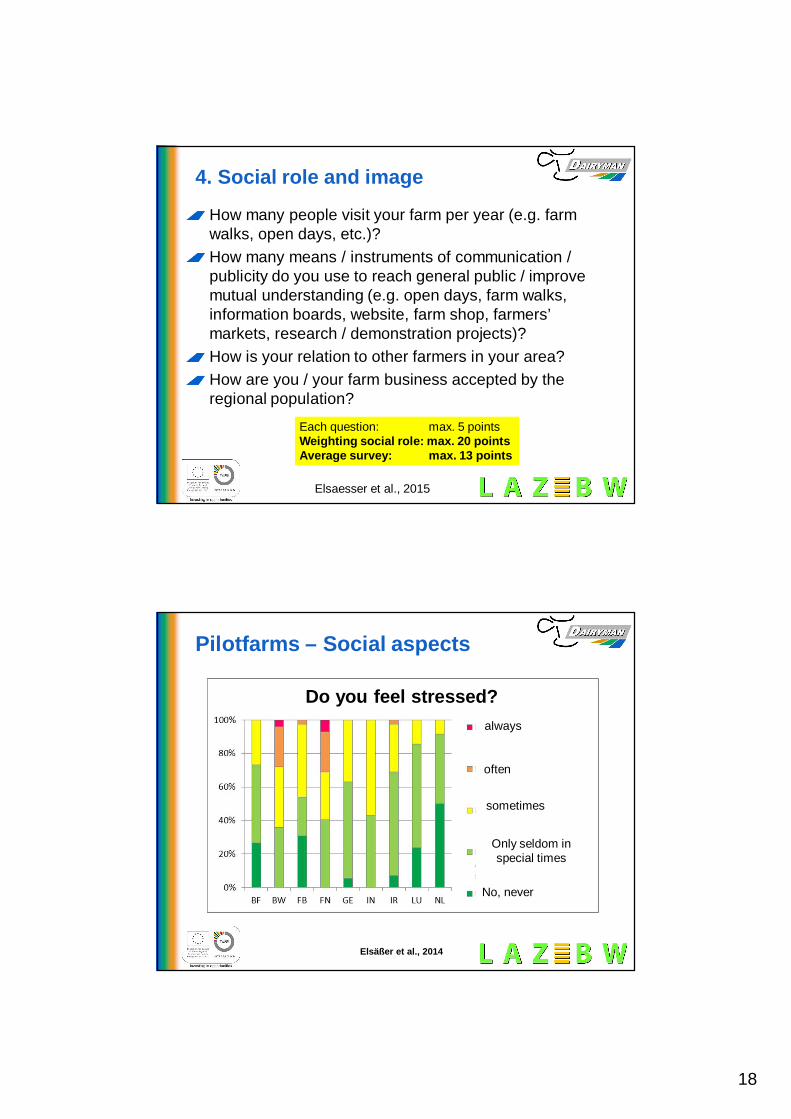
Pilotfarms – Social aspects
Do you feel stressed?always
often
sometimes
No, never
Only seldom inspecial times
19
Elsäßer et al., 2012
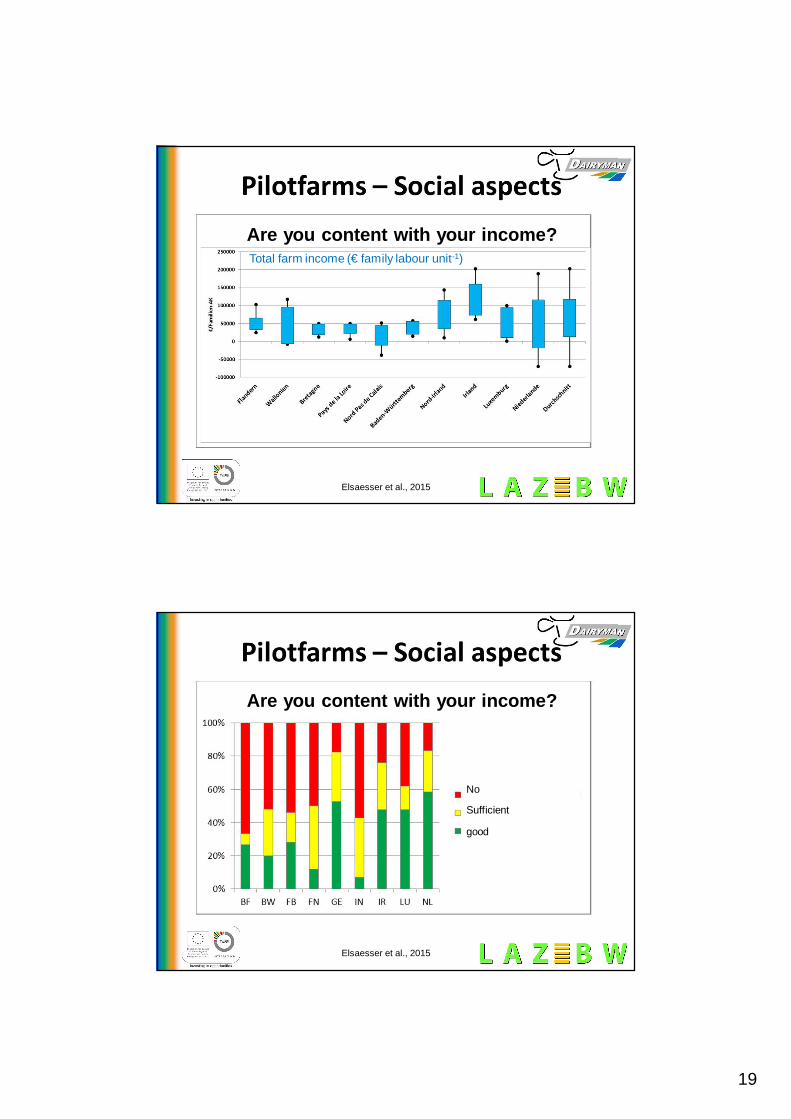
Are you content with your income?
No
Sufficient
good
Elsaesser et al., 2015
Total farm income (€ family labour unit-1)
Elsäßer et al., 2012
Are you content with your income?
No
Sufficient
good
Elsaesser et al., 2015
20
Elsäßer et al., 2012
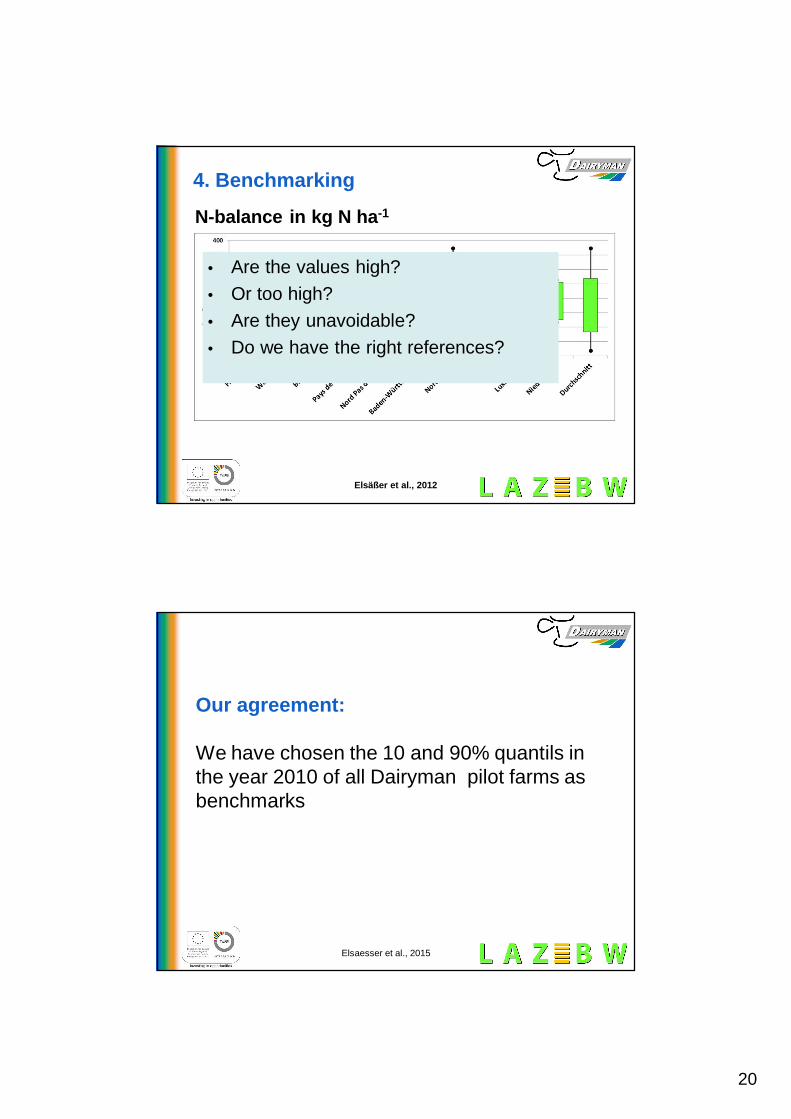
4. Benchmarking
N-balance in kg N ha-1
• Are the values high?• Or too high?• Are they unavoidable?• Do we have the right references?
Elsäßer et al., 2012
Our agreement:
We have chosen the 10 and 90% quantils inthe year 2010 of all Dairyman pilot farms asbenchmarks
Elsaesser et al., 2015
21
Elsäßer et al., 2012
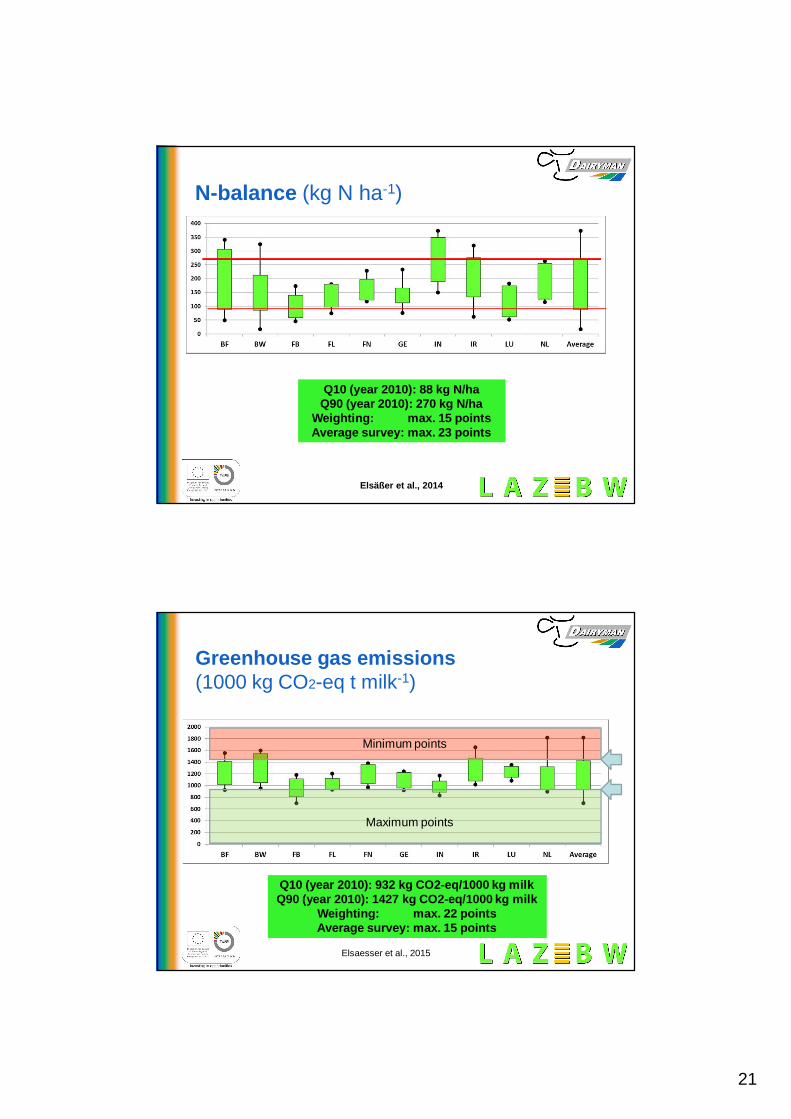
N-balance (kg N ha-1)
Q10 (year 2010): 88 kg N/haQ90 (year 2010): 270 kg N/ha
Weighting: max. 15 pointsAverage survey: max. 23 points
Elsäßer et al., 2014
Elsäßer et al., 2012
Greenhouse gas emissions(1000 kg CO2-eq t milk-1)
Q10 (year 2010): 932 kg CO2-eq/1000 kg milkQ90 (year 2010): 1427 kg CO2-eq/1000 kg milk
Weighting: max. 22 pointsAverage survey: max. 15 points
Elsaesser et al., 2015
Minimum points
Maximum points
22
Elsäßer et al., 2012
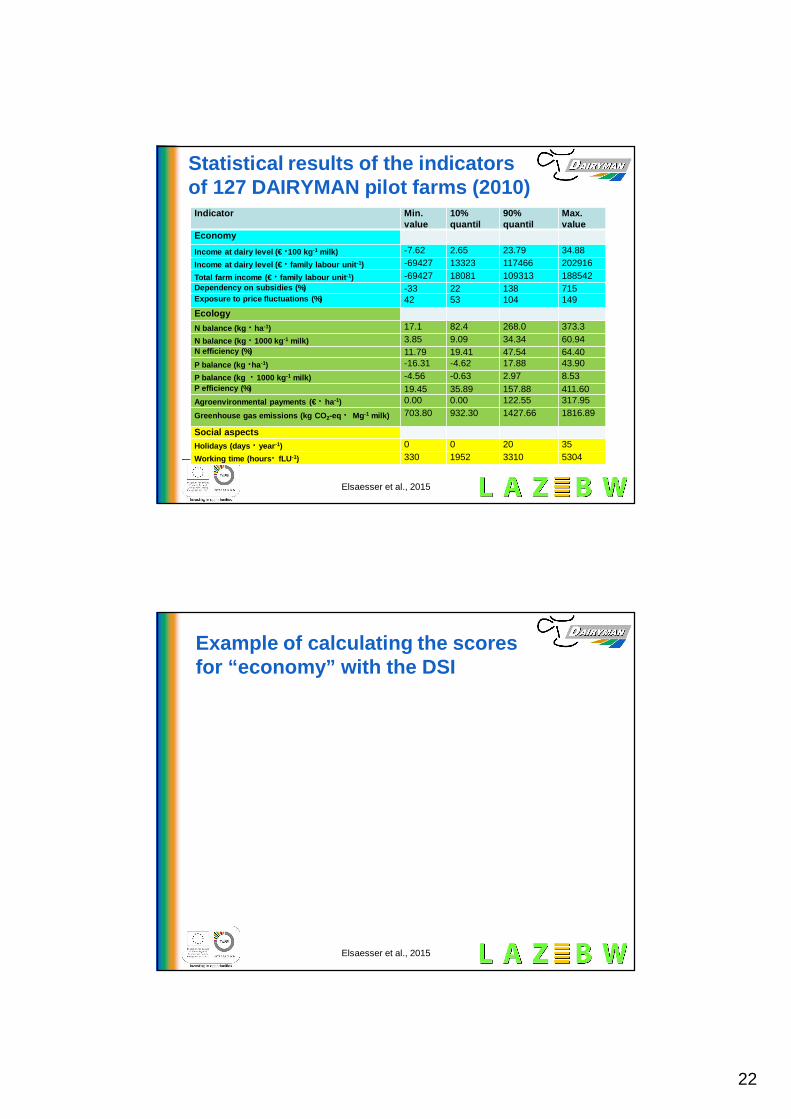
Statistical results of the indicatorsof 127 DAIRYMAN pilot farms (2010)
Indicator Min.value
10%quantil
90%quantil
Max.value
EconomyIncome at dairy level (€ ·100 kg-1 milk) -7.62 2.65 23.79 34.88Income at dairy level (€ · family labour unit-1) -69427 13323 117466 202916Total farm income (€ · family labour unit-1) -69427 18081 109313 188542Dependency on subsidies (%) -33 22 138 715Exposure to price fluctuations (%) 42 53 104 149EcologyN balance (kg · ha-1) 17.1 82.4 268.0 373.3N balance (kg · 1000 kg-1 milk) 3.85 9.09 34.34 60.94N efficiency (%) 11.79 19.41 47.54 64.40P balance (kg ·ha-1) -16.31 -4.62 17.88 43.90P balance (kg · 1000 kg-1 milk) -4.56 -0.63 2.97 8.53P efficiency (%) 19.45 35.89 157.88 411.60Agroenvironmental payments (€ · ha-1) 0.00 0.00 122.55 317.95Greenhouse gas emissions (kg CO2-eq · Mg-1 milk) 703.80 932.30 1427.66 1816.89
Social aspectsHolidays (days · year-1) 0 0 20 35Working time (hours· fLU-1) 330 1952 3310 5304
Elsaesser et al., 2015
Elsäßer et al., 2012
Example of calculating the scoresfor “economy” with the DSI
Elsaesser et al., 2015
23
Elsäßer et al., 2012
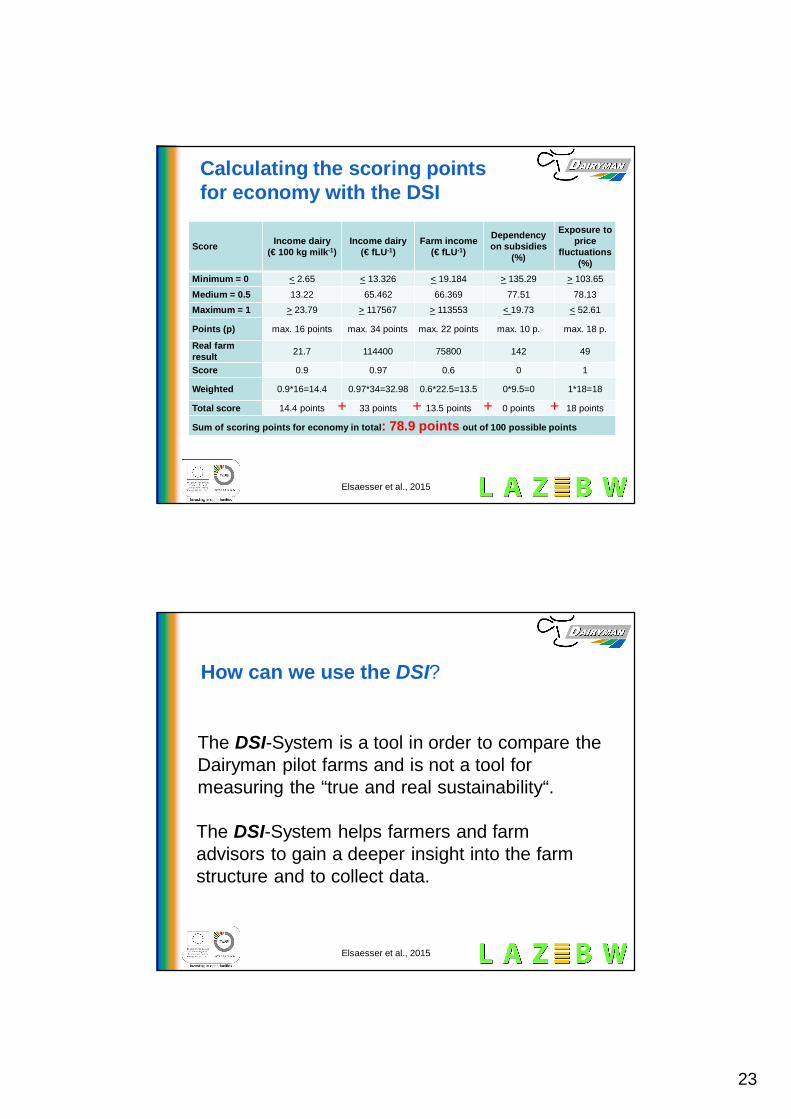
Calculating the scoring pointsfor economy with the DSI
Score Income dairy(€ 100 kg milk-1)
Income dairy(€ fLU-1)
Farm income(€ fLU-1)
Dependencyon subsidies
(%)
Exposure toprice
fluctuations(%)
Minimum = 0 < 2.65 < 13.326 < 19.184 > 135.29 > 103.65
Medium = 0.5 13.22 65.462 66.369 77.51 78.13Maximum = 1 > 23.79 > 117567 > 113553 < 19.73 < 52.61
Points (p) max. 16 points max. 34 points max. 22 points max. 10 p. max. 18 p.
Real farmresult 21.7 114400 75800 142 49
Score 0.9 0.97 0.6 0 1
Weighted 0.9*16=14.4 0.97*34=32.98 0.6*22.5=13.5 0*9.5=0 1*18=18
Total score 14.4 points 33 points 13.5 points 0 points 18 points
Sum of scoring points for economy in total: 78.9 points out of 100 possible points
+ + + +
Elsaesser et al., 2015
Elsäßer et al., 2012
How can we use the DSI?
The DSI-System is a tool in order to compare theDairyman pilot farms and is not a tool formeasuring the “true and real sustainability“.
Elsaesser et al., 2015
The DSI-System helps farmers and farmadvisors to gain a deeper insight into the farmstructure and to collect data.
24
Elsäßer et al., 2012
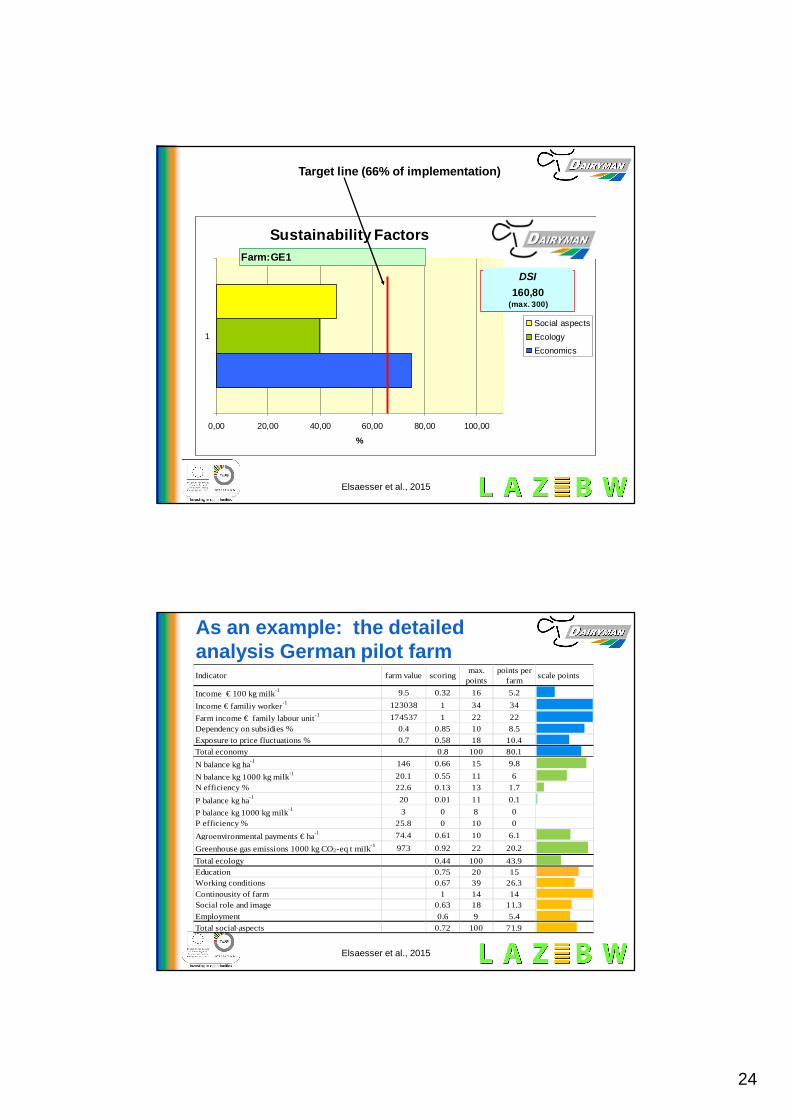
Sustainability Factors
0,00 20,00 40,00 60,00 80,00 100,00
1
%
Social aspectsEcologyEconomics
Total S-Value:160,80
(max. 300)
Farm:GE1
Target line (66% of implementation)
Elsaesser et al., 2015
DSI
Elsäßer et al., 2012
As an example: the detailedanalysis German pilot farmIndicator farm value scoring max.
pointspoints per
farm scale points
Income € 100 kg milk-1 9.5 0.32 16 5.2
Income € familiy worker-1 123038 1 34 34Farm income € family labour unit-1 174537 1 22 22Dependency on subsidies % 0.4 0.85 10 8.5Exposure to price fluctuations % 0.7 0.58 18 10.4Total economy 0.8 100 80.1N balance kg ha-1 146 0.66 15 9.8
N balance kg 1000 kg milk-1 20.1 0.55 11 6N efficiency % 22.6 0.13 13 1.7P balance kg ha-1 20 0.01 11 0.1P balance kg 1000 kg milk-1 3 0 8 0P efficiency % 25.8 0 10 0Agroenvironmental payments € ha-1 74.4 0.61 10 6.1
Greenhouse gas emissions 1000 kg CO2-eq t milk-1 973 0.92 22 20.2Total ecology 0.44 100 43.9Education 0.75 20 15Working conditions 0.67 39 26.3Continousity of farm 1 14 14Social role and image 0.63 18 11.3Employment 0.6 9 5.4Total social aspects 0.72 100 71.9
Elsaesser et al., 2015
25
Elsäßer et al., 2012
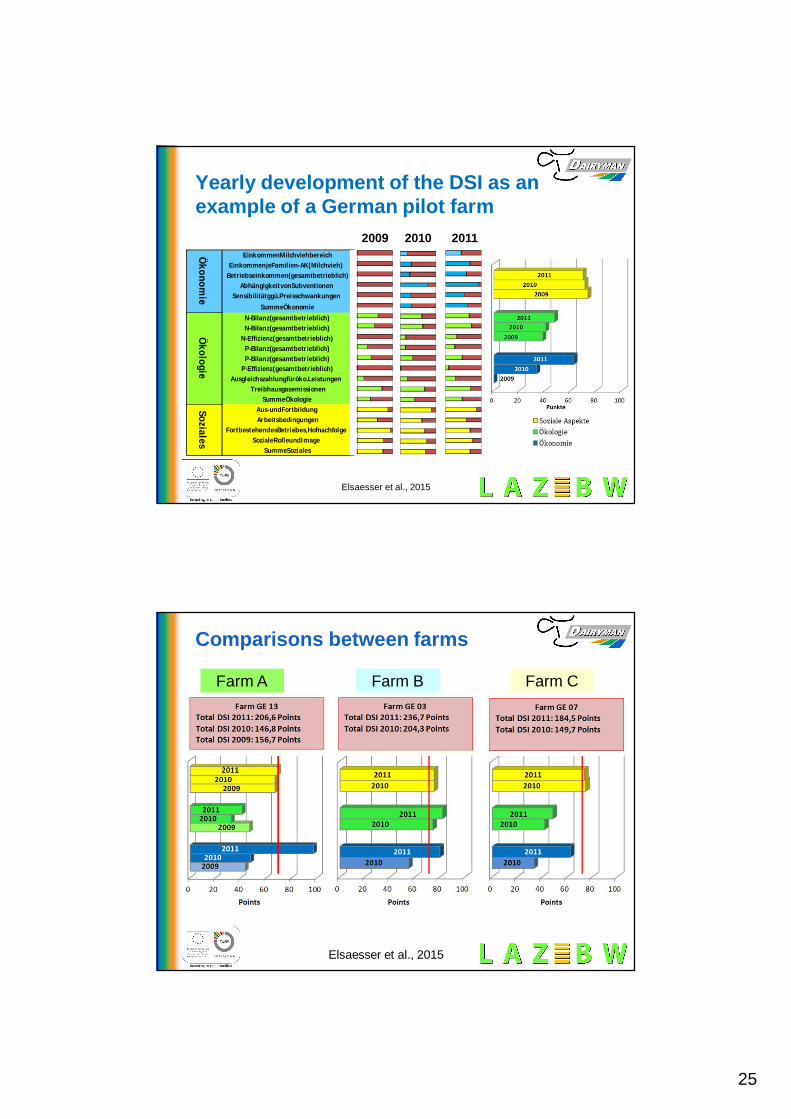
Yearly development of the DSI as anexample of a German pilot farm
Ökonom
ie
EinkommenMilchviehbereichEinkommenjeFamilien-AK(Milchvieh)
Betriebseinkommen(gesamtbetrieblich)AbhängigkeitvonSubventionen
Sensibilitätggü.PreisschwankungenSummeÖkonomie
P-Bilanz(gesamtbetrieblich)P-Bilanz(gesamtbetrieblich)
P-Effizienz(gesamtbetrieblich)Ausgleichszahlungfüröko.Leistungen
SummeÖkologie
Soziales
Aus-undFortbildungArbeitsbedingungen
FortbestehendesBetriebes,HofnachfolgeSozialeRolleundImage
SummeSoziales
Ökologie
N-Bilanz(gesamtbetrieblich)N-Bilanz(gesamtbetrieblich)
N-Effizienz(gesamtbetrieblich)
Treibhausgasemissionen
2009 2010 2011
Elsaesser et al., 2015
Elsäßer et al., 2012
Comparisons between farms
Farm A Farm B Farm C
Elsaesser et al., 2015
26
Elsäßer et al., 2012
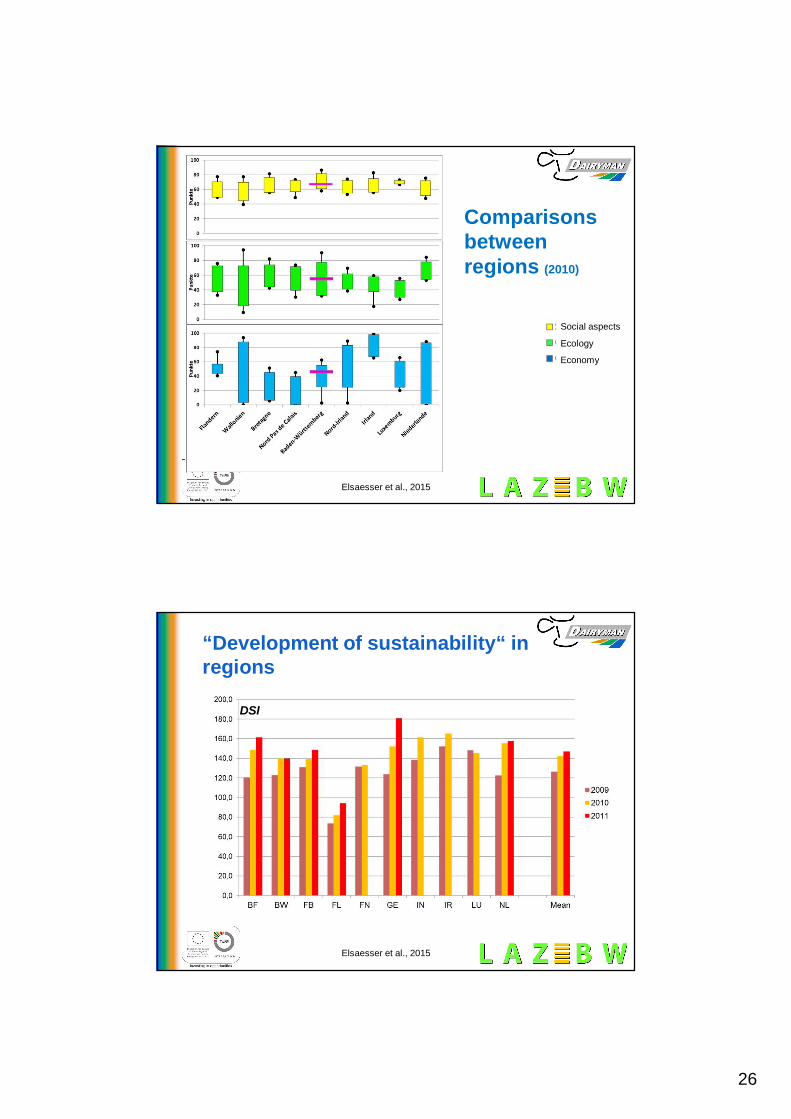
Comparisonsbetweenregions (2010)
Social aspects
Ecology
Economy
Elsaesser et al., 2015
Elsäßer et al., 2012
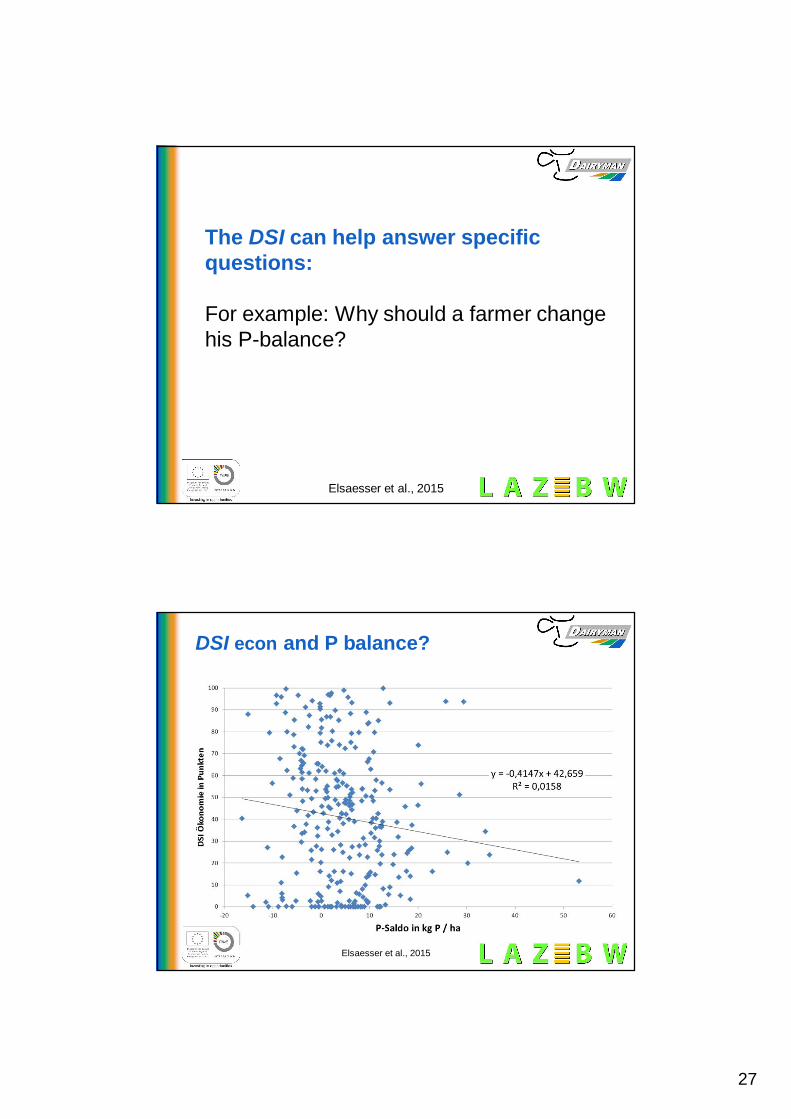
“Development of sustainability“ inregions
Elsaesser et al., 2015
DSI
27
Elsäßer et al., 2012
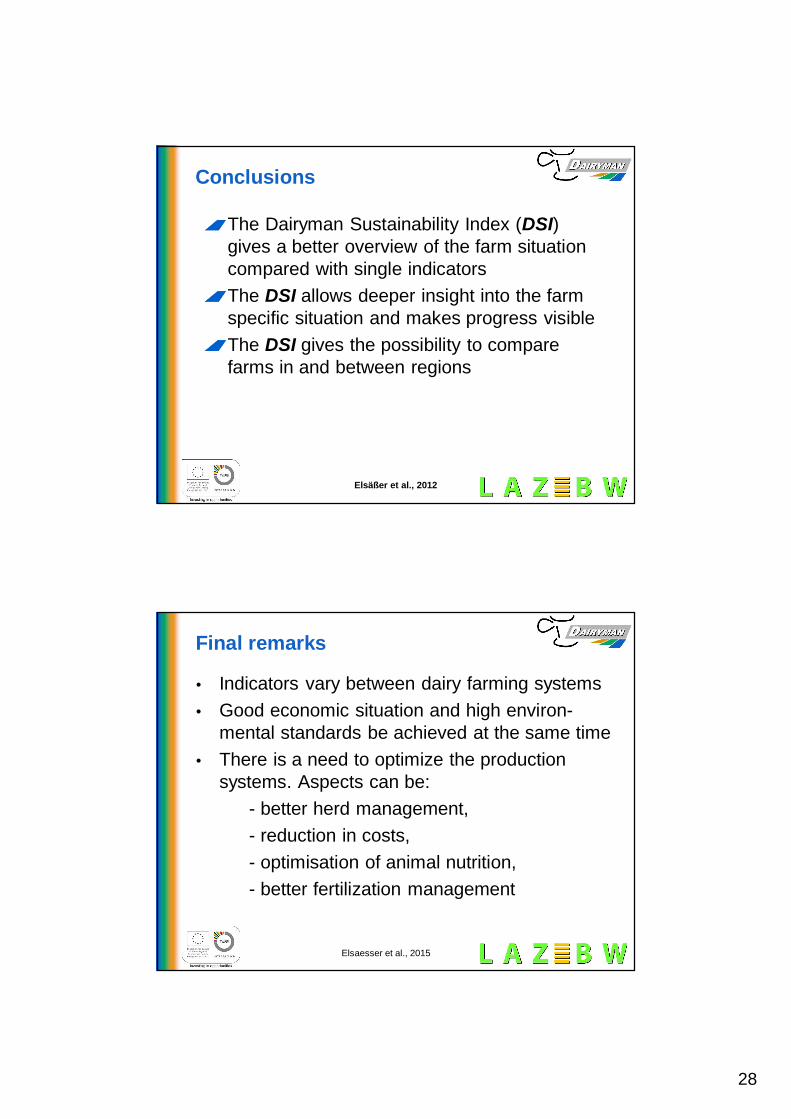
The DSI can help answer specificquestions:
For example: Why should a farmer changehis P-balance?
Elsäßer et al., 2014Elsaesser et al., 2015
Elsäßer et al., 2012
DSI econ and P balance?
Elsäßer et al., 2014Elsaesser et al., 2015
28
Elsäßer et al., 2012
Conclusions
The Dairyman Sustainability Index (DSI)gives a better overview of the farm situationcompared with single indicatorsThe DSI allows deeper insight into the farmspecific situation and makes progress visibleThe DSI gives the possibility to comparefarms in and between regions
Elsäßer et al., 2012
Final remarks
• Indicators vary between dairy farming systems• Good economic situation and high environ-
mental standards be achieved at the same time• There is a need to optimize the production
systems. Aspects can be:- better herd management,- reduction in costs,- optimisation of animal nutrition,- better fertilization management
Elsaesser et al., 2015
29
Elsäßer et al., 2012
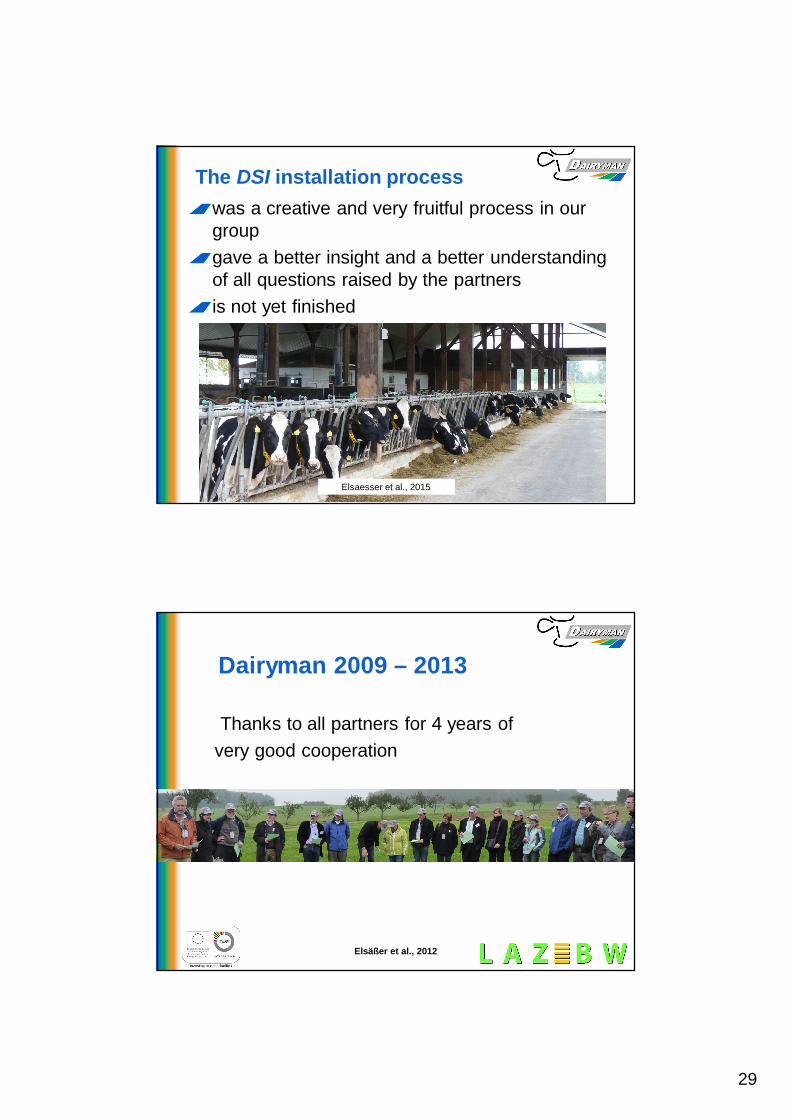
The DSI installation processwas a creative and very fruitful process in ourgroupgave a better insight and a better understandingof all questions raised by the partnersis not yet finished
Elsaesser et al., 2015
Elsäßer et al., 2012
Thanks to all partners for 4 years ofvery good cooperation
Dairyman 2009 – 2013
30
Elsäßer et al., 2012Elsaesser et al., 2015
Thanks to you in the audience for listening!