quantification of the effect of soil organic matter content on soil productivity
TRANSCRIPT

Quantification of the Effect of Soil Organic Matter Contenton Soil Productivity
Armand Bauer* and A. L. Black
ABSTRACTThe positive effects of soil organic matter (OM) on soil properties
that influence crop performance are well documented. But definitiveand quantitative information of differential effects of soil OM contentsis lacking for the northern Great Plains. The objective of this studywas to quantify the contribution of a unit quantity of soil OM toproductivity. Experiments were conducted on Williams loam (fine-loamy, mixed, Typic Argiboroll) for 4 yr in the same field. The var-iables were soil OM content of the upper 30.5 cm together with allcombinations of three postplanting soil available N levels (55, 90, and125 kg N ha-1 as NO3-N to 1.2 m) and three water levels. Water levelswere uniformly maintained with a trickle system that independentlymetered water to each plot for each soil available N level. Pretilleringspring wheat (Triticum aestivum L.) plant population decreased as soilOM content decreased in 3 of 4 yr. On an annual basis, highest totalaerial dry matter and grain yields were associated with highest OMcontents. The contribution of 1 Mg OM ha ' to soil productivity,across the range of 64 to 142 Mg OM ha'1, was calculated as equiv-alent to 35.2 kg ha"1 for spring wheat total aerial dry matter and 15.6kg ha ' for grain yield. Loss of productivity associated with a deple-tion of soil OM in the northern Great Plains is primarily a conse-quence of a concomitant loss of fertility.
THE LITERATURE on soil organic matter is repletewith references to the positive effects of this com-
ponent on soil chemical, physical, and biologicalproperties that, in turn, contribute to improved cropyields (Stevenson, 1982a,b). As a chemical reservoir,there is universal acknowledgment that OM is the ma-jor indigenous source of soil available N, that it con-tains as much as 65% of the total soil P, and providessignificant amounts of S and other nutrients essentialfor plant growth. Also universally accepted is that theC fraction is used by soil microorganisms as a majorenergy source for metabolic activity, in the processaltering nutrient availability and soil structure (Paul,1991). Because of an effect of OM on soil structure,soil physical properties also can be altered.
Although numerous studies make reference to thepositive effects of soil OM on crop yields, there islittle quantitative information on the contribution ofan increment of soil OM to crop-soil productivity.Some, like Langdale et al. (1979) and Verity and An-derson (1990), made comparisons among soil OMcontents that included more than one soil type in theexperiment. Others, like Mielke and Schepers (1986)and Tanaka and Aase (1989) compared topsoil thick-ness from the same soil type, but the physical distur-bance involved to establish the topsoil variable wasgreater than the disturbance from customary tillage.In both approaches, both having merit, the contribu-tion of soil OM content per se to the outcome of theexperiment was confounded with another factor.
Interest in the contribution of soil OM content to
USDA-ARS Northern Great Plains Research Lab., Box 459, Man-dan, ND 58554. Received 4 June 1992. 'Corresponding author.
Published in Soil Sci. Soc. Am. J. 58:185-193 (1994).
soil productivity stems from the implementation ofPublic Law 95-192, the Soil and Water ResourcesConservation Act of 1977 (Meyer et al., 1985). Soilerosion in the northern Great Plains is deemed to di-minish soil productivity through the concomitant di-minishing of soil OM content. Thus, the contributionof a unit increment of soil OM content to soil pro-ductivity can simultaneously be inferred to representthe loss of productivity associated with soil erosionwhen the extent of soil OM loss is known.
The objective of this study was to quantify the con-tribution of a unit increment of soil OM content tosoil productivity by evaluation of spring wheat totalaerial dry matter and grain yields produced on varyingsoil OM contents in the upper 30.5 cm of Williamsloam, under conditions of uniform available soil Nand available water levels. In that the study was con-ducted on the same soil type, it was assumed that theonly soil property contributing to the yield differenceswas the soil OM content.
MATERIALS AND METHODSThe experiment was conducted during a 4-yr period in the
same 42.5-ha field on a Williams loam near Mandan, ND(46 °46'N 100 °55'W). The previous crop was spring wheat.Three 15 by 32 m soil areas differing in soil OM content to30.5-cm depth were selected in 1984, 1985, and 1987, andtwo areas in 1986. In selecting the areas on portions of thefield with <2% slope, uniformity of soil OM content withinthe area was based on visual observation of soil color fromcores taken to 30.5-cm depth at about 2-m intervals. Soil OMareas were represented by different microrelief, but no differ-ence in relief occurred within a soil OM area. The A and Bthorizons of Williams loam range in thickness from 0 to 10 cmand 10 to 25 cm, respectively (Stout et al., 1974). Organicmatter concentration ranges from 20 to 70 g kg-1 in the upper25 cm (C.J. Heidt, USDA-SCS Soil Correlator, 1993, personalcommunication).
Four replicates for each of three available water levels wereestablished at random on each soil OM area. The dimensionsof each replicate for each available water level were 2.13 by6.39 m. Three identical soil available N levels were establishedat planting within each available water level within each rep-licate. Each of these plots was 2.13 by 2.13 m. The soil avail-able N levels were randomized within each replicate.
Soil Organic MatterSamples for measurement of organic C concentration were
removed as a core to a depth of 30.5 cm and dividend intofour equal 7.6-cm increments. In 1984, 20 samples were takenat random with a 1.9-cm-diam. probe from each of the threesoil OM areas. In the other 3 yr, samples were taken with a3.8-cm-diam. probe from 12 randomly distributed points withineach soil OM area. In 1984 and 1987 samples were taken inthe spring while in 1985 and 1986 they were collected in theautumn preceding spring planting. Organic C concentrationwas measured by a modified Walkley-Black method (Peechet al., 1947). Organic C concentration, multiplied by 1.7, wastaken as the soil OM concentration. Soil OM concentrationmultiplied by the bulk density value for each 0- to 15.2-cm
185

186 SOIL SCI. SOC. AM. J., VOL. 58, JANUARY-FEBRUARY 1994
depth increment of each soil OM area is the soil OM contentof that area.
Bulk Density and Soil Water LevelsEach spring after planting, soil cores were removed in 0.15-
m increments to 0.46 m and in 0.30-m increments thereafterto measure bulk density and soil water content, and to provideaccess for installation of steel tubes 3.81 cm in diameters. Thetubes were installed in all four replicates for each of the threewater levels in plots representing the NIT 2 level of soil avail-able N (90 kg ha^1). A total of 12 tubes was installed in eacharea of the same soil OM content. The soil cores were placedin plastic bags to prevent water evaporation while in transit tothe laboratory. A small portion of each core was weighed,dried at 105 °C, and weighed again to measure soil water con-centration; the remainder was air dried and passed through a2-mm sieve. Bulk density was calculated from the soil corevolume and oven-dry soil core mass. These bulk density mea-surements were used to calculate soil OM content from OMconcentration, and volumetric soil water content.
Soil samples passed through a 2-mm sieve were saturatedfor 24 h and equilibrated for 72 h at 1500 kPa on a pressureplate apparatus (Richards, 1947; Klute, 1986). Water held at1500 kPa and less was assumed to be available to wheat. Soilwater content was measured with a neutron moisture meter(Stone et al., 1955) within 1 d after access tubes were installed,and each week thereafter during the growing season unlessinclement weather interfered. The center of detection for theneutron moisture meter was placed at 0.15, 0.31, 0.46, 0.76,1.07, 1.37, 1.68, 1.98 and 2.29 m below the soil surface.
The three water levels established as variables were: rainfedonly (designated WAT 1), supplemental plus rain (designatedWAT 2), and double supplemental plus rain (designated WAT3). Each soil OM area was independently equipped with awater storage unit and a water pump. Each water treatment ofeach replicate in each soil OM area was equipped with a watermeter to measure the amount of supplemental water appliedand to control water flow. Supplemental water was dispensedthrough trickle irrigation tubes placed in every other row ofwheat, including WAT 1, at rates that did not exceed the in-filtration rate.
Differences, if any, in available soil water content amongor between soil OM areas at planting were made uniform shortlyafter planting by applying water. Available soil water contentto 46-cm soil depth at planting differed by < 2 cm among soilOM areas in all years except 1985. That year, uniformity wasestablished by a 10-cm rainfall within 1 wk of the initial mea-surement. During the growing season, supplemental water wasapplied to restore the WAT 3 plots to field capacity when theavailable water capacity of the root zone (to 1.2 m) was re-duced to 50%. At the same time, supplemental water wasapplied to WAT 2 plots at one-half the quantity applied toWAT 3 plots.
Soil Available Nitrogen Measurements and LevelsSamples for measurement of preplan! soil NO3-N concen-
tration were removed at random from 8 to 12 points in eachsoil OM area with a hydraulically driven 38-mm diam. coringtube in 0.31-m increments to 1.2 m. In 1984 and 1987 thesewere taken in the spring shortly before planting, while in 1985and 1986 these were collected in the autumn preceding thespring planting. The sample of each increment from the 8 to12 points in each soil area was air dried and crushed to passa 2-mm sieve. Nitrate was extracted with a 2 M KC1 solution(Keeney and Nelson, 1982) and detected with a TechniconAutoanalyzer II1 (Technicon Industrial Systems, Tarrytown,NY) The average NO3-N concentration of each soil OM area
1 Mention of the name of a product does not imply the endorse-ment of USDA.
was multiplied by the bulk density value for each soil depthincrement to calculate NO3-N content.
Three identical soil available N levels were established atplanting each year within each water level in each soil OMarea. Soil available N level is the sum of the indigenous NO3-N content to 1.2-m soil depth and total N applied from fertil-izer. These levels were 55, 90 and 125 kg N ha-1, referred toas NIT 1, NIT 2, and NIT 3, respectively. Part of each soilavailable N level was supplied from 78 kg ha-1 of 18-20-0(18-46-0 oxide form) fertilizer applied by a drill applicationto all plots. The remaining fertilizer N needed to establish agiven level was applied by broadcasting 34—0-0 (NH4NO3)immediately after planting. Concentrated superphosphate fer-tilizer also was broadcast before planting to supply 45 kg Pha-1 to all plots.
Planting and Plant Measurements'Butte' the first year and 'Wheaton' the other 3 yr, both
hard red spring wheat cultivars, were planted with a press drillto about 4-cm depth in 15-cm row spacing at a rate of 2.47million viable kernels ha-1. An offset disk preceded the drillto incorporate the broadcast P fertilizer and crop residues.Planting dates were 15 May 1984, 29 Apr. 1985, 20 May1986, and 28 Apr. 1987.
Herbicides were applied at the appropriate time and rate tocontrol weeds.
Shortly after emergence, a 1-m2 area in each plot was de-lineated with permanent markers representing the same drillrows. Observations made in this delineated area pertinent tothis study were: plant population before onset of tillering, num-ber of spikes at harvest, grain yield, and total aerial dry matteryield. At harvest, all plants in the 1-m2 area were cut at soillevel at about kernel hard development stage, oven dried at60 °C, and weighed. The grain was separated from the spikeswith a thresher.
Analysis of variance: Data were analyzed as a strip-split,split plot.
Variable dftSoil (OM)Rep(OM) (error a)Water (WAT)OM x WATRep x WAT(OM) (error b)Nitrogen (NIT)WAT x NITOM x NITWAT x OM x NITResidual (error c)
2924
182448
54tThe df pertain to the 1984,1985, and 1987 trials. In that there were onlytwo soil OM contents included in the 1986 trial, the df were less for somevariance sources that year.
Calculation of Soil ProductivityThe contribution of a unit quantity of soil OM content to
productivity was estimated independently for both total aerialdry matter yield and grain yield. The contribution to produc-tivity of a unit quantity of soil OM is the quotient of thedifference in the crop yield grown on sites differing in soilOM content and the difference in the soil OM content at thesesites, to 30.5-cm depth, or:
Productivity = Yield differenceSoil OM content difference [1]
Productivity calculations were made within soil available N

BAUER & BLACK: SOIL ORGANIC MATTER EFFECTS ON PRODUCTIVITY 187
Table 1. Bulk density (Db), organic carbon (OC) concentrationat the 0- to 15.2- and 15.2- to 30.5-cm depths of soil areasof Williams loam, and the calculated soil organic matter(OM) content to 30.5 cm, in 1984,1985,1986, and 1987, atMandan, ND.
Year
1984
1985
1986
1987
Soilareaf
12312312
123
0-15.2 cm
A,Mgm-3
1.231.341.301.031.171.181.271.251.131.251.13
OCgkg-1
19.919.016.027.419.214.214.511.518.412.212.0
15.2-30.5 cm
A,Mgm-3
1.271.251.331.171.221.301.271.371.221.311.36
OCgkg-1
13.812.49.5
22.711.78.3
10.67.98.77.58.1
0-30.5 cmOM
Mg ha-1
10910686
14295718265816564
t For convenience, the soil area with the largest soil OM content ineach year is designated by 1. Successive numbers designatecorrespondingly smaller soil OM contents.
levels in which yields differed significantly between soil OMcontents and water levels.
RESULTS AND DISCUSSIONMeasurements of bulk density, organic C concentra-
tion, and calculated OM content to 30.5-cm soil depthfor the 11 soil OM areas are shown in Table 1. OrganicC concentration was consistently highest in the upper-most 15.2-cm soil depth.
Table 2 provides an analysis of variance summary foragronomic parameters considered to reflect effects of soilOM content on spring wheat performance, i.e., a mea-sure of soil productivity. Plant population and spike pop-ulation are included because these can have a bearing onwheat grain yields, especially when the population is< 100 plants m~2 and spike population < 250 m~2 (Blackand Bauer, 1990). As main effects, soil OM content andNIT were significant for almost all parameters in all years
while WAT affected only yields. Of the two-way inter-actions, that of soil OM content and soil water level (OMx WAT) was significant only for spike population in1987, while both soil available N and soil water levels(NIT x WAT) and soil available N and soil organicmatter content (NIT x OM) were significant most oftenfor yield.
1984The 1984 data are shown in Table 3. In this table, and
those presenting data of subsequent years, letters to des-ignate differences among means are included only forthe variables (and their interactions) that were deter-mined to be significant, as shown in Table 2.
Plant population was not altered by any variable. Theaverage population was 154 plants m~2. Thus, about62% of the 247 planted viable seeds m~2 produced aplant that survived.
Spike population increased as soil OM content in-creased (362, 391, and 419 spikes m-2), and as soilavailable N increased (334, 385, and 453 spikes m~2).In that plant population did not differ among variables,the increase in spike population resulted from productionof more spike-bearing tillers on the same plant. In thatspike number was increased by increase in soil availableN level, it implies that the increase in spike number withincrease in soil OM content can be attributed to elevatedmineralization of organic N at the higher soil OM con-tents.
Total aerial dry matter production was altered by themain effects of the three experimental variables (OM,WAT, and NIT). The available soil N and soil waterlevel (NIT to WAT) interaction was significant becausedry matter yield at the 55 kg N ha"1 level did not differamong water levels (5260, 5632, and 5234 ka ha-1) butwas increased at the 90 and 125 kg N ha"1 levels atWAT 2 and WAT 3. A yield response to water at the55 kg N ha"1 level was not obtained because fertilitywas the greater yield-limiting factor than water. The soilOM content and soil available N level (OM x NIT)interaction was significant because the yields were higher
Table 2. Significance of variance sources of selected parameters of spring wheat grown on areas of Williams loam of varying soilorganic matter (OM) levels under three soil available nitrogen (NIT) and three soil water (WAT) levels, in 1984, 1985, 1986,and 1987, at Mandan, ND.
Parameter
Plant population,no. m-1
Spike population,no. m~z
Total dry matteryield, kg ha-'
Grain yield, kg ha-1
Year
1984198519861987198419851986198719841985198619871984198519861987
OM
NS**
*
**
#*
**
NS**
*
**
*
**
NS**8.2f*#
WAT
NSNSNSNSNSNSNSNS****NS**
****NSNS
OM x WAT N
NS tNS -NS tNS «NSNSNS**
NSNSNSNSNS 'NS «NS <NS <
HT
«**
•JSit*********
B*
*
t*
**
NIT X WAT
NSNSNS*
NSNSNS**
**
**
NS#*****NS**
NIT x OM
NS*
NS*#
NS**NSNS*
NSNS*
9.3$NSNS*
OM x WATx NIT
NSNSNSNSNSNSNS**
NSNSNS*
NSNSNS*
*,t,t Significant at P < 0.05 and 0.01, 0.082, and 0.093 respectively. NS = not significant at P > 0.05.
188 SOIL SCI. SOC. AM. J., VOL. 58, JANUARY-FEBRUARY 1994
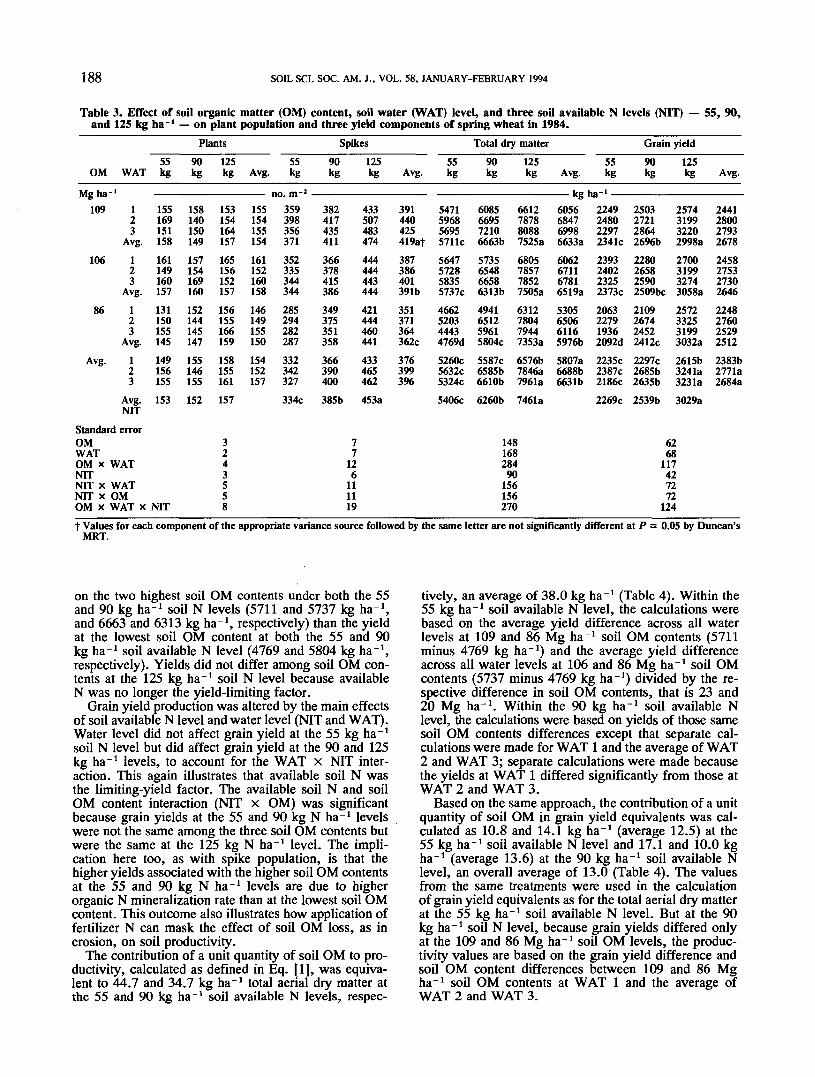
Table 3. Effect of soil organic matter (OM) content, soil water (WAT) level, and three soil available N levels (NIT) — 55, 90,and 125 kg ha-1 — on plant population and three yield components of spring wheat in 1984.
Plants
OM WAT
Mg ha-1
109 123
Avg.106 1
23
Avg.86 1
23
Avg.
Avg. 123
Avg.NIT
Standard errorOMWATOM x WATNITNIT x WATNIT x OMOM x WAT x
55kg
155169151158161149160157131150155145149156155153
NIT
90kg
158140150149157154169160152144145147155146155152
125kg
153154164157165156152157156155166159158155161157
3243558
Avg.
155154155154161152160158146149155150154152157
55kg
no. m"2
359398356371352335344344285294282287332342327334c
Spikes90kg
382417435411366378415386349375351358366390400385b
77126111119
125kg
433507483474444444443444421444460441433465462453a
Avg.
391440425419af387386401391b351371364362c376399396
55kg
5471596856955711c5647572858355737c4662520344434769d5260c5632c5324c5406c
Total dry matter
90 125kg kg
6085 66126695 78787210 80886663b 7525a5735 68056548 78576658 78526313b 7505a4941 63126512 78045961 79445804c 7353a5587c 6576b6585b 7846a6610b 7961a6260b 7461a
14816828490156156270
Avg.t,_Kg
6056684769986633a6062671167816519a5305650661165976b5807a6688b663 Ib
55kg
ha-1 ——2249248022972341c2393240223252373c2063227919362092d2235c2387c2186c2269c
Grain yield90 125kg kg
2503 25742721 31992864 32202696b 2998a2280 27002658 31992590 32742509bc 3058a2109 25722674 33252452 31992412c 3032a2297c 2615b2685b 3241a2635b 323 la2539b 3029a
6268117427272124
Avg.
2441280027932678245827532730264622482760252925122383b2771a2684a
t Values for each component of the appropriate variance source followed by the same letter are not significantly different at P = 0.05 by Duncan'sMRT.
on the two highest soil OM contents under both the 55and 90 kg ha-1 soil N levels (5711 and 5737 kg ha-1,and 6663 and 6313 kg ha-1, respectively) than the yieldat the lowest soil OM content at both the 55 and 90kg ha-1 soil available N level (4769 and 5804 kg ha-1,respectively). Yields did not differ among soil OM con-tents at the 125 kg ha-1 soil N level because availableN was no longer the yield-limiting factor.
Grain yield production was altered by the main effectsof soil available N level and water level (NIT and WAT).Water level did not affect grain yield at the 55 kg ha-1
soil N level but did affect grain yield at the 90 and 125kg ha-1 levels, to account for the WAT x NIT inter-action. This again illustrates that available soil N wasthe limiting-yield factor. The available soil N and soilOM content interaction (NIT x OM) was significantbecause grain yields at the 55 and 90 kg N ha-1 levelswere not the same among the three soil OM contents butwere the same at the 125 kg N ha-1 level. The impli-cation here too, as with spike population, is that thehigher yields associated with the higher soil OM contentsat the 55 and 90 kg N ha-1 levels are due to higherorganic N mineralization rate than at the lowest soil OMcontent. This outcome also illustrates how application offertilizer N can mask the effect of soil OM loss, as inerosion, on soil productivity.
The contribution of a unit quantity of soil OM to pro-ductivity, calculated as defined in Eq. [1], was equiva-lent to 44.7 and 34.7 kg ha"1 total aerial dry matter atthe 55 and 90 kg ha-1 soil available N levels, respec-
tively, an average of 38.0 kg ha-1 (Table 4). Within the55 kg ha"1 soil available N level, the calculations werebased on the average yield difference across all waterlevels at 109 and 86 Mg ha-1 soil OM contents (5711minus 4769 kg ha-1) and the average yield differenceacross all water levels at 106 and 86 Mg ha-1 soil OMcontents (5737 minus 4769 kg ha-1) divided by the re-spective difference in soil OM contents, that is 23 and20 Mg ha-1. Within the 90 kg ha-1 soil available Nlevel, the calculations were based on yields of those samesoil OM contents differences except that separate cal-culations were made for WAT 1 and the average of WAT2 and WAT 3; separate calculations were made becausethe yields at WAT 1 differed significantly from those atWAT 2 and WAT 3.
Based on the same approach, the contribution of a unitquantity of soil OM in grain yield equivalents was cal-culated as 10.8 and 14.1 kg ha-1 (average 12.5) at the55 kg ha-1 soil available N level and 17.1 and 10.0 kgha-1 (average 13.6) at the 90 kg ha-1 soil available Nlevel, an overall average of 13.0 (Table 4). The valuesfrom the same treatments were used in the calculationof grain yield equivalents as for the total aerial dry matterat the 55 kg ha-1 soil available N level. But at the 90kg ha"1 soil N level, because grain yields differed onlyat the 109 and 86 Mg ha-1 soil OM levels, the produc-tivity values are based on the grain yield difference andsoil OM content differences between 109 and 86 Mgha-1 soil OM contents at WAT 1 and the average ofWAT 2 and WAT 3.

BAUER & BLACK: SOIL ORGANIC MATTER EFFECTS ON PRODUCTIVITY 189
Table 4. Contribution to soil productivity in equivalents oftotal aerial dry matter (TDM) and grain yield (YIE) of springwheat from 1 Mg ha ' soil organic matter content (OM) to30.5-cm soil depth as calculated from differing TDM andYIE produced on variable levels of OM, soil available Nlevel (NIT), and soil water (WAT).
Variable levels comparedYear
1984
Avg.1985
Avg.1986
Avg.1987
Avg.Avg.
(years)
Soil OM
l-2t2-31-22-31-31-22-3
1-21-31-2-3-2-3-2-3-2-3
1-21-3
1-21-21-2
1-31-31-3
NIT
1122222
112222333333
123
123
WAT
1 + 2 + 3*1 + 2 + 3
1112 + 32 + 3
1 + 2 + 31 + 2 + 3
112 + 32 + 3112233
1 + 2 + 31 + 2 + 31 + 2 + 3
233
ProductivityTDM
kgMg
41.048.449.739.7
31.118.338.025.414.527.219.510.912.016.520.415.010.819.718.517.519.922.828.123.651.840.692.161.535.2
YIEyield-1 OM
10.814.1
17.110.0
13.011.96.99.88.72.64.82.37.05.04.64.67.76.37.9
11.69.79.7
32.824.642.433.315.6
t Refers to the values at soil OM content 1 minus 2. For convenience,the largest soil OM content in any year is designated by 1 andcorrespondingly smaller contents by successively larger numbers.
IRefers to the average values of the soil water levels indicated.
1985The 1985 data are shown in Table 5.Plant population was not the same at all soil OM con-
tents and soil available N levels. The OM x NIT inter-action was significant in that the population wasconsistently lower at the 71 Mg ha"1 soil OM contentthan at the 142 Mg ha"1 content and, additionally, plantpopulation within each of these at the two soil OM levelswas lower at the 55 kg ha"1 soil available N level. Thelower population at the lowest soil available N level isof interest since the same fertilizer N and P applicationswere made in the row with the seed at planting in allplots. The lower plant population at the lowest soil OMcontent may be a reflection of less desirable seedbedproperties for germination and emergence associated withlower soil OM content. A specific soil OM content atwhich such physical properties become less desirable forthis medium-textured soil cannot be established from thesetrials, however, plant populations did not differ in 1984when the lowest soil OM content was 86 Mg ha"1, butdiffered in subsequent years when soil OM contents werelower than the lowest soil OM content in 1984. The
range in plant populations during this 4-yr period illus-trate that factors in addition to soil physical propertiesaffect plant population.
Likewise, spike population was not the same at all soilOM contents and soil available N levels. The OM xNIT interaction was significant because spike populationincreased with increasing soil available N levels at the142 and 71 Mg ha-1 soil OM contents but not at the 95Mg ha"1 content; and spike population did not differamong soil OM contents at the 55 kg ha"1 soil availableN level, but did at the other two soil available N levels.
Total aerial dry matter yield and grain yield were af-fected by the variables in the same manner. Not onlywere the same variance sources (main effects of OM andNIT, and the NIT x WAT interaction) significant, butthe response to the treatments was the same. Water levelhad no effect on either yield at the 55 kg ha"1 soil avail-able N level; yields were lower at WAT 1 at the 90 kgha-1 soil available N level than at WAT 2 and WAT 3(which were the same); and yields increased with in-crease in water level at the 125 kg ha-1 soil available Nlevel. Likewise, the soil OM main effect was the samein that yields were higher at the 142 Mg ha"1 soil OMcontent than at the 95 and 71 Mg ha-1 contents (whichdid not significantly differ).
The contribution of a unit quantity of soil OM to pro-ductivity, calculated using Eq. [1], averaged 17.5 and6.3 kg ha-1 total aerial dry matter and grains yields,respectively (Table 4), based on the same 12 compari-sons for each of the two yield measurements. Two com-parisons were made within the 55 kg ha-1 available soilN level; these calculations were based on the yield, av-eraged across all water levels, and soil OM content dif-ferences at 142 and 95 Mg ha-1 soil OM contents (5582minus 4389 and 2689 minus 2128 kg ha-1 dry matterand grain yields, respectively) and at 142 and 71 Mgha"1 soil OM contents (5582 minus 4554 and 2689 mi-nus 2201 kg ha"1 dry matter and grain yields, respec-tively).
Four comparisons were made within the 90 kg ha"1
soil available N level since yields at WAT 1 differedsignificantly from WAT 2 and WAT 3. These calcula-tions were based on the differences at the same soil OMcontents (142 minus 95 and 142 minus 71 Mg ha"1) asat the 55 kg ha-1 soil available N level but includedseparate calculations for WAT 1 and the average of WAT2 plus WAT 3.
Six comparisons were made within the 125 kg ha"1
soil available N level since yields differed significantlyamong the three water levels. The six calculations werebased on the same soil OM contents (142 minus 95 and142 minus 71 Mg ha"1) as at the 55 and 90 kg ha-1 soilavailable N levels, with separate calculations made foreach water level.
1986The 1986 data are shown in Table 6. Only the main
effects OM and NIT were statistically significant.Plant population, total aerial dry matter yield, and grain
yield were higher at the highest of the two soil OMcontents; spike population, total aerial dry matter yield,and grain yield increased as soil available N level in-creased.

190 SOIL SCI. SOC. AM. J., VOL. 58, JANUARY-FEBRUARY 1994
Table 5. Effect of soil organic matter (OM) content, soil water (WAT) level, and three soil available N levels (NIT) — 55, 90,and 125 kg ha ' — on plant population and three yield components of spring wheat in 1985.
Plants55
OM WAT kg
Mg ha-1
142 1 1592 1563 143
Avg. 153bc95 1 174
2 1423 162
Avg. 159b71 1 119
2 1143 116
Avg. 116dAvg. 1 151
2 1373 140
90kg
125kg Avg.
55kg
Spikes90kg
125kg Avg.
55kg
Total dry matter90kg
125kg Avg.
HA »n— 2 !_„
180171174175a156162155158bc137136151141c158156160
178157177171a155158150154bc146139145143bc160151157
172 252161165166af162154156157a134129137133b156148153
246259252e266220219235e236219245233e251228241
383383368378b287299331306d
347336366350c339339355
420416436424a320350341337cd372400426399b371388401
352348354351a291290297292c319318345327b320319332
5340569357155582440041884580438943554428448045544698e4769e5058e
6778744875687264550066307363649853936573674062355890d6883c7223c
7415849095108472664077858582766959657723820072966673c7999b8764a
*&6511721075987106a5513620168426185b5238624166076028b5754c6551b7015a
55kg
ha-1
2511274628112689206120882236212820582185236022012210e2339e2469de
Grain90kg
3012344134543302255331473506306923923089313028702652de3226c3363c
yield125kg
3078398843673811296837524151362425843665382333572877d3802b4114a
Avg.
2867339135443267a2527299532982940b2345298031042810b2580c3122b3315a
Avg. NIT 143b 158a 156aStandard error
240c 344b 387a 4841c 6666b 7812a 2339c 3080b 3597a
OMWATOM x WATNITNIT x WATNIT x OMOM x WAT x NIT
4483559
558599
15
137113195113195195338
7664
11059
102338177
t Values for each component of the appropriate variance source followed by the same letter are not significantly different at P = 0.05 by Duncan'sMRT.
The contribution to productivity by a unit quantity ofsoil OM content was the equivalent of 19.9, 22.8, and28.1 kg ha-1 total aerial dry matter at the 55, 90, and
125 kg ha-1 soil available N level, respectively (Table4), an average of 23.6 kg ha"1. In equivalents of grainyield, the contribution was 7.9, 11.6, and 9.7 kg ha"1
Table 6. Effect of soil organic matter (OM) content, soil water (WAT) level, and three soil available N levels (NIT) — 55, 90,and 125 kg ha ' — on plant population and three yield components of spring wheat in 1986.
Plants
OM
Mg ha-1
82
65
Avg.
WAT
123
Avg.123
Avg.123
55kg
208206185200209182186192209194186
90kg
182196202193199186183189191191193
125kg
192215201203185169194183189192198
Avg.
194206196199at198179188188b196192192
55kg
. m-2-283298269283274303267281279301268
Spikes90kg
311330329323322325360339322328345
125kg
388403381391372408371384380406376
Avg.
327344326332326345333335327345330
55kg
30152883283529112468252827232573274227062779
Total dry matter90kg
44134913454046224188433041884235430146224364
125kg
63736525621563715913592858505894614362226033
Avg.
*b
4600477445304634a4190425942544234b439445164392
55kg
ha-1 —11371097112811210988094710270987106310221078
Grain yield90kg
16701966177518041522161916791607159717931727
125kg
25532618257625822537247522392417254525472408
Avg.
1786189418261835a1682168016481670b173417871737
Avg. NIT 196 191
Standard error193 282c 33Ib 387a 2742c 4428b 6132a 1054c 1705b 2500a
OMWATOM x WATNITNIT x WATNIT x OMOM x WAT x NIT
358579
12
67
117
101217
11111219412117121
297
6960
1036389
109154
t Values for each component of the appropriate variance source followed by the same letter are not significantly different at P = 0.05 by Duncan'sMRT.

BAUER & BLACK: SOIL ORGANIC MATTER EFFECTS ON PRODUCTIVITY 191
Table 7. Effect of soil organic matter (OM) content, soil water (WAT) level, and three soil available N levels (NIT) — 55, 90,and 125 kg ha ' — on plant population and three yield components of spring wheat in 1987.
Plants
OM
Mgha-81
55WAT kg
1 1542 1533 159
Avg. 155a
90kg
139141132137c
125kg
131145132136c
Avg.
141146141143abf
55kg
m-2 -263ij268hij268hij266
Spikes90kg
297d-h309c-g326cd310
125kg
277g-j366c410a341
Avg.
279cd304abc335a306
55
total4590ijk5070f-i4868g-j4843f
NIT, kg ha-1 NIT, kg ha-1
90 125 Avg. 55 90 125
5367e-h 5475efg 5144 2180ghi 2513d-g 2642de5695def 6760bc 5482 2450e-h 2680de 3304ab6188cd 7140ab 6065 2204f-i 2850cd 3283ab5750de 6458b 5684b2278e 268 led 3076b
Avg.i
2445281127782678a
65 1 156 160 140 152 249jk2 156 159 147 154 247jkl3 160 142 141 147 260ij
Avg. 157a 153ab 143bc 151a 25264 1 136 152 132 140 2161
2 126 132 138 132 222kl3 133 132 137 134 220kl
Avg. 132c 139c 135c 135b 219Avg. 1 148ab 150a 134c 144 242d
2 145abcl44abc 143abc 144 245d3 150a 135c 137bc 141 249d
279e-j 313cde 280bcd 4780h-k 5863de 6578bc 5740 2112hi 2662de 3076bc 2617296d-h 326cd 289bcd 4853g-j 6253cd 7230ab 6112 2106hi 2788cde 3283ab 2726310c-f 369b 313ab 4885g-j 5840de 7545a 6090 2122hi 2584de 3493a 2733295 336 294 4839f 5985cd 7118a 5981a2113ef 2678cd 3284a 2692a304c-g 284e-i 268de 4125k 5688def 5873de 5228 2126hi 2604de 2698de 2475267hij 319cd 269de 4190k 5493efg 6910ab 5531 18921 2519d-g 3279ab 2563247jkl 261ij 242e 4298jk 5498efg 5575def5123 19351 2432e-h 2563def 2310273 288 259 4204g 5559e 6119c 5294c 1984f 2518d 2846c 2450b294c 291c 275290c 327b 287294c 347a 297
4498c 5639b 5975b 5370 2139a 2593c 2805b 25124704c 5813b 6967a 5828 2149a 2663c 3288a 27004683c 5842b 6753a 5759 2087a 2622bc 3113a 2607
Avg. NIT 148a 143ab 138bStandard error
245c 293b 321a 4629c 5765b 6565a 2125c 2626b 3069a
OMWATOM x WATNITNIT x WATNIT X OMOM x WAT x NIT
3482336
46
10366
10
5090
15670
122122210
2362
107386666
114t Values for each component of the appropriate variance source followed by the same letter are not significantly different at P = 0.05 by Duncan's
MRT.
grain yield, an average of 9.7 kg ha-1 at these same soilavailable N levels.
1987The 1987 data are shown in Table 7. As in 1985 and
1986, plant population was not the same among all var-iables, hence there were significant two-way interactionsas well as significant main effects. Reasons for some ofthe differences are unknown, as for example, why thepopulation at the 125 kg ha~a soil available N level waslower than at the 55 kg ha-1 N level at the 81 and 65Mg ha-1 soil OM contents than at the 64 Mg ha-1 soilOM content. The magnitude in range of plant popula-tions among treatments was less in 1987 than in the otheryears.
For spike population, the three-way interaction OMx NIT x WAT was significant; causes for the inter-action are illustrated from data at the 125 kg ha"1 soilavailable N level in that spike population increased withincrease in water level at the 81 Mg ha-1 soil OM contentbut not at the other two soil OM contents. At the 90 kgha"1 soil available N level, the responses were similarto those at the 125 kg ha-1 N level; but at the 55 kgha-1 soil available N level there was no response to waterlevel within a soil OM content.
Variance sources (Table 3) significant for total aerialdry matter also were significant for grain yield, exceptthat the main effect WAT was not significant in grainyield. Causes for the three-way OM x NIT x WATinteraction can be illustrated from data for either yieldat the 125 kg ha-1 soil available N level in that difference
occurred among some water levels at all three soil OMcontents, but no difference in yield occurred among waterlevels with soil OM contents at the 55 kg ha"1 soil avail-able N level. This again illustrates that response to wateror to fertility will not materialize when another factor ismore limiting as expressed by the "law of the mini-mum".
The total aerial dry matter and grain yield data at the65 Mg ha"1 soil OM content are an enigma in that thedry matter yields were higher and the grain yields notdifferent from those at the 81 Mg ha-1 soil OM content.No explanation can be provided for the outcome otherthan that these are an aberration. Hence data from the65 Mg ha-1 treatment will be excluded from the calcu-lation for productivity.
The contribution of a unit quantity of soil OM to pro-ductivity, considering only the 81 and 64 Mg ha"1 soilOM contents and calculated using Eq. [1], was estimatedat each of the three soil available N levels within whichthe difference due to water level was significant. (Thusthe calculation at the 55 kg ha-1 soil available N levelwas made from yields at WAT 2 and at the 90 and 125kg ha-1 soil available N levels at WAT 3). The calcu-lated productivity in equivalents of total aerial dry matterwas 51.8, 40.6, and 92.1 kg ha-1 at the 55, 90, and 125kg ha"1 soil available N level; the calculated productivityin equivalents of grain yield was 32.8, 24.6, and 42.4kg ha-1 for the respective soil available N level (Table4)-
The calculated contribution of a Mg ha"1 soil organicmatter content to productivity for the 4 yr is summarizedin Table 4. Among years, the range in total aerial dry

192 SOIL SCI. SOC. AM. J., VOL. 58, JANUARY-FEBRUARY 1994
matter equivalents ranged from about 17.5 to 61.5 kgha"1 and in grain yield equivalents 6.4 to 33.3 kg ha-1.The largest annual average values were measured in 1987,the only year of a significant three-way interaction amongthe experimental variables.
The proportion of grain to total aerial dry matter varieswith the amount of grain produced (Bauer and Zubriski,1978). For the range in grain yields produced in thesetrials, a proportion of 0.47 would be and approximatemaximum. On this basis, the average of the 4 yr, 35.2kg ha-1 total aerial dry matter, would be equivalent toabout 16.5 kg ha"1 grain.
Although the specific factors associated with soil OMcontributing to productivity cannot be quantitatively as-sessed from these trials, a major contributor is availableN mineralized from organic N during the growing sea-son. Evidence of this is the fact that available soil N waslimiting yields, and that it was not exclusively limitingat the lowest (55 kg ha-1) available soil N level. In thatsoil OM is an indigenous source of available N, it fol-lows that the yield differences among (or between) soilOM contents resulted from concomitant differences inamount of available N released through organic N min-eralization.
The average grain N concentration of hard red springwheat is about 24.5 g kg"1 (G. Hareland, 1992, personalcommunication) and about 70% of the N uptake in theaerial parts of spring wheat is translocated to the grain(Bauer et al., 1987). On this basis, plant uptake of 1 kgN would produce about 29 kg ha"1 of grain. Thus, onlyabout 1 kg ha-1 difference in mineralization, assumingonly 50% utilization for grain production, could providefor the average productivity difference observed in thesetrials. Less than 3 kg ha-1 would provide for the maxi-mum in measured productivity difference observed inthese trials.
When put under cultivation, OM content decreases insoils in the northern Great Plains (Haas et al., 1957;Bauer and Black, 1981); an exception may be those soilson a depositional position of the landscape (Malo et al.,1974). The extent of decrease varies primarily with man-agement factors, especially those that affect erosion rate.Measured loss of OM from Williams loam in seven fields33 yr after cultivation began averaged 41% 0- to 15.2-cm depths and 30% at the 15.2- to 30.5-cm depths (Haaset al., 1957), based on a comparison with six sites ofWilliams loam under virgin grassland management. Themeasured OM contents of the virgin grassland sites was102 and 48 Mg ha"1 at the two respective depths. Thusproductivity loss in any one year, based on a loss of 15.6kg ha-1 associated with one Mg ha-1 soil OM, deter-mined in this study, could be as much as 870 kg ha-1
wheat grain.
SUMMARYThis study was conducted in such a manner that yield
differences could be taken as an expression of the con-tribution of soil OM content to soil productivity. Basedon this study, the contribution of 1 Mg ha-1 OM in theupper 30.5 cm to inherent soil productivity is equivalentto about 35.2 and 15.6 kg ha-1 total aerial dry matterand wheat grain, respectively.
These data suggest that loss of soil productivity re-
sulting from a decline in soil OM content associated withsoil loss by erosion in the northern Great Plains is aconsequence of the concomitant loss of fertility. Somehave suggested that the productivity loss accompanyingsoil erosion is due to a decline in soil available watercapacity (National Soil Erosion-Soil Productivity Re-search Planning Committee, 1981). Bauer and Black(1992) reported that a decline in soil OM did not changethe available water capacity of moderately coarse-tex-tured soils and tended to increase the available watercapacity in medium- and fine-textured soils because ofa concomitant increase in bulk density.
ACKNOWLEDGMENTSThe contributions by Mervin W. Stork and Roland T. Vre-
denburg to this study and their diligence are greatly appreci-ated. Dr. Gary Richardson advised us on statistical proceduresand we express our thanks to him.

ISMAIL ET AL.: LONG-TERM NO-TILLAGE EFFECTS 193