quantification of particle agglomeration … · quantification of particle agglomeration during...
TRANSCRIPT
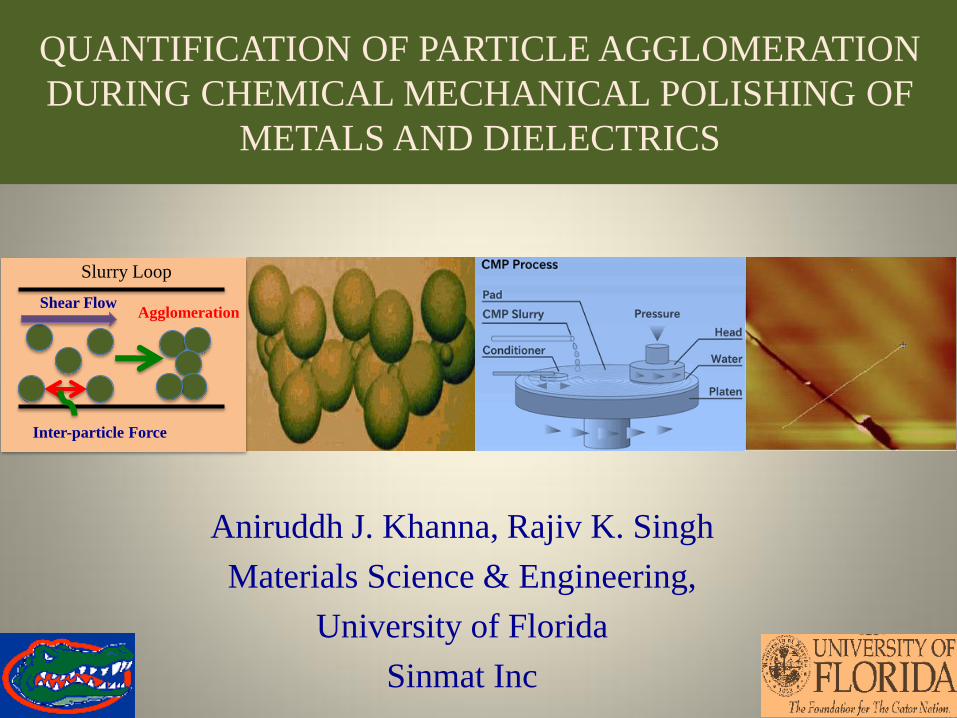
QUANTIFICATION OF PARTICLE AGGLOMERATION
DURING CHEMICAL MECHANICAL POLISHING OF
METALS AND DIELECTRICS
Aniruddh J. Khanna, Rajiv K. Singh
Materials Science & Engineering,
University of Florida
Sinmat Inc
Slurry Loop
Shear Flow Agglomeration
Inter-particle Force
2
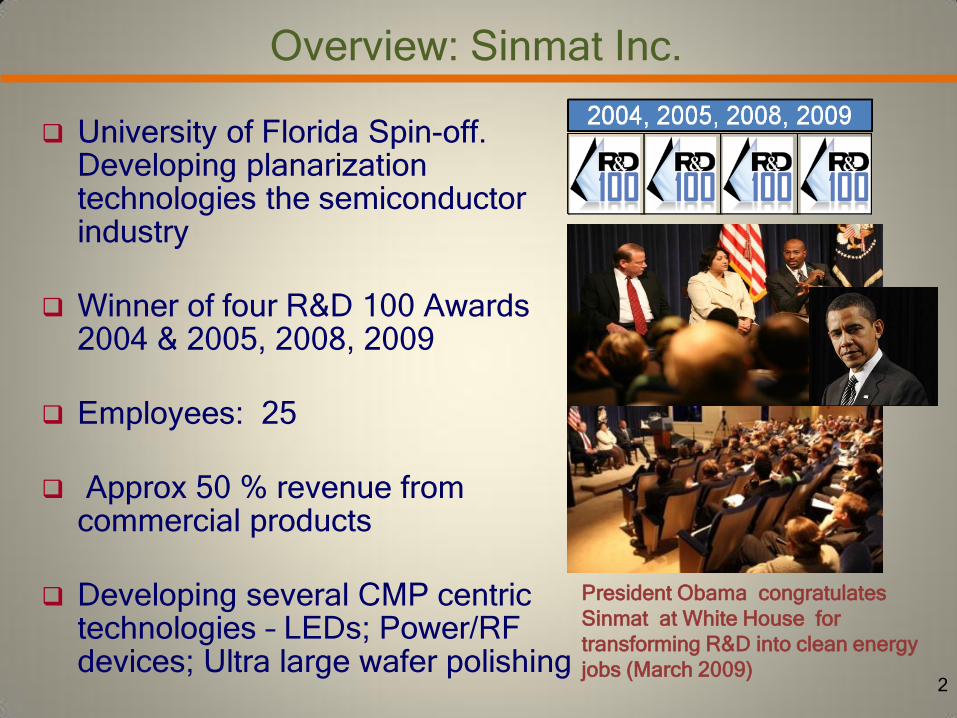
Overview: Sinmat Inc.
University of Florida Spin-off. Developing planarization technologies the semiconductor industry
Winner of four R&D 100 Awards 2004 & 2005, 2008, 2009
Employees: 25
Approx 50 % revenue from commercial products
Developing several CMP centric technologies – LEDs; Power/RF devices; Ultra large wafer polishing
President Obama congratulates
Sinmat at White House for
transforming R&D into clean energy
jobs (March 2009)
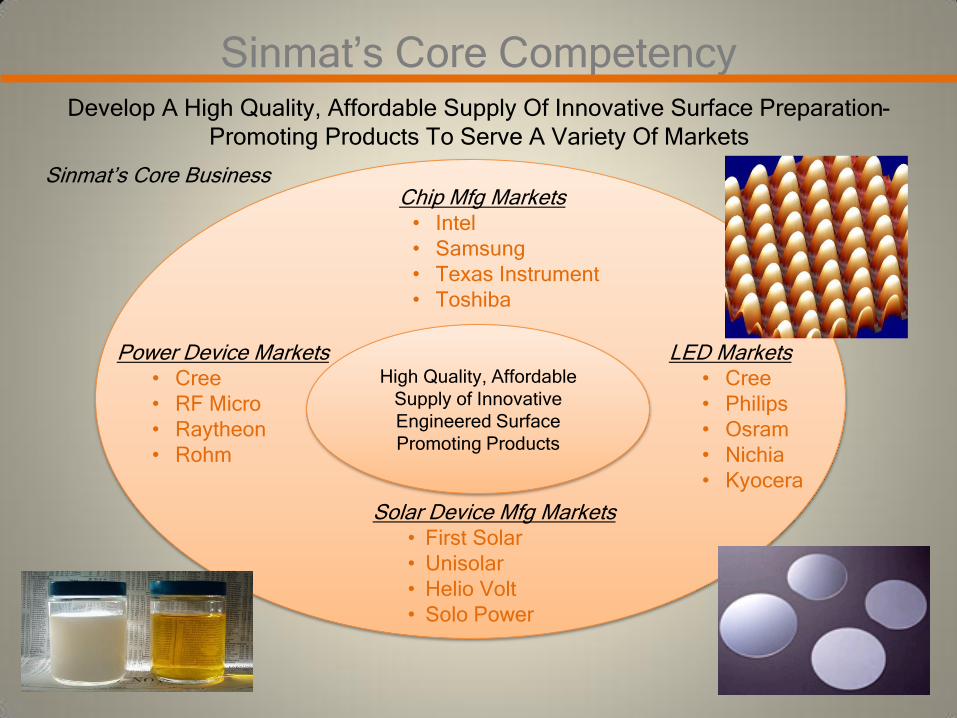
Sinmat’s Core Competency
Sinmat’s Core Business
Power Device Markets • Cree
• RF Micro
• Raytheon
• Rohm
Chip Mfg Markets • Intel
• Samsung
• Texas Instrument
• Toshiba
Solar Device Mfg Markets • First Solar
• Unisolar
• Helio Volt
• Solo Power
LED Markets • Cree
• Philips
• Osram
• Nichia
• Kyocera
High Quality, Affordable
Supply of Innovative
Engineered Surface
Promoting Products
Develop A High Quality, Affordable Supply Of Innovative Surface Preparation-
Promoting Products To Serve A Variety Of Markets

Surface Finish of SiC/GaN
•Polishing rate 10 x to 50 X higher •High Performance at Reduced Costs
•Sinmat is the currently the largest global supplier of WBG CMP slurries (SiC and GaN)
•Recently Introduced Sapphire Slurries (Substrate market > 1.5 B in 5 years)
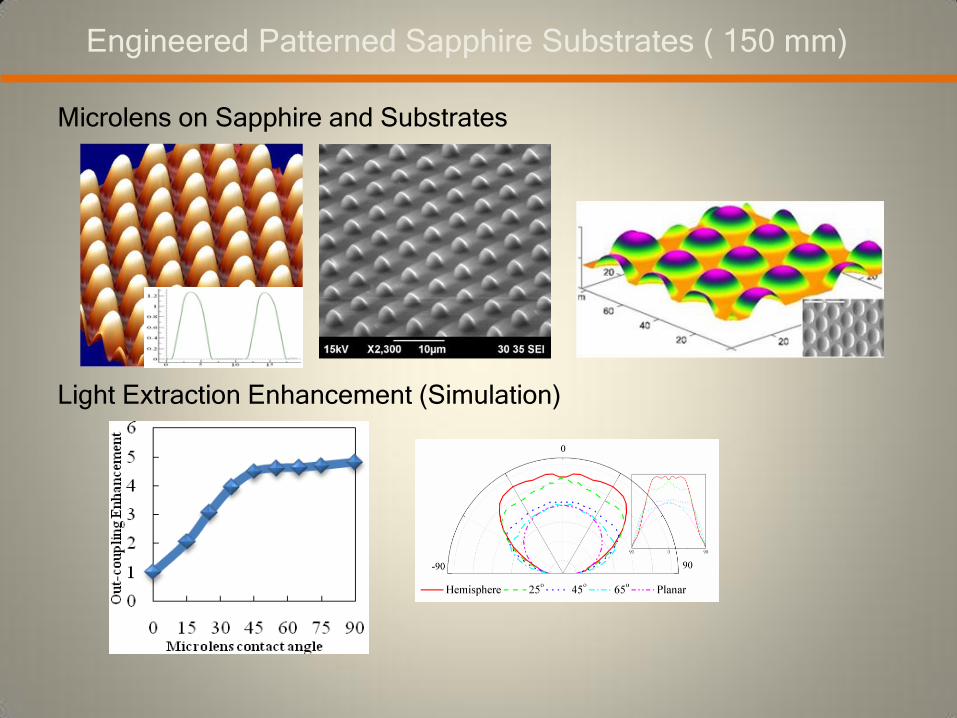
Engineered Patterned Sapphire Substrates ( 150 mm)
Microlens on Sapphire and Substrates
Light Extraction Enhancement (Simulation)
6
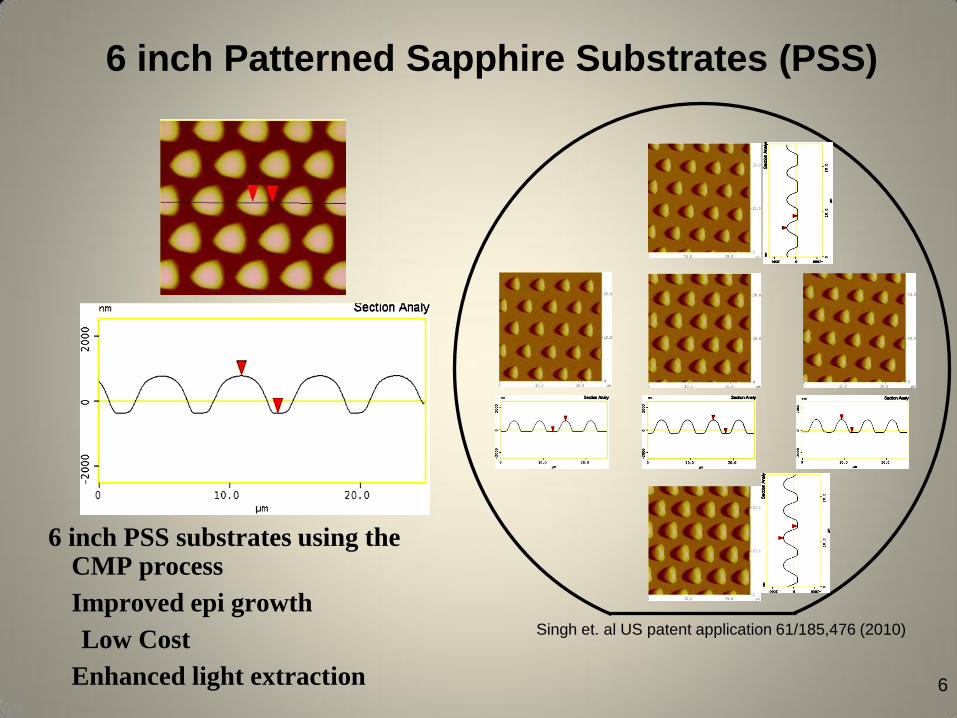
6 inch Patterned Sapphire Substrates (PSS)
6 inch PSS substrates using the CMP process
Improved epi growth
Low Cost
Enhanced light extraction
Singh et. al US patent application 61/185,476 (2010)
Outline
Method to quantify stress response of CMP slurries
Engineering of Slurry Delivery System
Measurement of stability ratio for determining slurry stability
Better Quality Control Over Incoming Slurries
Characterization of the nature of agglomerates in CMP slurries
Defectivity from Different Slurries
Conclusions
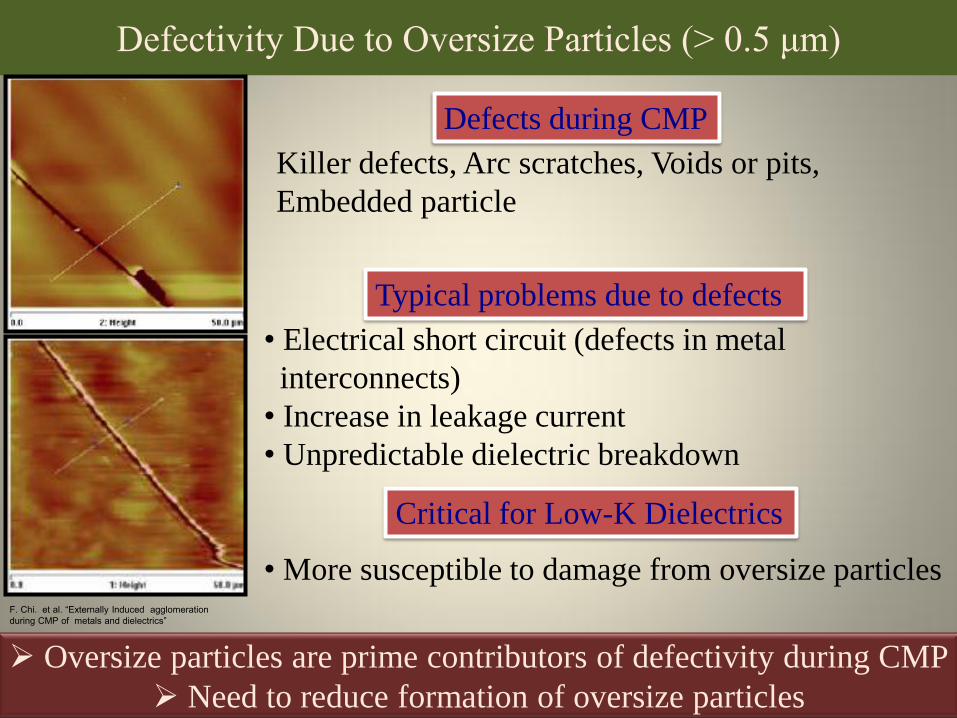
Defectivity Due to Oversize Particles (> 0.5 μm)
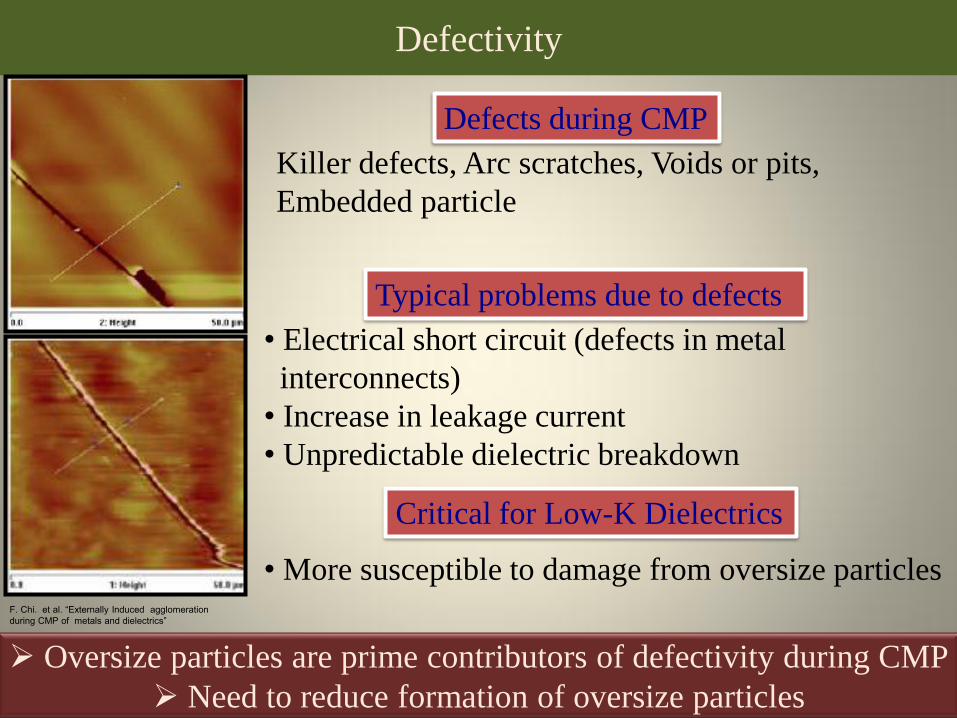
F. Chi. et al. “Externally Induced agglomeration
during CMP of metals and dielectrics”
Oversize particles are prime contributors of defectivity during CMP
Need to reduce formation of oversize particles
• Electrical short circuit (defects in metal
interconnects)
• Increase in leakage current
• Unpredictable dielectric breakdown
• More susceptible to damage from oversize particles
Defects during CMP
Typical problems due to defects
Critical for Low-K Dielectrics
Killer defects, Arc scratches, Voids or pits,
Embedded particle
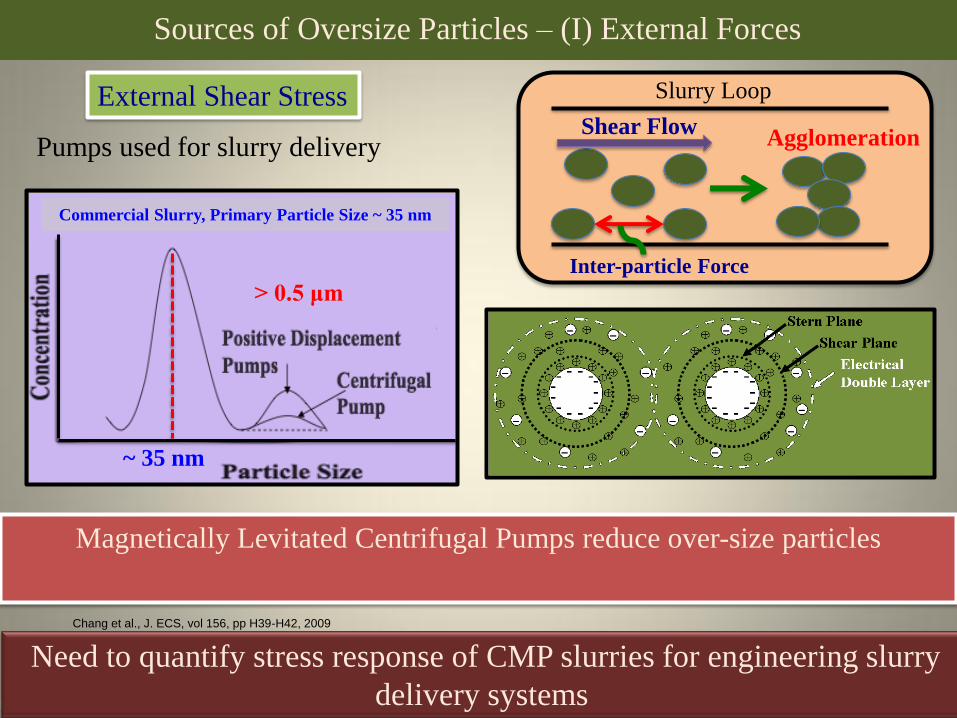
Sources of Oversize Particles – (I) External Forces
Pumps used for slurry delivery
Chang et al., J. ECS, vol 156, pp H39-H42, 2009
Need to quantify stress response of CMP slurries for engineering slurry
delivery systems
External Shear Stress
Magnetically Levitated Centrifugal Pumps reduce over-size particles
Slurry Loop
Shear Flow Agglomeration
Inter-particle Force
Commercial Slurry, Primary Particle Size ~ 35 nm
~ 35 nm
> 0.5 μm

Types of Oversize Particles
Large particles that can be broken
down to smaller agglomerates or
particles by
Light mechanical forces or
Hydrodynamic stress
• Large coarse particles
• Cannot be broken down to
small size particles
• Closely held by strong
attractive forces
• Strong shear forces cannot
break these gritty lumps
Shear
Forces
Need to characterize nature of agglomerates to understand
defectivity during CMP resulting from stressed slurries
Hard agglomerates lead to
defectivity during CMP
Hard Agglomerates Soft Agglomerates
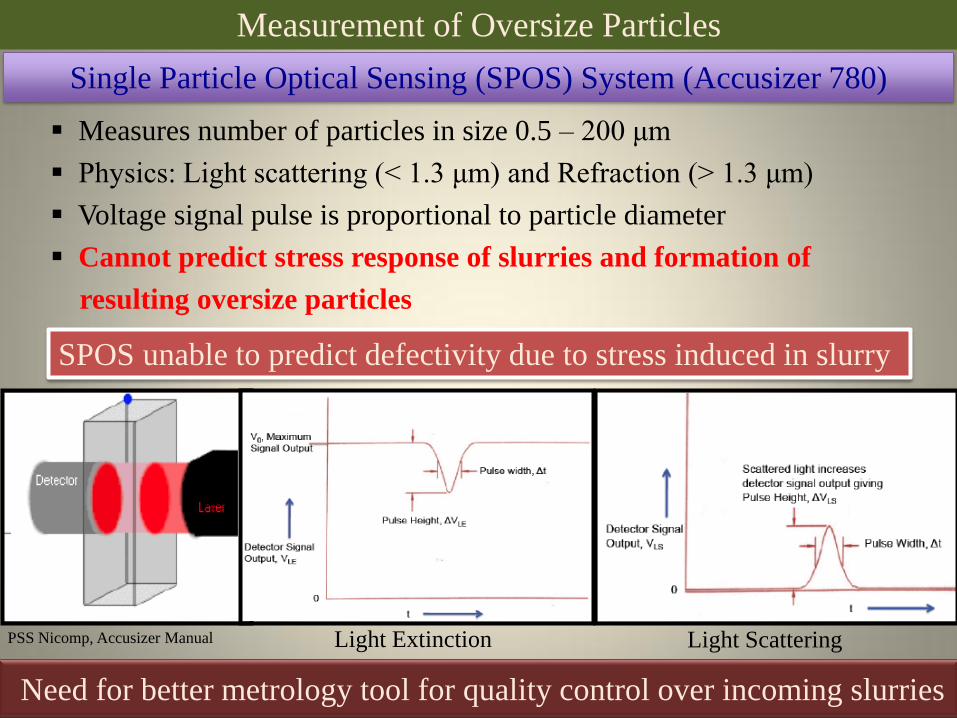
Measurement of Oversize Particles
Measures number of particles in size 0.5 – 200 μm
Physics: Light scattering (< 1.3 μm) and Refraction (> 1.3 μm)
Voltage signal pulse is proportional to particle diameter
Cannot predict stress response of slurries and formation of
resulting oversize particles
Need for better metrology tool for quality control over incoming slurries
Light Extinction Light Scattering PSS Nicomp, Accusizer Manual
SPOS unable to predict defectivity due to stress induced in slurry
Single Particle Optical Sensing (SPOS) System (Accusizer 780)
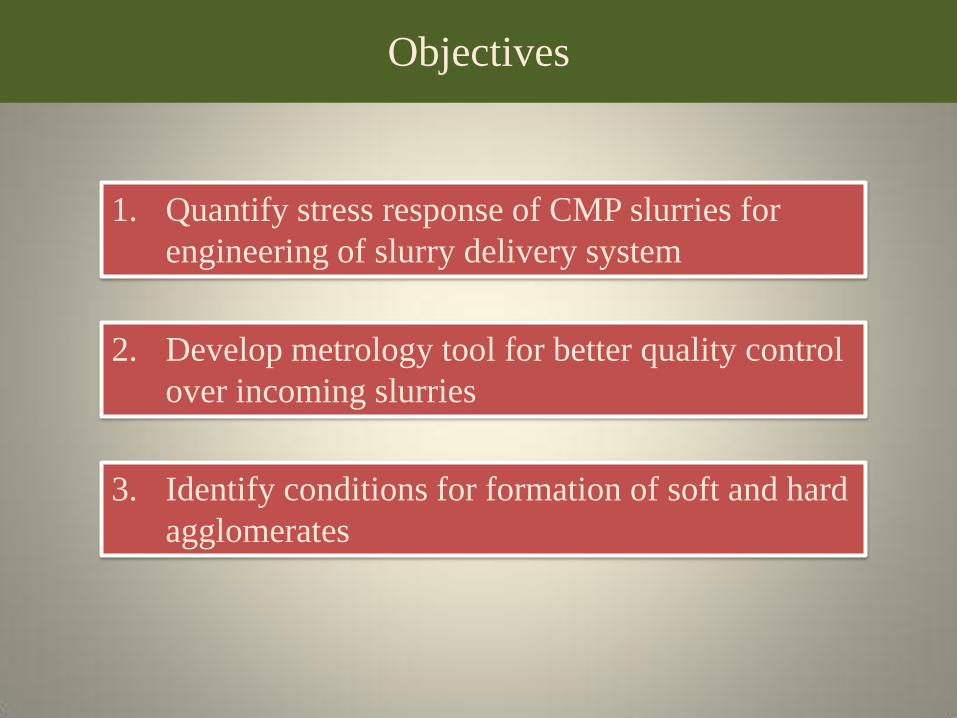
Objectives
1. Quantify stress response of CMP slurries for
engineering of slurry delivery system
2. Develop metrology tool for better quality control
over incoming slurries
3. Identify conditions for formation of soft and hard
agglomerates
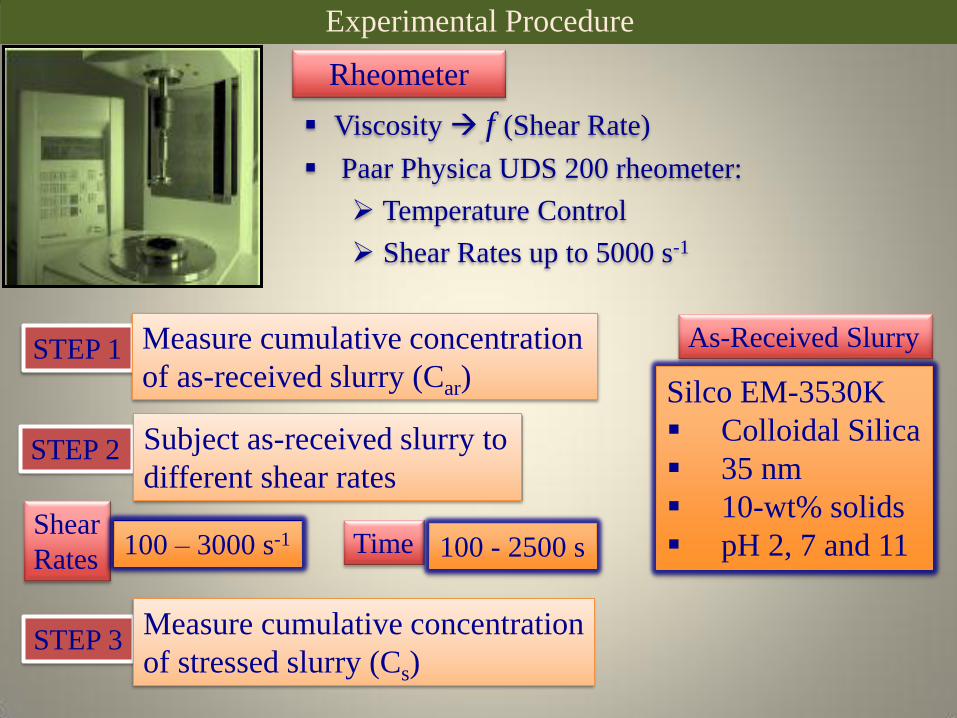
Experimental Procedure
As-Received Slurry
Silco EM-3530K
Colloidal Silica
35 nm
10-wt% solids
pH 2, 7 and 11 Shear
Rates 100 – 3000 s-1
STEP 1 Measure cumulative concentration
of as-received slurry (Car)
STEP 3 Measure cumulative concentration
of stressed slurry (Cs)
STEP 2 Subject as-received slurry to
different shear rates
Time 100 - 2500 s
Viscosity f (Shear Rate)
Paar Physica UDS 200 rheometer:
Temperature Control
Shear Rates up to 5000 s-1
Rheometer

Data Analysis
Agglomeration De-Agglomeration
0
4000
8000
12000
16000
20000
0 1 2 3 4
Cu
mu
lati
ve
Co
nce
ntr
ati
on
(# o
f p
art
icle
s/m
l)
Particle Size (micron)
Agglomeration
As-R Slurry
Stressed Slurry
Agglomeration
0
2000
4000
6000
8000
0 1 2 3 4Cu
mu
lati
ve
Co
nce
ntr
ati
on
(# o
f p
art
icle
s/m
l)
Particle Size (micron)
De-Agglomeration
As-R Slurry
Stressed Slurry
De-Agglomeration
Normalized Concentration < 1 Normalized Concentration > 1
Normalized Concentration = Cumulative Conc. of Stressed Slurry (Cs)
(Cs/Car) Cumulative Conc. of As-Received Slurry (Car)
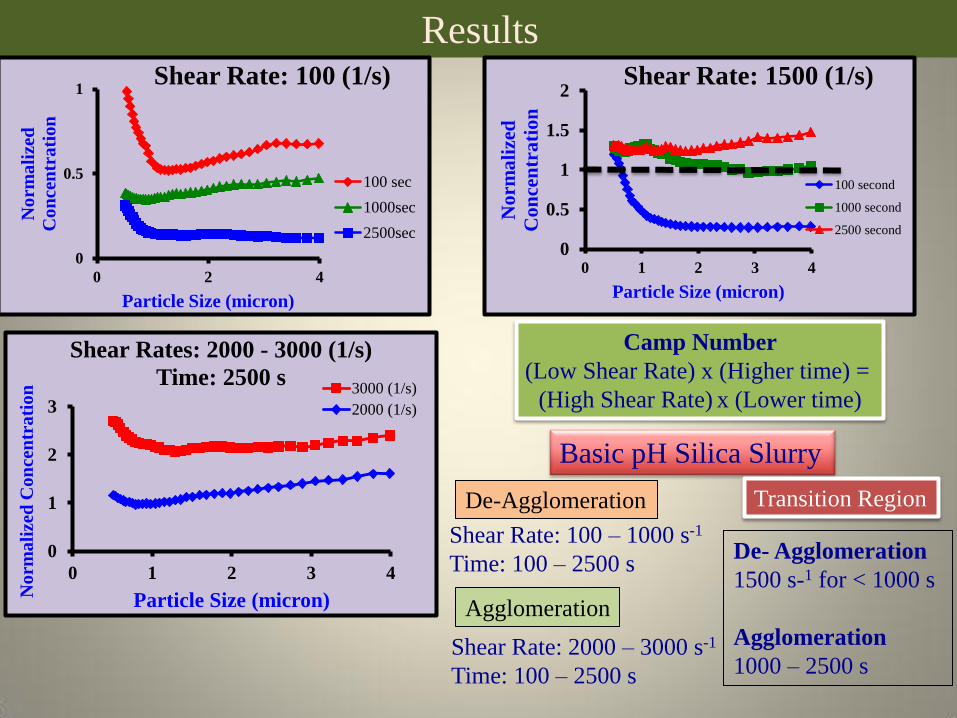
Results
0
0.5
1
0 2 4
No
rma
lize
d
Co
nce
ntr
ati
on
Particle Size (micron)
Shear Rate: 100 (1/s)
100 sec
1000sec
2500sec
0
1
2
3
0 1 2 3 4
No
rma
lize
d C
on
cen
tra
tio
n
Particle Size (micron)
Shear Rates: 2000 - 3000 (1/s)
Time: 2500 s 3000 (1/s)
2000 (1/s)
0
0.5
1
1.5
2
0 1 2 3 4
Norm
ali
zed
Con
cen
tra
tio
n
Particle Size (micron)
Shear Rate: 1500 (1/s)
100 second
1000 second
2500 second
Basic pH Silica Slurry
De-Agglomeration
Agglomeration
Shear Rate: 100 – 1000 s-1
Time: 100 – 2500 s
Shear Rate: 2000 – 3000 s-1
Time: 100 – 2500 s
Transition Region
De- Agglomeration
1500 s-1 for < 1000 s
Agglomeration
1000 – 2500 s
Camp Number
(Low Shear Rate) x (Higher time) =
(High Shear Rate) x (Lower time)
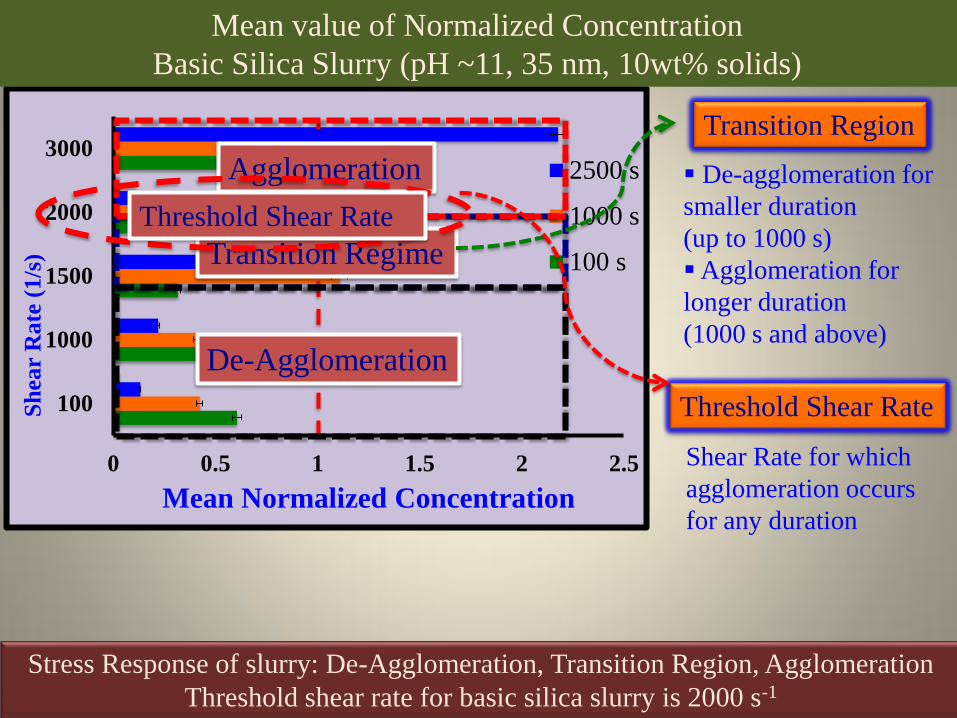
0 0.5 1 1.5 2 2.5
100
1000
1500
2000
3000
Mean Normalized Concentration
Sh
ear
Rate
(1/s
)
2500 s
1000 s
100 s
Stress Response of slurry: De-Agglomeration, Transition Region, Agglomeration
Threshold shear rate for basic silica slurry is 2000 s-1
Transition Regime
De-Agglomeration
Agglomeration
Transition Region
De-agglomeration for
smaller duration
(up to 1000 s)
Agglomeration for
longer duration
(1000 s and above)
Shear Rate for which
agglomeration occurs
for any duration
Threshold Shear Rate
Mean value of Normalized Concentration
Basic Silica Slurry (pH ~11, 35 nm, 10wt% solids)
Threshold Shear Rate
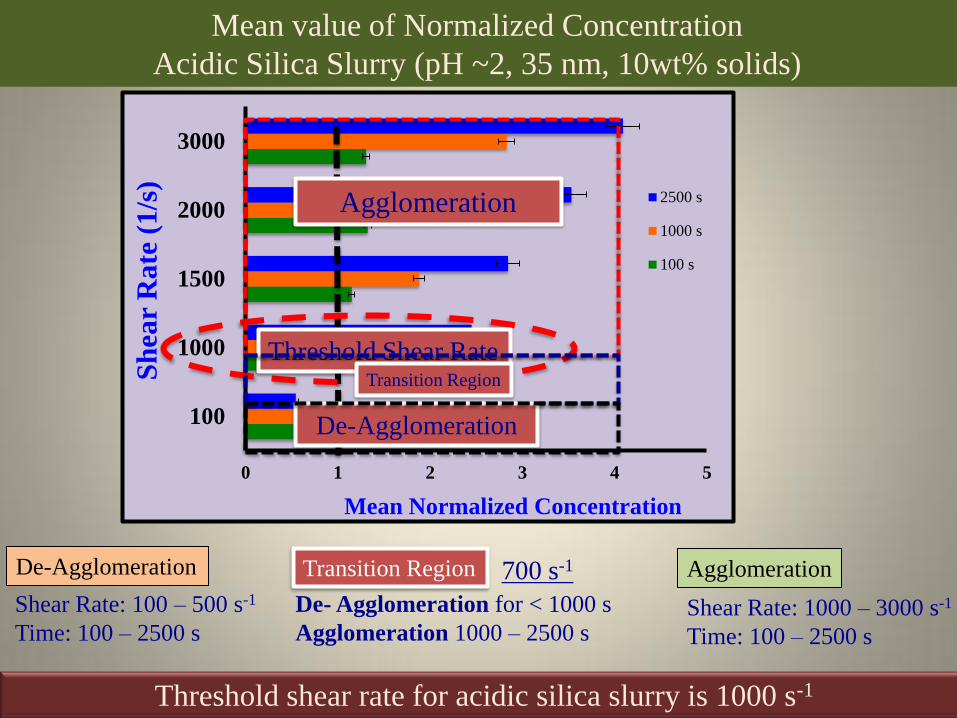
0 1 2 3 4 5
100
1000
1500
2000
3000
Mean Normalized Concentration
Sh
ear
Ra
te (
1/s
)
2500 s
1000 s
100 s
Threshold Shear Rate
Threshold shear rate for acidic silica slurry is 1000 s-1
Transition Region
De-Agglomeration
Agglomeration
Mean value of Normalized Concentration
Acidic Silica Slurry (pH ~2, 35 nm, 10wt% solids)
De-Agglomeration
Shear Rate: 100 – 500 s-1
Time: 100 – 2500 s
Agglomeration
Shear Rate: 1000 – 3000 s-1
Time: 100 – 2500 s
Transition Region
De- Agglomeration for < 1000 s
Agglomeration 1000 – 2500 s
700 s-1
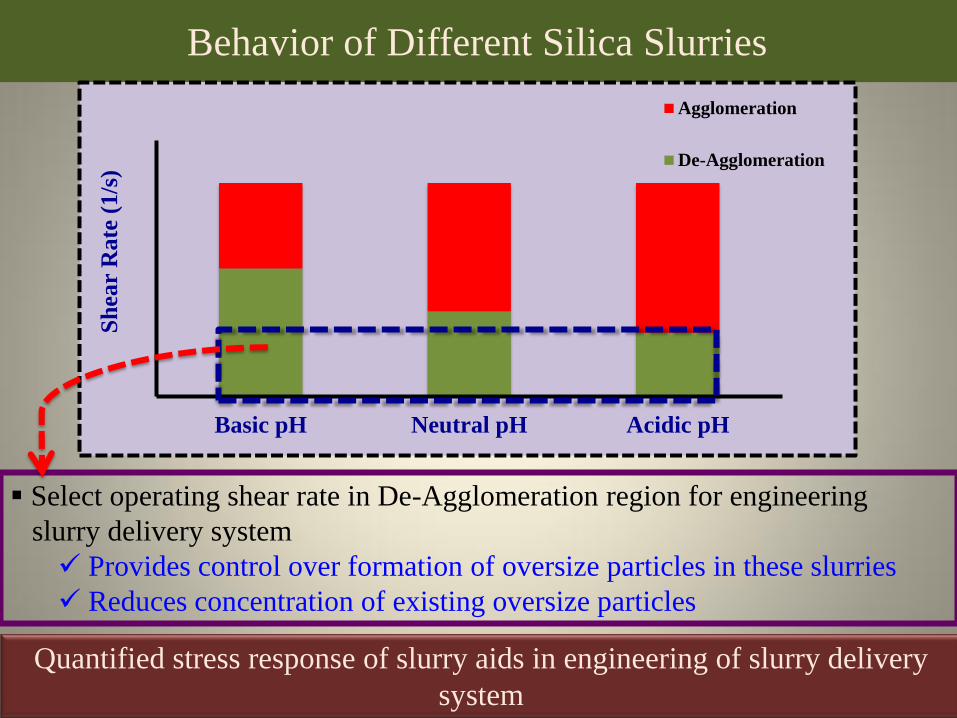
Behavior of Different Silica Slurries
Quantified stress response of slurry aids in engineering of slurry delivery
system
Select operating shear rate in De-Agglomeration region for engineering
slurry delivery system
Provides control over formation of oversize particles in these slurries
Reduces concentration of existing oversize particles
0
500
1000
1500
2000
2500
3000
Basic pH Neutral pH Acidic pH
Sh
ear
Rate
(1/s
) Agglomeration
De-Agglomeration

Measurement of stability ratio for determining CMP
slurry stability
Part II
Better metrology quality control over incoming slurries
Defectivity
F. Chi. et al. “Externally Induced agglomeration
during CMP of metals and dielectrics”
Oversize particles are prime contributors of defectivity during CMP
Need to reduce formation of oversize particles
• Electrical short circuit (defects in metal
interconnects)
• Increase in leakage current
• Unpredictable dielectric breakdown
• More susceptible to damage from oversize particles
Defects during CMP
Typical problems due to defects
Critical for Low-K Dielectrics
Killer defects, Arc scratches, Voids or pits,
Embedded particle
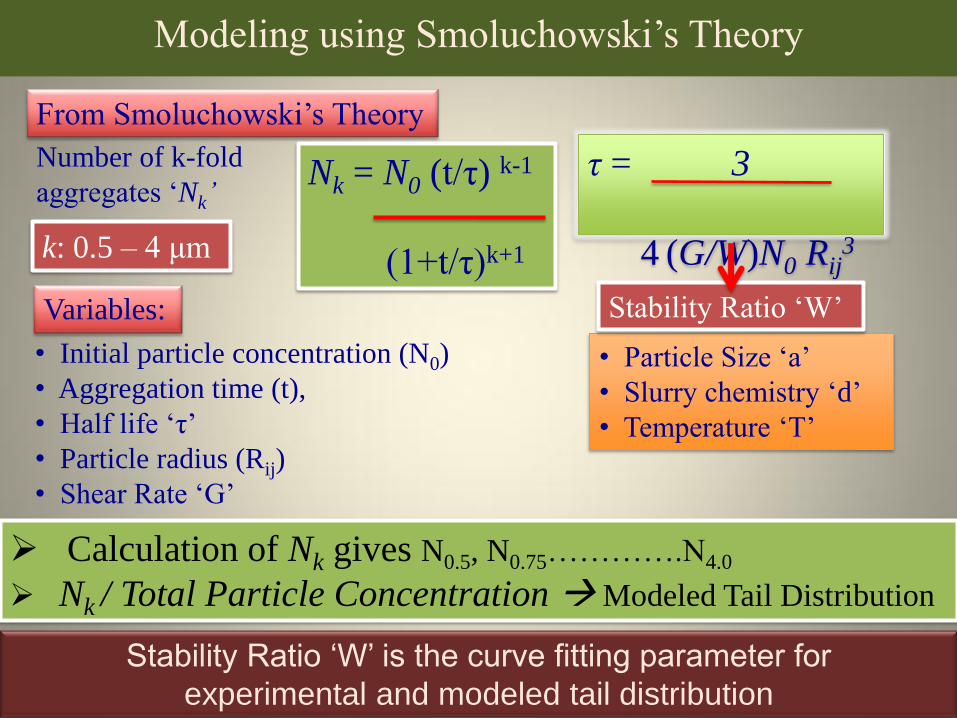
Modeling using Smoluchowski’s Theory
Stability Ratio „W‟ is the curve fitting parameter for
experimental and modeled tail distribution
• Initial particle concentration (N0)
• Aggregation time (t),
• Half life ‘τ’
• Particle radius (Rij)
• Shear Rate ‘G’
From Smoluchowski’s Theory
Number of k-fold
aggregates ‘Nk’
τ = 3
4 (G/W)N0 Rij
3
Nk = N0 (t/τ) k-1
(1+t/τ)k+1 k: 0.5 – 4 μm
Variables:
Calculation of Nk gives N0.5, N0.75………….N4.0
Nk / Total Particle Concentration Modeled Tail Distribution
• Particle Size ‘a’
• Slurry chemistry ‘d’
• Temperature ‘T’
Stability Ratio ‘W’
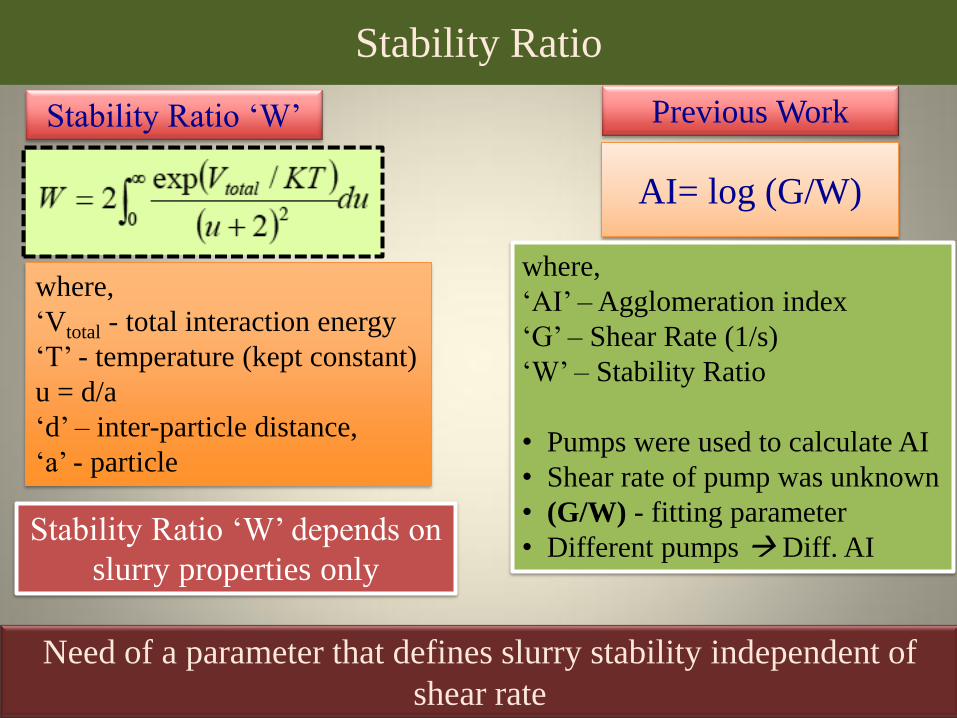
Stability Ratio
Need of a parameter that defines slurry stability independent of
shear rate
where,
‘Vtotal - total interaction energy
‘T’ - temperature (kept constant)
u = d/a
‘d’ – inter-particle distance,
‘a’ - particle
Stability Ratio ‘W’
Stability Ratio ‘W’ depends on
slurry properties only
Previous Work
AI= log (G/W)
where,
‘AI’ – Agglomeration index
‘G’ – Shear Rate (1/s)
‘W’ – Stability Ratio
• Pumps were used to calculate AI
• Shear rate of pump was unknown
• (G/W) - fitting parameter
• Different pumps Diff. AI

Determination of Stability Ratio
STEP 1 Measure cumulative concentration
of as-received and stressed slurry
As-Received Slurry
Silco EM-3530K
Colloidal Silica
35 nm
10-wt% solids
pH 2, 7 and 11
STEP 3 Model final tail distribution by
solving Smoluchowski’s Theory
Shear Rates
1500 – 3000 s-1
Part Conc.
Number of particles
of different sizes
from 0.5 – 200 μm
STEP 4 Curve fitting of modeled and
experimental tail distribution
STEP 2 Calculate : Part Conc.
Total Particle Conc.
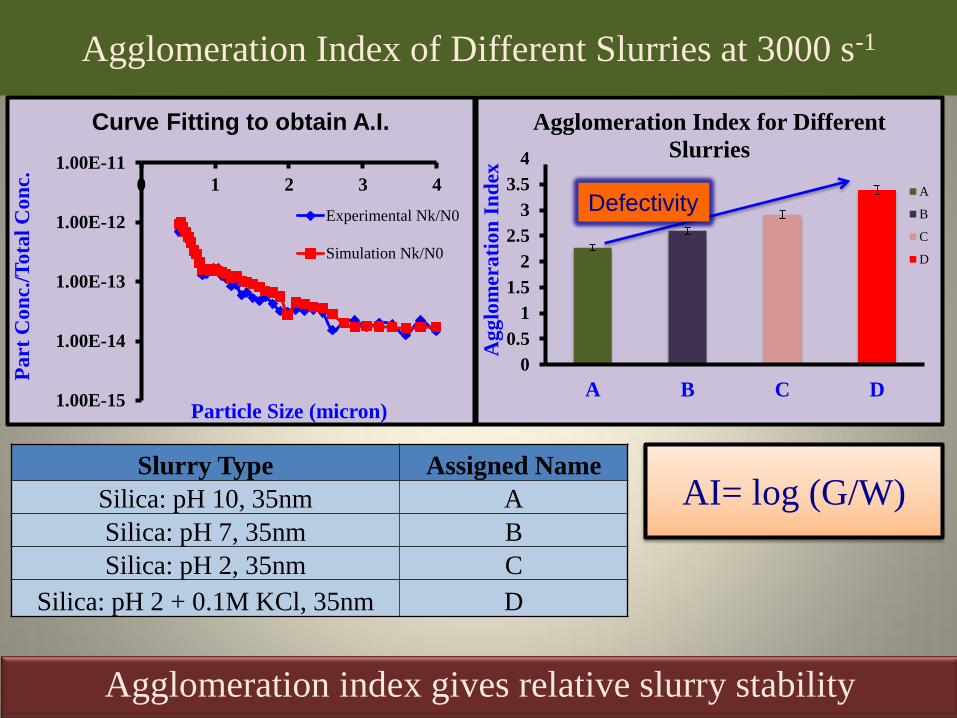
Agglomeration Index of Different Slurries at 3000 s-1
0
0.5
1
1.5
2
2.5
3
3.5
4
A B C D
Ag
glo
mer
ati
on
In
dex
Agglomeration Index for Different
Slurries
A
B
C
D
Agglomeration index gives relative slurry stability
Defectivity
1.00E-15
1.00E-14
1.00E-13
1.00E-12
1.00E-11
0 1 2 3 4
Pa
rt C
on
c./T
ota
l C
on
c.
Particle Size (micron)
Curve Fitting to obtain A.I.
Experimental Nk/N0
Simulation Nk/N0
Slurry Type Assigned Name
Silica: pH 10, 35nm A
Silica: pH 7, 35nm B
Silica: pH 2, 35nm C
Silica: pH 2 + 0.1M KCl, 35nm D
AI= log (G/W)

Stability Ratio vs. Agglomeration Index
at Different Shear Rates
1.50
2.00
2.50
3.00
3.50
4.00
1000 1500 2000 2500 3000 3500
AI
Shear Rate (1/s)
Agglomeration Index (AI) vs. Shear Rate
A
B
C
D
Agglomeration index changes with shear rate
0
5
10
15
20
1000 1500 2000 2500 3000 3500
Sta
bil
ity
Ra
tio
Shear Rate (1/s)
Stability Ratio vs. Shear Rate (1/s)
A
B
C
D
Stability ratio is independent of shear rate and a better
parameter than agglomeration index
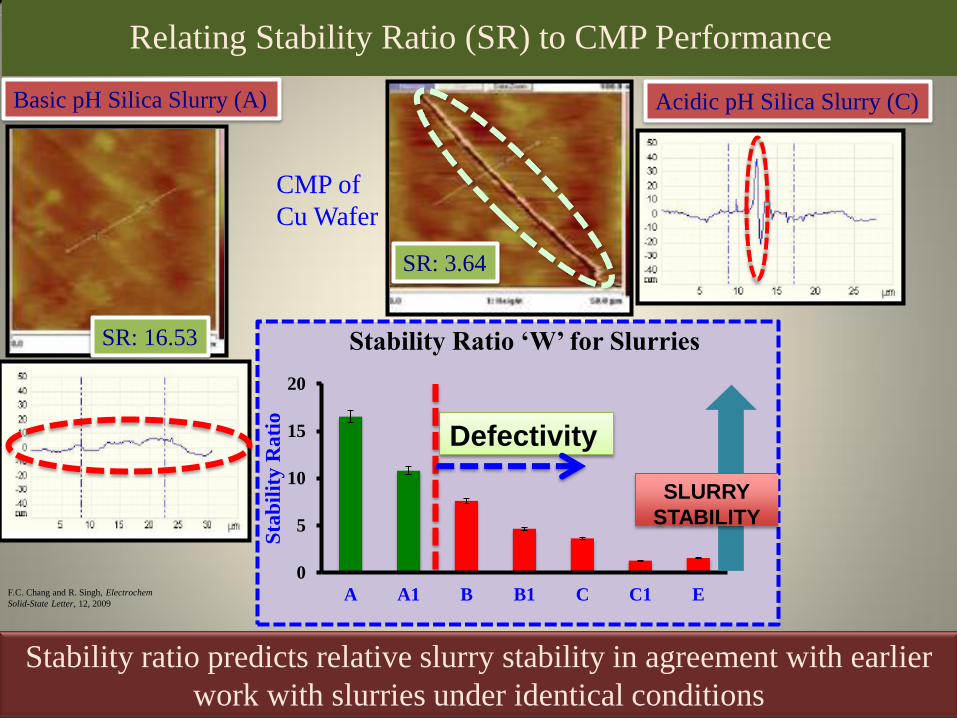
Relating Stability Ratio (SR) to CMP Performance
F.C. Chang and R. Singh, Electrochem
Solid-State Letter, 12, 2009
0
5
10
15
20
A A1 B B1 C C1 E
Sta
bil
ity
Ra
tio
Stability Ratio ‘W’ for Slurries
SLURRY
STABILITY
Defectivity
Stability ratio predicts relative slurry stability in agreement with earlier
work with slurries under identical conditions
Basic pH Silica Slurry (A) Acidic pH Silica Slurry (C)
CMP of
Cu Wafer
SR: 16.53
SR: 3.64
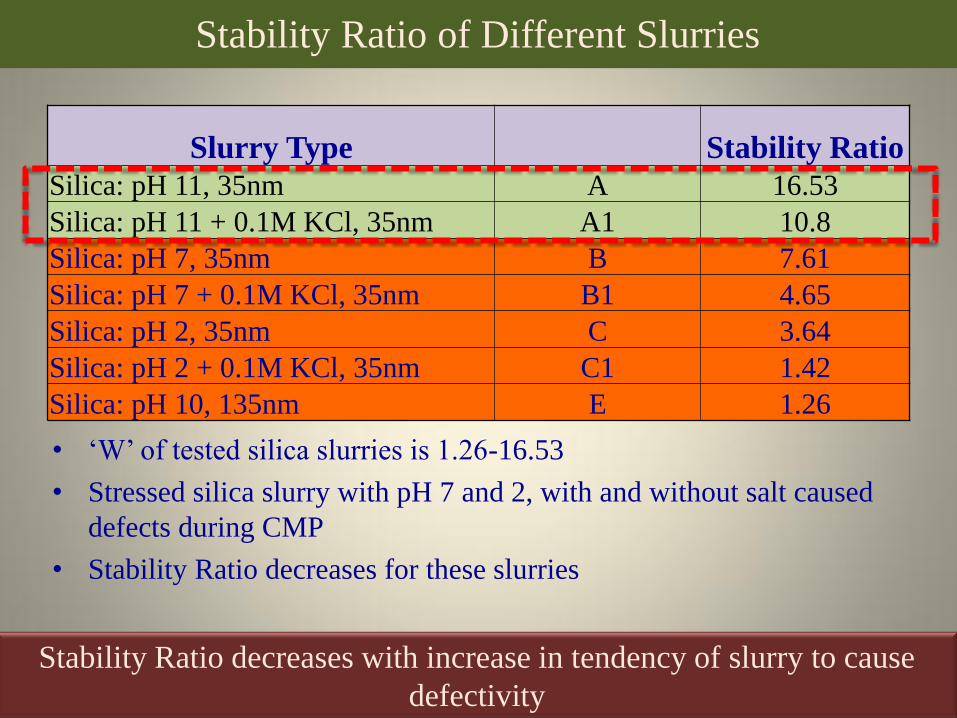
Stability Ratio of Different Slurries
• ‘W’ of tested silica slurries is 1.26-16.53
• Stressed silica slurry with pH 7 and 2, with and without salt caused
defects during CMP
• Stability Ratio decreases for these slurries
Slurry Type Stability Ratio
Silica: pH 11, 35nm A 16.53
Silica: pH 11 + 0.1M KCl, 35nm A1 10.8
Silica: pH 7, 35nm B 7.61
Silica: pH 7 + 0.1M KCl, 35nm B1 4.65
Silica: pH 2, 35nm C 3.64
Silica: pH 2 + 0.1M KCl, 35nm C1 1.42
Silica: pH 10, 135nm E 1.26
Stability Ratio decreases with increase in tendency of slurry to cause
defectivity
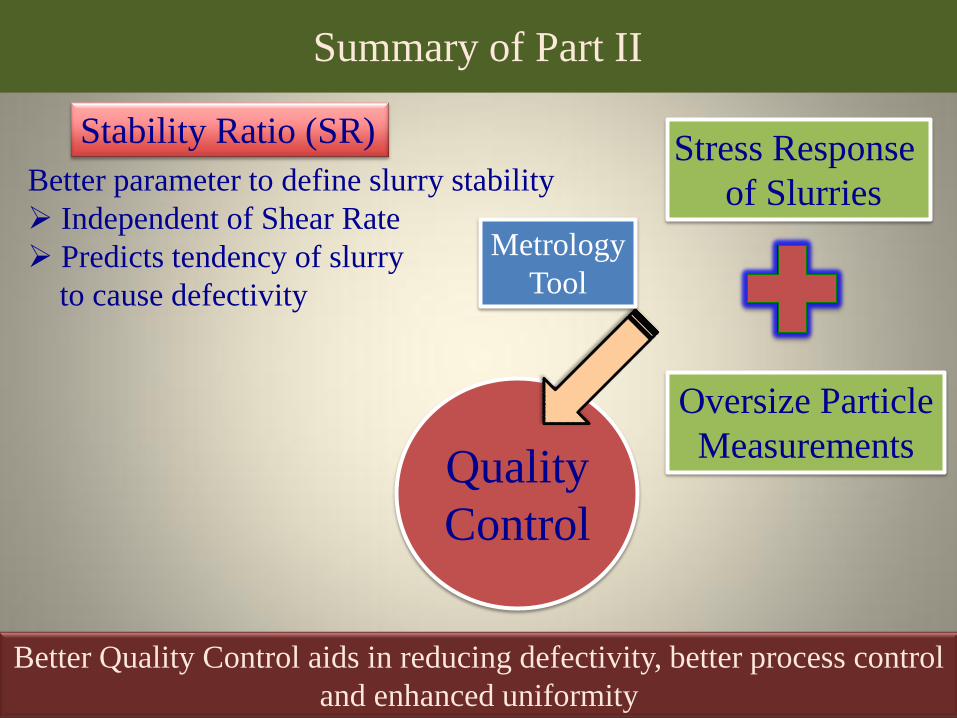
Summary of Part II
Stability Ratio (SR)
Better parameter to define slurry stability
Independent of Shear Rate
Predicts tendency of slurry
to cause defectivity
Quality
Control
Stress Response
of Slurries
Oversize Particle
Measurements
Metrology
Tool
Better Quality Control aids in reducing defectivity, better process control
and enhanced uniformity
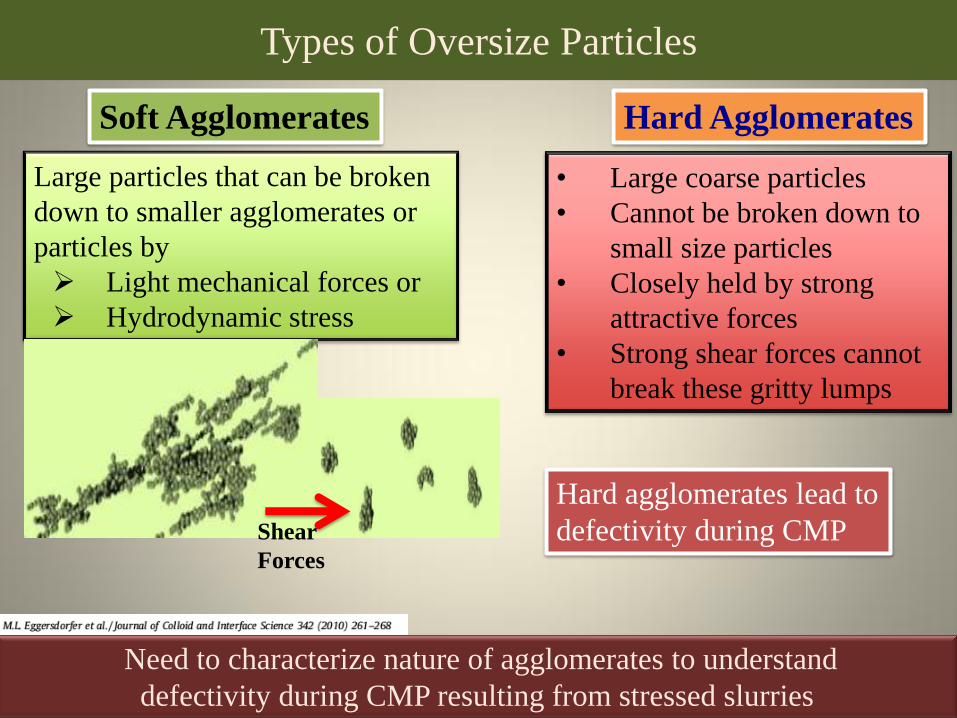
Types of Oversize Particles
Large particles that can be broken
down to smaller agglomerates or
particles by
Light mechanical forces or
Hydrodynamic stress
• Large coarse particles
• Cannot be broken down to
small size particles
• Closely held by strong
attractive forces
• Strong shear forces cannot
break these gritty lumps
Shear
Forces
Need to characterize nature of agglomerates to understand
defectivity during CMP resulting from stressed slurries
Hard agglomerates lead to
defectivity during CMP
Hard Agglomerates Soft Agglomerates
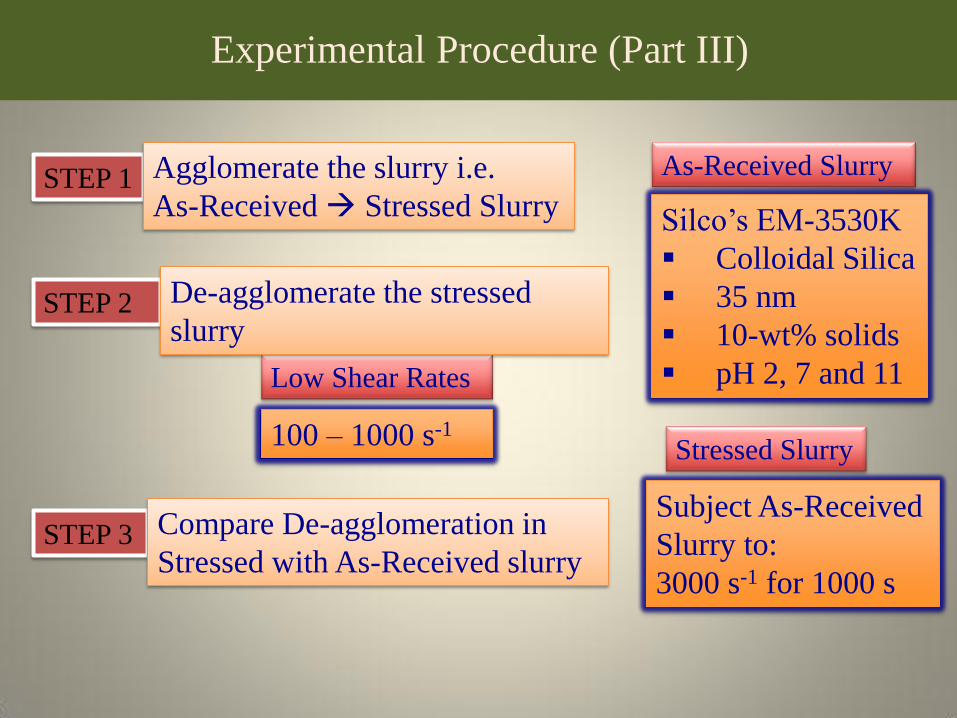
Experimental Procedure (Part III)
STEP 1 Agglomerate the slurry i.e.
As-Received Stressed Slurry
STEP 3 Compare De-agglomeration in
Stressed with As-Received slurry
Low Shear Rates
100 – 1000 s-1
STEP 2 De-agglomerate the stressed
slurry
As-Received Slurry
Silco’s EM-3530K
Colloidal Silica
35 nm
10-wt% solids
pH 2, 7 and 11
Stressed Slurry
Subject As-Received
Slurry to:
3000 s-1 for 1000 s
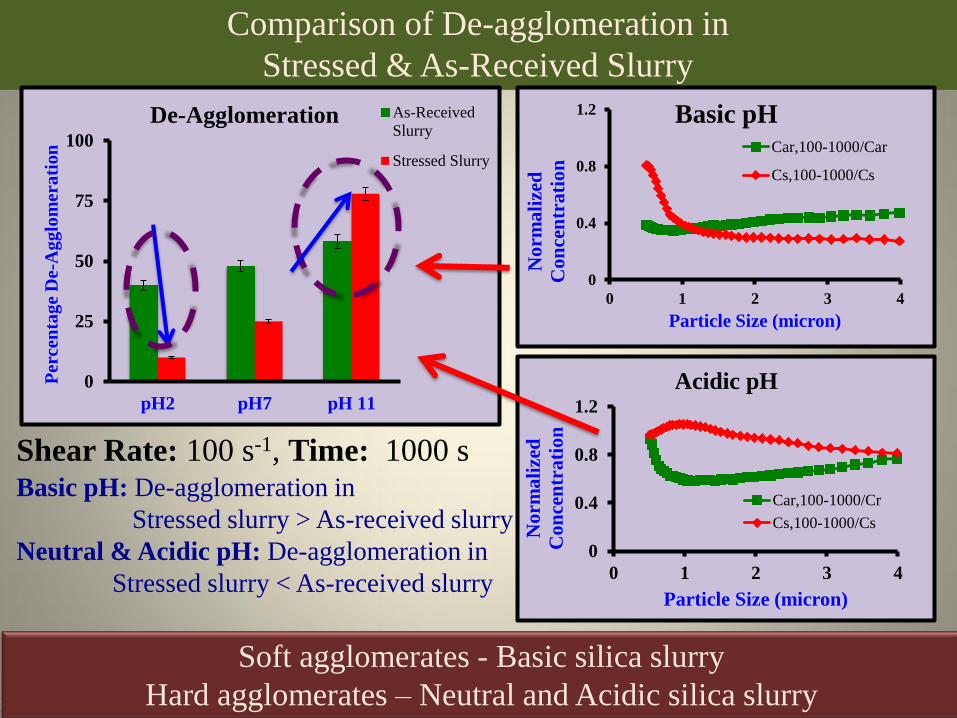
Comparison of De-agglomeration in
Stressed & As-Received Slurry
Shear Rate: 100 s-1, Time: 1000 s
0
0.4
0.8
1.2
0 1 2 3 4
Norm
ali
zed
Con
cen
tra
tio
n
Particle Size (micron)
Basic pH Car,100-1000/Car
Cs,100-1000/Cs
0
0.4
0.8
1.2
0 1 2 3 4
Norm
ali
zed
Con
cen
tra
tio
n
Particle Size (micron)
Acidic pH
Car,100-1000/Cr
Cs,100-1000/Cs
0
25
50
75
100
pH2 pH7 pH 11
Per
cen
tag
e D
e-A
gg
lom
era
tion
De-Agglomeration As-Received
Slurry
Stressed Slurry
Soft agglomerates - Basic silica slurry
Hard agglomerates – Neutral and Acidic silica slurry
Basic pH: De-agglomeration in
Stressed slurry > As-received slurry
Neutral & Acidic pH: De-agglomeration in
Stressed slurry < As-received slurry
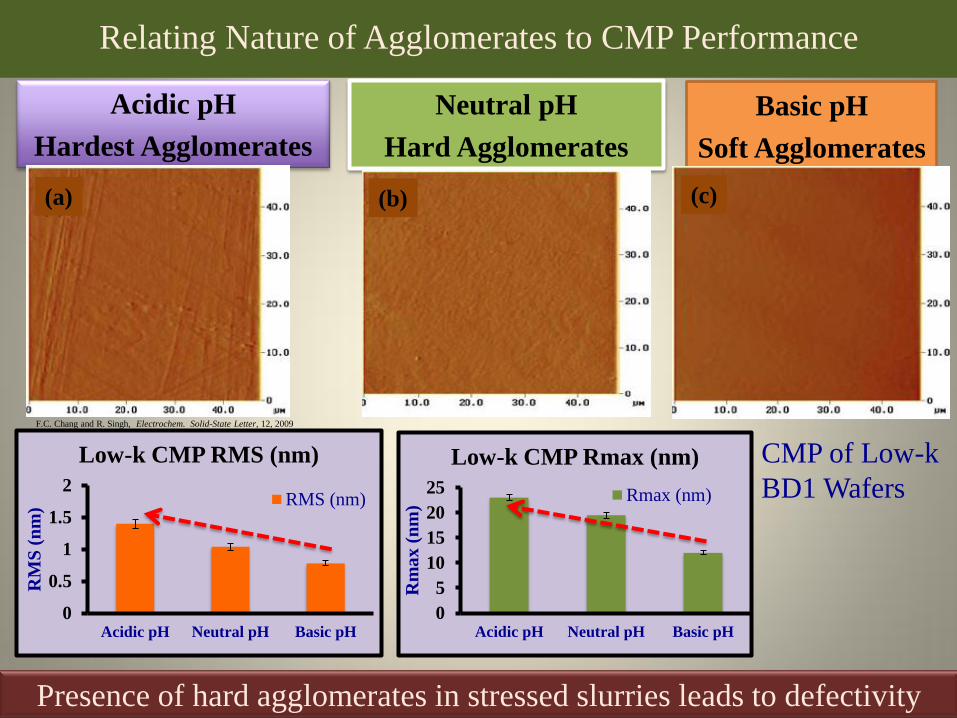
Relating Nature of Agglomerates to CMP Performance
Acidic pH
Hardest Agglomerates
F.C. Chang and R. Singh, Electrochem. Solid-State Letter, 12, 2009
Neutral pH
Hard Agglomerates
Basic pH
Soft Agglomerates
CMP of Low-k
BD1 Wafers
Presence of hard agglomerates in stressed slurries leads to defectivity
0
5
10
15
20
25
Acidic pH Neutral pH Basic pH
Rm
ax
(n
m)
Low-k CMP Rmax (nm)
Rmax (nm)
(a) (b) (c) (b) (a)
0
0.5
1
1.5
2
Acidic pH Neutral pH Basic pH
RM
S (
nm
)
Low-k CMP RMS (nm)
RMS (nm)
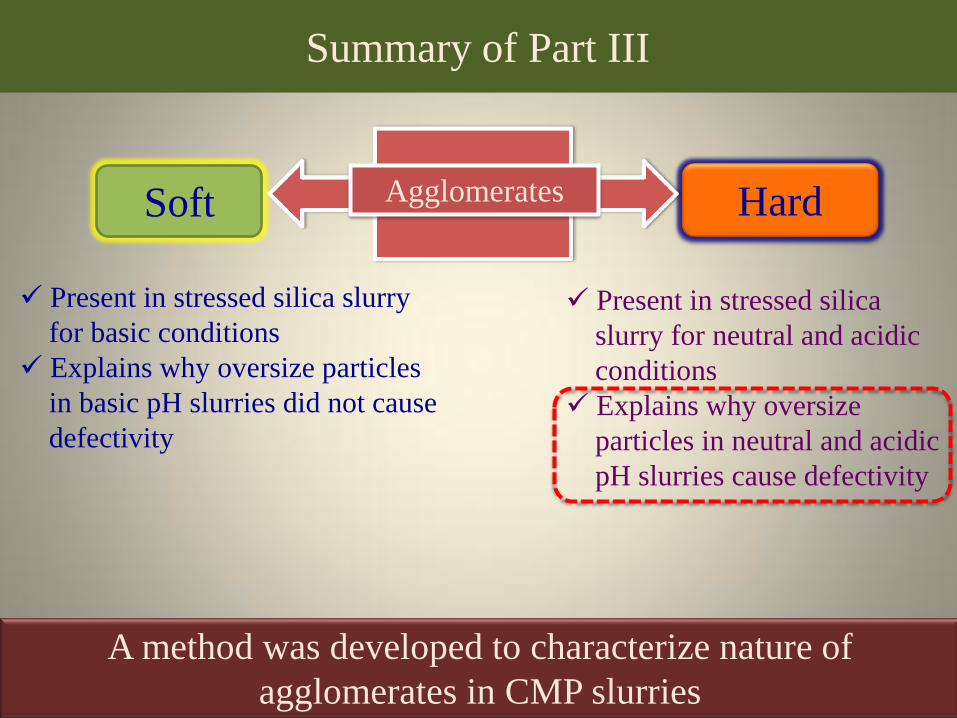
Summary of Part III
Soft Hard
Present in stressed silica slurry
for basic conditions
Explains why oversize particles
in basic pH slurries did not cause
defectivity
A method was developed to characterize nature of
agglomerates in CMP slurries
Present in stressed silica
slurry for neutral and acidic
conditions
Explains why oversize
particles in neutral and acidic
pH slurries cause defectivity
Agglomerates
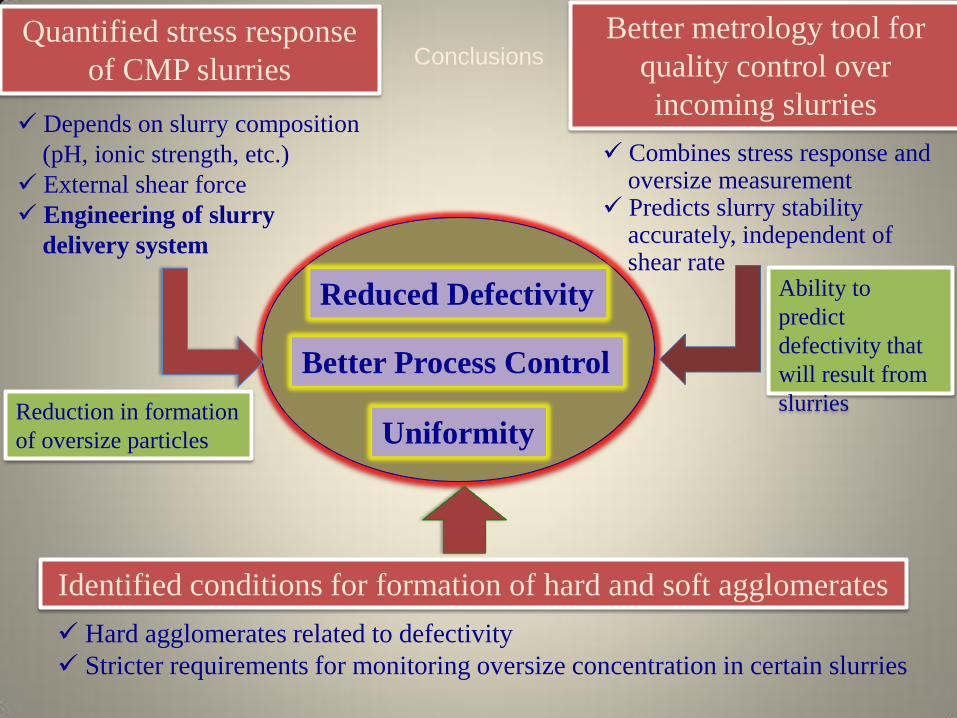
Quantified stress response
of CMP slurries
Identified conditions for formation of hard and soft agglomerates
Better metrology tool for
quality control over
incoming slurries
Reduced Defectivity
Better Process Control
Uniformity
Combines stress response and oversize measurement Predicts slurry stability accurately, independent of shear rate
Depends on slurry composition
(pH, ionic strength, etc.)
External shear force
Engineering of slurry
delivery system
Hard agglomerates related to defectivity
Stricter requirements for monitoring oversize concentration in certain slurries
Reduction in formation
of oversize particles
Ability to
predict
defectivity that
will result from
slurries
Conclusions