quantification of infringement in manufacture of jewellery ...jewellery, fashion jewellery and...
TRANSCRIPT
Quantification of infringement in Manufacture of jewellery and related articles (NACE 32.12); Manufacture of imitation jewellery and related articles (NACE 32.13); and Manufacture of watches and clocks (NACE 26.52)
www.oami.europa.eu
2
3
The economic cost of IPR infringement in jewellery and watches
www.oami.europa.eu

4
Acknowledgements
Project Team
The authors would like to thank members of the Economics & Statistics Working Group of the Observatory who provided useful comments on the reports in this series and on the methodology used.
Nathan Wajsman, Chief EconomistCarolina Arias Burgos, EconomistChristopher Davies, Economist

5
The economic cost of IPR infringement in jewellery and watches
Executive Summary
1. Introduction
2. Impact of counterfeiting in the Jewellery and Watches Sector
3. Conclusions and perspectives
Appendix A: The first stage forecasting model
Appendix B: The second stage econometric model
Appendix C: Description of NACE Rev 2 classes
References
06
08
12
20
21
23
27
00
Contents
6
Executive SummaryThe European Observatory on infringements of Intellectual Property Rights (the Observatory) was created to improve the understanding of the role of Intellectual Property and of the negative consequences of IPR infringements.
In a study carried out in collaboration with the European Patent Office (EPO)1, the Office for Harmonization in the Internal Market (OHIM), acting through the Observatory, calculated that 39% of total economic activity in the EU is generated by IPR-intensive industries, and approximately 26% of all employment in the EU is provided directly by these industries, with a further 9% of jobs in the EU stemming from purchases of goods and services from other industries by IPR-intensive industries.
Another study compared economic performance of European companies that own IPRs2 with those that do not, finding that IPRs owners’ revenue per employee is 29% higher on average. Although only 9% of SMEs own registered IPRs, the firms that do have almost 32% more revenue per employee than firms that do not.
Perceptions and behaviours of European citizens regarding Intellectual Property and counterfeiting and piracy3 were also assessed as part of an EU-wide survey. This survey revealed that although citizens recognise the value of IP in principle, they also tend to justify infringements at individual level in certain cases.
The Observatory has now embarked on an effort to complete the picture by assessing the economic impact of counterfeiting and piracy.
This exercise is challenging from a methodological point of view, as it attempts to shed light on a phenomenon that by its very nature is not directly observable. To pave the way towards quantification of the scope, scale and impact of IPR infringements in the European Union, as identified in its mandate, the Observatory has developed a step by step approach to evaluate the negative impact of counterfeiting and its consequences for legitimate businesses, governments and consumers, and ultimately society as a whole.
Several IP right intensive industries whose products are known or thought to be subject to counterfeiting have been selected. This report presents the results of the fifth sectorial study, covering the jewellery and watches sector4. The EPO/OHIM study revealed that trade marks
1 - “Intellectual Property Rights intensive industries: contribution to economic performance and employment in the European Union”, September 2013
2 - “Intellectual Property Rights and firm performance in Europe: an economic analysis”, June 2015.
3 - “European citizens and intellectual property: perception, awareness and behavior”, November 2013
4 - The jewellery and watches sector analysed here, comprises three NACE classes whose formal names are: NACE 32.12 ‘Manufacture of jewellery and related articles’; NACE 32.13 ‘Manufacture of imitation jewellery and related articles’; and NACE 26.52 ‘Manufacture of watches and clocks’. NACE is the official classification of economic activity used by Eurostat, the statistical office of the EU.
7
The economic cost of IPR infringement in jewellery and watches
and designs were used intensively in manufacture of jewellery and imitations and that both IPRs are intensively used in manufacture of watches, along with patents.
It is estimated that legitimate industry loses approximately EUR 1.9 billion of revenue annually due to the presence of counterfeited jewellery and watches in the EU marketplace, corresponding to 13.5% of the sector’s sales.
These lost sales translate into direct employment losses of approximately 15,000 jobs. This figure does not take account of the effect of imports, since in those cases the associated employment impacts occur outside of the EU. Estimated employment losses in the EU therefore relate to goods produced and consumed within the EU.
If we add the knock-on effects on other industries and on government revenue, when both the direct and indirect effects are considered, counterfeiting in this sector causes approximately EUR 3.5 billion of lost sales to the EU economy, which in turns leads to employment losses of about 28,500 jobs and a loss of EUR 600 million in government revenue.
It is important to note that in contrast to the first two reports in this series5, the impacts of counterfeiting for jewellery and watches refers only to manufacturing and so does not include wholesale and retail trade6. For that reason, the absolute numbers in this report cannot be directly compared to those previously presented for cosmetics and personal care and for clothing and footwear.
5 - That is, the reports on cosmetics and personal care products and on clothing, footwear and accessories.
6 - The reason is that until 2008, the data provided by Eurostat did not distinguish between retail sales of jewellery and watches and retail sales of other goods which are not part of these NACE codes. It is therefore not possible to calculate the trade margins for jewellery and watches for a sufficiently long time period to include them in the analysis.
8
1. IntroductionA major problem which has hindered the effective enforcement of Intellectual Property Rights (IPR) in the EU is related to a lack of knowledge in relation to the precise scope, scale and impact of IPR infringements. Many attempts to quantify the scale of counterfeiting and its consequences for businesses, consumers and society as a whole have suffered from the absence of a consensual and consistent methodology for collecting and analysing data on counterfeiting and piracy across various sectors. Different approaches have been used, such as surveys, mystery shopping, monitoring of online activities, making it all the more difficult to aggregate results for the whole economy. The very nature of the phenomenon under investigation makes it extremely challenging to quantify reliably, as obtaining comprehensive data for a hidden and secretive activity is by necessity difficult.
These challenges have in turn hindered the tasks of those involved in enforcing IP rights and in charge of establishing precise priorities, programmes and targets for enforcement, as they limit the possibilities to design more focused policies as well as evidence-based public awareness campaigns.
To help overcome these challenges while taking fully into account of methodological constraints, the Observatory developed a specific approach that has so far been applied to the Cosmetics and Personal Care; Clothing, Footwear and Accessories; Sports Goods; Games and Toys sectors.
In the present report the Observatory focuses its attention on the sector of manufacture of jewellery, fashion jewellery and watches. The sector covers different products, including:
3212 Manufacture of jewellery and related articles 3213 Manufacture of imitation jewellery (fashion jewellery) and related articles 2653 Manufacture of watches and clocks
Further detail on the products included in these NACE codes can be found in Appendix C.
The approach in this study aims to estimate the scale of the two major economic impacts of counterfeiting which cover the direct and indirect costs to industry and the wider costs to government and society.
9
The economic cost of IPR infringement in jewellery and watches
1) Direct costs to industry
The costs to industry are mainly composed of lost sales due to counterfeiting. Estimation of lost sales is therefore a necessary first step, both because it constitutes a major economic consequence in itself and because it drives other consequences, for example the loss of public fiscal revenue.
The methodology builds on an adaptation of a methodology developed for the European Commission7 so that it can be used on a sectorial level rather than on a firm level which proved very difficult to apply in practice.
Variations in a sector’s sales are analysed using statistical techniques which allow the researcher to relate them to economic and social factors and thereby estimate the amount of sales lost by rights holders due to counterfeiting.
Loss of sales also leads to loss of employment in the affected sector, which can be derived from European statistical data on employment for the sector in question.
2) Indirect effects of counterfeiting
In addition to the direct loss of sales in the identified sector, there are also impacts on other sectors of the EU economy. These indirect effects are a result of the fact that the different sectors of the economy buy goods and services from each other for use in their production processes. If one sector’s sales are reduced because of counterfeiting, then this sector will also buy fewer goods and services from its suppliers, causing sales declines and corresponding employment effects in other sectors.
3) Impacts on public finances
Since the activity in question is illegal, it is likely that those engaged in manufacture of counterfeit goods do not pay taxes on the resulting revenues and incomes. Therefore, an additional impact of counterfeiting is the resulting losses of tax revenue by government, specifically income taxes and social contributions, corporate taxes, and indirect taxes such as excise taxes or VAT.
In order to approximate these costs, several relationships are estimated. The methodology is fully explained in Appendices A and B and is briefly outlined below.
Step 1: Estimation of lost sales due to counterfeiting
Predicted sales of the sector are generated and compared with actual sales in each country, as reported in official statistics. The difference can then be partly explained by socio-economic factors such as GDP growth. In addition, factors related to counterfeiting are considered, such as the behaviour of consumers, and the characteristics of a country’s markets and
7 - RAND (2012) : Measuring IPR infringements in the internal market. Report prepared for the European Commission.
10
its legal and regulatory environments8. The difference between forecast and actual sales is analysed
Step 2: Translation of lost sales into lost jobs and lost public revenue
Since the legitimate industry sells less than it would have sold in the absence of counterfeiting, it also employs fewer workers. Data from Eurostat on employment in this sector is used to estimate the employment lost related to the reduction of legitimate business as a result of lost sales due to counterfeiting.
In addition to the direct loss of sales in the sector being analysed, there are also indirect impacts on other sectors as this sector will also buy fewer goods and services from its suppliers, causing sales declines and corresponding employment effects in other sectors.
Furthermore, the reduced economic activity in the private sector has an impact on government revenue, essentially tax revenue such as VAT, household income tax and tax on company profits, but also social security contributions.
It should be noted that the indirect effect of sales lost due to counterfeiting only include losses in sectors that provide inputs to manufacture of legal products in the EU. Possible positive effects of inputs provided for production of illicit goods that could be manufactured inside or outside the EU, are ignored in this study. In other words, the indirect effect calculated is a gross effect that does not take into account the long-term effect of sales displacement from legal to illegal producers. The net employment effect could therefore be smaller than the gross effect calculated here.
Similarly, while illicit activities do not generate the same levels of tax revenue as legal activities, to the extent that sales of counterfeits happen in the legitimate sales channels, some amount of direct and indirect taxes are levied on these products, and so the net reduction in government revenue may be smaller than the gross effect calculated here.
Unfortunately, data currently available do not allow for calculation of these net effects with any degree of accuracy.
The next section presents the main findings of the study.
8 - Perceptions of corruption by citizens from Eurobarometer and one of the Worldwide Governance Indicators from the World Bank are used in this study.

11
The economic cost of IPR infringement in jewellery and watches
12
2. Impact of counterfeiting in the Jewellery and Watches SectorThe starting point of this analysis is the estimation of consumption of these products in each EU Member State. Based on official data from Eurostat on production and intra and extra EU trade, it is estimated that the total consumption of jewellery and watches in the EU (without wholesale and retail trade margins) was EUR 14 billion in 20129.
Information on wholesale and retail trade of jewellery and watches cannot be obtained from official statistics, so the estimation of consumption for these products is at producers prices and thus does not include the value of trade margins paid to distributors and retailers.
In the same year, there were approximately 100 thousand people employed in the jewellery and watches manufacturing sector in the EU.
Manufacture of jewellery is the most significant NACE class among the three included in this analysis, with 80 thousand persons employed and a production of EUR 11 billion in 2012. The largest producers in the EU are Italy (EUR 5 billion); France, Germany and Belgium (approximately EUR 1.2 billion in each country) and the United Kingdom (nearly EUR 1 billion). The EU is a net exporter of jewellery, with extra EU exports of EUR 15.2 billion and imports of EUR 11.7 billion. Conversely, the EU is net importer of watches and imitation jewellery, with EUR 3.7 billion of net extra-EU imports of watches and EUR 1 billion of net imports of imitation jewellery.
The EU industry is comprised of 37,100 enterprises, with an average of 2.8 workers per firm. This data underline the pre-dominance of small companies in the manufacture of jewellery and watches across the EU.
Based on country-level consumption data, the difference between forecast sales and actual sales has been estimated for each country (Appendix A), and analysed using statistical methods (Appendix B), relating the sales shortfall to factors (called variables in economic parlance) such as:
GDP growth (socio-economic variables);
The percentage of the population considering that corruption is a major problem10 (Eurobarometer) and the growth rate of the World Bank Index of Control of Corruption11 (variables related to counterfeiting).
9 - In 2012, EU production amounted to EUR 13 billion. Net imports from third countries were EUR 1 billion, leaving EUR 14 billion (at producer prices) for consumption in the EU.
10 - According to WCO (2012), “the predominance of the informal economy is then associated with corruption and the degree of regulation...” So, to the extent that counterfeiting is part of the informal economy, a measure of corruption could be considered explanatory for counterfeiting.
11 - Worldwide Governance Indicator on Control of Corruption captures the perceptions of the extent to which public power is exercised for private gain, including both petty and grand forms of corruption, as well as “capture” of the state by elites and private interests.
13
The economic cost of IPR infringement in jewellery and watches
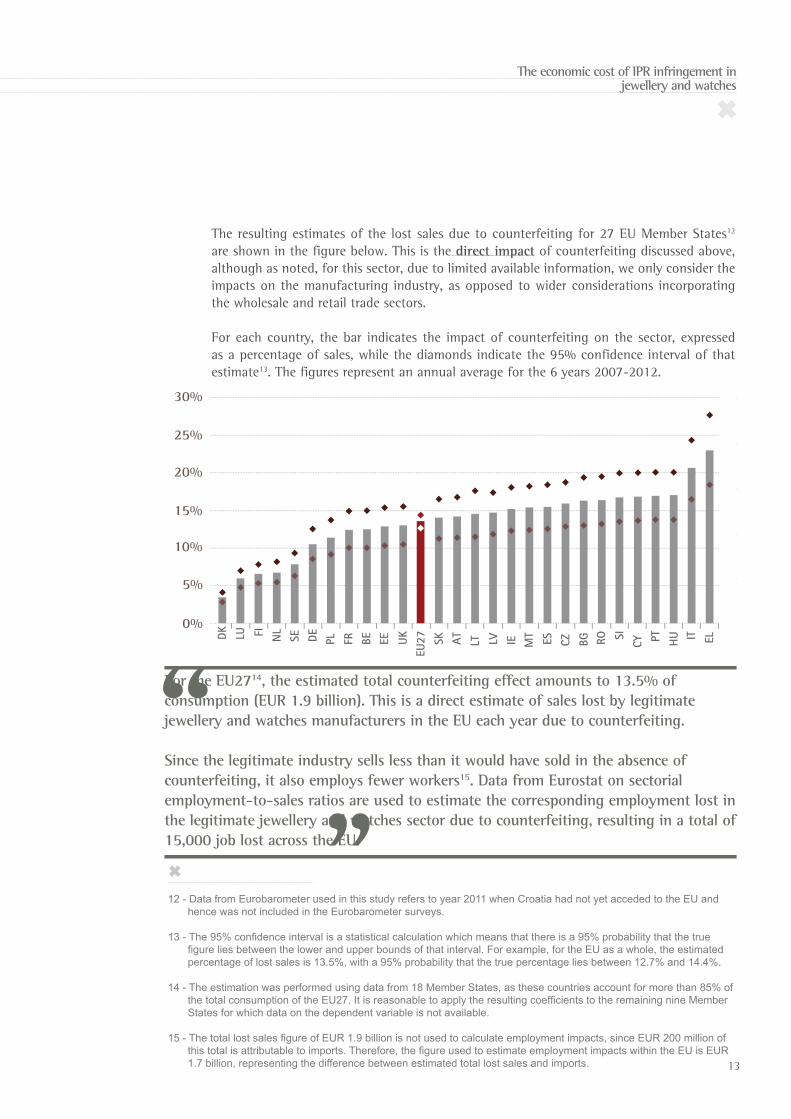
The resulting estimates of the lost sales due to counterfeiting for 27 EU Member States12 are shown in the figure below. This is the direct impact of counterfeiting discussed above, although as noted, for this sector, due to limited available information, we only consider the impacts on the manufacturing industry, as opposed to wider considerations incorporating the wholesale and retail trade sectors.
For each country, the bar indicates the impact of counterfeiting on the sector, expressed as a percentage of sales, while the diamonds indicate the 95% confidence interval of that estimate13. The figures represent an annual average for the 6 years 2007-2012.
12 - Data from Eurobarometer used in this study refers to year 2011 when Croatia had not yet acceded to the EU and hence was not included in the Eurobarometer surveys.
13 - The 95% confidence interval is a statistical calculation which means that there is a 95% probability that the true figure lies between the lower and upper bounds of that interval. For example, for the EU as a whole, the estimated percentage of lost sales is 13.5%, with a 95% probability that the true percentage lies between 12.7% and 14.4%.
14 - The estimation was performed using data from 18 Member States, as these countries account for more than 85% of the total consumption of the EU27. It is reasonable to apply the resulting coefficients to the remaining nine Member States for which data on the dependent variable is not available.
15 - The total lost sales figure of EUR 1.9 billion is not used to calculate employment impacts, since EUR 200 million of this total is attributable to imports. Therefore, the figure used to estimate employment impacts within the EU is EUR 1.7 billion, representing the difference between estimated total lost sales and imports.
For the EU2714, the estimated total counterfeiting effect amounts to 13.5% of consumption (EUR 1.9 billion). This is a direct estimate of sales lost by legitimate jewellery and watches manufacturers in the EU each year due to counterfeiting.
Since the legitimate industry sells less than it would have sold in the absence of counterfeiting, it also employs fewer workers15. Data from Eurostat on sectorial employment-to-sales ratios are used to estimate the corresponding employment lost in the legitimate jewellery and watches sector due to counterfeiting, resulting in a total of 15,000 job lost across the EU.
DK LU UKSE EE SI PTCZPLNL
LT
FI
CYIEBE LVDE ATFR SK
EU27 MT ES BG ITHURO EL
30%
25%
20%
15%
10%
5%
0%
14
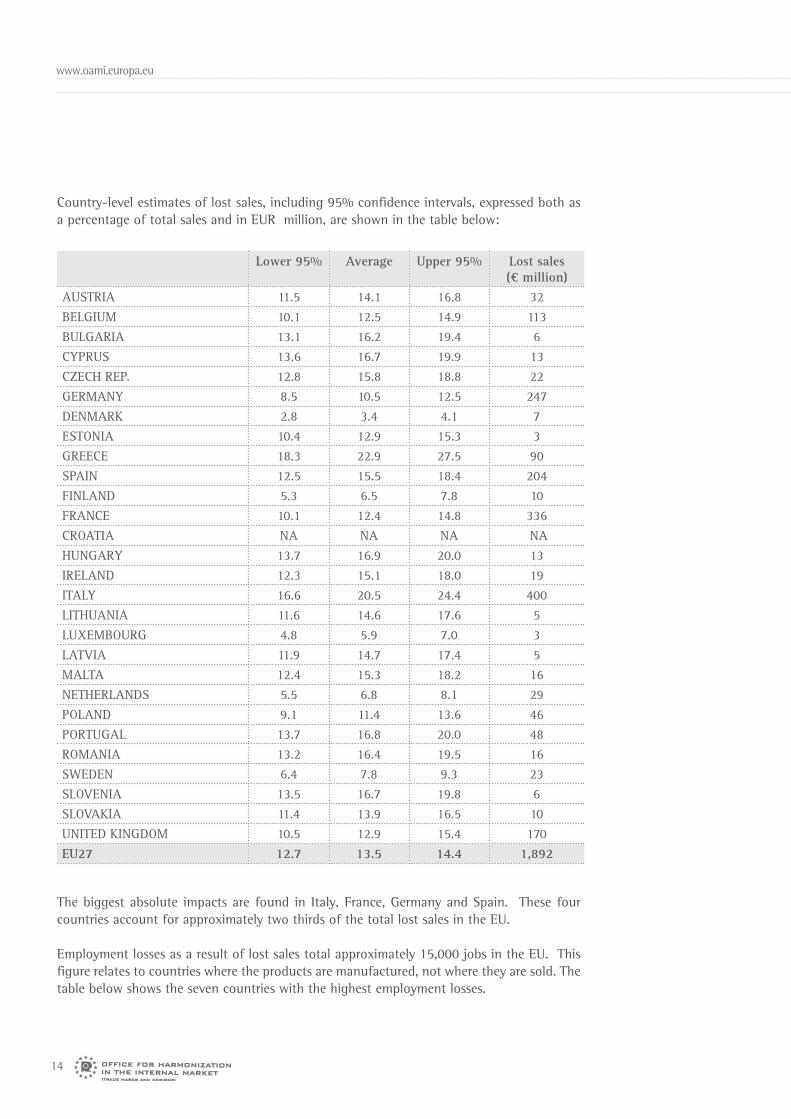
Country-level estimates of lost sales, including 95% confidence intervals, expressed both as a percentage of total sales and in EUR million, are shown in the table below:
The biggest absolute impacts are found in Italy, France, Germany and Spain. These four countries account for approximately two thirds of the total lost sales in the EU.
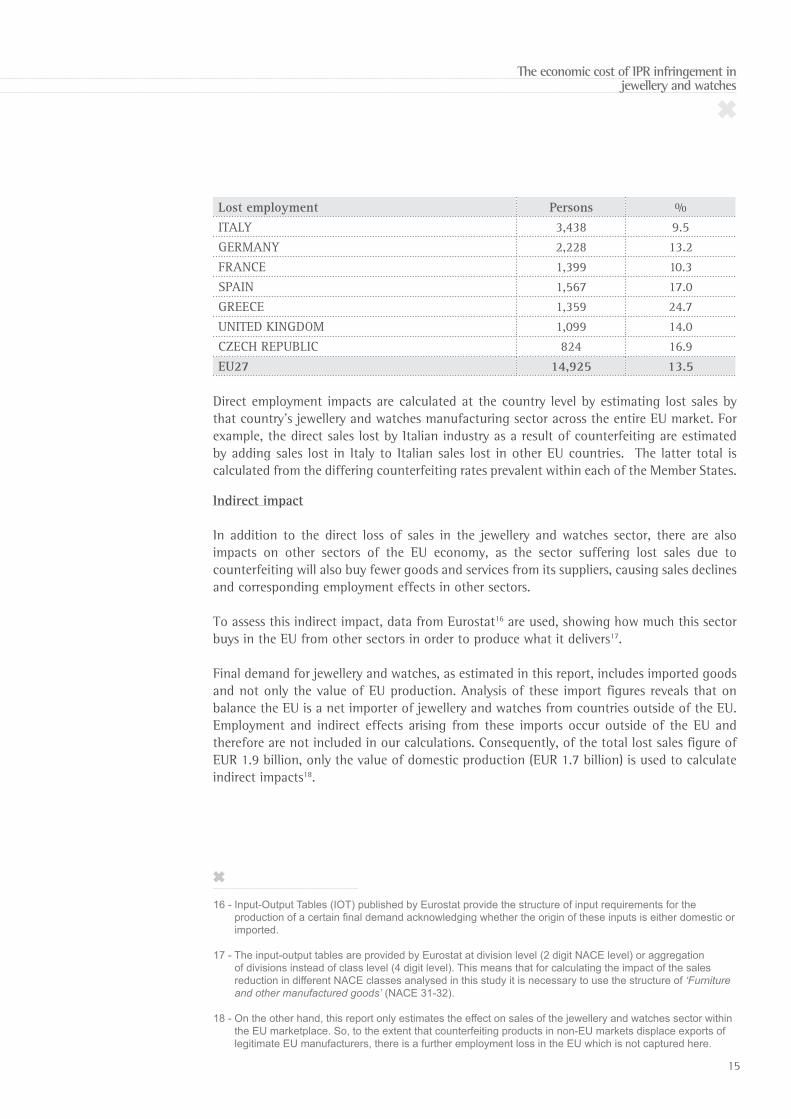
Employment losses as a result of lost sales total approximately 15,000 jobs in the EU. This figure relates to countries where the products are manufactured, not where they are sold. The table below shows the seven countries with the highest employment losses.
Lower 95% Average Upper 95% Lost sales(€ million)
AUSTRIA 11.5 14.1 16.8 32BELGIUM 10.1 12.5 14.9 113BULGARIA 13.1 16.2 19.4 6CYPRUS 13.6 16.7 19.9 13CZECH REP. 12.8 15.8 18.8 22GERMANY 8.5 10.5 12.5 247DENMARK 2.8 3.4 4.1 7ESTONIA 10.4 12.9 15.3 3GREECE 18.3 22.9 27.5 90SPAIN 12.5 15.5 18.4 204FINLAND 5.3 6.5 7.8 10FRANCE 10.1 12.4 14.8 336CROATIA NA NA NA NAHUNGARY 13.7 16.9 20.0 13IRELAND 12.3 15.1 18.0 19ITALY 16.6 20.5 24.4 400LITHUANIA 11.6 14.6 17.6 5LUXEMBOURG 4.8 5.9 7.0 3LATVIA 11.9 14.7 17.4 5MALTA 12.4 15.3 18.2 16NETHERLANDS 5.5 6.8 8.1 29POLAND 9.1 11.4 13.6 46PORTUGAL 13.7 16.8 20.0 48ROMANIA 13.2 16.4 19.5 16SWEDEN 6.4 7.8 9.3 23SLOVENIA 13.5 16.7 19.8 6SLOVAKIA 11.4 13.9 16.5 10UNITED KINGDOM 10.5 12.9 15.4 170EU27 12.7 13.5 14.4 1,892
15
The economic cost of IPR infringement in jewellery and watches
Direct employment impacts are calculated at the country level by estimating lost sales by that country’s jewellery and watches manufacturing sector across the entire EU market. For example, the direct sales lost by Italian industry as a result of counterfeiting are estimated by adding sales lost in Italy to Italian sales lost in other EU countries. The latter total is calculated from the differing counterfeiting rates prevalent within each of the Member States.
Lost employment Persons % ITALY 3,438 9.5GERMANY 2,228 13.2FRANCE 1,399 10.3SPAIN 1,567 17.0GREECE 1,359 24.7UNITED KINGDOM 1,099 14.0CZECH REPUBLIC 824 16.9EU27 14,925 13.5
Indirect impact
In addition to the direct loss of sales in the jewellery and watches sector, there are also impacts on other sectors of the EU economy, as the sector suffering lost sales due to counterfeiting will also buy fewer goods and services from its suppliers, causing sales declines and corresponding employment effects in other sectors.
To assess this indirect impact, data from Eurostat16 are used, showing how much this sector buys in the EU from other sectors in order to produce what it delivers17.
Final demand for jewellery and watches, as estimated in this report, includes imported goods and not only the value of EU production. Analysis of these import figures reveals that on balance the EU is a net importer of jewellery and watches from countries outside of the EU. Employment and indirect effects arising from these imports occur outside of the EU and therefore are not included in our calculations. Consequently, of the total lost sales figure of EUR 1.9 billion, only the value of domestic production (EUR 1.7 billion) is used to calculate indirect impacts18.
16 - Input-Output Tables (IOT) published by Eurostat provide the structure of input requirements for the production of a certain final demand acknowledging whether the origin of these inputs is either domestic or imported.
17 - The input-output tables are provided by Eurostat at division level (2 digit NACE level) or aggregation of divisions instead of class level (4 digit level). This means that for calculating the impact of the sales reduction in different NACE classes analysed in this study it is necessary to use the structure of ‘Furniture and other manufactured goods’ (NACE 31-32).
18 - On the other hand, this report only estimates the effect on sales of the jewellery and watches sector within the EU marketplace. So, to the extent that counterfeiting products in non-EU markets displace exports of legitimate EU manufacturers, there is a further employment loss in the EU which is not captured here.
16
Total direct and indirect effects in the EU of lost sales due to counterfeiting as an annual average for the period 2007-2012 amounts to EUR 3.5 billion. Thus, beyond the direct effects on the sectors involved in the manufacture of jewellery and watches (EUR 1.9 billion in annual sales), a further EUR 1.6 billion is lost in other sectors of the economy due to counterfeiting. This is the indirect effect of counterfeiting19.
Turning to employment, if we add losses in the supplier sectors to the direct employment loss in the manufacture of jewellery and watches, the total employment loss resulting from counterfeiting in the EU is estimated at 28,500.
Finally, the reduced economic activity in the legitimate private sector has an impact on government revenues as well20. If we accept this assumption, the lost taxes that sales of jewellery and watches, valued at EUR 1.9 billion would have generated can be calculated, as well as the tax revenues corresponding to the total (direct + indirect) loss of EUR 3.5 billion calculated above.
The three main types of tax considered are21: Value Added Tax (VAT), taxes on household income, and taxes on the income or profits of companies.
1) The lost VAT is estimated on the basis of household consumption of direct lost sales in jewellery and watches (EUR 1.9 billion)22, accounting for EUR 268 million.
2) The lost household income tax, estimated on the basis of the share of wages generated by employment lost to total wages, considering direct and indirect effects on employment, amounts to EUR 135 million.
3) The lost tax on corporate profits is estimated from the share of direct and indirect costs to industry and amounts to around EUR 45 million.
In addition, social security contributions linked to the direct and indirect employment losses are also estimated. Social security contributions data by industry are available in Eurostat, so that social security contributions per employee in each industry can be used to calculate lost contributions as a consequence of counterfeiting. These lost social security contributions amount to EUR 145 million.
19 - As mentioned in Section 1, this calculation assumes that the counterfeit products are produced outside the EU. If they are (partly) produced inside the EU, then the indirect impact would be less than estimated, since those illicit producers would presumably source some of their inputs from EU producers.
20 - According to WIPO (2010) and OECD (2008), most of the empirical work assumes that counterfeiting occurs in informal markets that usually do not generate tax revenues.
21 - National Accounts tax aggregates are published by Eurostat and provide information on total payments for these three taxes to all levels of government.
22 - VAT generated by indirect effects is not estimated because inputs are intermediate uses that in general do not pay VAT.
17
The economic cost of IPR infringement in jewellery and watches
The total loss of government revenue (household income taxes and social security contributions, corporate income taxes and VAT) can be roughly estimated at EUR 593 million.
18
3. Conclusions and perspectivesThe six studies attempting to quantify the scale and impact of IPR infringements in cosmetics and perfumes, clothing and footwear, sports goods, games and toys, handbag and luggage and jewellery and watches have provided coherent estimates of the size of the problem for legitimate businesses and society in terms of lost sales, leading to lost jobs and loss of public revenue. These studies have used a common methodology and demonstrated the benefits of working in cooperation with stakeholders to take advantage of their knowledge of market conditions, while relying on harmonised European statistical data for the analysis.
These sectorial studies will be followed in coming months by other similar studies covering additional sectors, applying the same methodology and combining it with knowledge from industry stakeholders. These sectors include medicines; tobacco; alcoholic beverages covering beer, wine and spirits; computers; and other sectors, depending on availability of data.
In parallel, the Observatory has embarked on a joint study with the Organization for Cooperation and Development (OECD) to estimate the value of counterfeit goods in international trade, and on studies of infringements in the music, film and e-book industries, in this case with the support of the Joint Research Centre of the European Commission.
Taken together, these studies complement each other and will provide a complete and objective picture of the impact of IPR infringements in Europe, in order to help policy makers develop effective enforcement policies.
19
The economic cost of IPR infringement in jewellery and watches
Appendix A: The first stage forecasting model
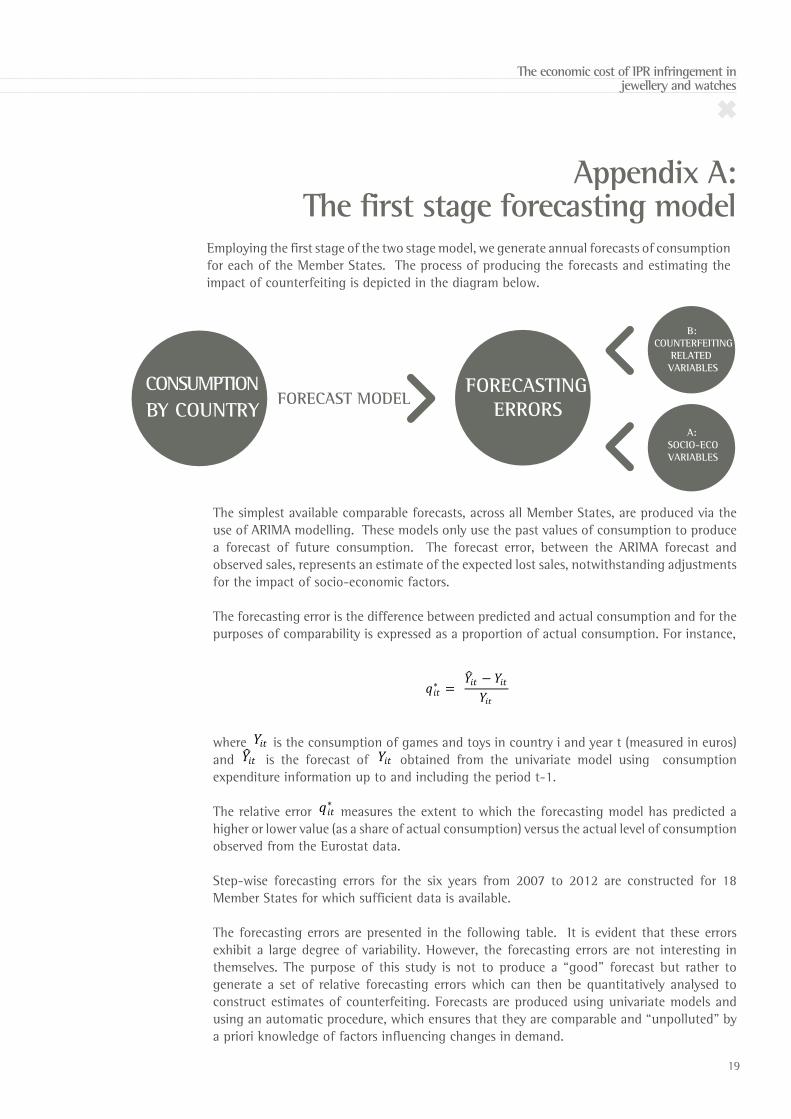
Employing the first stage of the two stage model, we generate annual forecasts of consumption for each of the Member States. The process of producing the forecasts and estimating the impact of counterfeiting is depicted in the diagram below.
FORECAST MODEL billions
FORECASTING ERRORS
B:COUNTERFEITING
RELATED VARIABLES
A:SOCIO-ECOVARIABLES
BY COUNTRY
The simplest available comparable forecasts, across all Member States, are produced via the use of ARIMA modelling. These models only use the past values of consumption to produce a forecast of future consumption. The forecast error, between the ARIMA forecast and observed sales, represents an estimate of the expected lost sales, notwithstanding adjustments for the impact of socio-economic factors.
The forecasting error is the difference between predicted and actual consumption and for the purposes of comparability is expressed as a proportion of actual consumption. For instance,
where 𝑞𝑞𝑖𝑖𝑖𝑖∗ =
𝑌𝑌 𝑖𝑖𝑖𝑖 − 𝑌𝑌𝑖𝑖𝑖𝑖𝑌𝑌𝑖𝑖𝑖𝑖
is the consumption of games and toys in country i and year t (measured in euros) and 𝑞𝑞𝑖𝑖𝑖𝑖
∗ = 𝑌𝑌 𝑖𝑖𝑖𝑖 − 𝑌𝑌𝑖𝑖𝑖𝑖
𝑌𝑌𝑖𝑖𝑖𝑖 is the forecast of 𝑞𝑞𝑖𝑖𝑖𝑖
∗ = 𝑌𝑌 𝑖𝑖𝑖𝑖 − 𝑌𝑌𝑖𝑖𝑖𝑖
𝑌𝑌𝑖𝑖𝑖𝑖 obtained from the univariate model using consumption
expenditure information up to and including the period t-1.
The relative error 𝑞𝑞𝑖𝑖𝑖𝑖∗ =
𝑌𝑌 𝑖𝑖𝑖𝑖 − 𝑌𝑌𝑖𝑖𝑖𝑖𝑌𝑌𝑖𝑖𝑖𝑖
measures the extent to which the forecasting model has predicted a higher or lower value (as a share of actual consumption) versus the actual level of consumption observed from the Eurostat data.
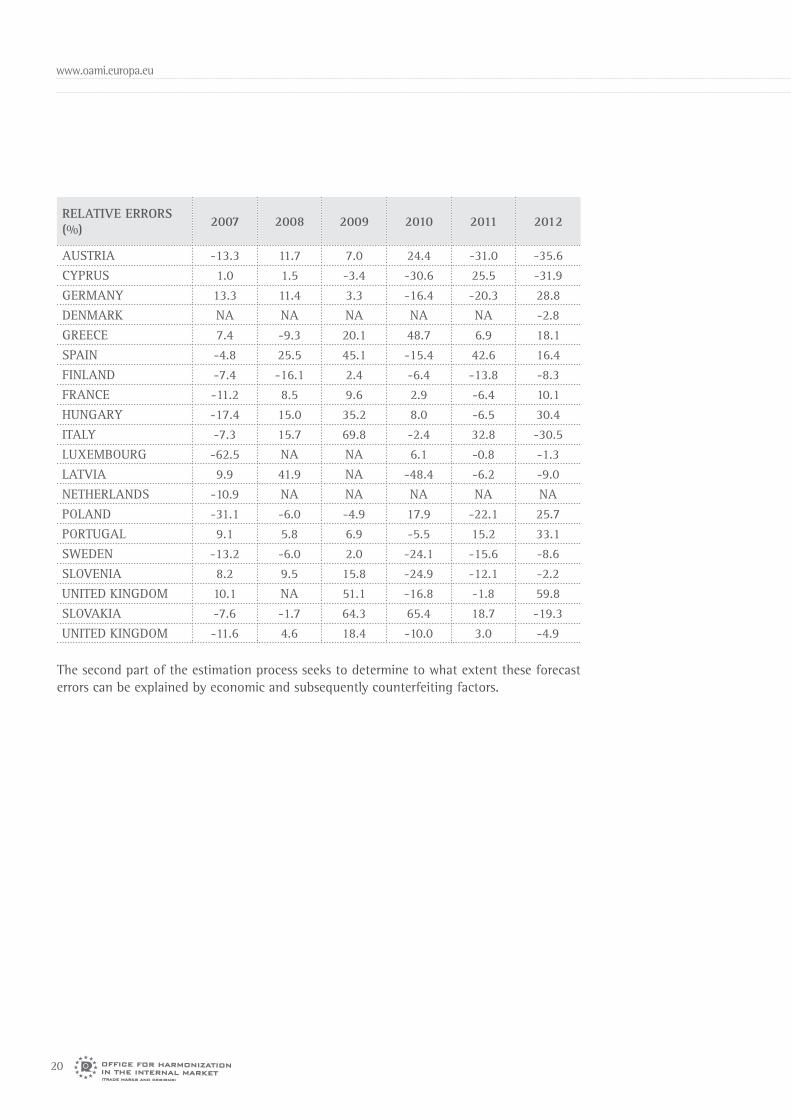
Step-wise forecasting errors for the six years from 2007 to 2012 are constructed for 18 Member States for which sufficient data is available.
The forecasting errors are presented in the following table. It is evident that these errors exhibit a large degree of variability. However, the forecasting errors are not interesting in themselves. The purpose of this study is not to produce a “good” forecast but rather to generate a set of relative forecasting errors which can then be quantitatively analysed to construct estimates of counterfeiting. Forecasts are produced using univariate models and using an automatic procedure, which ensures that they are comparable and “unpolluted” by a priori knowledge of factors influencing changes in demand.
𝑞𝑞𝑖𝑖𝑖𝑖∗ =
𝑌𝑌 𝑖𝑖𝑖𝑖 − 𝑌𝑌𝑖𝑖𝑖𝑖𝑌𝑌𝑖𝑖𝑖𝑖
CONSUMPTION
20
The second part of the estimation process seeks to determine to what extent these forecast errors can be explained by economic and subsequently counterfeiting factors.
RELATIVE ERRORS (%) 2007 2008 2009 2010 2011 2012
AUSTRIA -13.3 11.7 7.0 24.4 -31.0 -35.6CYPRUS 1.0 1.5 -3.4 -30.6 25.5 -31.9GERMANY 13.3 11.4 3.3 -16.4 -20.3 28.8DENMARK NA NA NA NA NA -2.8GREECE 7.4 -9.3 20.1 48.7 6.9 18.1SPAIN -4.8 25.5 45.1 -15.4 42.6 16.4FINLAND -7.4 -16.1 2.4 -6.4 -13.8 -8.3FRANCE -11.2 8.5 9.6 2.9 -6.4 10.1HUNGARY -17.4 15.0 35.2 8.0 -6.5 30.4ITALY -7.3 15.7 69.8 -2.4 32.8 -30.5LUXEMBOURG -62.5 NA NA 6.1 -0.8 -1.3LATVIA 9.9 41.9 NA -48.4 -6.2 -9.0NETHERLANDS -10.9 NA NA NA NA NAPOLAND -31.1 -6.0 -4.9 17.9 -22.1 25.7PORTUGAL 9.1 5.8 6.9 -5.5 15.2 33.1SWEDEN -13.2 -6.0 2.0 -24.1 -15.6 -8.6SLOVENIA 8.2 9.5 15.8 -24.9 -12.1 -2.2UNITED KINGDOM 10.1 NA 51.1 -16.8 -1.8 59.8SLOVAKIA -7.6 -1.7 64.3 65.4 18.7 -19.3UNITED KINGDOM -11.6 4.6 18.4 -10.0 3.0 -4.9
21
The economic cost of IPR infringement in jewellery and watches
Appendix B: The second stage econometric model
Counterfeiting might be one of a number of factors impacting on the level of legal sales of jewellery and watches, but there are, as outlined earlier, a series of other economic factors which can explain the differential, such as variables related to the economic capacity of households, or consumer demographics (e.g. population growth) or any other driver of consumption expenditure.
Having accounted for the influence of economic variables on the sales differential, we look to assess the extent to which counterfeiting variables, or relevant proxies, can explain the propensity to purchase fake jewellery and watches. These variables might include measures of consumer and market characteristics, as well as the evolution of a country´s legal environment.
Combining the economic and counterfeiting variables allows us to specify a model, whose aim is to explain the aggregate differential (forecast errors) between expected and real sales. The model is specified in the following format.
Where is a matrix of explanatory economic variables unrelated to counterfeiting and a matrix of variables related to counterfeiting. Finally, is the remaining error.
Economic variables considered to have explanatory power, unrelated to counterfeiting include:
1. Gross Disposable Income (GDI) of the household sector: per capita income and growth;
2. GDP per capita and GDP growth;3. Exchange rate of Euro vs. other EU currencies;4. Population growth.
The second term of the equation, , contains the matrix of variables thought to be related to counterfeiting23. These variables include:
1. Population at risk of poverty or social exclusion , as a share of total population and growth;
2. Distribution of income by quartiles (including the share attributed to the lowest quartile and the ratio between the highest and lowest quartiles);
3. Gini coefficient (a measure of income inequality);4. Several variables selected from the Observatory’s IP Perception study24 and from
Eurobarometer (including counterfeiting and corruption related variables);5. Corruption Perceptions Index, CPI (level and growth);
23 - A list of factors affecting demand and consumption for counterfeit goods is available in OECD (2008).
24 - Available at: https://oami.europa.eu/ohimportal/en/web/observatory/ip_perception.
22
6. Intellectual Property Right Index;7. Worldwide Governance Indicators (World Bank) covering Government effectiveness,
regulatory quality, rule of law and control of corruption (level and growth); 8. World Bank International Tourism Index;9. Sales in stalls and markets (from survey to trade enterprises);10. Internet purchasers (as a percentage of population and growth).
Variables 1 to 4 in the list are considered to be consumer-related drivers of demand for counterfeiting. The population at risk of poverty, the share and concentration of income in quartiles of the household income distribution, along with the Gini coefficient are all variables that describe degrees of income inequality
The variables considered for inclusion in the Z matrix from the IP Perception study and the Eurobarometer include; the percentage of the population that had bought counterfeit products intentionally or been misled into the purchase of counterfeit products and the percentage of the population that considered, in certain circumstances, buying counterfeit products to be acceptable.
Corruption-related variables considered for inclusion in the Z matrix from the Eurobarometer survey include25; the percentage of the population declaring that corruption is widespread, that it is in the business culture, that it is a major problem and the percentage of the population that believed corruption had increased over the last three years. And from the Tolerance Index to Corruption, the measure covering the percentage of the population that declares that corruption in public administration or public service is acceptable was considered.
Variables 5 to 7 are considered to be drivers of counterfeiting related to institutional characteristics of each country.
The Corruption Perception Index (CPI) is published by Transparency International and measures how corrupt public sectors are seen to be by the public in each country. In this study the updated index is used as a time invariant variable with reference year 2012.
The Intellectual Property (IP) Rights Index used is published by Property Rights Alliance and measures the strength of protection accorded to IP. The 2010 index is used in this study and the same value is used for each country across the six years studied as a time invariant variable.
The Worldwide Governance Indicators reflect the perception of government effectiveness, regulatory quality, rule of law and corruption. They are published annually and range from 2.5 for favourable aspects of governance to -2.5 for poor. These indicators are considered as potential proxies for the perceived risk of buying or selling counterfeit goods, in much a similar way as considered in the 2010 WIPO study. These indices have a high negative
25 - In WCO (2012) it is stated that: ‘The predominance of the informal is then associated with corruption and the degree of regulation...’ So, to the extent that counterfeiting is part of the informal economy, a measure of corruption could be considered explanatory for counterfeiting.
23
The economic cost of IPR infringement in jewellery and watches
correlation with poverty indicators and with the variables from the IP Perception study and Eurobarometer.
Finally, variables 8 to 10 reflect country market characteristics that might be related to counterfeiting.
Altogether, 45 different explanatory variables were tested and different econometric techniques were applied in order to select a model with robust econometric results and a clear interpretation.
Some of the variables considered in the modelling process are clearly correlated with each other. High correlation coefficients between explanatory variables (referred to as multicollinearity) present a common problem in econometric analysis. If correlated explanatory variables are included in the model, the estimated coefficients for these variables could be mistakenly considered as insignificant (small t-statistics), although possessing a high overall significance for the model as measured by the F-test. This situation can pose problems when trying to interpret the meaning and significance of parameter estimates and when testing the significance of other variables in the model specification.
For instance, per capita GDI of the household sector and per capita GDP are highly correlated.
We therefore include in the model only those variables with the greatest explanatory power in order to avoid the problems described.
Having defined the model and acknowledged potential estimation issues (multicollinearity) we begin testing the specified model. Our first observation is that there is correlation between the residuals of the specified model and the variations in the sales differential, namely our dependent variable.
This relationship indicates that we might have a problem with heteroscedasticity, which implies that the variance of our estimated residuals is non-stable (variance stability is a key assumption behind the statistical validity of Ordinary Least Squares (OLS) method). This is a problem that must be addressed; otherwise, the estimators using OLS will be inefficient and the confidence intervals will be invalid.
Different tests were employed to detect the presence of heteroscedasticity (White Test and Breusch and Pagan Test) considering different specifications for residual variance (standard errors of the ARIMA forecasts and groupwise heteroscedasticity). Results from those tests suggested estimation of the 2nd stage model via Groupwise Two-Steps Least Squared (2SLS) method assuming a common variance by country that is estimated based on OLS residuals.
Finally, residuals of the 2SLS method were analysed to check compliance with the usual assumptions of regression models. The tests comprised a White test and residuals plots for heteroscedasticity; a tolerance analysis and Variance Inflation Factor (VIF) test for multicollinearity; and the Jarque-Vera test for normality of the residuals. Test results indicated that the residuals complied with regression assumptions, with the possible exception of normality26.
26 - All results of diagnostic tests are available on request.
24
Model results
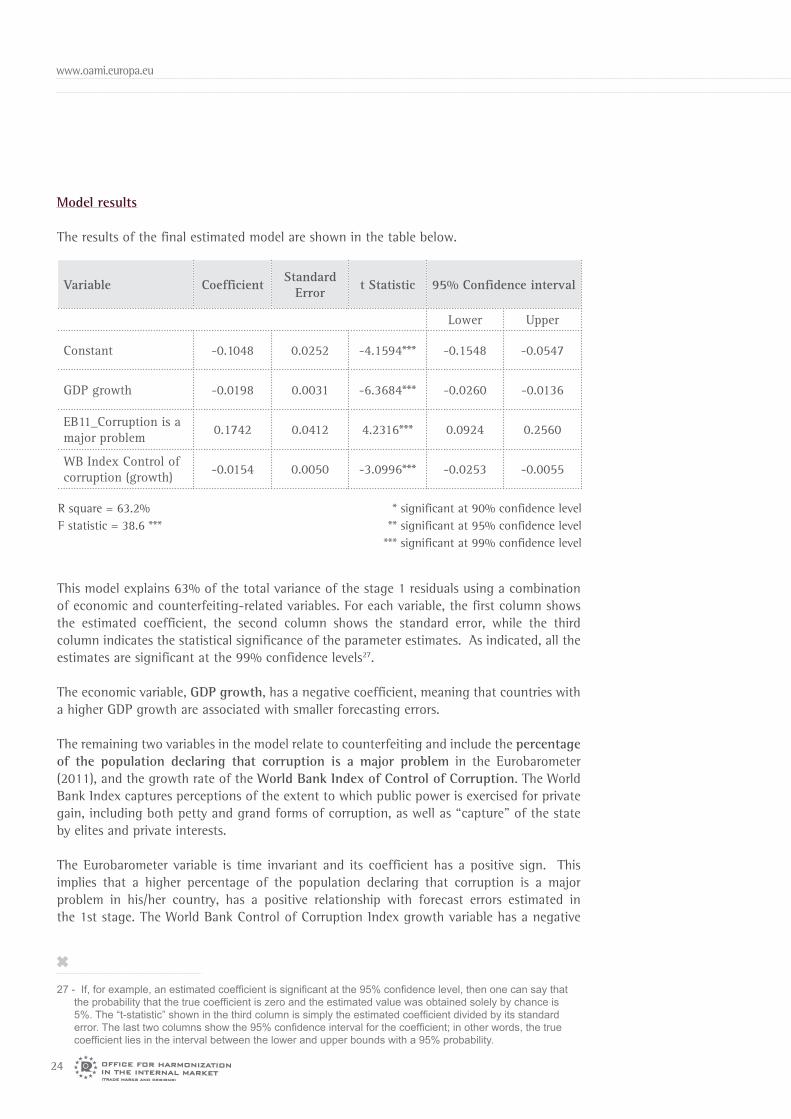
The results of the final estimated model are shown in the table below.
Variable Coefficient Standard Error t Statistic 95% Confidence interval
Lower Upper
Constant -0.1048 0.0252 -4.1594*** -0.1548 -0.0547
GDP growth -0.0198 0.0031 -6.3684*** -0.0260 -0.0136
EB11_Corruption is a major problem 0.1742 0.0412 4.2316*** 0.0924 0.2560
WB Index Control of corruption (growth) -0.0154 0.0050 -3.0996*** -0.0253 -0.0055
R square = 63.2%F statistic = 38.6 ***
* significant at 90% confidence level** significant at 95% confidence level
*** significant at 99% confidence level
This model explains 63% of the total variance of the stage 1 residuals using a combination of economic and counterfeiting-related variables. For each variable, the first column shows the estimated coefficient, the second column shows the standard error, while the third column indicates the statistical significance of the parameter estimates. As indicated, all the estimates are significant at the 99% confidence levels27.
The economic variable, GDP growth, has a negative coefficient, meaning that countries with a higher GDP growth are associated with smaller forecasting errors.
The remaining two variables in the model relate to counterfeiting and include the percentage of the population declaring that corruption is a major problem in the Eurobarometer (2011), and the growth rate of the World Bank Index of Control of Corruption. The World Bank Index captures perceptions of the extent to which public power is exercised for private gain, including both petty and grand forms of corruption, as well as “capture” of the state by elites and private interests.
The Eurobarometer variable is time invariant and its coefficient has a positive sign. This implies that a higher percentage of the population declaring that corruption is a major problem in his/her country, has a positive relationship with forecast errors estimated in the 1st stage. The World Bank Control of Corruption Index growth variable has a negative
27 - If, for example, an estimated coefficient is significant at the 95% confidence level, then one can say that the probability that the true coefficient is zero and the estimated value was obtained solely by chance is 5%. The “t-statistic” shown in the third column is simply the estimated coefficient divided by its standard error. The last two columns show the 95% confidence interval for the coefficient; in other words, the true coefficient lies in the interval between the lower and upper bounds with a 95% probability.
25
The economic cost of IPR infringement in jewellery and watches
coefficient, so that a higher value of this index corresponds to better governance and is related to smaller forecasting errors.
As the main objective of the model is to estimate the coefficients of the counterfeiting variables, it is clear that the characteristics of these coefficients should be investigated.
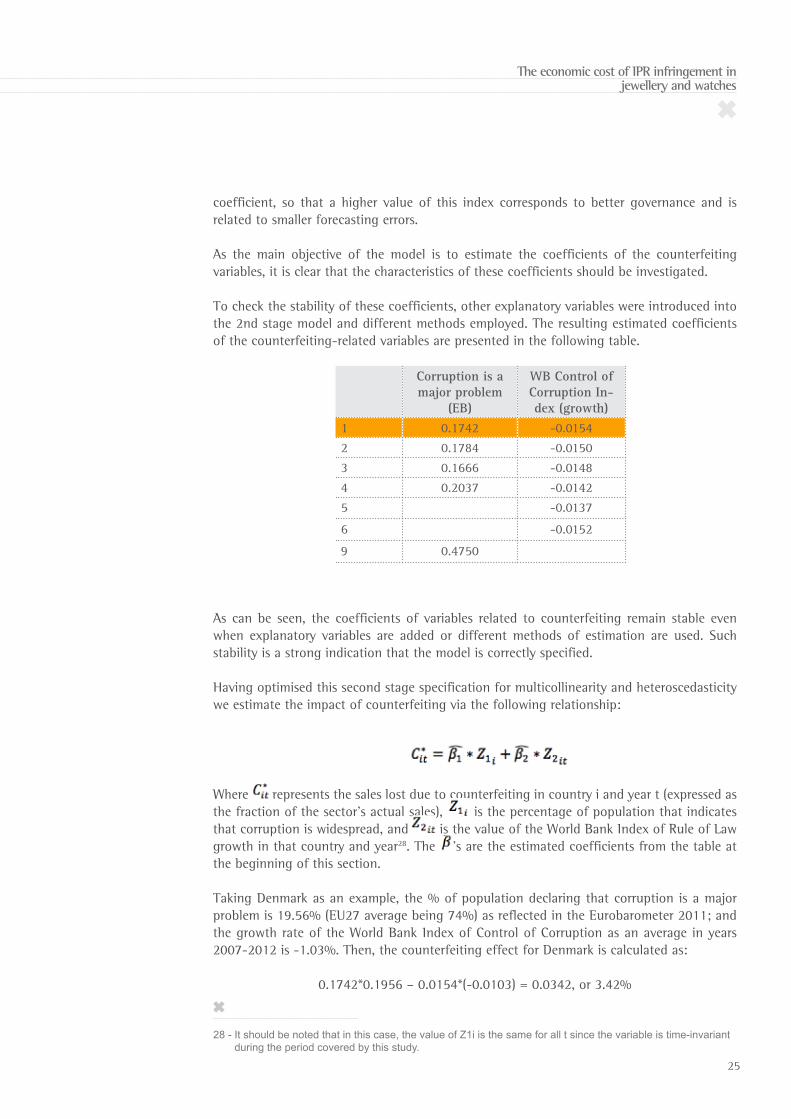
To check the stability of these coefficients, other explanatory variables were introduced into the 2nd stage model and different methods employed. The resulting estimated coefficients of the counterfeiting-related variables are presented in the following table.
As can be seen, the coefficients of variables related to counterfeiting remain stable even when explanatory variables are added or different methods of estimation are used. Such stability is a strong indication that the model is correctly specified.
Having optimised this second stage specification for multicollinearity and heteroscedasticity we estimate the impact of counterfeiting via the following relationship:
Corruption is a major problem
(EB)
WB Control of Corruption In-dex (growth)
1 0.1742 -0.01542 0.1784 -0.01503 0.1666 -0.01484 0.2037 -0.01425 -0.0137
6 -0.0152
9 0.4750
Where represents the sales lost due to counterfeiting in country i and year t (expressed as the fraction of the sector’s actual sales), is the percentage of population that indicates that corruption is widespread, and is the value of the World Bank Index of Rule of Law growth in that country and year28. The ’s are the estimated coefficients from the table at the beginning of this section.
Taking Denmark as an example, the % of population declaring that corruption is a major problem is 19.56% (EU27 average being 74%) as reflected in the Eurobarometer 2011; and the growth rate of the World Bank Index of Control of Corruption as an average in years 2007-2012 is -1.03%. Then, the counterfeiting effect for Denmark is calculated as:
0.1742*0.1956 – 0.0154*(-0.0103) = 0.0342, or 3.42%
28 - It should be noted that in this case, the value of Z1i is the same for all t since the variable is time-invariant during the period covered by this study.

26
This is a direct estimate of lost sales of jewellery and watches in Denmark due to counterfeiting. Put another way, in the absence of counterfeiting and all else being equal, sales of the legitimate sector in the Danish market would be 3.42% higher than they actually are.
In a similar manner, the counterfeiting effect can be calculated for 27 EU Member States (Croatia was not included in the 2011 Eurobarometer), applying values of the explanatory variables to the coefficients estimated in the model above.
22 - It should be noted that in this case, the value of is the same for all t since the variable is time-invariant during the period covered by this study.
27
The economic cost of IPR infringement in jewellery and watches
Appendix C: Description of NACE Rev 2 classes
3212 Manufacture of jewellery and related articles
This class includes:
production of worked pearlsproduction of precious and semi-precious stones in the worked state, including the working of industrial quality stones and synthetic or reconstructed precious or semi-precious stonesworking of diamondsmanufacture of jewellery of precious metal or of base metals clad with precious metals, or precious or semi-precious stones, or of combinations of precious metal and precious or semi-precious stones or of other materialsmanufacture of goldsmiths’ articles of precious metals or of base metals clad with precious metals:
dinnerware, flatware, hollowware, toilet articles, office or desk articles, articles for religious use etc.
manufacture of technical or laboratory articles of precious metal (except instruments and parts thereof): crucibles, spatulas, electroplating anodes etc.manufacture of precious metal watch bands, wristbands, watch straps and cigarette cases
This class also includes:
engraving of personal precious and non-precious metal products
3213 Manufacture of imitation jewellery and related articles
This class includes:
manufacture of costume or imitation jewellery:
rings, bracelets, necklaces, and similar articles of jewellery made from base metals plated with precious metals
jewellery containing imitation stones such as imitation gems stones, imitation diamonds, and similar
manufacture of metal watch bands (except precious metal)
2652 Manufacture of watches and clocks
This class includes the manufacture of watches, clocks and timing mechanisms and parts thereof.
28
This class includes:
manufacture of watches and clocks of all kinds, including instrument panel clocksmanufacture of watch and clock cases, including cases of precious metalsmanufacture of time-recording equipment and equipment for measuring, recording and otherwise displaying intervals of time with a watch or clock movement or with synchronous motor, such as:
parking meterstime clockstime/date stampsprocess timers
manufacture of time switches and other releases with a watch or clock movement or with synchronous motor:
time locks
manufacture of components for clocks and watches:
movements of all kinds for watches and clockssprings, jewels, dials, hands, plates, bridges and other partswatch and clock cases and housings of all materials
29
The economic cost of IPR infringement in jewellery and watches
ReferencesOECD (2008) The economic impact of counterfeiting and piracy. http://www.oecd-ilibrary.org/trade/the-economic-impact-of-counterfeiting-and-piracy_9789264045521-en
OHIM (2013) The European Citizens and intellectual property: perception, awareness and behaviour. https://oami.europa.eu/ohimportal/en/web/observatory/ip_perception
OHIM (2013) Intellectual Property Rights intensive industries: contribution to economic performance and employment in the European Union.https://oami.europa.eu/ohimportal/en/web/observatory/ip-contribution#1study
OHIM (2015) Intellectual Property Rights and firm performance in Europe: an economic analysis.https://oami.europa.eu/ohimportal/en/web/observatory/ip-contribution#2study
OHIM (2015) The economic cost of IPR infringement in the cosmetics and personal care sector.https://oami.europa.eu/ohimportal/en/web/observatory/ip-infringements_cosmetics-personal_care
OHIM (2015) The economic cost of IPR infringement in the clothing, footwear and accesories sector.https://oami.europa.eu/ohimportal/en/web/observatory/ip-infringements_clothing-accessories-footwear
OHIM (2015) The economic cost of IPR infringement in sports goods.https://oami.europa.eu/ohimportal/en/web/observatory/ip-infringements_sports-goods
OHIM (2015) The economic cost of IPR infringement in games and toys.https://oami.europa.eu/ohimportal/en/web/observatory/ipr_infringement_toys_and_games
RAND (2012) Measuring IPR infringements in the internal market. Development of a new approach to estimating the impact of infringement on sales.http://ec.europa.eu/internal_market/iprenforcement/docs/ipr_infringment-report_en.pdf
WCO (2012) Informal trade practices. http://www.wcoomd.org/en/topics/research/activities-and-programmes/~/media/CE615C7CC64746688498F807A0F032A3.ashx
WEFA (1998) The Economic Impact of Trademark Counterfeiting and Infringement. Report prepared for the International Trademark Association.
WIPO (2010) The economic effects of counterfeiting and piracy: a literature review. http://www.wipo.int/edocs/mdocs/enforcement/en/wipo_ace_6/wipo_ace_6_7.pdf
Avda Europa, 4E03008 - Alicante, SPAINTel. +34 965 139 [email protected]
The economic cost of IPR infringement in jewellery and watches