quality improvement tools - university of kansas hospitalwichita.kumc.edu/documents/wichita/qi/qi...
TRANSCRIPT
Wesley Leadership Institute Quality Improvement Academy
Quality Improvement Tools Gina M. Berg, PhD, MBA

Learning Objectives
At the end of this lesson, you should be able to:
DESCRIBE • Improvement Model/PDSA
• Flowchart (process analysis)
• Brainstorming Benefit(s)
• 5 Whys (root cause analysis)
• Fishbone/Ishikawa diagram (root cause analysis)
• Pareto chart (rank order by importance)
• Control chart (performance over time)
• LEAN
• Six Sigma

Definitions
Safe
Timely
Effective
Equitable
Patient centered
Efficient
Systematic, data-guided
activities designed to bring
about immediate improvements
in health care delivery in
particular settings
Form of experiential learning
Quality Care (IOM, Crossing Quality Chasm, 2001)
Quality Improvement (Hastings Center, 2003)

Developing QI Project
Why?
Why?
Why?
Why?
Why?

IHI Model
www.IHI.org
Langley GL, Moen R, Nolan KM, Nolan TW, Norman CL, Provost LP. The
Improvement Guide: A Practical Approach to Enhancing Organizational
Performance (2nd edition). San Francisco: Jossey-Bass Publishers; 2009.
1
2
3
What are we trying
to accomplish?
How will we know
that a change is an
improvement?
What changes can we
make that will result
in an improvement?

PDSA Cycle
Plan small process change
Execute on small scale
Test or measure
Implement or discard

Continuous Quality Improvement
Repeated Use of the Cycle
Hunches
Theories
Ideas
Changes
That Result
in
Improvement
A P
S D
A P
S D

Hit the mark

Flow Chart
Picture of the separate steps of
a process in sequential order
(http://asq.org/)
Document a process
Develop understanding
Study for improvement
Communicate to others
Planning a project

Complex

Sepsis Flow Chart
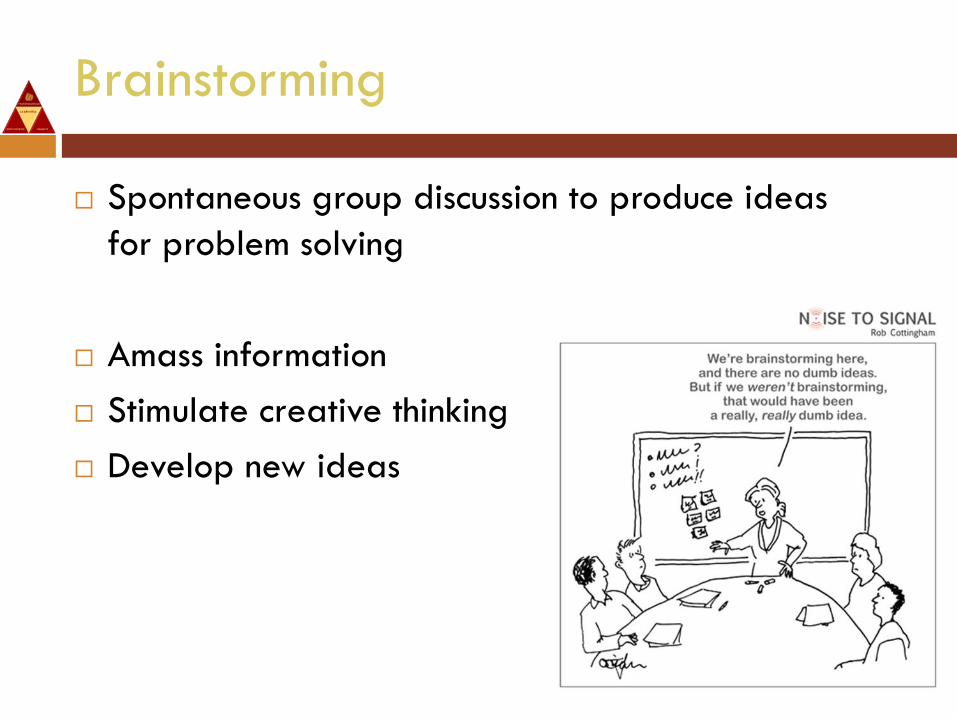
Brainstorming
Spontaneous group discussion to produce ideas
for problem solving
Amass information
Stimulate creative thinking
Develop new ideas

Fishbone Diagram: Purpose
Cause and Effect Diagram
Identifies causes of problems
Sorts ideas into categories
Methods
Machines (equipment)
Manpower (people)
Materials
Measurement
Environment
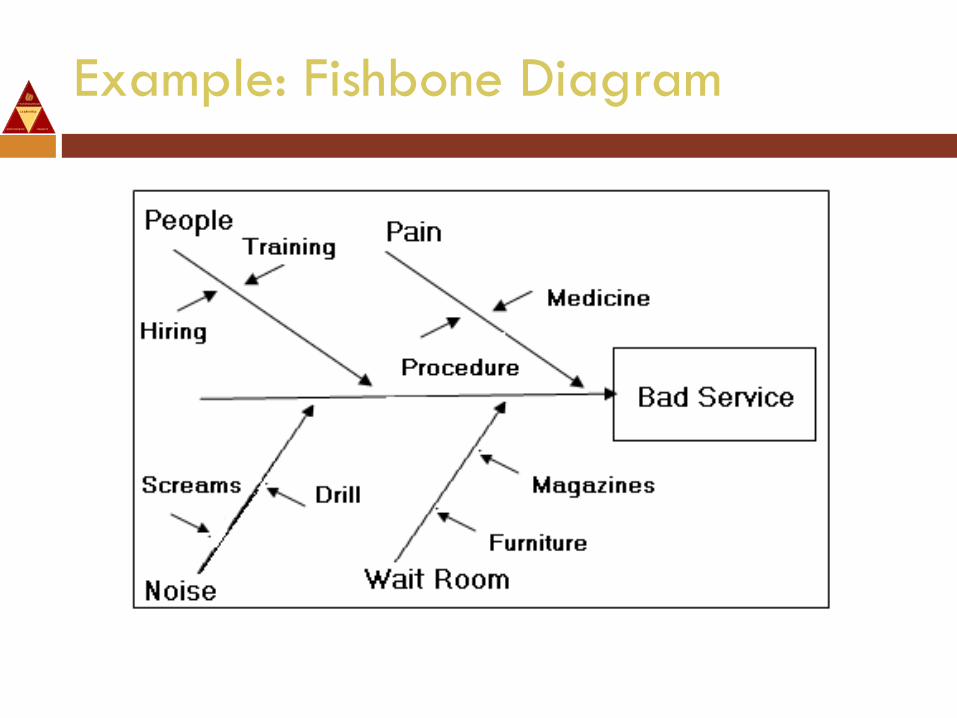
Example: Fishbone Diagram
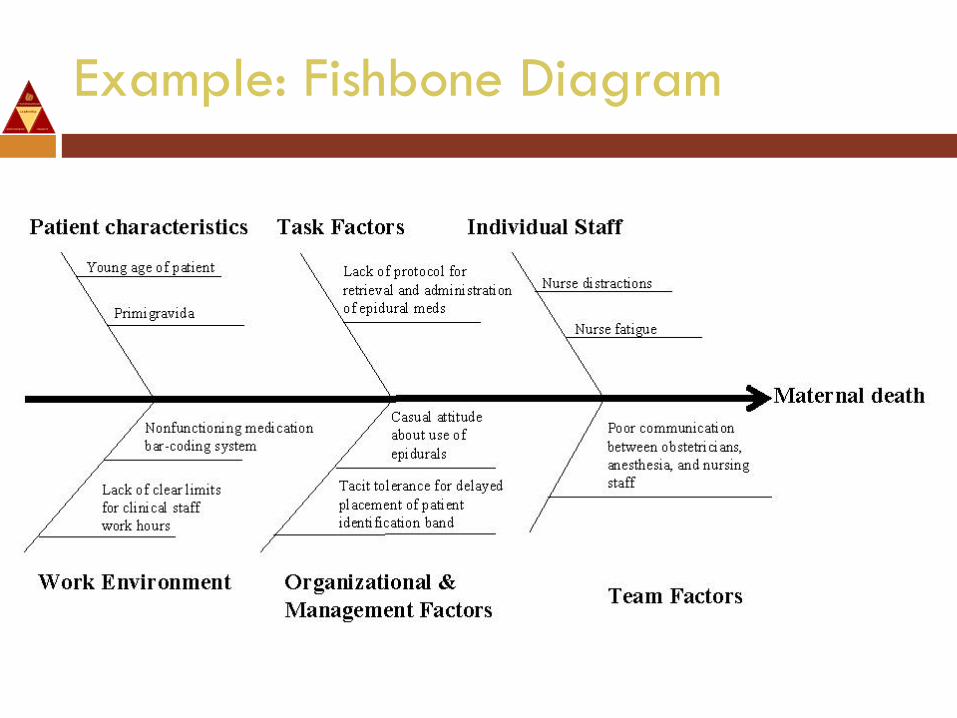
Example: Fishbone Diagram

Five Whys?
Iterative interrogative technique used to explore the
cause-and-effect relationships underlying a
particular problem
Five iterations to reach underlying cause
Six-Sigma tool
Why?
Why?
Why?
Why?
Why?
Machines

Examples: Fishbone Diagrams

Pareto Charts: Definition & Purpose
Visual depiction of significance and cumulative
accountability
http://asq.org
Data driven
Analysis of frequency of causes
Prioritization/focuses attention on most significant
Communication about cause significance with others

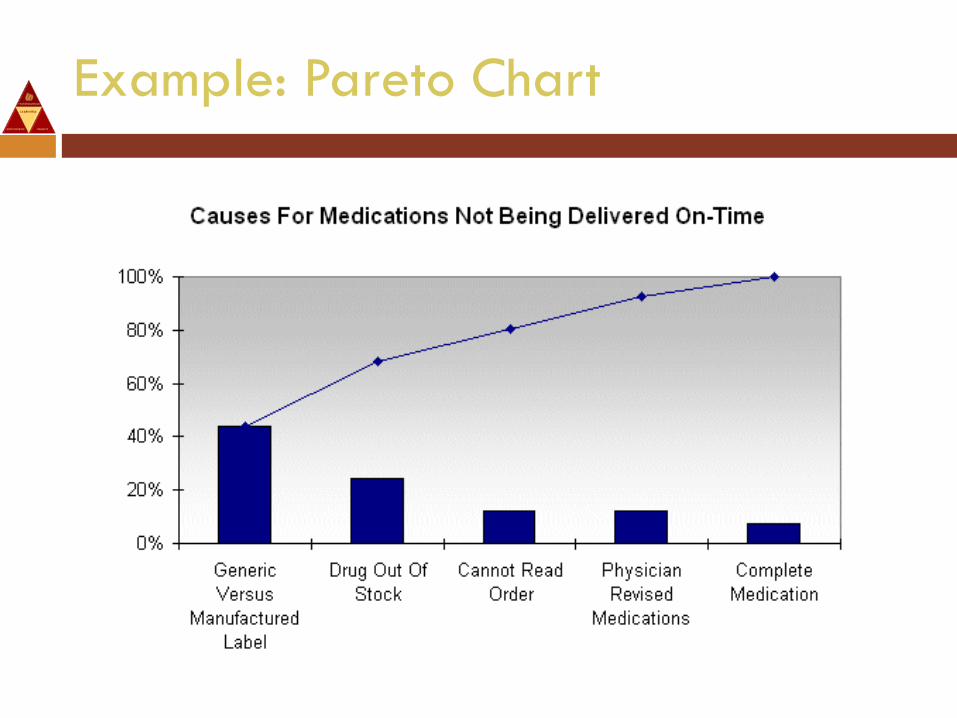
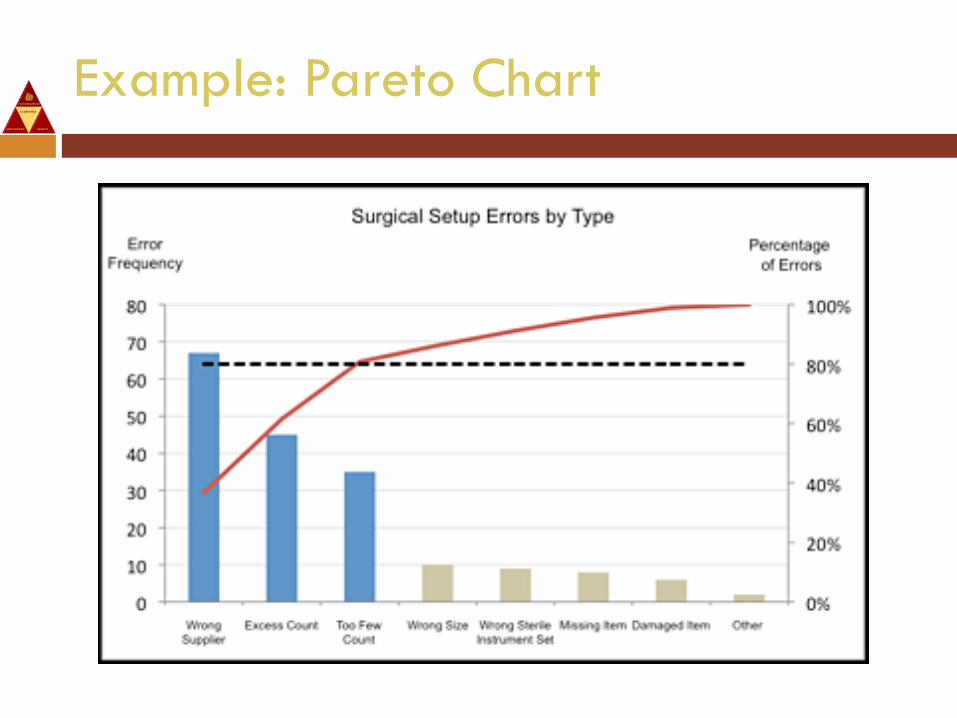
Example: Pareto Chart

Pareto Principle (80/20 Rule)
80/20 Rule
Law of the vital few
Principle of factor sparsity
For many events, roughly 80% of the effects come
from 20% of the causes (unequal distribution)
Most things in life are not distributed evenly

Throughput Example
www.IHI.org
Langley GL, Moen R, Nolan KM, Nolan TW, Norman CL, Provost LP. The
Improvement Guide: A Practical Approach to Enhancing Organizational
Performance (2nd edition). San Francisco: Jossey-Bass Publishers; 2009.
Question Example
What are we trying to
accomplish?
Improve efficiency of office visits
Improve patient satisfaction
How will we know that a
change is an improvement?
Decreased elapsed time from
patient check-in to patient check-
out
What changes can we make
that will result in an
improvement?
1
2
3
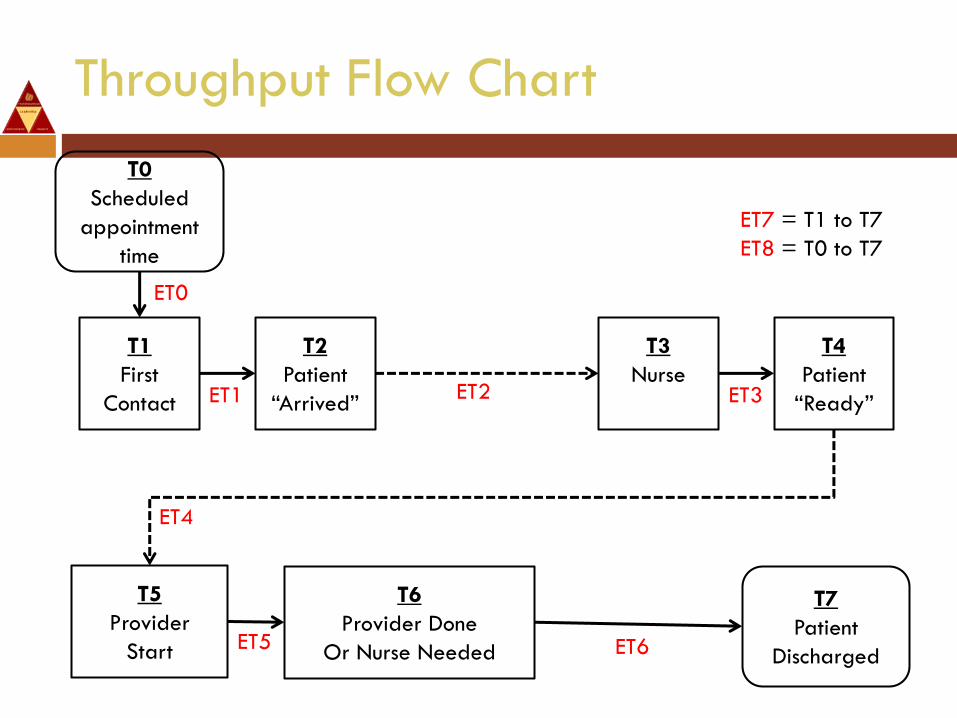
Throughput Flow Chart
T0
Scheduled
appointment
time
T1
First
Contact
T2
Patient
“Arrived”
T3
Nurse
T4
Patient
“Ready”
T7
Patient
Discharged
T5
Provider
Start
T6
Provider Done
Or Nurse Needed
ET0
ET3 ET1 ET2
ET6 ET5
ET4
ET7 = T1 to T7
ET8 = T0 to T7

Throughput Fishbone Diagram
Delays in
Throughput
Delay to First Contact
Patient Late
Long Line
Computer Issue
Other
Nurse Delay
UA needed
Room not ready
With another patient
Other
Delay to Physician
Supplies missing
Review records
Outside records missing
Other
Delay to Checkout
Didn’t check out
Went to lab
Went to referral
Other

Throughput Data Collection
Check In Delays N= 87 Nurse Delays N= 87
Patient arrived late 13 15% Room not ready 46 53%
Long line 17 20% UA needed prior 25 29%
Computer issue 26 30% With another patient 13 15%
Other 31 36% Other 28 32%
Physician Delays N= 87 Check Out Delays N= 87
Med student saw patient first 19 22% Patient didn’t stop at front desk 24 28%
Needed to review records 9 10% Patient went to lab 22 25%
Outside records missing 12 14% Patient went for referral 17 20%
Supplies missing 29 33% Other 4 5%

Throughput Pareto Chart

Throughput Pareto Chart

Throughput Example
www.IHI.org
Langley GL, Moen R, Nolan KM, Nolan TW, Norman CL, Provost LP. The
Improvement Guide: A Practical Approach to Enhancing Organizational
Performance (2nd edition). San Francisco: Jossey-Bass Publishers; 2009.
Question Example
What are we trying to
accomplish?
Improve efficiency of office visits
Improve patient satisfaction
How will we know that a
change is an improvement?
Decreased elapsed time from
patient check-in to patient check-
out
What changes can we make
that will result in an
improvement?
• Back office supports front desk
• Standardize exam rooms
• Preview records day before
1
2
3
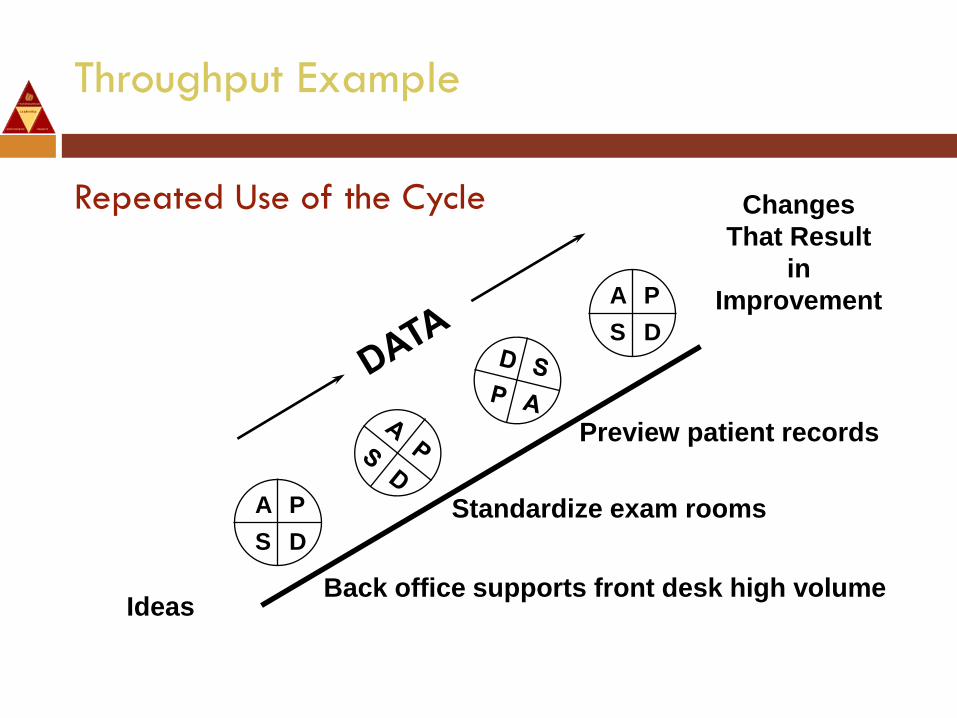
Throughput Example
Repeated Use of the Cycle
Ideas
Changes
That Result
in
Improvement
A P
S D
A P
S D
Standardize exam rooms
Back office supports front desk high volume
Preview patient records

Control Charts
Single quality characteristic measured or computed
Analysis indicates process
In control: stable (variation only coming from sources
common to the process)
Out control: Identify sources of variation
Predict future performance


Six Sigma
Problem-solving methodology
Minimize mistakes (cost)
Sigma scale is universal measure
Sigma Percent Defective Per Million
1 69% 691,462
2 31% 308,538
3 6.7% 66,807
4 0.62% 6,210
5 0.023% 233
6 0.00034% 3.4
7 0.0000019% 0.19
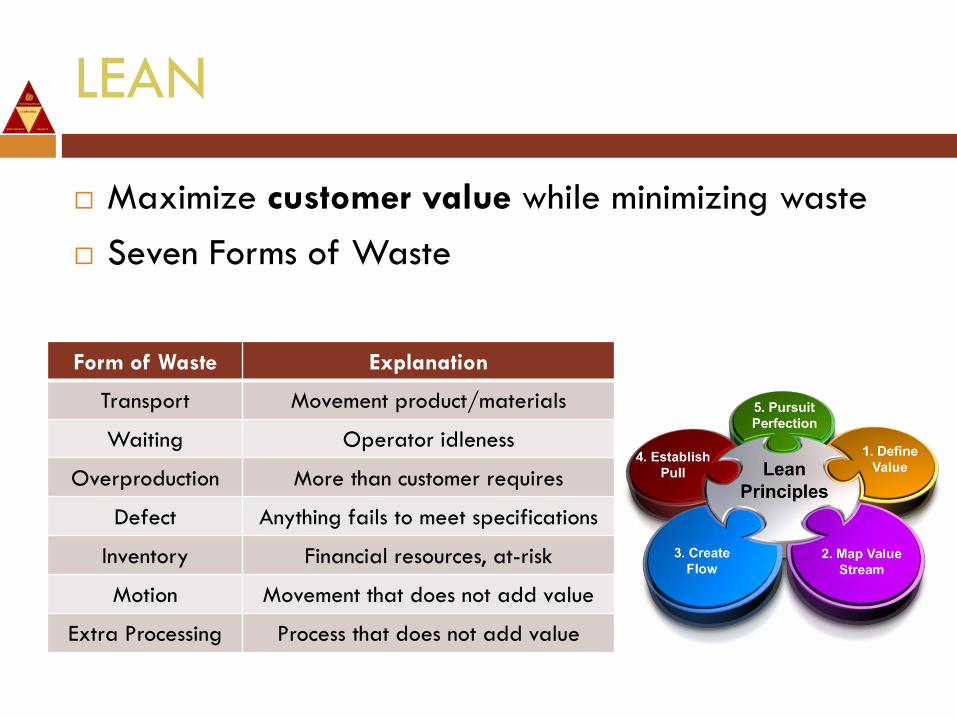
LEAN
Maximize customer value while minimizing waste
Seven Forms of Waste
Form of Waste Explanation
Transport Movement product/materials
Waiting Operator idleness
Overproduction More than customer requires
Defect Anything fails to meet specifications
Inventory Financial resources, at-risk
Motion Movement that does not add value
Extra Processing Process that does not add value
Problems are man-made, therefore
may be solved by man. John F. Kennedy
The outcome depends upon the
knowledge and persistence
of the people involved.

Important Dates
Session Day/Date Time Venue Topic 06 Thursday, 3/24 Noon - 1pm Cessna Building QI Toolkit #4: Control Charts
07 Thursday, 4/28 Noon - 1pm Cessna Expand QI Knowledge #1: Error & Risk
08 Thursday, 5/26 Noon - 1pm Cessna Building QI Toolkit #5: TeamSTEPPS
09 Thursday, 6/23 Noon - 1pm Cessna Expand QI Knowledge #2: Just Culture
10 Thursday, 7/28 Noon - 1pm Cessna Expand QI Knowledge #3: High Reliability Org
11 Thursday, 8/25 Noon - 1pm Cessna Expand QI Knowledge #4: Disparities
12 Thursday, 9/22 Noon - 1pm Cessna Quality Forum Present QI Project (IHI Prep)
* WLI QIA typically meets 4th Thursday of month; please note12/3 is first Thursday due to holidays
EVERYDAY YOU SHOULD ASK YOURSELF
Wesley Leadership Institute Quality Improvement Academy
HOW CAN I IMPROVE?
THANK YOU