quality assurance quality control plan 27, 2010 · quality assurance quality control plan for the...
TRANSCRIPT

QUALITY ASSURANCE QUALITY CONTROL PLAN
FOR THE
SALTON SEA AIR MONITORING NETWORK
January 27, 2010

i Quality Assurance Quality Control Plan For The Salton Sea Air Monitoring Network Original 01/27/2010
REVISIONS

iii Quality Assurance Quality Control Plan For The Salton Sea Air Monitoring Network Original 01/27/2010
ACKNOWLEDGMENTS Significant contributions to this document were made by Earl Withycombe, P.E of the California Air Resources Board, Jason Low Ph.D. of the South Coast Air Quality Management District, Pamela Vanderbilt with CH2M Hill and Rhys Evans of American Ecotech LLC. The Imperial County Air Pollution Control District would like to acknowledge the assistance and input provided by the following in preparation of this Quality Assurance and Quality Control Plan: Bruce Wilcox of the Imperial Irrigation District, Chuck Keene of the Department of Water Resources Division Regional Water Management and Jonathan Chapman of the Torres Martinez Desert Cahuilla Indian Tribe.

iv Quality Assurance Quality Control Plan For The Salton Sea Air Monitoring Network Original 01/27/2010
DISTRIBUTION LIST
AIR POLLUTION CONTROL STAFF IMPERIAL IRRIGATION DISTRICT APC DIVISION MANAGERS WATER DIVISION Jesus Ramirez Bruce Wilcox Monica Soucier APC ENVIRONMENTAL COORDINATOR SOUTH COAST AIR QUALITY MANAGEMENT DISTRICT Emmanuel Sanchez Atmospheric Measurements Manager APC MONITORING TECHNICIANS Philip Fine Michael Green 21865 Copley Drive Jesus Montaño Diamond Bar, CA 91765-4178 Jonathan Barroga TORRES MARTINEZ DESERT CAHUILLA INDIAN TRIBE AMERICAN ECOTECH, LLC Jonathan Chapman Technical Manager Rhys Evans CALIFORNIA AIR RESOURCES BOARD Earl Withycombe, P.E. CH2M HILL Jodi Lee CH2M HILL Pamela Vanderbilt CH2M HILL Peggie King DEPARTMENT OF WATER RESOURCES DIVISION OF INTEGRATED REGIONAL
WATER MANAGEMENT
Chuck Keene Southern Region Office 770 Fairmont Avenue, CA 91203

v Quality Assurance Quality Control Plan For The Salton Sea Air Monitoring Network Original 01/27/2010
ACRONYMS
APTI Air Pollution Training Institute
AQMIS2 Air Quality and Meteorology Information System
CARB California Air Resources Board
CDWR California Department of Water Resources
CVWD Coachella Valley Water District
DQO Data Quality Objectives
EIR Environmental Impact Report
EIS Environmental Impact Statement
FTP File Transfer Protocol
HCP Habitat Conservation Plan
ICAPCD Imperial County Air Pollution Control District
IID Imperial Irrigation District
JPA Joint Power Agency
MDL Method Detection Limits
MQO Measurement Quality Objectives
MWD Metropolitan Water District of Southern California
PM Particulate Matter
PM10 Particulate Matter Less Than 10 Microns
PM2.5 Fine Particulate Matter 2.5 Microns or Less
PMcourse Particulate Matter Greater than 2.5 Microns but Less than 10 Microns (PM10-2.5)
QA/QC Quality Assurance/Quality Control Plan
QSA Quantification Settlement Agreement
SDCWA San Diego County Water Authority
SSAQMN Salton Sea Air Quality Monitoring Network
TEOM Tapered Element Oscillating Microbalance
TM Torrez-Martinez Desert Cahuilla Indian Tribe

vi Quality Assurance Quality Control Plan For The Salton Sea Air Monitoring Network Original 01/27/2010
TABLE OF CONTENTS
REVISIONS ......................................................................................................... i TITLE AND APPROVAL ....................................................................................... ii ACKNOWLEDGEMENTS .................................................................................... iii DISTRIBUTION LIST ........................................................................................... iv ACRONYMS ........................................................................................................ v PROJECT/TASK ORGANIZATION ...................................................................... 1 PROJECT DEFINITION/BACKGROUND ............................................................. 5 Monitoring System Design .............................................................................. 5 Data Management .......................................................................................... 9 QUALITY OBJECTIVES AND CRITERIA FOR MEASUREMENT DATA .............................................................................. 13 Data Review, Verification and Validation ........................................................ 17 Calculations for Data Quality .......................................................................... 19 SPECIAL TRAINING/CERTIFICATION ................................................................ 21 DOCUMENTS AND RECORDS ........................................................................... 22 SALTON SEA AIR MONITORING PROJECT SITE OPERATOR’S STANDARD OPERATING PROCEDURES ........................ 34 Section Page .................................................................................................. 35 General Information ........................................................................................ 37 TEOM Specifications ...................................................................................... 37 Setup .............................................................................................................. 37 Applying Power to the Instrument ................................................................... 38 Basic TEOM Operation ................................................................................... 39 Performing a Leak Check .......................................................................... 40 Storing Data............................................................................................... 41 Screens and Settings ...................................................................................... 41 System Status Screen ............................................................................... 42 Instrument Conditions ................................................................................ 42 Settings ..................................................................................................... 43 Service ...................................................................................................... 44 Maintenance and Calibration Procedures ....................................................... 44 Replacing the TEOM Filters....................................................................... 45 Cleaning the Sample Inlet ......................................................................... 48 Cleaning the Virtual Impactor .................................................................... 51 Replacing the In-Line Filters ...................................................................... 53 Cleaning the Air Inlet ................................................................................. 54 Audit/Calibration Procedures .......................................................................... 55 Calibrating the Ambient Temperature ........................................................ 57 Calibrating the Ambient Pressure .............................................................. 58 Flow Rates................................................................................................. 58 Performing a Leak Check .......................................................................... 63 Calibrating the Analog Outputs .................................................................. 63 Mass Transducer ....................................................................................... 65 TEOM 1405-D Quality Control Maintenance Checks ...................................... 68
vii Quality Assurance Quality Control Plan For The Salton Sea Air Monitoring Network Original 01/27/2010
TABLE OF CONTENTS CONTINUED
Daily Checks.............................................................................................. 68 Weekly Check ............................................................................................ 68 Monthly Check ........................................................................................... 68 Semiannual Check .................................................................................... 68 Annual Check ............................................................................................ 69 Meteorological Instruments Maintenance Procedures .................................... 71 Sonic Anemometer – RM Young Model 8100 ........................................... 71 Gill 3-Cup Anemometer – Model 12101 .................................................... 72 Platinum Temperature Probe – Model 41342VF ....................................... 72 Aspirated Radiation Shield – RM Young Model 43502 procurement ......... 72 Relative Humidity/Temperature Probe – RM Young Model 41382VF ........ 73 Multi-Plate Radiation Shield- RM Young Model 41003 .............................. 73 Net Radiometer – MetOne Model 097 ....................................................... 73 REFERENCES ..................................................................................................... 74 CONTACT INFORMATION .................................................................................. 76
QUALITY ASSURANCE QUALITY CONTROL PLAN LIST OF TABLES
TABLE DESCRIPTION PAGE 1 STATION INSTRUMENTS AND FUNCTIONS ............................... 2 2 SALTON SEA AIR QUALITY MONITORING STATION LOCATIONS ................................................................... 8 3 AUTOMATIC DATA TRANSMITTAL .............................................. 10 4 BATCHED MONITORING DATA .................................................... 11 5 MEASUREMENT QUALITY OBJECTIVES .................................... 16 6 INFORMATION RETAINED ............................................................ 23 7 ROUTINE MAINTENANCE PROCEDURES .................................. 24 8 AUDIT/CALIBRATION PROCEDURES .......................................... 25 9 PARTS REPLACEMENT AND CONDITIONING ............................ 26 10 METEOROLOGICAL INSTRUMENTS MAINTENANCE AND REQUIREMENTS ....................................... 27 11 MONTHLY QUALITY CONTROL MAINTENANCE CHECK SHEET ................................................... 32 12 DAILY DATA TRACKING SHEET .................................................. 33

viii Quality Assurance Quality Control Plan For The Salton Sea Air Monitoring Network Original 01/27/2010
TABLE OF CONTENTS CONTINUED
SITE OPERATOR’S STANDARD OPERATING PROCEDURES
LIST OF TABLES
TABLE DESCRIPTION PAGE
8.1 MONTHLY QUALITY CONTROL MAINTENANCE CHECK SHEET ................................................... 70 9.1 METEOROLOGICAL INSTRUMENTS MAINTENANCE PROCEDURES ................................................... 71
QUALITY ASSURANCE QUALITY CONTROL PLAN
LIST OF FIGURES
FIGURE DESCRIPTION PAGE 1 SALTON SEA AIR QUALITY MONITORING NETWORK ORGANIZATIONAL CHART ........................................................... 4 2 SALTON SEA AIR QUALITY MONITORING NETWORK SITES .......................................................................... 6 3 NAVAL TEST SITE LAYOUT .......................................................... 7 4 MONITORING SHELTER LAYOUT ................................................ 8
SITE OPERATOR’S STANDARD OPERATING PROCEDURES LIST OF FIGURES
FIGURE DESCRIPTION PAGE 1-1 SCHEMATIC OF TYPICAL INSTALLATION .................................. 38 6.1.a FILTER REMOVAL ......................................................................... 46 6.1.b TEOM FILTER LOCATION ............................................................. 47 6.1.c FILTER ON TAPERED ELEMENT ................................................. 47 6.2.a RAIN JAR, INLET AND SAMPLE TUBE ......................................... 49 6.2.b TOP PLATE, LOWER PLATE, O-RINGS AND NOZZLE ................ 50 6.2.c INSIDE OF THE INLET COLLECTOR ............................................ 50 6.3.a INLET ASSEMBLY AND VIRTUAL IMPACTOR ............................. 52 6.3.b AREAS OF THE VIRTUAL IMPACTOR .......................................... 53 6.4.a LOCATION OF FILTERS ................................................................ 53 6.5.a THERMISTORS .............................................................................. 54 6.5.b AIR INLET ....................................................................................... 55 7.1.a AMBIENT CALIBRATION SCREEN ............................................... 57 7.3.a FLOW SPLITTER ........................................................................... 59 7.3.b BYPASS CAP ................................................................................. 59 7.3.c FLOW AUDIT ADAPTER ................................................................ 59

ix Quality Assurance Quality Control Plan For The Salton Sea Air Monitoring Network Original 01/27/2010
TABLE OF CONTENTS CONTINUED
SITE OPERATOR’S STANDARD OPERATING PROCEDURES
LIST OF FIGURES
FIGURE DESCRIPTION PAGE 7.3.d TOTAL FLOW AUDIT SYSTEM ..................................................... 61 7.5.a UNIT DOOR .................................................................................... 63 7.5.b JUMPER, TEST POINTAND LABEL .............................................. 64 7.5.c D/A OUTPUT JUMPERS ................................................................ 64 7.6.a INLET AND INLET SAMPLE TUBE ................................................ 66

1 Quality Assurance Quality Control Plan For The Salton Sea Air Monitoring Network Original 01/27/2010
PROJECT/TASK ORGANIZATION
The Imperial Irrigation District (IID) Water Conservation and Transfer Project (Project) is a long-term water conservation project, up to 75 years, implemented by IID to conserve up to 300 thousand acre-feet per year of Colorado River water for the purpose of transferring the conserved water to the San Diego County Water Authority (SDCWA), Coachella Valley Water District (CVWD), and/or Metropolitan Water District of Southern California (MWD).1
Therefore, in order to establish baseline air quality conditions at the Salton Sea, air quality and meteorological data will be collected via a network of stations surrounding the sea. As specified by the EIR/EIS six monitoring stations, collectively known as the Salton Sea Air Quality Monitoring Network (SSAQMN), have been located around the Salton Sea shore at sites near existing communities, significant emission sources or sensitive receptor areas. Each station within the SSAQMN has a functional Thermo Fischer Scientific tapered element oscillating microbalance (TEOM) Series 1405-D instrument and up to seven (7) types of meteorological instruments designed to complement the TEOM Series 1045-D. Of the six (6) monitoring stations five (5) are to be operated and maintained by the Imperial County Air Pollution Control District (ICAPCD) while the sixth is to be operated and maintained by the Torrez-Martinez Desert Cahuilla Indian Tribe (TM). It is important to note that the ICAPCD has no jurisdiction over the TM site, however both parties have mutually agreed to work
The Project also includes the implementation of a Habitat Conservation Plan (HCP) which mitigates or avoids certain effects of the Project. Specifically, the HCP addresses the impacts to species and habitats within the IID water service area, the right-of-way of the All American Canal and the Salton Sea. The Environmental Impact Report/Environmental Impact Statement (EIR/EIS) for the HCP identified potential significant impacts on air quality, specifically dust emissions. Although air quality impacts resulting from the construction and operational phases of the HCP as well as the potential wind erosion of soil from fallowed fields are identified, the focus important to this Quality Assurance and Quality Control (QA/QC) Plan is the shoreline sediments exposed by lowered water levels in the Salton Sea. The reduced water levels will expose playa at the Salton Sea creating a potential to produce significant dust emissions. In order to address the potentially significant impact, a phased approach was identified in the EIR/EIS for the HCP which included a 4-step plan. Part of that 4-step plan is the implementation of a meteorological, Particulate Matter of less than 10 microns (PM10), and toxic air contaminant monitoring program. The goals of the monitoring program are three fold. They include the observation of incremental increases in toxic air contaminant concentrations, observation of PM10 issues and a basis for mitigation efforts. However, any meaningful observations will require comparison to a baseline. In order to establish a baseline the monitoring program must be established prior to any implementation of the Project and must continue through the implementation process.
1 IID Water Conservation and Transfer Project Final Environmental Impact Report/Environmental Impact Statement Habitat Conservation Plan June 2002.

2 Quality Assurance Quality Control Plan For The Salton Sea Air Monitoring Network Original 01/27/2010
together to share responsibility for the QA/QC requirements in order to maintain consistency among all stations. Because all of these stations are located on either state, federal or tribal lands in Imperial and Riverside counties, both the ICAPCD and TM have a mutual partnership in the sharing of resources, time and training. In this configuration, the SSAQMN will be operated for a period of five years, commencing early 2010 for the sole purpose of assessing baseline air quality conditions. Two ICAPCD Air Monitoring Technicians are primarily responsible for the maintenance and operation of the SSAQMN along with the assistance of an Environmental Coordinator. During the first year of operation the stations will be monitoring PM10 and associated meteorological parameters on a continuous basis. Future parameters include the addition of filter-based “fine” particulate matter of 2.5 microns or less (PM2.5) and PMcoarse (PM10-2.5), alternative continuous PM2.5 and PM10 as well as continuous ammonia and hydrogen sulfide monitors. By the third year of operation, PM deposition, ozone, NOx, and SO2 monitors may be added under the tentative budget plan. Although these monitors are foreseeable in the future it is not likely that all stations will have all of these monitors installed – TABLE 1 below contains a listing of instruments and their function at each station. The Air Monitoring Technicians will be responsible for the requirements of monitor maintenance and operation which include verification of instrument operation, instrument calibration checks, instrument adjustment, instrument servicing and parts replacement, and verification of datalogger operation.
Table 1 STATION INSTRUMENTS AND FUNCTIONS
INSTRUMENT FUNCTIONS
TEOM 1405-D The TEOM1405-D provides simultaneous real-time measurements of PM10, PM2.5 and PMcoarse.
Sonic Anemometer Measures three-dimensional wind velocity based on the transit time of ultrasonic signals.
Gill 3-Cup Anemometer The Gill 3-Cup Anemometer measures horizontal wind direction and speed.
Platinum Temperature Probe The probe measures temperature.
Aspirated Radiation Shield The Aspirated Radiation Shield is used to protect temperature probes from direct and indirect radiation.
Relative Humidity / Temperature Probe The probe measures both relative humidity and temperature.
Multi-Plate Radiation Shield The Multi-Plate Radiation Shield protects temperature and relative humidity sensors from error-producing solar radiation and precipitation.
Net Radiometer Device designed to measure the sum of all incoming radiation less the outgoing radiation.
In addition to the duties described above, both Air Monitoring Technicians will be trained to conduct central server management and quality control assessment. One Air Monitoring Technician will be principally responsible for central server management however the training of both Air Monitoring Technicians will facilitate schedules. Central

3 Quality Assurance Quality Control Plan For The Salton Sea Air Monitoring Network Original 01/27/2010
server management includes querying of the central server for functionality in uploading all monitoring data from the SSAQMN stations. Any problems requiring extensive troubleshooting will be coordinated with American Ecotech, the data acquisition and management program developer. The Air Monitoring Technicians will be responsible for assuring that all real-time data is uploaded hourly to the California Air Resources Board’s (CARB) Air Quality and Meteorology Information System (AQMIS2)2
To summarize, future Salton Sea air pollutant emissions that are associated with the water transfer will necessarily include both natural and manmade sources. As mentioned above, exposed playa resulting from lower water levels, will have the potential to contribute windblown dust during high wind events. Dust components will include possible toxic compounds, such as selenium, and particulate matter (PM) size fractions for which the state and federal governments have established ambient air quality standards, such as PM10 and PM2.5. In addition, high wind events also cause mixing of the stable water layers in the Sea that release toxic gases such as hydrogen sulfide and ammonia. The construction of the habitat area for wildlife will produce vehicle exhaust and fugitive dust emissions from construction equipment during
. The principle quality control performed during the hourly uploads will be by a computer software script looking primarily for out-of-range and missing data only. The more thorough quality control check will be conducted on a monthly basis whereby the Air Monitoring Technician will manually review the monitoring data for validation. Validated data will be forwarded to the CARB for storage to a File Transfer Protocol (FTP) website for use by researchers on an as requested basis. Finally, every morning and afternoon the Air Monitoring Technicians will monitor the stations for alerts indicating action by the Air Monitoring Technicians to identify and resolve problems. This may include notification to TM along with a request for action. The Environmental Coordinator is responsible for data analysis. During the early phases of the SSAQMN the Environmental Coordinator will become familiar with the operational maintenance requirements for each station. The Environmental Coordinator will also need to understand the process involved in data quality control. As data is processed the Environmental Coordinator will analyze real-time and validated data for background analysis, wind events and associations with existing patterns in Imperial County. The goal of the review by the Environmental Coordinator is to develop a better understanding of the interplay between meteorological occurrences and concentrations of PM10. Essentially, the Environmental Coordinator is charged with research, evaluation and analysis of data for the purpose of establishing an air quality baseline for the Salton Sea area. As other parameters are added to the stations the review of the data will intensify. Associations of toxics, particulate matter and meteorological will become very important when describing the existing environmental nature of the Salton Sea. Because the Environmental Coordinator will be the primary representative on behalf of the ICAPCD at stakeholder meetings the Environmental Coordinator will have to become very familiar with the operational aspect of the stations, their locations and the ambient nature of the Salton Sea.
2 According to the CARB website the Air Quality and Meteorological Information System (AQMIS) is a web-based source for real-time (and historical) air quality and meteorological data. http://www.arb.ca.gov/aqmis2/MainPgLinks/aqinfoinfo.php

4 Quality Assurance Quality Control Plan For The Salton Sea Air Monitoring Network Original 01/27/2010
earthmoving operations. All of the pollutants associated with these sources will be monitored by the SSAQMN during the baseline monitoring period. The organizational chart for maintenance and operation of the Salton Sea Air Quality Monitoring Network is shown below in Figure 1.
QSA Joint Powers Agreement; IID,
Agent
Air Pollution Control Officer
Compliance Division Manager
Air Monitoring Technicians
Planning Division Manager
Environmental Coordinator
Tribal Council President
Environmental Manager
Air Monitoring Technician
Technical Coordination
California Air Resources
Board
Contract Funding
Contract Funding
FIGURE 1 SALTON SEA AIR QUALITY MONITORING NETWORK
ORGANIZATIONAL CHART

5 Quality Assurance Quality Control Plan For The Salton Sea Air Monitoring Network Original 01/27/2010
PROJECT DEFINITION/BACKGROUND As part of the Water Conservation Project by IID, a Quantification Settlement Agreement (QSA) was agreed upon whereby water budgets were established. These water budgets are to be achieved through the implementation of the QSA which is dependent on changes in current farming practices in Imperial Valley. Essentially, farming operations would voluntarily commit to on-farm conservation programs which would affect the amount of irrigation water applied to agricultural lands. By 2017 the conserved water would be transferred, as agreed upon, substantially reducing irrigation drainage flows to the Salton Sea and, as a result, cause the water level in the Sea to drop. As mentioned above, the decrease in the water level at the Salton Sea will expose seabed playa creating a potential to contribute to windblown dust levels during high wind events. In addition, the Salton Sea has no natural outlet and roughly 18% of the volume of the Sea evaporates each year. With continued evaporation, the Sea will become increasingly salty and devoid of aquatic life which currently sustains a large population of resident and migratory birds. In response to forecasts of continued deterioration of the Salton Sea habitat the Salton Sea Restoration Act was enacted in 2003 to protect a portion of the Salton Sea for aquatic and avian habitat. One of the tasks assigned to the restoration project is the monitoring of baseline air quality prior to the initiation of any habitat construction. The Salton Sea Ecosystem Restoration Program’s Air Quality Working Group identified monitoring as a necessary component to establish baseline air quality around the Salton Sea. Funding for the SSAQMN was secured in part through the Air Quality Working Group as facilitated by the California Department of Water Resources (CDWR). A joint power agency (JPA) operating under an agreement of the three water agencies who are signatories to the QSA are providing funding for site infrastructure construction, shelter installation, purchase and installation of meteorological and continuous particulate matter monitors, and training of operating staff, together with ongoing funding for network operation. The IID serves as the fiscal agent for the JPA. Funding for additional particulate matter and gaseous monitors has not been secured, but will be pursued over the next two years by the Air Quality Working Group. MONITORING SYSTEM DESIGN Initially, the SSAQMN will monitor PM and meteorological parameters on a continuous basis at six monitoring sites. The PM size fractions to be monitored are PM10-2.5 and PM2.5. The meteorological parameters include wind speed, wind direction, temperature, solar radiation, and relative humidity. Figure 2 identifies each of the six monitoring stations in numerical sequence: the first (identified as #1) is located at the former Naval Test Site south of Salton City, the second (identified as #2) is at Salton City, the third (identified as #3) is at the Torres-Martinez wetlands project, the fourth (identified as #4) is at the Salton Sea Recreation Area headquarters facility, the fifth (identified as #5) is at Bombay Beach, and the sixth (identified as #6) is at the Sonny Bono Wildlife Refuge.

6 Quality Assurance Quality Control Plan For The Salton Sea Air Monitoring Network Original 01/27/2010
Five of the stations are operated and maintained by the ICAPCD with one station operated and maintained by the Torres-Martinez Band of Cahuilla Indians.
FIGURE 2 SALTON SEA AIR QUALITY MONITORING NETWORK SITES

7 Quality Assurance Quality Control Plan For The Salton Sea Air Monitoring Network Original 01/27/2010
The Final EIR/EIS for the IID Water Conservation and Transfer Project and HCP, Air Quality section, identified two specific criteria for the monitoring sites. The Final EIR/EIS requires the monitoring stations to be placed “both near the sources (exposed shoreline caused by the Project) and near the receptors (populated areas)”.3
Therefore, monitoring sites were selected close to the shore of the Salton Sea. These monitors will allow for the measurement of pollutant concentrations at the boundary between onshore sources and future exposed playa areas. On a more practical matter, other criteria specific to the sites involving such things as power supply and security were taken into consideration. Because monitoring instruments rely on a constant stream of voltage, and in order to minimize voltage dips caused by routine load changes, each site would need to be located near or adjacent to a 3-phase electrical power line. Security was also an issue. In order to prevent vandalism areas with locked, fenced enclosures were considered. In these areas, the site design includes an enclosed fence with a locked vehicle gate to reduce the potential of theft or vandalism. Figure 3 below is a diagram of the Navel Test Site #1 which represents a typical site.
FIGURE 3 NAVAL TEST SITE LAYOUT
3 Final EIR/EIS IID Water Conservation and Transfer Project and Habitat Conservation Plan, Section 3.9 Air Quality page 3-51.

8 Quality Assurance Quality Control Plan For The Salton Sea Air Monitoring Network Original 01/27/2010
Table 2 identifies the geographical coordinates and addresses of the SSAQMN stations. Each station is housed in an 8’ x 8’ x 20’ steel shipping container modified to provide instrument racks, calibration gas bottle storage area, and work area. A layout diagram of a typical station is shown in Figure 4.
FIGURE 4
MONITORING SHELTER LAYOUT
Table 2 Salton Sea Air Quality Monitoring Station Locations
No. Name Latitude (degrees)
Longitude (degrees)
Elev. (feet)
Address City ZIP Code
1 Naval Test Base 33.169226° -115.855927° -120 NA NA NA
2 Salton City 33.272754° -115.900616° -220 NA Salton City 92275
3 Torres-Martinez 33.518312° -116.075381° -230 Lincoln Ave.
& 73rd Ave. Mecca 92254
4 Salton Sea Park 33.508961° -115.919539° -230 100-225 State
Park Road North Shore 92254
5 Bombay Beach 33.352695° -115.734330° -220 A Street & 3rd
Street Bombay Beach 92257
6 Sonny Bono 33.176383° -115.623100° -215 906 W. Sinclair Road Calipatria 92233

9 Quality Assurance Quality Control Plan For The Salton Sea Air Monitoring Network Original 01/27/2010
The meteorological towers installed at each of the six stations are 10 meters (33 feet) tall and are anchored on a single foundation pier. The towers rotate vertically at a hinge point approximately 2 meters (6 feet) above the ground to provide ground level access for monitoring technicians to maintain and perform calibration checks on meteorological instruments. The towers are positioned approximately 75 feet from the monitoring shelters to reduce the potential for wind eddy currents downwind of the shelters from skewing measurements by wind speed sensors on the towers. Because the prevailing high speed wind directions around the Salton Sea are typically from the northwest, west, and the southwest, the meteorological towers are located to the west or northwest of the shelters at most sites. Due to the proximity of thick vegetation to the Sonny Bono monitoring station, the meteorological tower at this site is located adjacent to the shelter and wind speeds are measured at this site only at a 10 meter height. At all of the other sites, wind speeds are measured at 1 meter, 2 meter, and 10 meter heights. Other monitors on the meteorological towers measure wind direction, relative humidity, net solar radiation, and temperature. Wind direction is measured at the 10 meter height by a sonic anemometer that reports wind speed and direction in three axes. Cup anemometers are located at the 1 meter, 2 meter, and 10 meter heights to produce data needed to compute the surface roughness of the area surrounding each monitoring station for plume modeling purposes. A relative humidity sensor is mounted at a 2 meter height to record humidity data to support future playa emissivity research and to assess the impacts of precipitation on ambient particulate matter levels. Resistance thermometers with fan-cooled solar shields are mounted at 2 meter and 10 meter heights to produce temperature data needed for plume modeling purposes. A net solar radiometer is located at a 2 meter height to measure solar radiation also for plume modeling purposes. During the first year of operation, continuous PMcoarse and PM2.5 measurements will be recorded by tapered element oscillating microbalance technology at each station. A single instrument, the Thermo Scientific TEOM 1405-D, will perform this function. The TEOM 1405-D is composed of two major components, the sample inlet assembly with virtual impactor and the oscillating microbalances. Each microbalance consists of a vertical oscillating tube with an exchangeable particulate filter located at the upper end and a microbalance with oscillator attached to the lower end. As mass accumulates on the filter, the natural oscillation frequency of the tube slows down, and the change in frequency is measured by the microbalance. DATA MANAGEMENT Measurement data collected at the SSAQMN sites are managed by a data acquisition system under the primary supervision of Air Monitoring Technicians and an Environmental Coordinator. Data generated by each instrument are initially transmitted to a Microsoft Windows-based programmable datalogger at each station. These dataloggers store 10-second average meteorological, PMcoarse, and PM2.5 data and compute 5-minute and 1-hour average values for each. The computed values are uploaded hourly to a server running very similar software at the ICAPCD office in El

10 Quality Assurance Quality Control Plan For The Salton Sea Air Monitoring Network Original 01/27/2010
Centro, California. Only hourly-averaged data will be uploaded hourly to the AQMIS2 system for real-time online display and storage. This same data is reviewed and validated by the Air Monitoring Technician on a monthly basis or more frequently and transmitted in batch files to a CARB FTP site for storage and use by researchers on an as-requested basis. Included as part of the batch files to the CARB FTP site on a monthly basis, for storage, is the five-minute data and any other data not reported to AQMIS2. TABLE 3 includes a summary of the data that will be transmitted automatically to the CARB AQMIS2 program.
Table 3 Monitoring Data Transmitted to AQMIS2
Parameter Units Code Wind Speed (scalar) m/s 61101 Wind Direction (scalar) deg 61102 Wind Speed (vector) m/s 61103 Wind Direction (vector) deg 61104 Ambient Temperature Celsius 62101 Dew Point (calculated) Celsius 62103 Relative Humidity % 62201 Net Radiation W/m2 63305 Barometric Pressure mBar 64101 PM10 (calculated) µg/m3 (standard) 85101 PMcoarse µg/m3 (actual) 86101 PM2.5 µg/m3 (actual) 88101

11 Quality Assurance Quality Control Plan For The Salton Sea Air Monitoring Network Original 01/27/2010
The measured data from each station and the data computed by each datalogger that will be archived in each station datalogger and uploaded to the ICAPCD server is listed in Table 4. Except for 5-minute data, the CARB FTP site will also receive hourly uploads of the parameters listed in Table 4.
Table 4 Monitoring Data Batched For FTP Files
Parameter Units Averaging Period
Sonic Anemometer Wind Speed - U coordinate m/s 5-minute and 1-hour Wind Speed - V coordinate m/s 5-minute and 1-hour Wind Speed - W coordinate m/s 5-minute and 1-hour Wind Speed 2-D (scalar) m/s 5-minute and 1-hour Wind Direction 2-D (scalar) deg 5-minute and 1-hour Wind Speed 2-D (vector) m/s 5-minute and 1-hour Wind Direction 2-D (vector) deg 5-minute and 1-hour Wind Speed 3-D (scalar) m/s 5-minute and 1-hour Wind Direction 3-D (scalar) deg 5-minute and 1-hour Wind Speed 3-D (vector) m/s 5-minute and 1-hour Wind Direction 3-D (vector) deg 5-minute and 1-hour Sigma Theta (calculated) nondimensional 1-hour
Cup Anemometers Wind Speed – 10m (scalar) m/sec 1-hour Wind Speed – 2m (scalar) m/sec 1-hour Wind Speed – 1m (scalar) m/sec 1-hour
Thermister Temperature Sensors Ambient Temperature – 2m Celsius 1-hour Ambient Temperature -10m Celsius 1-hour Temperature Difference (calculated) Celsius 1-hour
Relative Humidity Sensor Ambient Temperature Celsius 1-hour Relative Humidity % 1-hour Dew Point (calculated) Celsius 1-hour
Solar Radiation Sensor Net Solar Radiation (calculated) W/m2 1-hour
Shelter Temperature Shelter Temperature Celsius 1-hour Continuous PM (TEOM 1405-D) Monitor
PM10 (calculated) µg/m3 (standard) 5-minute and 1-hour

12 Quality Assurance Quality Control Plan For The Salton Sea Air Monitoring Network Original 01/27/2010
Table 4 Monitoring Data Batched For FTP Files
Parameter Units Averaging Period
PM10 (calculated) µg/m3 (actual) 5-minute and 1-hour
PMcoarse µg/m3 (actual) 5-minute and 1-hour PM2.5 µg/m3 (actual) 5-minute and 1-hour Status nondimensional 5-minute and 1-hour Operating Mode nondimensional 5-minute and 1-hour Ambient Temperature Celsius 5-minute and 1-hour Relative Humidity % 5-minute and 1-hour Barometric Pressure mBar 5-minute and 1-hour Dew Point Celsius 5-minute and 1-hour Filter A % 5-minute and 1-hour Filter B % 5-minute and 1-hour Vacuum Atmospheres 5-minute and 1-hour Mass Flow A L/min 5-minute and 1-hour Mass Flow B L/min 5-minute and 1-hour Mass Flow Bypass L/min 5-minute and 1-hour Noise A nondimensional 5-minute and 1-hour Noise B nondimensional 5-minute and 1-hour

13 Quality Assurance Quality Control Plan For The Salton Sea Air Monitoring Network Original 01/27/2010
QUALITY OBJECTIVES AND CRITERIA FOR MEASUREMENT DATA
Monitoring networks require Data Quality Objectives (DQO) to clarify the purpose of a study, to define the most appropriate type of information to collect, to determine the conditions from which to collect that information and to specify tolerable levels of potential decision errors. The Air Quality Working Group identified the uncertainties surrounding the impacts to the environment resulting from the IID Water Conservation and Transfer and HCP project. Essentially, without information on the nature and extent of the potential future problem any commitment to mitigation was assumed to be premature and costly. A phased approach consisting of a 4-step plan included the implementation of a meteorological, PM10, and toxic air contaminant monitoring program. Therefore, the SSAQMN has been designed to monitor the area surrounding the Salton Sea in order to establish an air quality baseline and as the implementation of the HCP occurs to identify and resolve potentially significant impacts to the environment. As mentioned above, air quality impacts resulting from the construction and operational phases of the entire Project as well as the potential wind erosion of soil from fallowed fields were identified. However, the issue important to this QA/QC Plan is the shoreline sediments exposed by lowered water levels in the Salton Sea which have the potential to contribute to windblown dust during wind events. Any observations of PM10 issues or incremental increases in toxic air contaminant concentrations can only be accomplished with the establishment of a baseline air quality condition. The baseline will be important to specific decisions on resolution or proposed mitigation efforts for the area. Therefore, for the first five years, the DQO of the SSAQMN will be to establish baseline air quality conditions around the Salton Sea area. In any decision making process the decision maker must be able to rely on some level of certainty that the data presented are of adequate quality. To accomplish this we first must examine the parameters which are currently proposed for monitoring. As mentioned in the “Monitoring System Design” section, the SSAQMN will monitor PM and meteorological parameters on a continuous basis at all six monitoring sites. PM10-
2.5, PM2.5, wind speed, wind direction, temperature, solar radiation, and relative humidity are the specific parameters to be monitored. The addition of future monitoring instruments will allow for the speciation of dust emissions which can then be analyzed for toxic compounds, such as selenium and PM. However future monitoring will be discussed at length when this QA/QC plan is revised to include the new parameters Representativeness is a term which refers to the degree to which data accurately and precisely represents a characteristic of a population, a parameter variation at a sampling point, a process condition, or an environmental condition. The development of the siting criteria for the SSAQMN are specific to the goals indicated for the implementation of the monitoring network, that of the establishment of baseline air quality conditions around the Salton Sea. Page 7, describes the specific criteria used to determine the site for each station. In addition, the section titled “Monitoring System Design” beginning on page 5 contains a detailed description of each monitoring site.
14 Quality Assurance Quality Control Plan For The Salton Sea Air Monitoring Network Original 01/27/2010
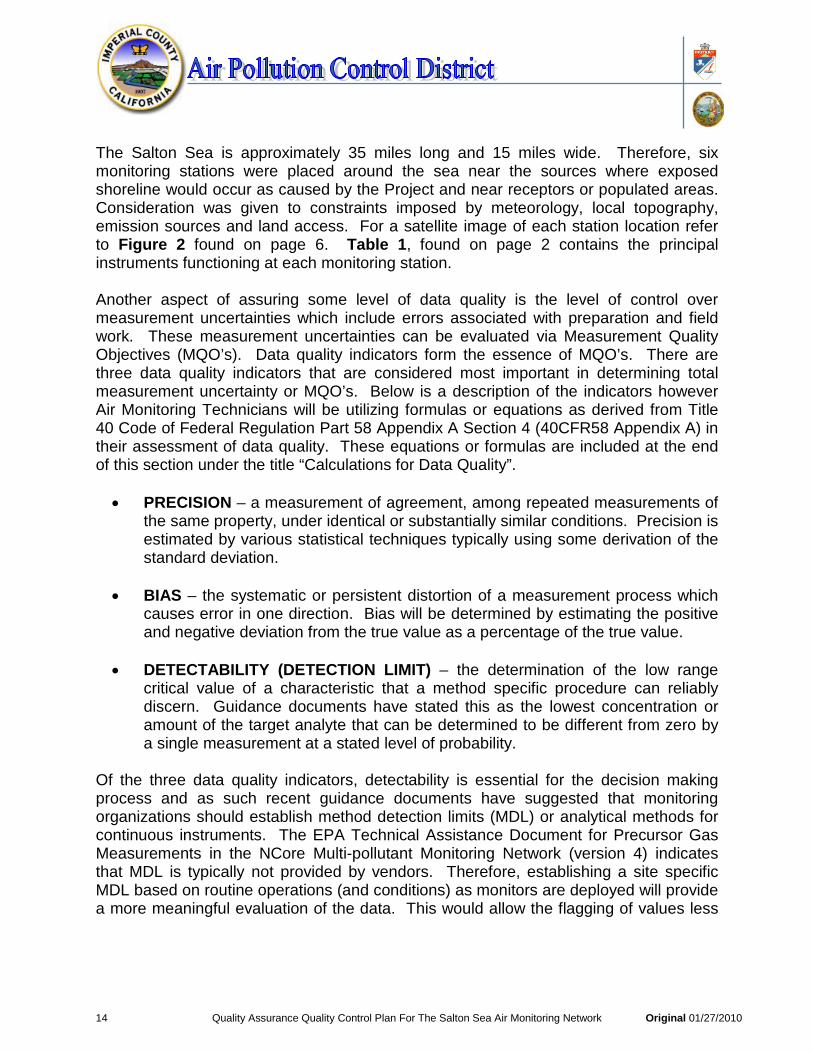
The Salton Sea is approximately 35 miles long and 15 miles wide. Therefore, six monitoring stations were placed around the sea near the sources where exposed shoreline would occur as caused by the Project and near receptors or populated areas. Consideration was given to constraints imposed by meteorology, local topography, emission sources and land access. For a satellite image of each station location refer to Figure 2 found on page 6. Table 1, found on page 2 contains the principal instruments functioning at each monitoring station. Another aspect of assuring some level of data quality is the level of control over measurement uncertainties which include errors associated with preparation and field work. These measurement uncertainties can be evaluated via Measurement Quality Objectives (MQO’s). Data quality indicators form the essence of MQO’s. There are three data quality indicators that are considered most important in determining total measurement uncertainty or MQO’s. Below is a description of the indicators however Air Monitoring Technicians will be utilizing formulas or equations as derived from Title 40 Code of Federal Regulation Part 58 Appendix A Section 4 (40CFR58 Appendix A) in their assessment of data quality. These equations or formulas are included at the end of this section under the title “Calculations for Data Quality”. • PRECISION – a measurement of agreement, among repeated measurements of
the same property, under identical or substantially similar conditions. Precision is estimated by various statistical techniques typically using some derivation of the standard deviation.
• BIAS – the systematic or persistent distortion of a measurement process which causes error in one direction. Bias will be determined by estimating the positive and negative deviation from the true value as a percentage of the true value.
• DETECTABILITY (DETECTION LIMIT) – the determination of the low range critical value of a characteristic that a method specific procedure can reliably discern. Guidance documents have stated this as the lowest concentration or amount of the target analyte that can be determined to be different from zero by a single measurement at a stated level of probability.
Of the three data quality indicators, detectability is essential for the decision making process and as such recent guidance documents have suggested that monitoring organizations should establish method detection limits (MDL) or analytical methods for continuous instruments. The EPA Technical Assistance Document for Precursor Gas Measurements in the NCore Multi-pollutant Monitoring Network (version 4) indicates that MDL is typically not provided by vendors. Therefore, establishing a site specific MDL based on routine operations (and conditions) as monitors are deployed will provide a more meaningful evaluation of the data. This would allow the flagging of values less

15 Quality Assurance Quality Control Plan For The Salton Sea Air Monitoring Network Original 01/27/2010
than the established MDL allowing data users a more informed decision on the use of that data.4
• COMPLETENESS – a measurement of the amount of valid data obtained compared to the amount that was expected to be obtained under correct, normal conditions. See “Calculations for Data Quality” at the end of this section.
Whenever it is not possible to make a distinction between measurement uncertainties in precision and bias components the term accuracy will be used. Accuracy is a term used to represent closeness to “truth”. Other indicators that are considered include completeness and comparability.
• COMPARABILITY – a measure of confidence with which one data set or method
can be compared to another, considering the units of measurement and applicability to standard statistical techniques.
Comparability is important because one can quantify a number of data quality indicators (precision, bias, detectability) and determine whether two methods are comparable. Therefore comparability must be evaluated in light of a pollutant that is considered a method-defined parameter. Method-defined parameters include measurements of physical parameters such as temperature, solar radiation and measurements of particulate matter. Once the monitoring stations are functional MQO’s will be compared to federally required particulate mass samplers for comparability. For each of the data quality indicators acceptance criteria has been developed utilizing existing quality indicators for filter based PM10 and PM2.5 found either in the Code of Federal Regulations or EPA Guidance documents. Theoretically, if the MQO’s are met then measurement uncertainty should be controlled to a level required by the DQO. Table 5 identifies the MQO’s for the SSAQMN and is divided into three sections which identifies the Critical Criteria, the Operational Criteria and the Systematic Criteria.
• CRITICAL CRITERIA – criteria deemed critical to maintaining the integrity of a sample, group of samples or ambient air concentration values. Observations that do not meet each and every criterion on the critical table should be invalidated unless there are compelling reasons and justifications for not doing so. Therefore any cause for not operating in the acceptable range for each of the invalid criteria must be investigated and minimized to either correct the problem or minimize the likelihood that additional values will be invalidated.
• OPERATIONAL CRITERIA – criteria important for the maintenance and evaluation of the quality of the data collection system. Violation of a criterion or a number of criteria may be a cause for invalidation. The decision should consider other quality control information that may or may not indicate the data
4 By maintaining the manufactures flow rates of 1.67 1 l/min for coarse and 3 1 l/min for PM2.5 the unit measures the total mass accumulated on each of the TEOM filters for calculating the mass concentration of PM10. The objective is to obtain 5 minute and hourly measurements of each parameter for future studies and analysis

16 Quality Assurance Quality Control Plan For The Salton Sea Air Monitoring Network Original 01/27/2010
are acceptable for the parameter being controlled. The source of the problem should be investigated, mitigated or justified.
• SYSTEMATIC CRITERIA – criteria that is important for the correct
interpretation of the data but that does not usually impact the validity of a measured value or sample. Data quality objectives are included in this table. However, not meeting these objectives does not invalidate any of the measured values or samples but it may impact the error rate associated with the intended decision.
TABLE 5
MEASUREMENT QUALITY OBJECTIVES CRITERIA Frequency Acceptance Criteria Reference
CRITICAL CRITERIA Operational Mode 4 Continuous Mode 4 Status – Obtained
when Modes 1-4 are cycled
Manufactures Manual 40 CFR PART 50 APP J
Sections 7.0 & 9.0
Flow Rate PM10, PM2.5 Continuous Displayed Flow Rate within ±5% of set point
40 CFR PART 58, App A Sections 6.5; 7.1.3 & 7.1.4
40 CFR PART 50 App J Sections 7.0 & 8.1.2
One-point Flow Rate Verification PM10,
PM2.5
Once per month ±4% of transfer standard 40 CFR PART 58, App A Section 3.2.3
40 CFR PART 50 App J Sections 7.1.6 & 8.2.1
OPERATIONAL CRITERIA System Leak Check During precalibration
check PMcourse and PM2.5
flows within 0.15 l/m and bypass flow within 0.60 l/m
of “zero” with vacuum disconnected
Manufactures Manual Method 2.11 Section 2.3.2 40 CFR PART 50 App J
Section 9.7
Flow Rate Multi-point Verification/Calibration
Once a year All cal points within ±10% of design (set point)
Manufactures Manual Method 2.11 Section 2.3.2
Semi-annual flow rate audit
Once every 6 months ≤4% of standard and 5% of design value
40 CFR PART 58, App A Section 3.2.4
40 CFR PART 50 App J Sections 7.1.6 & 8.2.1
Semi-annual flow rate audit verification
Once every 6 months ≤4% of standard and 5% of design value
40 CFR PART 58, App A Section 3.2.3
40 CFR PART 50 App J Sections 7.1.6 & 8.2.1
Inlet/downtube Cleaning
Once every three months cleaned Method 2.11 Section 6
Manufacture-Recommended Maintenance
Per Standard Operating Procedures/manufacturer's
Manual
Per Standard Operating Procedures/manufacturer's
Manual
Shelter Temperature Daily 15-30º C (59º - 86ºF) 40 CFR PART 50.8
SYSTEMATIC CRITERIA

17 Quality Assurance Quality Control Plan For The Salton Sea Air Monitoring Network Original 01/27/2010
TABLE 5
MEASUREMENT QUALITY OBJECTIVES CRITERIA Frequency Acceptance Criteria Reference
Completeness for PM2.5 Measurements
Quarterly 95% 40 CFR PART 50, APP N Recommends 75%
Completeness for PM10 Measurements
Quarterly 95% 40 CFR PART 50, APP K Recommends 75%
Reporting Units All µg/m3 at STP 40 CFR PART 50, APP K
Rounding Convention 24-hour, 3-year
average
Quarterly nearest 10 µg/m3 (≥5 round up)
40 CFR PART 50, APP K Section 1
PM10-2.5, PM2.5 Performance
evaluation
Over all 4 quarters PM2.5 ±10% bias PM10-2.5 ± 15% bias
40 CFR 50, App A Section 3.2.7
Verification/Calibration Standards and Recertification - All standards should have multi-point certification against NIST Traceable standards
Flow Rate Transfer Standard
Once a year ±2% of NIST -traceable Standard
40 CFR PART 50, APP J
Field Thermometer Once a year ±0.1º C resolution, ±0.5º C accuracy
Recommendation - EPA’s Quality Assurance
Handbook V II, Appendix D Field Barometer Once a year ± 1 mm Hg resolution, ± 5
mm Hg accuracy Recommendation - EPA’s
Quality Assurance Handbook VII, Appendix D
Calibration & Check Standards
Flow Rate Transfer Standard
Once a year ±2% of NIST -traceable Standard
40 CFR PART 50 App J Method 2.10
Verification/Calibration
Clock/timer Verification
four (4) times a year 5 min/mo Recommendation – EPA’s Quality Assurance
Handbook V II Appendix D DATA REVIEW, VERIFICATION AND VALIDATION These techniques will be used to validate (accept or reject) or qualify data in an objective and consistent manner. Both verification and validation require the use of objective evidence either specified requirements have been fulfilled or particular requirements for a specific intended use are fulfilled. To verify data, the use of acceptance criteria as found in TABLE 5 should be assessed to either validate or invalidate data. That is, any deviation from the acceptance criteria must be recorded and assessed according to standard operating procedures.5
5 Air Monitoring Technicians will be required to record all investigative results to help establish standard deviations and to distinguish between standard and serious deviations.
In addition, field activities

18 Quality Assurance Quality Control Plan For The Salton Sea Air Monitoring Network Original 01/27/2010
should determine how seriously a procedure deviated beyond the acceptable criteria so that potential effects of the deviation can be evaluated during data quality assessment.6
TABLES 7 through 12 are suggested forms for routine maintenance procedures, audit/calibration procedures, parts and replacement procedures and meteorological instrument maintenance requirements. Table 11 is a replication of the maintenance check sheet found in the Standard Operating Procedures section of this Plan. Table 12 is a “sample” Daily Data Tracking Sheet the Air Monitoring Technicians will utilize to track daily status of each station.
For quality control deviations, in field results will be documented and keep in a log as will corrective actions. These logs will identify what actions were taken and the potential effect of the actions on the validity of the data. When calibration problems are identified, any data produced between the suspect calibration event and any subsequent recalibration shall be flagged to alert data users. Any data anomalies should be investigated by simple statistical analyses. For example averaging across time, 5-minute, hourly or daily averages and using the comparability measurement objectives. These records will be reviewed by assigned staff and management to assure proper accountability. In an automated data processing system, such as that at the SSAQMN, these procedures are easily incorporated into the basic software. The computer will be programmed to scan data values for extreme values, outliners or ranges. These checks can also be further refined to account for time of day, time of week and other cyclic conditions. Questionable data values are to be flagged on the data tabulation to indicate a possible error. Other types of data review will also occur such as graphical representations. As mentioned above, the Air Monitoring Technicians will be responsible for data validation. The purpose of data validation is to detect and then verify any data values that may not represent actual air quality conditions at the sampling station. With the use of the procedures described above, the Air Monitoring Technicians will be able to evaluate the difference between successive data values rather quickly allowing proper flagging of suspect data points. When data assessment clearly indicates a serious problem then the Air Monitoring Technician must review all pertinent quality control information to make a determination whether any ambient data should be invalidated. This should be confirmed by a second source, such as the CARB. Any invalidation should be documented and kept as part of the permanent documentation for the station.
6 The level of seriousness can only be determined over time through objective evidence demonstrated in recorded observances and if applicable field findings.

19 Quality Assurance Quality Control Plan For The Salton Sea Air Monitoring Network Original 01/27/2010
CALCULATIONS FOR DATA QUALITY BIAS ESTIMATE USING ONE-POINT FLOW RATE VERIFICATIONS For each one-point flow rate verification calculate the percent difference in volume using Equation 1 Where: meas is the value indicated by the sampler's volume measurement
audit is the actual volume indicated by the auditing flow meter. The absolute volume bias upper bound is then calculated using Equation 3 Where: n is the number of flow rate audits being aggregated;
t0.95,n–1is the 95th quantile of a t-distribution with n-1 degrees of freedom The quantity AB is the mean of the absolute values of the d i's and is calculated using Equation 4 The quantity AS in equation 3 is the standard deviation of the absolute values if the d i's and is calculated using Equation 5
Equation 1
di = meas - audit x 100 audit
Equation 3
|AB| = AB + t0.95,n-1 x AS
Equation 4
AB = 1 .
|di| n
Equation 5
AS =

20 Quality Assurance Quality Control Plan For The Salton Sea Air Monitoring Network Original 01/27/2010
ASSESSMENT SEMI-ANNUAL FLOW RATE AUDITS For each flow rate audit, calculate the percent difference in volume using Equation 1 To quantify this annually and at the 3-year primary quality assurance organization level, probability limits are calculated from the percent differences using Equations 6 and 7
Wh
ere: m is the mean described in Equation 8 k is the total number of one-point flow rate verifications for the year S is the standard deviation of the percent differences as described in Equation 9
PERCENT DIFFERENCE Percent differences for the annual flow rate audit concentration, calculated using Equation 1 can be compared to the probability intervals for the one-point flow rate verifications. Note: Ninety-five percent of the individual percent differences (all audit concentration levels) for the performance evaluations should be captured. DATA COMPLETENESS
Completeness = # of valid samples * 100 # of possible samples
Equation 6 Upper Probability Limit = m + 1.96 · S
Equation 7 Lower Probability Limit = m - 1.96 · S
Equation 9
S =
Equation 8
m = 1 .
di k

21 Quality Assurance Quality Control Plan For The Salton Sea Air Monitoring Network Original 01/27/2010
SPECIAL TRAINING/CERTIFICATION
An Air Monitoring Technician must have enough basic education, training and experience in electronics to install, inspect, operate and repair analog and digital air quality monitoring equipment and recording devices. Currently, the Air Monitoring Technicians and the Environmental Coordinator assigned to the SSAQMN are being trained by senior Air Monitoring Technicians on federal and state requirements. The training will intensify as the installation process for each station at the Salton Sea commences. Each Air Quality Monitoring Technician and the Environmental Coordinator will have hands on experience with the installation of the Thermo Fischer Scientific TEOM Series 1405-D instruments and associated meteorological instruments. The hands on installation will be supervised by American Ecotech, the contracted supplier and support for the SSAQMN. In order to supplement the Air Monitoring Technicians current experience and training, provisions for attending the Air Pollution Training Institutes (APTI) courses have been made available.7
7
With modern technology and on demand training videos available through the web and as courses become available each Air Monitoring Technician will be encouraged to attend courses which will help with field, quality control and assurance and data management. Both the state and federal governments provide on-line courses for training purposes. The CARB provides training under their Compliance Training program while the federal government provides training under the APTI.
http://www.epa.gov/oar/oaqps/eog/catalog/otccour.html

22 Quality Assurance Quality Control Plan For The Salton Sea Air Monitoring Network Original 01/27/2010
DOCUMENTS AND RECORDS An important component of any environmental data collection and management system is the procedures for the timely preparation, review, approval, issuance, use, control, revision and maintenance of documents and records. There must be distinctions such that operators, supervisors and researchers can discern which files are considered official records (paper or electronic), how long those records are to be maintained and under what conditions, how they are to be stored and retrieved, who is responsible for the storage and retrieval and what security if any is required. ELECTRONIC RECORDS As technological advances continue, generation and retention of information is becoming more and more popular and accepted in business, government and industry. Therefore, retention of electronic as well as paper records will be stored in a logical order for ease of access. STATUTE OF LIMITATIONS Storing of records always becomes an issue of how much and for how long to store. 40 CFR Part 31.42 generally states that all information considered as documentation and records should be retained for 3 years from the date of finalization. However, this is only a minimum requirement. It is highly recommended that documents containing specific data points be retained indefinitely. To help identify what may be considered important and should be retained, a listing of possible category types and documents are identified in TABLE 6. These categories are subject to change as the monitoring stations go into operation. CONTACT INFORMATION All general inquiries pertaining to the SSAQMN should be directed to the ICAPCD at (760) 482-4606. At the end of this document is a listing of contact information which is subject to change. All updated contacts and phone numbers, both emergency and non-emergency numbers, will be kept at each monitoring station and at the ICAPCD office.

23 Quality Assurance Quality Control Plan For The Salton Sea Air Monitoring Network Original 01/27/2010
TABLE 6 INFORMATION THAT SHOULD BE RETAINED
CATEGORIES RECORD/DOCUMENT TYPE Management and Organization Reporting agency information
Organizational structure of monitoring program
Personnel qualifications and training
Quality management plan
Document control plan
Support contract
Site Information Network description
Site characterization file
Site maps/pictures
Environmental Data Operations QA Project Plan
Standard operating procedures
Field and laboratory notebooks
Inspection/maintenance records
Raw Data Any original data (routine and QC)
Data Reporting Data/summary reports
Data Management Data management plans/flowcharts
Quality Assurance Control graphs
Data quality assessments
Quality Assurance reports
System Audits
Each station will maintain the Site Operators Standard Operating Procedures, the Manufactures Manuals for each instrument including the Engineering Manuals for the Ecotech Loggers. In addition, all emergency contact names and phone numbers will be maintained at each station and at the main office for the ICAPCD.

24 Quality Assurance Quality Control Plan For The Salton Sea Air Monitoring Network Original 01/27/2010
TABLE 7 TEOM 1405-D
ROUTINE MAINTENANCE PROCEDURES
Requirement APCD Frequency (minimum
requirements)
Information / Action
Site Visit Once a week Record values found on the Main Screen
Perform a Leak Check Every 30 days It is recommended that the leak check is performed once a month or the same day the PM2.5 and PMcoarse filters are replaced. Conduct the leak check prior to replacing the filters.
Replace the PM2.5 & PMcoarse TEOM Filters When the filter loading percentage is between 60 and 75% or every 30
days, whichever comes first.
Both filters should always be changed at the same time. Make sure the filter loading percentage is not higher than 30% when installing the new filters. If the filter loading is higher than 30% or if the life-time of the filters becomes noticeably shorter, the in-line filters should be replaced. Always use the preconditioned filters found in the filter holders of the mass transducer.
Clean the Sample Inlet Every time the TEOM PM2.5 & PM Coarse Filters are replaced or every
30 days, whichever comes first.
The Sample Inlet should be cleaned immediately following a replacement of the TEOM PM2.5 and PM Coarse filters.
Clean the Virtual Impactor Every time the TEOM PM2.5 & PM Coarse Filters are replaced or every
30 days, whichever comes first.
The Virtual Impactor should be cleaned immediately following a replacement of the TEOM PM2.5 and PM Coarse filters and after cleaning the Sample Inlet.
Replace the Large By-pass Filter Every 6 months or sooner if deemed necessary.
It is recommended that the large by-pass filter be replaced immediately following one of the regularly-scheduled TEOM filter changes. It should be replaced in conjunction with the PM2.5 and PMcoarse flow in-line filters and within the 30-minute flow and temperature stabilization period that occurs after a TEOM filter change.
Replace the Small PM2.5 and PMcoarse Flow In-line Filters
Every 6 months or sooner if deemed necessary.
It is recommended that the small PM2.5 and PMcoarse flow in-line filters be replaced immediately following one of the regularly-scheduled TEOM filter changes. It should be replaced in conjunction with the large by-pass filter and within the 30-minute flow and temperature stabilization period that occurs after a TEOM filter change.
Clean the Air Inlet System Every 6 months or sooner if deemed necessary.
To avoid contamination of the TEOM filters during the cleaning of the air inlet, it is recommended that the cleaning takes place between the changes of the TEOM filters.
Rebuild the Sample Pump 18 months The pump rebuild kid (59-008630) contains instruction for rebuilding the pump.

25 Quality Assurance Quality Control Plan For The Salton Sea Air Monitoring Network Original 01/27/2010
TABLE 8 TEOM 1405-D
AUDIT/CALIBRATION PROCEDURES
Requirement APCD Frequency
(minimum requirements)
Information / Action
Ambient Temperature Audit Every 30 days 1. Press the Service button; 2. Press the Verification button; 3. Press the Instrument Audit button; 4. Review the data.
Ambient Temperature Calibration Every 30 days Calibration should take place if a single point comparison check against a reference sensor is not within the specs.
Ambient Pressure Audit Every 30 days 1. Press the Service button; 2. Press the Verification button; 3. Press the Instrument Audit button; 4. Review the data.
Ambient Pressure Calibration Every 30 days Calibration should take place if a single point comparison check against a reference sensor is not within the specs.
Leak Check Every 30 days It is recommended that the leak check is performed once a month or the same day the PM2.5 and PMcoarse filters are replaced. Conduct the leak check prior to replacing the filters and after replacing them. Also perform a leak check after the flow audit.
Flow Audit Every 30 days Performed before any other action associated with the TEOM.
Flow Calibration Every 30 days Refer to Section 7.3(B) of the TEOM SOPs or Section 5 of the TEOM 1405-D Manual for Instructions. Note, the ambient air temperature calibration, pressure calibration and leak check must be performed before the flow calibration procedure takes place.
Analog Outputs Calibration Once a year Refer to Section 7.5 of the TEOM SOPs or Section 5 of the TEOM 1405-D Manual for Instructions.
Mass Transducer Audit Once a year Refer to Section 7.6 of the TEOM SOPs or Section 5 of the TEOM 1405-D Manual for instructions.

26 Quality Assurance Quality Control Plan For The Salton Sea Air Monitoring Network Original 01/27/2010
TABLE 9 TEOM 1405-D
PARTS REPLACEMENT AND CONDITIONING
Requirement APCD Frequency (minimum
requirements)
Information/Action
PM10 Inlet
"O-ring" replacement 6 months The impactor nozzle O-ring should be replaced every 6 months or whenever damage or wear is visible during the cleaning of the PM10 inlet. A thin film of silicone grease should be applied to the O-ring. Also, apply a light coating of silicone grease to the aluminum threads of the upper acceleration assembly.
"Collector Assembly O-rings" 6 months The O-rings located in the bottom of the collector assembly should be replaced every 6 months or whenever damage or wear is visible during the cleaning of the PM10 inlet. A thin film of silicone grease should be applied to the O-rings.
Rain Jar Cap Every month Place a light coating of silicone grease on the gasket inside the cap of the rain jar every time is removed for cleaning.
Virtual Impactor
"O-ring" replacement 6 months The O-rings found inside the virtual impactor should be replaced every 6 months or whenever damage or wear is visible during the cleaning of the virtual impactor. A thin coating of O-ring lubricant should be applied onto the O-rings, if necessary.

27 Quality Assurance Quality Control Plan For The Salton Sea Air Monitoring Network Original 01/27/2010
TABLE 10
METEOROLOGICAL INSTRUMENTS MAINTENANCE AND REQUIREMENTS Instrument
Name Performance Specifications Routine
Calibrations Audits Routine
Maintenance Suggested Data
Screening
Sonic Anemometer
Wind Speed Range: 0 to 40 m/s (0 to 90 mph) Threshold: 0.01 m/s Accuracy: ±1% rms ±0.05 m/s (0 to 30 m/s) Wind Direction Azimuth Range: 0.0 to 359.9 degrees Elevation Range: ±60.0 degrees Accuracy: ±2⁰ (1 to 30 m/s) Speed of Sound Range: 300 to 360 m/s Resolution: 0.01 m/s Accuracy: ±0.1% rms ±0.05 m/s (0 to 30 m/s wind) Sonic Temperature Range: -50 to +50 ⁰C Resolution: 0.01 ⁰C Accuracy: ±2 ⁰C (0 to 30 m/s wind)
No calibration required.
The ICAPCD
will be shipping the instrument to manufacturer
when needed.
Audits will be
performed once a year
by CARB MLD staff
No maintenance required
Wind Speed 1. Flag data if the value is less
than zero or greater than 25 m/s.
2. Flag data if the value does not vary by more than 0.1 m/s for 3 consecutive hours.
3. Flag data if the value does
not vary by more than 0.5 m/s for 12 consecutive hours.
Wind Direction 1. Flag data if the value is less
than zero or greater than 360 degrees.
2. Flag data if the value does
not vary by more than 1 degree for more than 3 consecutive hours
3. Flag data if the value does
not vary by more than 10 degrees for 18 consecutive hours.

28 Quality Assurance Quality Control Plan For The Salton Sea Air Monitoring Network Original 01/27/2010
TABLE 10 METEOROLOGICAL INSTRUMENTS MAINTENANCE AND REQUIREMENTS
Instrument Name Performance Specifications
Routine Calibrations Audits
Routine Maintenance
Suggested Data Screening
Gill-3 Cup Anemometer
Range: 0 to 50 m/s (100 mph) gust survival to 60 m/s (130 mph) Dynamic Response: 2.3 m (7.5ft) cup wheel distance constant Threshold Sensitivity: 0.5 m/s (1.0 mph) tach-generator Every six (6)
months
Audits will be
performed once a year
by CARB MLD staff
1. Ball Bearings: Ball
bearings should be inspected every six (6) months and replaced if necessary.
2. Potentiometer should be inspected every six (6) months and replaced if necessary.
3. The tach-generator
should be inspected every six (6) months and replaced if necessary.
1. Flag data if the value is less
than zero or greater than 25 m/s.
2. Flag data if the value does not vary by more than 0.1 m/s for 3 consecutive hours.
3. Flag data if the value does
not vary by more than 0.5 m/s for 12 consecutive hours.
Platinum Temperature
Probe
Measuring Range: -50 to + 50⁰ C -50 to + 150⁰F Accuracy at 0⁰C: ±0.3⁰C ±0.1⁰C (optional)
Every six (6) months
Audits will be
performed once a year
by CARB MLD staff
Inspect the probe every three months
and recalibrate if needed. Otherwise recalibrate every 12
months by using normal bath
calibration methods.
1. Flag data if the value is greater than the local record high.
2. Flag data if the value is less than the local record low.
3. Flag the data if the value is
greater than 5⁰ C change from the previous hour.
4. Flag the data if the value
does not vary by more than 0.5⁰C for 12 consecutive hours.

29 Quality Assurance Quality Control Plan For The Salton Sea Air Monitoring Network Original 01/27/2010
TABLE 10 METEOROLOGICAL INSTRUMENTS MAINTENANCE AND REQUIREMENTS
Instrument Name Performance Specifications
Routine Calibrations Audits
Routine Maintenance
Suggested Data Screening
Aspirated Radiation
Shield
Radiation Error Ambient Temp: <0.2⁰C (0.4⁰F) RMS (@1000 W/m2 intensity) Delta T: <0.05⁰C (0.1⁰F) RMS with like shields equally exposed Aspiration Rate: 5 to 11 m/s (16-36 fps) depending on sensor size Power Reqmt: 12-14 VDC@500 mA for blower Blower Motor Tach Output: Square wave, 2 pulses per revolution. TTL (+5V)
No calibrations necessary
Audits will be
performed once a year
by CARB MLD staff
1. Every 3 months inspect and clean the shield by washing it thoroughly inside and out with mild soap and warm water. This should be done during single-point comparison check of sensor.
2. Every 6 months check the blower and replace if necessary. Refer to the 43502 Manual for step by step instructions on how to change the blower.
Does Not Apply

30 Quality Assurance Quality Control Plan For The Salton Sea Air Monitoring Network Original 01/27/2010
TABLE 10 METEOROLOGICAL INSTRUMENTS MAINTENANCE AND REQUIREMENTS
Instrument Name Performance Specifications
Routine Calibrations Audits
Routine Maintenance
Suggested Data Screening
Relative Humidity /
Temperature Probe
Relative Humidity Measuring Range: 0-100 %RH Accuracy at 20 ⁰C: ±2 %RH Stability: Better than ± 1 % RH per year Response Time: 10 seconds (without filter) Sensor Type: Rotonic Hygromer Output Signal: V option: 0-1 VDC, L option: 4-20 mA Temperature Calibrated Measuring Range: -50 to 50⁰C (suffix C); -50 to 150⁰F (suffix F) Response Time: 10 seconds (without filter) Accuracy at 0⁰C: ±0.3⁰C**; ±0.1 ⁰C (optional) with NIST traceable calibration Sensor Type: Platinum RTD Output Signal: V option: 0-1 VDC, L option: 4-20 mA, 4 wire RTD (41342 only)
Every three (3) months, see routine
maintenance description
Audits will be
performed once a year
by CARB MLD staff
1. The unit should be inspected every three (3) months and recalibrated if necessary. Otherwise it should be recalibrated every 12 months.
2. The sensor protective filter should be cleaned every three (3) months by soaking it in clean water or mild soap solution.
Relative Humidity 1. Flag data if the value is greater
than the local record high. 2. Flag data if the value is less
than the local record low.
Temperature 1. Flag data if the value is greater
than the local record high. 2. Flag data if the value is less
than the local record low. 3. Flag the data if the value is
greater than 5⁰ C change from the previous hour.
4. Flag the data if the value does not vary by more than 0.5⁰C for 12 consecutive hours.
Multi-Plate Radiation
Shield
Radiation Error: 1080 W/m2 intensity 0.4⁰C (0.7⁰F) RMS @ 3 m/s (6.7 mph) 0.7⁰C (1.3⁰F) RMS @ 2 m/s (4.5 mph) 1.5⁰C (2.7 ⁰F) RMS @ 1 m/s (2.2 mph)
Every six (6) months
Audits will be
performed once a year
by CARB MLD staff
Clean the plates and brackets with soap
and water. Do not use solvents.
Does Not Apply

31 Quality Assurance Quality Control Plan For The Salton Sea Air Monitoring Network Original 01/27/2010
TABLE 10 METEOROLOGICAL INSTRUMENTS MAINTENANCE AND REQUIREMENTS
Instrument Name Performance Specifications
Routine Calibrations Audits
Routine Maintenance
Suggested Data Screening
Net Radiometer
Nominal calibration factors For positive values: 9.3 Wm-2mV-1
For negative values: 11.6 Wm-2mV-1 Nominal resistance: 4 ohms Spectral response: Approx. 30 seconds Time constant Positive: Up to 5.9% reduction @ 7 m/s Negative Up to 1% reduction @ 7 m/s
Once a year
Audits will be
performed once a year
by CARB MLD staff
1. Every two weeks clean the windshields and mounting rings. Refer to the 097 Model Manual for step by step instructions on how to clean the windshields. If required replace the windshields.
2. Every month inspect the Silica gel to ensure is dry.
3. Every 3 months replace the
windshields. Refer to 097 Model manual for step by step instructions on replacing the windshields.
4. Every year, conduct an
annual calibration check on the instrument.
1. Flag the data if the value is greater than zero at night.
2. Flag the data if the value is
greater than the maximum possible for the date and latitude.
Data Reporting: Averaged hourly data from the meteorological instruments will be uploaded hourly to the AQMIS2 for real-time on line display and storage. Five minute data and hourly averaged data will be reviewed and validated on a monthly basis and transmitted in batch files to a CARB FTP site for storage and use by researchers on an as-requested basis.

32 Quality Assurance Quality Control Plan For The Salton Sea Air Monitoring Network Original 01/27/2010
TABLE 118
Weekly Checks
IMPERIAL COUNTY AIR POLLUTION CONTROL DISTRICT
MONTHLY QUALITY CONTROL MAINTENANCE CHECKSHEET TEOM 1405-D
Station Name:_________________________ Month/Year:__________________________ Station Number:_______________________ Time:________________________________ Property Number:______________________ Technician:___________________________
FUNCTION DIGITAL DISPLAY READINGS Date Checked
Operation Mode Status Condition Filter Loading %
PM2.5 Concentration PM Coarse Concentration
PM10 Concentration Data Logger Reading
Case Temperature Cap Temperature
PM2.5 Air Temperature PM Coarse Air Temperature
Enclosure Temperature PM2.5 Flow Rate Coarse Flow Rate Bypass Flow Rate
Frequency Noise
MONTHLY PRECISION CHECKS
Date Total Flow PM2.5 Flow PM Coarse Flow Average
Press/Temp Setting
Indicated LPM % Diff From 16.67
Indicated LPM
% Diff From 3.0
Indicated LPM
% Diff From 1.67
Press Temp
Daily Check: Check Status Conditions and the Filters Load Percentage and recorded in
Daily Data Tracking Sheet. Change Filters when loading % is between 60 and 75%.
Weekly Check: Record values of TEOM's digital display.
Monthly Check: (1)Conduct a Flow Check. (2) Record the results of flow check, average pressure and
temperature settings. If percent difference of flow rate is ± 5.0% notify supervisor.
(3) If instructed, conduct a flow calibration. (4) Perform a Leak Check. (5) Audit and if
necessary calibrate the Ambient Temperature. (6) Audit and if necessary calibrate the
Ambient Pressure. (7) Clean the Sample Inlet. (8) Clean the Virtual Impactor. Inspect and clean the Rain Jar Cap.
Every 6 months: (1) Replace the large by-pass filters. (2) Replace the small PM2.5 and Pmcoarse flow
Annual Check:
in-line filters. (3) Replace the PM10 Inlet O-rings, the Collector Assembly O-rings and the Virtual Impactor O-rings. (1) Clean the air inlet system. (2) Calibrate the Analog Outputs. (3) Audit and if necessary the Mass Transducer.
COMMENTS OR MAINTENANCE PERFOMED DATE
8 The Monthly Quality Control Maintenance Checksheet is referred as Table 8.1 in the Salton Sea Air Monitoring Project – Standard Operation Procedures for the Tapered Element Oscillating Microbalance (TEOM)

33 Quality Assurance Quality Control Plan For The Salton Sea Air Monitoring Network Original 01/27/2010
TABLE 12
SALTON SEA AIR QUALITY MONITORING NETWORK DAILY DATA TRACKING SHEET
Date Time Station 1 Status
Station 1 Filter
%
Station 2 Status
Station 2 Filter
%
Station 3 Status
Station 3 Filter
%
Station 4 Status
Station 4 Filter
%
Station 5 Status
Station 5 Filter
%
Station 6 Status
Station 6 Filter
%

34 Quality Assurance Quality Control Plan For The Salton Sea Air Monitoring Network Original 01/27/2010
Salton Sea Air Monitoring Project SITE OPERATOR’s
STANDARD OPERATING PROCEDURES for the
Tapered Element Oscillating Microbalance
(TEOM)
Thermo Fischer Scientific TEOM Series 1405-D
Continuous Dichotomous Ambient PM10, PM2.5 & PMcoarse Monitor

35 Quality Assurance Quality Control Plan For The Salton Sea Air Monitoring Network Original 01/27/2010
TABLE OF CONTENTS
SECTIONS
1 TEOM Specifications
2 Setup
3 Applying Power to the Instrument
4 Basic TEOM Operation 4.1 Performing a Leak Check 4.2 Storing Data
5 Screens and Settings
5.1 System Status Screen 5.2 Instrument Conditions 5.3 Settings 5.4 Service
6 Maintenance Procedures
6.1 Filter TEOM Replacement 6.2 Cleaning the Sample Inlet 6.3 Cleaning the Virtual Impactor 6.4 Replacing In-Line Filters 6.5 Cleaning the Air Inlet System
7 Audit/Calibration Procedures
7.1 Calibrating the Ambient Temperature 7.2 Calibrating the Ambient Pressure 7.3 Auditing/Calibrating the Flow Rates 7.4 Performing a Leak Check (Section 4.1) 7.5 Calibrating the Analog Outputs 7.6 Auditing the Calibration of Mass Transducer
8 TEOM Quality Control Maintenance Checks
8.1 Daily Check 8.2 Weekly Check 8.3 Monthly Check 8.4 Semiannual Check 8.5 Annual Check

36 Quality Assurance Quality Control Plan For The Salton Sea Air Monitoring Network Original 01/27/2010
9 Meteorological Instruments Maintenance Procedures 9.1 Sonic Anemometer – RM Young Model 8100 9.2 Gill 3-Cup Anemometer – Model 12101 9.3 Platinum Temperature Probe – Model 41342VF 9.4 Aspirated Radiation Shield – RM Young Model 43502 9.5 Relative Humidity / Temperature Probe – RM Young Model
41382VF 9.6 Multi-Plate Radiation Shield – RM Young Model 41003 9.7 Net Radiometer - MetOne Model 097
10 Quick Reference Sheets
10.1 Performing a Leak Check 10.2 Performing a Flow Check 10.3 Changing the Tapered Element Filters

37 Quality Assurance Quality Control Plan For The Salton Sea Air Monitoring Network Original 01/27/2010
General Information The procedures herein, are intended to supplement the Thermo Fisher Scientific Model 1405-D Tapered Element Oscillating Microbalance (TEOM) Operation Manual. These procedures will provide the user with the most essential operational requirements and procedures and will direct the user to appropriate sections of the Thermo Fisher Manual when necessary. It is recommended that the Thermo Fischer Manual be utilized in conjunction with these written procedures during the installation, operation, or calibration of the monitor. 1. TEOM Specifications
The TEOM is a real-time device used for measuring the particulate matter mass concentration of both PMcoarse and PM2.5. The TEOM has two major components. They are the sample inlet assembly with virtual impactor and the TEOM 1405-D unit (Figure 1-1). The sensor unit contains the two mass measurement hardware systems that monitor particles that have been split by the virtual impactor and have accumulated on the system’s exchangeable TEOM filters. By maintaining a flow rate of 1.67 l/min through the coarse sample flow channel, a 3 l/min through the PM2.5 sample channel, and measuring the total mass accumulated on each of the TEOM filters, the device can calculate the mass concentration of both the PM2.5 and PMcoarse sample streams in near real-time. To correctly calculate the mass concentration, mass rate and the total mass accumulation on the TEOM filter, the monitor must have a 16.7 l/min (1 m³/hr) flow rate through the sample inlet, a 30ºC sample stream temperature, a particulate matter mass concentration ranging from less than 5 μg/m³ to several g/m³ and the PM2.5 and PMcoarse flow rates mentioned above. 2. Setup The TEOM may be located in any convenient indoor location which is maintained between 15 - 35⁰ (59º and 86ºF). The user must follow the instructions for installing the two sampling tubes through the roof of the monitoring site (refer to the inlet installation instructions in the operation’s manual). The entrance to the sample inlet must be 1.8 to 2.1 m (70 to 82 inches) above the roof. The user must also install the ambient temperature/humidity sensor. If the ambient temperature/humidity sensor is “not” installed, the instrument must be set in “Passive” flow control otherwise the mass flow controller will attempt to control the sample flow as if the ambient temperature is absolute zero. The sample lines for the PM2.5 and the PMcoarse channels should proceed in a straight, vertical line from the PM10 inlet and virtual impactor to the inlet of the unit. The TEOM sensor unit should be located in an environment with relatively slow temperature fluctuations. Sampling locations with direct exposure to sunlight or that are in close proximity to heating or air-conditioning outlets should be avoided. To avoid condensation in the sample tubing, it is recommended that the user insulate the sample tube extension with pipe insulation when operating the instrument in areas of high humidity.
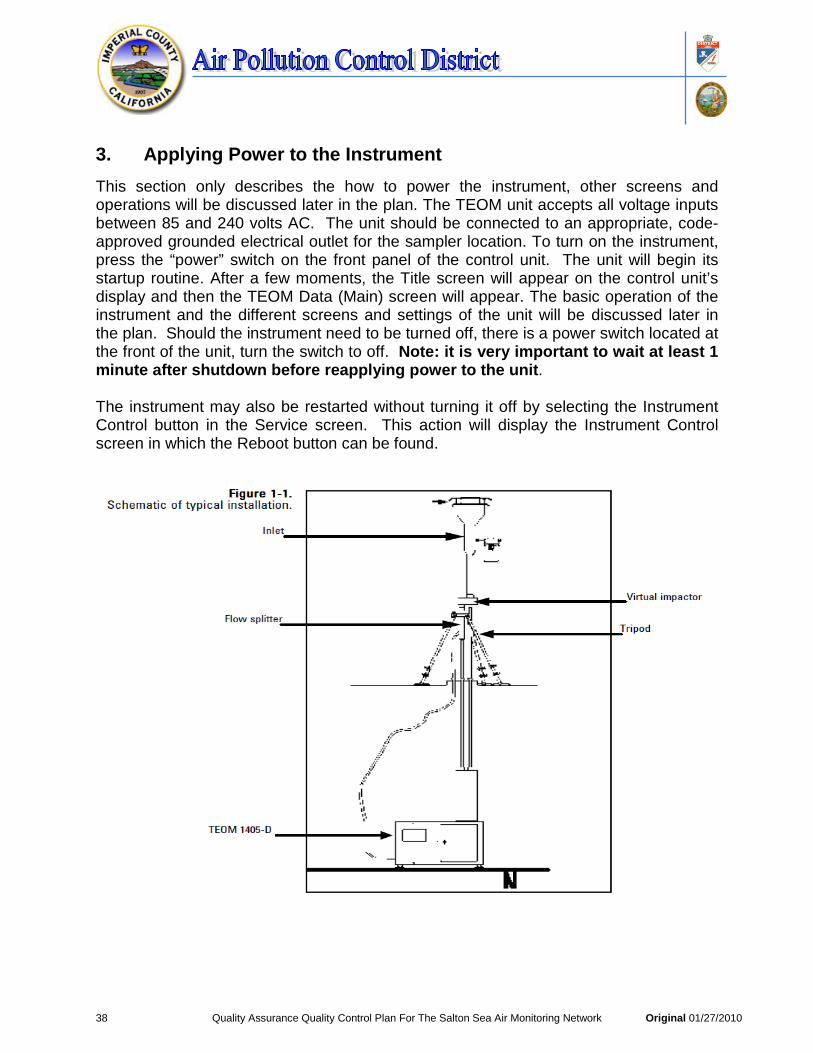
38 Quality Assurance Quality Control Plan For The Salton Sea Air Monitoring Network Original 01/27/2010
3. Applying Power to the Instrument This section only describes the how to power the instrument, other screens and operations will be discussed later in the plan. The TEOM unit accepts all voltage inputs between 85 and 240 volts AC. The unit should be connected to an appropriate, code-approved grounded electrical outlet for the sampler location. To turn on the instrument, press the “power” switch on the front panel of the control unit. The unit will begin its startup routine. After a few moments, the Title screen will appear on the control unit’s display and then the TEOM Data (Main) screen will appear. The basic operation of the instrument and the different screens and settings of the unit will be discussed later in the plan. Should the instrument need to be turned off, there is a power switch located at the front of the unit, turn the switch to off. Note: it is very important to wait at least 1 minute after shutdown before reapplying power to the unit. The instrument may also be restarted without turning it off by selecting the Instrument Control button in the Service screen. This action will display the Instrument Control screen in which the Reboot button can be found.

39 Quality Assurance Quality Control Plan For The Salton Sea Air Monitoring Network Original 01/27/2010
4. Basic TEOM Operation
After the installation of the TEOM has been completed, the Air Monitoring Technician must begin the process of programming. Programming requires the performance of precise sequential steps in order to commence data collection. It is very important to note that the instrument will not begin collecting data until the operating mode message in the status bar reads “Fully Operational”. Is it also important for Air Monitoring Technicians to install clean conditioned filters in the unit prior to taking samples. Air Monitoring Technicians can select flow rates, data and other settings while waiting for the unit to become fully operational. To program the instrument and begin collecting data the Air Monitoring Technician must follow the next 9 steps.
• Step 1 – Perform a Leak Check (refer to section 4.1 for leak check information). • Step 2 – Install a TEOM filter into the mass transducer on both tapered elements
TEOMs (refer to section 6 for filter installation information).9
• Step 3 – When in the System Status screen ensure that the serial number listed for the instrument matches the serial number on the back of the unit.
• Step 4 – When in the Instrument Conditions screen, select the Flows button to display the Flows screen. Select the Flow Rates button to select the desired flow rates for the PM2.5, PMcoarse and Bypass flow channels. Select the Flow Control button to select the desired flow control (“Active” or “Passive”) and the desired standard and average temperatures and pressures. (Refer to Section 5 for more information on screens and settings.)
• Step 5 – When in the Settings screen, select the System button, then the Set Time button to set the current date and time. (Refer to Section 5 for more information on screens and settings.)
• Step 6 – When in the Settings screen, select the Advanced button, then the Mass Transducer K0 Constants button to confirm the current K0 settings of the PM2.5 and PMcoarse TEOMS. The numbers programmed into the unit must match the K0 constants on the label near the mass transducer. (Refer to Section 5 for more information on screens and settings). However no changes should be made with prior approval.
• Step 7 – When in the Settings screen select the Data Storage button to displace the Data Storage screen. Confirm the desired data is selected to be logged by the instrument. (Refer to “Storing Data” in Section 4.2 for more information on selecting storage variables.)
• Step 8 – If you will be setting up the unit to receive an analog input, to transmit analog outputs, or setting up the unit’s contact closure circuits, refer to Section 5 for information on the screens and settings used for these parameters.
• Step 10 – Select the TEOM Data button to display the TEOM Data screen. The instrument will begin collecting data when the mode status window displays a “Fully operational” message.
9 Quick Reference Sheets for conduction Leak Checks, Flow Checks and installing TEOM filters are found in Section 10.
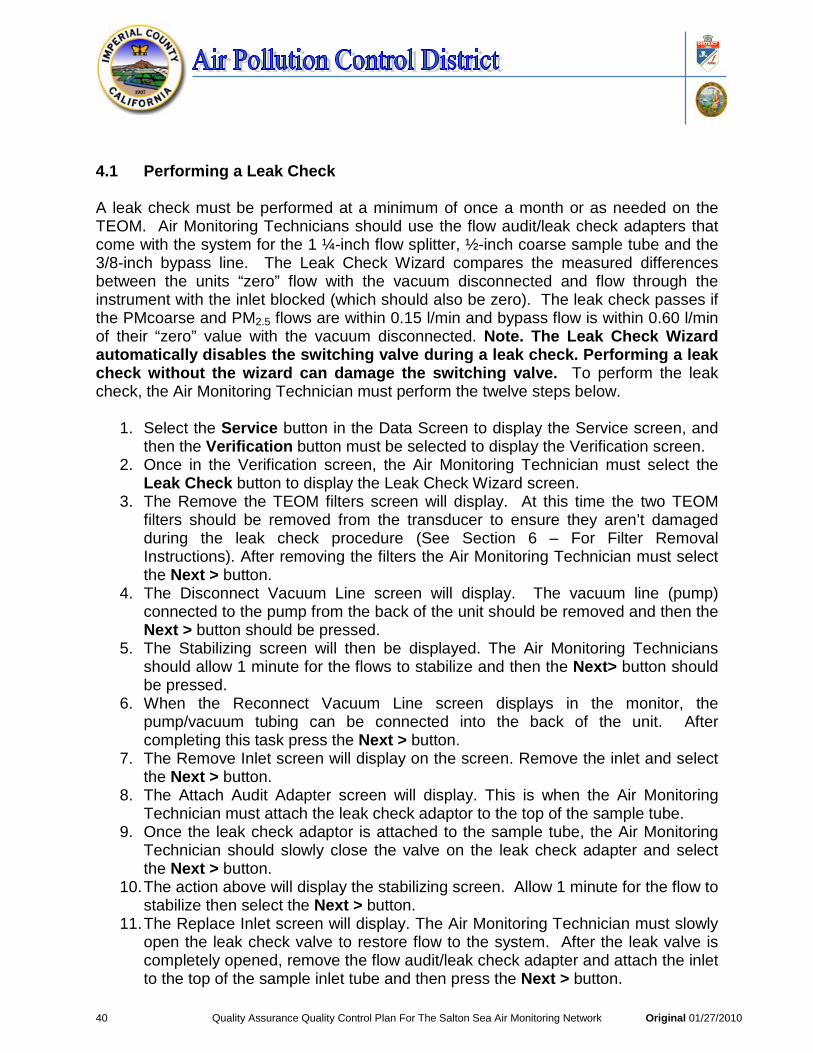
40 Quality Assurance Quality Control Plan For The Salton Sea Air Monitoring Network Original 01/27/2010
4.1 Performing a Leak Check
A leak check must be performed at a minimum of once a month or as needed on the TEOM. Air Monitoring Technicians should use the flow audit/leak check adapters that come with the system for the 1 ¼-inch flow splitter, ½-inch coarse sample tube and the 3/8-inch bypass line. The Leak Check Wizard compares the measured differences between the units “zero” flow with the vacuum disconnected and flow through the instrument with the inlet blocked (which should also be zero). The leak check passes if the PMcoarse and PM2.5 flows are within 0.15 l/min and bypass flow is within 0.60 l/min of their “zero” value with the vacuum disconnected. Note. The Leak Check Wizard automatically disables the switching valve during a leak check. Performing a leak check without the wizard can damage the switching valve. To perform the leak check, the Air Monitoring Technician must perform the twelve steps below.
1. Select the Service button in the Data Screen to display the Service screen, and then the Verification button must be selected to display the Verification screen.
2. Once in the Verification screen, the Air Monitoring Technician must select the Leak Check button to display the Leak Check Wizard screen.
3. The Remove the TEOM filters screen will display. At this time the two TEOM filters should be removed from the transducer to ensure they aren’t damaged during the leak check procedure (See Section 6 – For Filter Removal Instructions). After removing the filters the Air Monitoring Technician must select the Next > button.
4. The Disconnect Vacuum Line screen will display. The vacuum line (pump) connected to the pump from the back of the unit should be removed and then the Next > button should be pressed.
5. The Stabilizing screen will then be displayed. The Air Monitoring Technicians should allow 1 minute for the flows to stabilize and then the Next> button should be pressed.
6. When the Reconnect Vacuum Line screen displays in the monitor, the pump/vacuum tubing can be connected into the back of the unit. After completing this task press the Next > button.
7. The Remove Inlet screen will display on the screen. Remove the inlet and select the Next > button.
8. The Attach Audit Adapter screen will display. This is when the Air Monitoring Technician must attach the leak check adaptor to the top of the sample tube.
9. Once the leak check adaptor is attached to the sample tube, the Air Monitoring Technician should slowly close the valve on the leak check adapter and select the Next > button.
10. The action above will display the stabilizing screen. Allow 1 minute for the flow to stabilize then select the Next > button.
11. The Replace Inlet screen will display. The Air Monitoring Technician must slowly open the leak check valve to restore flow to the system. After the leak valve is completely opened, remove the flow audit/leak check adapter and attach the inlet to the top of the sample inlet tube and then press the Next > button.

41 Quality Assurance Quality Control Plan For The Salton Sea Air Monitoring Network Original 01/27/2010
12. The Competing the leak Check Wizard screen will display in the monitor. If the leak check passes, a “you have successfully completed the Leak Check” message will display. Note. If a leak check fails, a fail message will display. Isolate the leak, tighten the appropriate tubing and/or other connections and attempt the leak check again. After the Leak Check is completed, AQTs can install a new TEOM filter in the mass transducer.
4.2 Storing Data
The unit will only store those variables selected by the Air Monitoring Technician which is why is very important to set up the variables the Air Monitoring Technician whishes to log or the data will “NOT” be saved. To select the data storage variables the Air Monitoring Technician must first select the Settings menu button to display the Settings screen. When in the Settings screen, the Air Monitoring Technician must select the Data Storage button to display the Data Storage screen. When in the Data Storage screen the Air Monitoring Technician must select the Edit List button to display the Edit Data Storage screen. This action will allow the Air Monitoring Technician to press the names of the variables he/she wishes to log, up to a maximum of 20 variables can be logged. The Air Monitoring Technician must use the Next page > and < Previous Page buttons to scroll through the entire list of variables which can be stored. Once all the desired variables have been selected, the Air Monitoring Technician must press the OK button. The Air Monitoring Technician can use the ↑ and ↓ buttons to scroll through the list of selected variables to ensure that all desired variables are selected. It is also very important to select the Storage Interval button to select the interval for data storage. The Air Monitoring Technician must enter the desired data storage interval into the keypad and select the Enter button. For example, if the storage interval is 10 seconds, every 10 seconds the instrument will log (save) the data in the selected variables. When all the desired variables are selected and the Storage Interval is set, the Air Monitoring Technician can select the < Back button to return to the Settings screen.
5. Screens and Settings
It is extremely important for the Air Monitoring Technician to familiarize themselves with the screens and settings of the TEOM. The TEOM Data screen shows the basic operating information, as well as status conditions and the instrument operating mode. The TEOM Data screen can be displayed by selecting the TEOM Data button in any of the other four main screens: System Status (Section 5.1); Instrument Conditions (Section 5.2); Settings (Section 5.3); and Service (Section 5.4). One of the most important information found in the TEOM Data screen is the “Filter Loading Percentages.” This field contains the filter loading percentage by indicating the portion of the TEOM filter’s total capacity that has been used. The PM2.5 and PMcoarse Filter Loading percentages should never exceed 100%. It is recommended that the filters be replaced when the loading is between 60 and 75% (or sooner if desired), refer to section 6 for information on how to change the filters. For a complete description of

42 Quality Assurance Quality Control Plan For The Salton Sea Air Monitoring Network Original 01/27/2010
each value shown in the TEOM Data screen please refer to page 4-3 of the TEOM Manual. Air Monitoring Technicians can enter values into the settings screens using a number keypad. The Air Monitoring Technician needs to select the button for the value that needs to be changed, such as set points for flow rates, temperatures or pressures, and a keypad will automatically display the current set-point and the current value (when applicable). Once the selected value is entered into the keypad the Air Monitoring Technician must press the Enter button; if the Air Monitoring Technician whishes to cancel this action then he/she must press the Cancel button to exit the keypad screen and return to the screen. Once installed, the TEOM monitors will be set to operate according to project specific requirements. Proposed changes must be approved by an APCD Division Manager. It is always important to look at the status bar that is located at the bottom of the TEOM Data screen. If the status bar reads “Normal Status” then the system is operating properly, however if there are status conditions present, the field at the bottom of the screen will read “Warning(s)” and a triangle will appear in the instrument title bar at the top of the TEOM Data screen. Whenever a status warning is displayed, select the System Status button to display the System Status Screen. 5.1 System Status Screen
The System Status screen provides basic operating information and access to the list of the current active status warnings. To view the status warnings, the Air Monitoring Technician can select the View Warnings button or touch the warning triangle (or the title bar) when it is visible in any screen. This action will display the warnings screen. The Air Monitoring Technician must select the < Previous Warning and Next Warning> buttons to view the status warnings.
5.2 Instrument Conditions
The Instrument Conditions button displays the Instrument Conditions screen. In this screen the Air Monitoring Technician will have access to (1) Ambient Conditions, (2) Flow Settings, (3) Instrument Temperatures and (4) Analog Inputs.
1. Under the Ambient Conditions screen, the Air Monitoring Technician can have access to the Ambient Temperature (ºC) at the site; Ambient Pressure (atm) at the site; Ambient Dew Point (ºC); and Ambient Relative Humidity (%). All four Ambient Conditions cannot be edited. The Ambient Temperature, Ambient Dew Point and Ambient Relative Humidity will be correct only when the ambient temperature/humidity sensor is properly installed.
2. Under the Flows Screen the Air Monitoring Technician can access Flow Rates
and Flow Controls of the unit. The Flow Rates button is selected when the Air Monitoring Technician needs to view the instrument’s flow rates. It is important

43 Quality Assurance Quality Control Plan For The Salton Sea Air Monitoring Network Original 01/27/2010
to note that the PM2.5 path flow rate, the Coarse path flow rate, the Bypass flow rate and the Total flow cannot be edited. The Flow Control button is selected when the Air Monitoring Technician needs to view or adjust the unit’s standard temperature and pressure settings or select active or passive flow control. After the Air Monitoring Technician has selected the Flow Control button, the Flows Control screen will display in the monitor. At this time the Air Monitoring Technician must make sure that the Volumetric Flow Control is set on “Active” and that the reporting conditions are set to “Actual”. The Standard temperature, Average Temperature, Standard Pressure and Average Pressure should use the default values.
3. The Instrument Temperatures Screen contains the following control buttons: Cap
temperatures; Case temperature; PM2.5 air tube temperatures; and PMcoarse air tube temperature. The values of the above temperatures should NOT be adjusted without contacting Thermo Scientific and getting approval from an immediate supervisor.
4. The Analog Inputs Screen gives the current values of the unit’s four analog input channels. The inputs accept 0-5 VDC, and can be converted to a desired scale. The Air Monitoring Technician can select either one of the analog inputs to convert the analog input to a desired scale.
5.3 Settings
The Settings button displays the Settings screen; the Air Monitoring Technician can select the System, Analog & Digital Outputs, Data Storage and Advanced buttons to reach the desired screens.
• Under the System screen, the Air Monitoring Technician is allowed to set the time in the TEOM; select a password protection to initiate High Lock or Low Lock mode; select the network configuration for the units internet protocol, select the display button for different viewing mode of the screen, select the decimal symbol and select the date format.
• The Analog & Digital outputs screen allows the Air Monitoring Technician to set the basic parameters of the unit. This screen has three buttons, the Analog Outputs Screen, the Contact Closure and the RS232. By pressing the Analog Outputs button, the Air Monitoring Technician is allowed to select a variable, and set a minimum and maximum value for the output for the desired output channel (1-8). The Contact Closure screen allows the Air Monitoring Technician to select either the “Compare Operator” button or the “Compare Value” button for the desired contact closure channel #1 or #2. The RS232 Screen allows the users to set up the serial port for communication with the RP Comm software, or AK protocol.

44 Quality Assurance Quality Control Plan For The Salton Sea Air Monitoring Network Original 01/27/2010
• The Advanced screen once initially set should not be accessed by the air monitoring technician without the assistance of Thermo Fisher or immediate supervisor.
5.4 Service The Service button displays the Service screen and provides access to maintenance and verification wizards and procedures, as well as advanced troubleshooting and service tools. When in the Service Screen, the Air Monitoring Technician can select the Maintenance, Verification, Calibration, Install/Uninstall Accessories screens, Instrument Control and Advanced. The Maintenance, Verification, Calibration, and the Install/Uninstall Accessories are discussed in section 6. In the Instrument Control screen the Air Monitoring Technician can change the unit operating mode and restart or shutdown the instrument. The Advanced screen allows users to manually adjust the status, temperatures or flows of several instrument components. Air Monitoring Technicians must obtain APCD management approval before contacting Thermo Scientific and adjusting any settings. In the case that the instrument needs new firmware, the Air Monitoring Technician can download the firmware onto a personal computer and then transfer it to the TEOM or locate the updated version on the software CD. Please refer to pages 4-34 through 4-38 of the TEOM manual for further instructions.
6. Maintenance and Calibration Procedures
Air Monitoring Technicians will have the responsibilities for the daily TEOM operations and maintenance. All site visits and activities should be carefully documented in the site logbook. Site visits and quality assurance checks for the TEOM shall be conducted at a minimum of once every week (7-days). Any TEOM malfunctions, problems or questionable operations should be reported immediately to both the Enforcement Division Manager and the Planning Division Manager. The following is a list of the regular maintenance procedures recommended by Thermo Scientific. A detail description of each maintenance procedure is discussed in sections 6.1 through 6.6. Filter TEOM replacement The PM2.5 and PMcoarse TEOM filters should
be replaced when the filter loading percentage (displayed in the Main Screen) is between 60 and 75% or every 30 days, whichever occurs first.
Cleaning the sample inlet The sample inlet that is mounted on the tripod
should be cleaned each time the TEOM filters is replaced or every 30 days, whichever occurs first.

45 Quality Assurance Quality Control Plan For The Salton Sea Air Monitoring Network Original 01/27/2010
Cleaning the virtual impactor The virtual impactor should be cleaned every time the TEOM filter is replaced or every 30 days, whichever occurs first.
Replacing the in-line filters The PM2.5 and PMcoarse flow in-line filters and
the bypass in-line filter should be cleaned every 6 months or as necessary.
Cleaning the air inlet system The air inlet system inside the mass transducer
should be cleaned every 6 months or as necessary.
Rebuilding the sample pump The sample pump should be rebuild once
every 18 months, or as necessary. The pump rebuild kit (59-008630) contains instructions for rebuilding the pump.
6.1 Replacing the TEOM filters
As mentioned before, the 1405 TEOM filters for the PM2.5 and PMcoarse flows need to be changed whenever the loading percentage is between 60 and 75% or at least every 30 days to prevent the filter loading from affecting the flow. Both filters should always be changed at the same time and the Air Monitoring Technician must handle new TEOM filters with the filter exchange tool provided with the instrument. The TEOMS filters must never be handled with fingers. Is also important to note that if the filter loading percentage is higher than 30% (at a main flow rate of 3 l/min) after the new TEOM filter is placed on the mass transducer, or if the lifetime of consecutive TEOM filters becomes noticeably shorter, the Air Monitoring Technician might need to replace the in-line filter. The filters should also be stored inside the unit for easy access and to keep them dry and warm. The following 23 steps should be followed to ensure appropriate filter installation.
1. The Air Monitoring Technician must ensure that the filter exchange tool is clean and free of any contamination that might be transferred to the TEOM filter.
2. In the 1405-D TEOM Data screen, select the Service button to display the Service screen, and then the Maintenance button to display the Maintenance screen.
3. The Air Monitoring Technician must select the Replace TEOM Filters button to start the TEOM Filter Replacement Wizard and then select the Next > button to begin the procedure. Note, “Do Not” used the Advanced User Mode when changing the filters.
4. The Open Mass Transducer screen will display. Open the door of the sampler. 5. Pull the TEOM latch toward you to open the transducer latch. 6. With the mass transducer unlatched, swing the bottom of the mass transducer
downward, exposing the tapered elements (TE) and then press the Next > button.

46 Quality Assurance Quality Control Plan For The Salton Sea Air Monitoring Network Original 01/27/2010
7. When the “Remove Old Filters screen displays, carefully insert the lower forks of the filter exchange tool under one of the used TEOM filter so that the filter disk is between the fork and the upper tab of the filter exchange tool (See Figure 6.1.a). The tines of the fork should straddle the hub of the filter base.
Figure 6.1.a
FILTER REMOVAL
8. Gently pull straight up, lifting the TEOM filter from the TE. Do not twist or tilt the filter exchange tool from side-to-side while removing the filter from the TE. This will damage the TE.
9. Repeat the removal procedure for the second used TEOM filter. Then press the Next> button.
10. The Replace Filters screen will display. Pick up a new, conditioned TEOM filter from one of the filter holders with the filter exchange tool so that the filter disk lies between the fork and the upper tab of the tool and the hub of the filter lies between the tines of the fork. It is important to note that the TEOM filters must be preconditioned to avoid excessive moisture buildup prior to their use in the system. To precondition the TEOM filters, the Air Monitoring Technician must place two TEOM filters on the filter holders of the mass transducer and leave them there until is time to change the filters. When it is time to install a new TEOM filter, the Air Monitoring Technician can use a conditioned filter from one of the filter holders. Then the Air Monitoring Technician must replace the conditioned TEOM filter that was on the filter holder with a new filter. Extra filters should also be stored inside the station near the mass transducer to insure they are at or near the appropriate temperature and humidity level for sampling. Figure 6.1.b shows an image of the TEOM filters location.
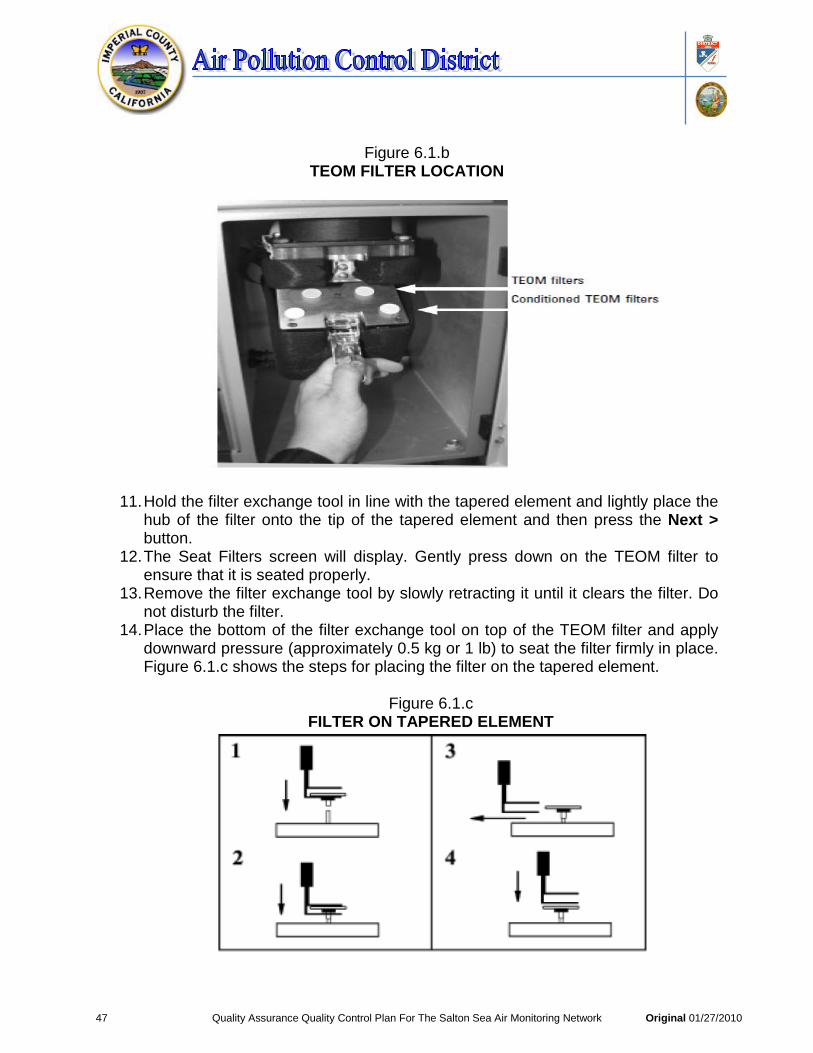
47 Quality Assurance Quality Control Plan For The Salton Sea Air Monitoring Network Original 01/27/2010
Figure 6.1.b TEOM FILTER LOCATION
11. Hold the filter exchange tool in line with the tapered element and lightly place the hub of the filter onto the tip of the tapered element and then press the Next > button.
12. The Seat Filters screen will display. Gently press down on the TEOM filter to ensure that it is seated properly.
13. Remove the filter exchange tool by slowly retracting it until it clears the filter. Do not disturb the filter.
14. Place the bottom of the filter exchange tool on top of the TEOM filter and apply downward pressure (approximately 0.5 kg or 1 lb) to seat the filter firmly in place. Figure 6.1.c shows the steps for placing the filter on the tapered element.
Figure 6.1.c
FILTER ON TAPERED ELEMENT

48 Quality Assurance Quality Control Plan For The Salton Sea Air Monitoring Network Original 01/27/2010
15. Repeat the installation procedure for the other new TEOM filter and then select the Next > button.
16. The Precondition Filters will display. This is when the Air Monitoring Technician needs to place new TEOM filters on the conditioning posts on the mass transducer. After placing the preconditioned filters press the Next > button.
17. The Close Instrument screen will display. Raise the mass transducer to the closed position and fasten the holding rod onto the latch plate.
18. Close and latch the door to the sensor unit. Keep the door open for as short a time as possible to minimize the temperature change in the system and then select the Next > button.
19. The system will automatically test the two newly installed TEOM filters to ensure they are firmly seated. The system will display a screen with the wait time.
20. If the system is unable to obtain a stable frequency for one or both of the filters, it will display a screen telling which filter (or filters) needs to be re-seated. Otherwise, the filter change is complete.
21. If the filters need to be re-seated, open the door to the sampler and the mass transducer and press straight down on the appropriate TEOM filter(s) with the bottom of the filter exchange tool. This ensures that the filters are properly seated. Close the mass transducer and sensor unit door and select the Next > button.
22. The system will again display the waiting screen while it is testing for stable frequencies. If it still cannot obtain a frequency for one or both of the filters, it will prompt the user to re-seat the filters a second time. If it still cannot obtain a stable frequency, the procedure will prompt to replace the filters or post a fail message. When the frequencies are stable, the system will display the Competing the TEOM Filter Replacement Wizard screen. Select the Finish> button to finalize the filter changing process.
6.2 Cleaning the Sample Inlet
The PM10 inlet should be cleaned every time the TEOM filter is changed or as necessary. To clean the unit you will need cotton swabs, a small soft-bristle brush, paper towels, distilled water, silicone-based stopcock grease, a small screwdriver, a small adjustable wrench and a pocket knife. The following 17 steps should be taken to properly clean the Sample Inlet.
1. Remove the rain jar from the inlet and the inlet from the sample tube. Unscrew the top acceleration assembly from the lower collector assembly. Figure 6.2.a provides an image of the rain jar, the inlet and the sample tube.
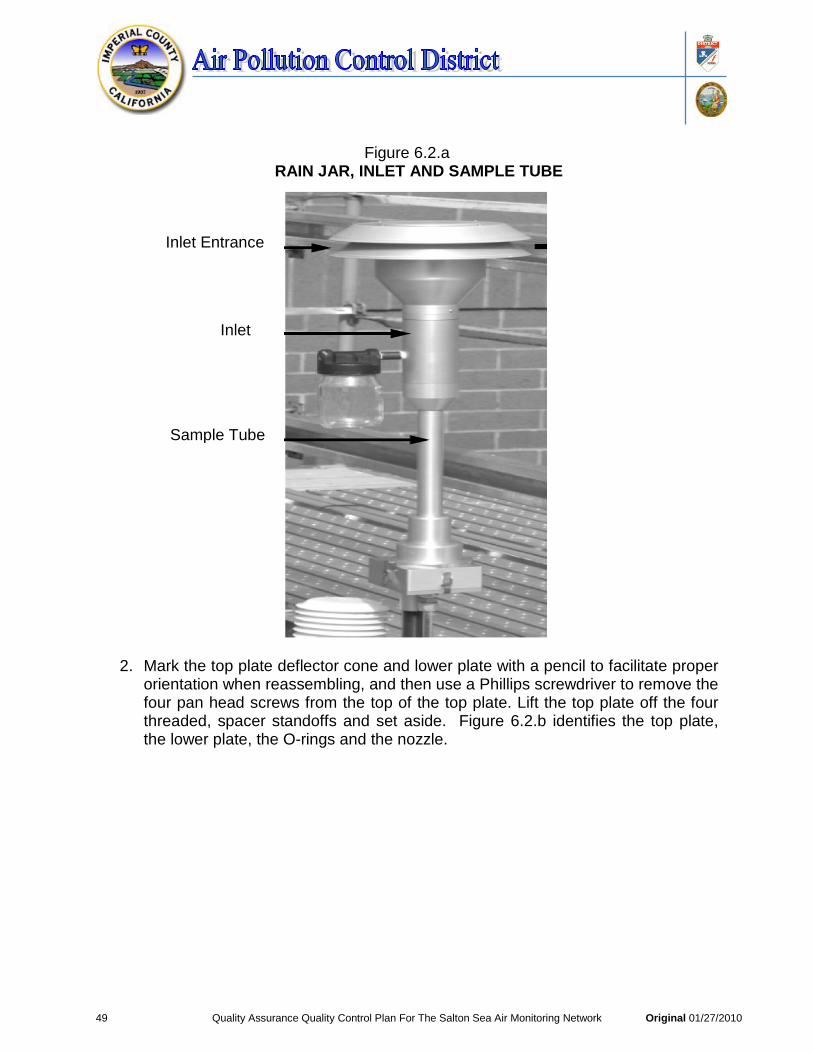
49 Quality Assurance Quality Control Plan For The Salton Sea Air Monitoring Network Original 01/27/2010
Figure 6.2.a RAIN JAR, INLET AND SAMPLE TUBE
2. Mark the top plate deflector cone and lower plate with a pencil to facilitate proper
orientation when reassembling, and then use a Phillips screwdriver to remove the four pan head screws from the top of the top plate. Lift the top plate off the four threaded, spacer standoffs and set aside. Figure 6.2.b identifies the top plate, the lower plate, the O-rings and the nozzle.
Sample Tube
Inlet
Inlet Entrance

50 Quality Assurance Quality Control Plan For The Salton Sea Air Monitoring Network Original 01/27/2010
Figure 6.2.b TOP PLATE, LOWER PLATE, O-RINGS AND NOZZLE
3. Clean the insect screen (with brush or water) then dry. 4. Using water and a Terry Cloth Towel, clean the deflector cone on the inside of
the top plate. An air dryer can also be used to dry the top plate. 5. Clean the internal wall surface of the acceleration assembly 6. Inspect the large diameter, impactor nozzle O-ring for damage or wear. Replace
it, if necessary. Apply a thin film of silicone grease to the O-ring. Also, apply a light coating of silicone grease to the aluminum threads of the upper acceleration assembly.
7. Using water and a Terry Cloth Towel, clean the collector assembly walls and plate. An air dryer can also be used to dry the collector assembly walls and plate. Note, most of the contamination in the inlet is usually found on the collector plate. Figure 6.2.c shows an image of the inside of the inlet collector.
Figure 6.2.c INSIDE OF THE INLET COLLECTOR

51 Quality Assurance Quality Control Plan For The Salton Sea Air Monitoring Network Original 01/27/2010
8. Clean the three vent tubes. You may need to use a cotton swab to clean these vent tubes.
9. Clean the bottom side of the collector assembly. Inspect the two inlet tube-sealing O-rings for damage wear. If necessary, replace the O-rings.
10. Clean the weep hole in the collector plate where the moisture runs out to the moisture trap.
11. Clean the rain jar. Inspect the rain jar cover’s brass nipple fitting to ensure that it is secure and free from blockages.
12. Apply a light coating of silicone grease to the O-rings to ensure that a seal is made when they are reinstalled on the flow splitter.
13. Clean the lower collector assembly’s threads to ensure a tight seal when the two halves are reassembled.
14. Reassemble the top and bottom inlet assemblies until the threats tighten. Hand-tighten only.
15. Reinstall the insect screen and align the top plate markings with the lower plate markings. Install the top plate onto the lower plate and tighten the four pan-head screws.
16. Place a light coating of silicone grease on the gasket inside the cap of the rain jar. This will ensure a leak-free fit. Reinstall the rain jar. Place the inlet on the flow splitter. Take care not to damage the internal O-rings.
6.3 Cleaning the Virtual Impactor
The tools and materials required for cleaning and maintaining the virtual impactor are: water, O-ring grease and a Phillips screwdriver. To clean and maintain the virtual impactor the Air Monitoring Technician must perform the following 9 steps.
1. Remove the inlet from the top of the system, and then remove the virtual impactor from the flow splitter coarse sample tube.
2. Remove the 1 1/4–inch sample tube that connects the inlet to the impactor. 3. Remove the four screws on each corner of the bottom section of the virtual
impactor. Separate its body from its base plate. 4. Remove the three screws that hold the top of the virtual impactor to the body.
Figure 6.3.a describes the different areas of the inlet assembly and virtual impactor.

52 Quality Assurance Quality Control Plan For The Salton Sea Air Monitoring Network Original 01/27/2010
Figure 6.3.a
INLET ASSEMBLY AND VIRTUAL IMPACTOR
5. Use water and mild detergent to wash the inside surfaces of the body, top and bottom sections of the impactor. A general-purpose cleaner can be used, if necessary.
6. Inspect all O-rings in each section of the virtual impactor for damage and replace them, if necessary. Apply a thin coating of O-ring lubricant onto the O-rings, if necessary.
7. Install the base to the body using the four screws that were removed in Step 3. 8. Install the top onto the body using the three screws that were removed in Step 4. 9. Install the adapter tube into the top of the virtual impactor, install the impactor on
the flow splitter, and install the inlet on the top of the adapter tube. Figure 6.3.b is an image depicting the different areas of the virtual impactor.

53 Quality Assurance Quality Control Plan For The Salton Sea Air Monitoring Network Original 01/27/2010
Figure 6.3.b AREAS OF THE VIRTUAL IMPACTOR
6.4 Replacing the In-Line Filters
The small PM2.5 and PMcoarse in-line filters and the large bypass flow filter should be changed every 6 months or as necessary. The three filters are located on the back of the unit (Figure 6.4.a). These filters prevent contamination from reaching the flow controllers. The large bypass filters should be changed immediately following one of the regularly-scheduled TEOM filter exchanges. This will provide enough time to exchange the in-line filters during the 30-minute flow and temperature stabilization period.
Figure 6.4.a LOCATION OF FILTERS
By-pass filter
PM2.5 Flow Filter PMcoarse Flow Filter

54 Quality Assurance Quality Control Plan For The Salton Sea Air Monitoring Network Original 01/27/2010
The Air Monitoring Technician must follow the next 10 steps to replace the in-line filters.
1. Unplug the sample pump. 2. Unscrew and remove the clear small filter covers for both the PM2.5 and
PMcoarse flow channels on the back of the unit. 3. Unscrew the filter mounts for both the PM2.5 and PMcoarse flow channels. 4. Slide the filter cartridges off the mounts and install new cartridges onto the
mounts. 5. Install the mounts into the unit, and then install the covers. 6. Unscrew and remove the large filter cover from the bypass flow channel on the
back of the unit. 7. Unscrew the filter mount for the bypass flow channel. 8. Slide the large filter cartridge off the mount and install a new cartridge onto the
mount. 9. Install the mount into the unit, and then install the cover for the bypass flow.
Plug in the sample pump and return to normal operation.
6.5 Cleaning the Air Inlet The heated air inlet in the TEOM must be cleaned once a year to remove the buildup of particulate matter on its inner walls. A tapered bristle brush is appropriate for cleaning the air inlet system. The Air Monitoring Technician will also need a piece of plastic or another protective material; soapy water, or diluted alcohol; a ½ inch (or adjustable) wrench and a soft brush to clean the air inlet. The next 12 steps for cleaning the air inlet must be followed at all times.
1. Turn off the TEOM unit. 2. Open the door of the unit and locate the thermistors in the top of the mass
transducer assembly (See figure 6.5.a).
Figure 6.5.a THERMISTORS
3. Using the ½ inch wrench, remove the thermistors from the top of the mass
transducer assembly. Note, the thermistors have short thread depths. Installation/removal should take 1 ½ to 2 ½ turns.
Thermistors

55 Quality Assurance Quality Control Plan For The Salton Sea Air Monitoring Network Original 01/27/2010
4. Open the mass transducer (refer to the Replacing the TEOM Filters section 6.1 for instructions on opening the mass transducer).
5. Place a piece of plastic or another protective material over the exposed TEOM filters.
6. Using soapy water or diluted alcohol, clean the entire air inlet (See figure 6.5.b). A soft brush may be used to remove particulate matter on the inside of the walls.
Figure 6.5.b AIR INLET
7. Allow the air inlet to dry. 8. Remove the protective material from the exposed TEOM filter. 9. Close the mass transducer and latch. 10. Install the air thermistors into the cap of the mass transducer assembly and
tighten lightly with the wrench. 11. Close and latch the door to the unit. Keep the door open for as short a time as
possible to minimize the temperature change in the system. 12. Turn on the TEOM 1405-D unit.
7. Audit/Calibration Procedures Air Monitoring Technicians will also have the responsibilities for auditing and calibrating the TEOM. Thermo Scientific recommends the following regular auditing and calibration procedures for the TEOM.
Nozzles

56 Quality Assurance Quality Control Plan For The Salton Sea Air Monitoring Network Original 01/27/2010
Ambient Temperature Audit/ calibrate the ambient temperature measurement once per month. The temperature must be calibrated before a flow calibration.
Ambient Pressure Audit/ calibrate the ambient pressure
measurement once per month. The pressure must be calibrated before a flow calibration.
Flow Audit/ calibrate the PM2.5, PMcoarse and
bypass flows once a month. Leak Check Perform a leak check once a month or
as necessary (refer to section 4.1 for leak check instructions).
Analogy Outputs Calibrate the analog output channels
once a year or as necessary, for example any time the voltage range setting is changed.
Mass transducer Audit the calibration of the mass
transducer once a year. The TEOM software allows users to step through the standard calibration and audit procedures. The Air Monitoring Technician must select the Service button to display the Service screen. Once in the Service screen, the Air Monitoring Technician can select the Verification or Calibration buttons to display the Verification and Calibration Screens. The Verification Screen will display four buttons which are the Instrument Audit button, the Flow Audit button, the Leak Check button or the Mass Transducer K0 Verification button. The Calibration Screen also displays four buttons, the Calibration Schedule button, the Ambient Calibration button, the Flow Calibration button and the Analog Output Calibration button. Auditing the System, Users can audit all of the instruments functions by selecting the Instrument Audit button found in the Verification screen. The Instrument Audit screen shows the temperatures, flow and other values that can be audited by the Air Monitoring Technician. Placing a temperature or barometer in the desired location, allows users to audit those values compared to an external measurement device. Flows can be individually audited for accuracy using the flow audit wizard.

57 Quality Assurance Quality Control Plan For The Salton Sea Air Monitoring Network Original 01/27/2010
7.1 Calibrating the Ambient Temperature
The following four steps should be taken to calibrate the unit’s ambient temperature. Note, the ambient air temperature calibration, pressure calibration and leak check (section 4.1) should be performed before executing the flow calibration procedure.
1. In the TEOM Data screen, select the Service button to display the Service screen, then select the Calibration button to display the Calibration screen.
2. Select the Ambient Calibration button to display the Ambient Calibration screen (See figure 7.1.a)
Figure 7.1.a
AMBIENT CALIBRATION SCREEN
3. Determine the current temperature (ºC) at the ambient temperature sensor using
an external thermometer, [ºC = 5/9 x (ºF-32]. 4. If the measured value is within ± 2º C of the temperature displayed in the
Ambient Temperature field button, no further action is necessary. The Air Monitoring Technician must select the < Back button to return to the Calibration screen. If the value is not within ± 2º C of the temperature displayed in the Ambient Temperature field button, select the Ambient Temperature button. A keypad will display. Enter the actual temperature as measured by the external thermometer and press the Enter button. The Ambient Temperature Calibration screen will display with the new entered value. Select the < Back button to return to the Calibration screen.

58 Quality Assurance Quality Control Plan For The Salton Sea Air Monitoring Network Original 01/27/2010
7.2 Calibrating the Ambient Pressure
The following four steps should be taken to calibrate the unit’s ambient temperatures. Note, the ambient air temperature calibration, pressure calibration and leak check (section 4.1) should be performed before executing the flow calibration procedure.
1. In the TEOM Data screen, select the Service button to display the Service screen, then select the Calibration button to display the Calibration screen.
2. Select the Ambient Calibration button to display the Ambient Calibration screen (See figure 7.1.a)
3. Determine the current ambient pressure in atmospheres (absolute pressure, not corrected to sea level). If the measured value is within ± 0.01 atm of the pressure displayed in the Ambient Pressure button, no further action is necessary. Select the < Back button to return to the Calibration screen. If the value is not within ± 0.01 atm of the pressure displayed in the Ambient Pressure button, select the Ambient Pressure button. A keypad will display. Enter the actual pressure as measured by the external device and press the Enter button. The Ambient Pressure Calibration screen will display with the new entered value. Select the < Back button to return to the Calibration screen.
7.3 Flow Rates
(A) Auditing Flow Rates
To properly audit the PM2.5, PMcourse or bypass flow, the Air Monitoring Technician must follow the nine steps below.
1. In the TEOM Data screen, select the Service button to display the Service screen, and then select the Verification button to display the Verification screen.
2. Select the Flow Audit button to begin the Flow Audit Wizard and press the Next > button.
3. The Select a Flow Audit Device screen will display. Select a flow audit device. Select “Direct Flow Device” to audit the flow using a direct flow measuring device (reading “l/min” adjusted for temperature and pressure) such as the Streamline Pro Multical. Select “FTS” to audit the flow using the FTS system. FTS users will enter the device calibration constant and the change in pressure from the FTS. Select the “Next >” button.
4. The Select Flow to Audit screen will display. Select which flow to audit. Press the “Next >” button.
5. The connect Flow Audit Device screen will display. Attach a flow meter to the appropriate flow channel: a. To Audit the PM2.5 flow channel, remove the inlet, inlet tube and virtual
impactor and attach the 1 1/4-inch flow adapter/meter to the top of the flow

59 Quality Assurance Quality Control Plan For The Salton Sea Air Monitoring Network Original 01/27/2010
splitter (See figure 7.3.a). Disconnect the bypass line from the side of the flow splitter (don’t let if fall to the ground) and cap the bypass fitting with the 3/8-inch Swagelok cap provided with the system (See figure 7.3.b.)
Figure 7.3.a Figure 7.3.b FLOW SPLITTER BYPASS CAP
b. To audit the PMcoarse flow channel, remove the inlet, inlet tube and virtual impactor and connect the 1/2-inch Swagelok flow audit adapter to the top of the ½ inch coarse flow inlet. Connect the flow meter/adapter to the flow audit adapter (See figure 7.3.c.).
Figure 7.3.c
TOTAL FLOW AUDIT SYSTEM
c. To audit the bypass flow channel, remove the bypass line from the flow
splitter and connect the 3/8-inch flow adapter to the green tubing of the bypass line. Connect the flow meter/adapter to the flow audit adapter.
1/2 –inch flow adapter

60 Quality Assurance Quality Control Plan For The Salton Sea Air Monitoring Network Original 01/27/2010
When the flow meter is attached, select the Next > button.
6. The Measure Flow screen will display. Allow the flow to stabilize. When the flow is stable, press the flow button and enter the reading from the flow device. Select the Next > button.
7. The Flow Audit Results screen will display the difference between the flow rate of the instrument and the flow rate on the measurement device. If the difference is less than 10 percent, you may adjust the flow rate to reflect the value on the audit device. Select the Yes button to adjust the flow based on the results of the flow audit. Select the No button to leave the original flow settings in place. Select the Next > button to return to the Select Flow screen and audit another flow channel.
8. The Select Flow to Audit screen will display again. The flow channel that was just audited will be “grayed out” on the screen to show it was audited during this session. If you want to audit another flow channel, select another channel and follow steps 3-8 (and the wizard) to complete additional flow channels. Otherwise, ensure that no flow channel buttons are selected, and select the Next > button. Note, if the difference is more than 10 percent, the flow will fail the audit and the unit requires a leak check/flow calibration.
The Competing the Flow Audit Wizard screen will display. Remove the flow meter and flow adapter(s) and install the virtual impactor, inlet tube and inlet. Ensure all lines, including the bypass, are reconnected. Select the Finish button to exit the wizard and return to the Verification, or select the < Back button to move backward one step in the procedure.
(B) Calibrating the Flow Rates It is important to perform the ambient air temperature calibration, pressure calibration and leak check before executing the flow calibration procedure. To calibrate (or audit) the PM2.5, PMcoarse and bypass flows, you will need a 1 ¼-inch flow adapter, a ½ -inch Swagelok flow adapter, a 3/8-inch Swagelok flow adapter and a flow measurement device. The reference flow meter, such as a bubble meter, dry gas meter, or mass flow meter should have been recently calibrated to a primary standard, and should have an accuracy of ±1% at 3 l/min and 16.67 l/min, and a pressure drop of less than 0.07 bar (1 psi). If you are using a mass flow meter, you must make any necessary corrections to translate this reading to volumetric 1/min at the current ambient temperature and barometric pressure. No adjustment is necessary in the case of a volumetric flow meter. Thermo Scientific offers the Streamline Pro Multi-Cal system (57-009997) to measure volumetric flow measurements.

61 Quality Assurance Quality Control Plan For The Salton Sea Air Monitoring Network Original 01/27/2010
Note, to audit the total flow, you will need a 1 ¼-inch flow adapter. Remove the inlet and attach the flow adapter and meter to the top of the inlet tube (See figure 7.3.d)
Figure 7.3.d TOTAL FLOW AUDIT SYSTEM
The Air Monitoring Technician must follow the next 10 steps to calibrate the fine, course or bypass flow:
1. In the TEOM Data screen, select the Service button to display the Service screen, and then select the Calibration button to display the Calibration screen.
2. Select the Flow Calibration button to start the Flow Calibration Wizard. Select the Next > button to begin the procedure.
3. The Select a Flow Calibration screen will display. Select a flow audit device. Select “Direct Flow Device” to audit the flow using a direct flow measuring device (reading “l/min” adjusted for temperature and pressure) such as the Streamline Pro. Select “FTS” to audit the flow using the FTS system. FTS users will enter the device calibration constant and the change in pressure from the FTS. Select the “Next >” button.
4. The Select Flow to Calibrate screen will display. Select the Calibrate PM2.5 Flow, Calibrate PMcoarse Flow or Calibrate Bypass Flow button to calibrate the selected flow. Select the Next > button.

62 Quality Assurance Quality Control Plan For The Salton Sea Air Monitoring Network Original 01/27/2010
5. The wizard will prompt you to attach a flow meter to the appropriate flow channel: a. To Calibrate the PM2.5 flow channel, remove the inlet, inlet tube and virtual
impactor and attach the 1 1/4-inch flow adapter/meter to the top of the flow splitter (See figure 7.3.a). Disconnect the bypass line from the side of the flow splitter (don’t let if fall to the ground) and cap the bypass fitting with the 3/8-inch Swagelok cap provided with the system (See figure 7.3.b.).
b. To calibrate the PMcoarse flow channel, remove the inlet, inlet tube and virtual impactor and connect the 1/2-inch Swagelok flow audit adapter to the top of the ½-inch coarse flow inlet. Connect the flow meter/adapter to the flow audit adapter (See figure 7.3.c.).
c. To calibrate the bypass flow channel, remove the bypass line from the flow splitter and connect the 3/8-inch flow adapter to the green tubing of the bypass line. Connect the flow meter/adapter to the flow audit adapter.
When the flow audit device is attached to the correct channel, select the Next> button.
6. The wizard will display a screen that shows the current low-setpoint flow rate (as measured by the flow meter) in the TEOM flow rate: button. Allow the flow to stabilize. Select the TEOM flow rate: button and enter the current flow rate (to two decimal places) as measured by the flow meter into the number pad and select the Enter button. The newly entered flow rate will display in the TEOM flow rate: button. Select the Next > button.
7. The wizard will display a screen that shows the current high-setpoint flow rate (as measured by the instrument) in the TEOM flow rate: button. Allow the flow to stabilize. Select the TEOM flow rate: button and enter the current flow rate (to two decimal places) as measured by the flow meter into the number pad and select the Enter button. The newly entered flow rate will display in the TEOM flow rate: button. Select the Next > button.
8. The wizard will display a screen that shows the current setpoint flow rate (as measured by the instrument) in the TEOM flow rate: button. Allow the flow to stabilize. Select the TEOM flow rate: button and enter the current flow rate (to two decimal places) as measured by the flow meter into the number pad and select the Enter button. The newly entered flow rate will display in the TEOM flow rate: button. Select the Next > button.
9. After the third flow value has been entered, the Select Flow to Calibrate screen will display again. The flow channel that was just calibrated will be “grayed out” on the screen to show it was calibrated during this calibration session. If you want to calibrate another flow channel, select another channel and follow steps 4-9 (and the wizard) to complete additional flow channels. Otherwise, ensure that no flow channel buttons are selected, and select the Next> button. The Completing the Flow Calibration Wizard screen will display in the screen. Remove the flow meter and flow adapter(s) and install the virtual impactor, inlet tube and inlet. Ensure all lines, including the bypass, are reconnected. Select the Finish button to exit the wizard and return to the Calibration screen or select the < Back button to move backward one step in the procedure.

63 Quality Assurance Quality Control Plan For The Salton Sea Air Monitoring Network Original 01/27/2010
7.4 Performing a Leak Check
A leak check should be performed once a month or as necessary. Refer to section 4.1 for leak check instructions.
7.5 Calibrating the Analog Outputs The Analog Output Calibration Wizard allows users to calibrate the eight analog output channels to either 0-1 VDC or 0-5 VDC. Note, always wear appropriate anti-static devices when working with the system electronics To calibrate the analog outputs the Air Monitoring Technician must conduct the following twelve steps.
1. Attach an antistatic wrist strap to your wrist. Attach the other end of the wrist strap to the chassis of the control unit to discharge any static electricity while working on the unit.
2. Open the door to the unit (Figure 7.5.a) and locate the interface board mounted to the bottom of the unit.
Figure 7.5.a UNIT DOOR
3. Locate the analog outputs jumpers and test points located at the front of the board and ensure that the jumper for the channel you are calibrating is set to the correct voltage limit (See figure 7.5.b and 7.5.c)
Interface board

64 Quality Assurance Quality Control Plan For The Salton Sea Air Monitoring Network Original 01/27/2010
Figure 7.5.b JUMPER, TEST POINT AND LABEL
Jumper Test Point Label
Ground Test Point
Figure 7.5.c D/A OUTPUT JUMPERS
Setting Guide
4. In the 1405 Data screen, select the Service button to display the Service screen, and then select the Calibration button to display the Calibration screen.
5. Select the Analog Output Calibration button to start the Analog Output Calibration Wizard. Select the Next > button to begin the procedure.

65 Quality Assurance Quality Control Plan For The Salton Sea Air Monitoring Network Original 01/27/2010
6. The Select Channel to Calibrate screen will display. Select which analog output channel you want to calibrate. Select the Next > button.
7. The Select Analog Output Range screen will display. Set the voltage range for the analog output. Select the Next > button.
8. The Connect Meter screen will display. Locate the test point for the analog output being calibrated and attach a voltmeter set to VDC to the test point and to the ground test point on the board. Select the Next> button.
9. The Measure Low Setting screen will display. Compare the reading on the volt meter to the reading on the screen. If the readings are different, select the Current reading: button to display the number keypad and enter the current reading, and press the Enter button. Select the Next > button.
10. The Measure High Setting screen will display. Compare the reading on the volt meter to the reading on the screen. If the readings are different, select the Current reading: button to display the number keypad and enter the current reading, and press the Enter button. Select the Next > button.
11. The Select Channel to Calibrate screen will display again. The channel that was just calibrated will be “grayed out” on the screen to show it was calibrated during this calibration session. If you want to calibrate another analog output channel, select another channel then the Next > button and follow steps 1-9 (and the wizard) to complete additional channels. Otherwise, ensure that no Analog Output Channel buttons are selected, and select the Next > button.
12. The Completing the Analog Output Calibration Wizard screen will display. Select the Finish button to exit the wizard and return to the Verification & Calibration screen, or select the < Back button to move backward one step in the procedure.
7.6 Mass Transducer The calibration of the mass transducer in the TEOM Monitor is determined by the mass transducer’s physical mechanical properties. Under normal circumstances, the calibration does not change materially over the life of the instrument. Contact Thermo Scientific if the result of the verification procedure fails. You can locate the original calibration constant on the “Instrument Checkout Record” or the “Final Test Record” documents that are shipped from the factory with the instrument. To audit/verify the K0 numbers requires a mass calibration verification kit (59-002107), which includes a pre-weighed filter, a filter exchange tool, desiccant and a humidity indicator, and the pre-filter tubing that was supplied with the unit. To confirm the system’s K0 calibration, the Air Monitoring Technician must follow the next fifteen steps.
1. Confirm that the PM2.5 and PMcoarse K0 numbers entered into the instrument and the PM2.5 and PMcoarse K0 numbers on the plates on the mass transducer are the same. The K0 numbers entered into the unit can be found in the Audit screen.
2. Ensure the instrument is at the normal operating temperature and condition.

66 Quality Assurance Quality Control Plan For The Salton Sea Air Monitoring Network Original 01/27/2010
3. Ensure that the pre-weighed filter in the kit matches the humidity conditions for the test, as shown on the card provided with the kit. Note, if the filter does not match the conditions listed on the humidity indicator, follow the instructions provided with the kit to dry the filter to an acceptable level.
4. In the TEOM Data screen, select the Service button to display the Service screen, and then select the Calibration button to display the Calibration screen.
5. Select the Mass Transducer K0 Verification button to start the K0 Verification Wizard. Select the Next > button to begin the procedure.
6. The Select TEOM screen will display. Select the channel (PM2.5 or PMcoarse) for which the K0 number will be verified. Select the Next > button.
7. The Install Pre-Filter screen will display. Remove the inlet and install the flow audit adapter onto the sample inlet tube, then install the pre-filter assembly (the filter and short length of silicone tubing) onto the flow audit adapter, see Figure 7.6.a). Select the Next > button.
Figure 7.6.a INLET AND INLET SAMPLE TUBE
8. The Remove Sample Filter screen will display. Open the mass transducer and remove the standard TEOM filter from the PM2.5 (left) side of the mass transducer. Close the mass transducer (without installing another filter). Select the Next > button.

67 Quality Assurance Quality Control Plan For The Salton Sea Air Monitoring Network Original 01/27/2010
Note, DO NOT use the calibration filter exchange tool for installing or removing ANY filter other than the pre-weighed calibration filter.
9. The Stabilizing screen will display. While the instrument waits to measure the
frequency of the system with no TEOM filter installed, a countdown timer on the screen will show the progress of the stabilization step. When the stabilization “Complete” message displays, select the Next > button.
10. The Enter Filter Weight screen will display. Select the Filter Weight: button. The keypad will display. Enter the weight of the pre-weighed filter into the system and press the Enter button to save the value and exit the keypad. Select the Next > button.
11. The Install Calibration Filter screen will display. Correctly install and properly seat the pre-weighed calibration/verification filter onto the PM-2.5 (left) side of the mass transducer using the calibration filter exchange tool. (Follow the instructions for changing a filter earlier in section 6.1) Select the Next > button.
12. The Stabilizing screen will display while the instrument waits for the frequency of the TEOM calibration filter. A countdown timer on the screen will show the progress of the stabilization step. When the stabilization “Complete” message displays, select the Next > button.
13. The Replace Sample Filter screen will display. Remove the calibration filter with the calibration filter removal tool. Correctly install and properly seat a new TEOM filter onto the PM2.5 (left) side of the mass transducer using the regular filter exchange tool. (Follow the instructions for changing a filter in section 6,1section.) Select the Next > button. Note, if the frequency doesn’t stabilize, the wizard will display a screen with instructions to re-seat the filter. Re-seat the filter and select the Next > button. The Stabilizing screen will display. If the unit is unable to find a stable frequency the second time, the unit will fail the K0 audit.
14. The Select TEOM screen will display again. The channel that was just verified
will be “grayed out” on the screen to show it was verified during this verification session. If you want to verify the other TEOM K0 number, select the other K0 channel and then the Next > button. Follow steps 6-14 (and the wizard) to complete the other K0 verification. Otherwise, ensure that no K0 buttons are selected, and select the Next > button.
15. When the final verification has been performed, the Competing the K0 Verification Wizard screen will display. The screen will display either a pass or a fail message for each K0 number. Select the Finish button. Note, if one or both of the K0 verifications fail, repeat the procedure for that K0 number. If the verification fails again, contact Thermo Scientific.
68 Quality Assurance Quality Control Plan For The Salton Sea Air Monitoring Network Original 01/27/2010
8. TEOM 1405-D Quality Control Maintenance Checks
Detailed directions of routine maintenance procedures are described in Section 6 and 7 of this plan and in section 5 of the Thermo Fisher Manual. Based upon the manufacturer’s procedures and U.S. EPA requirements, the monthly quality control checksheet shown in Table 8.1 has been developed to alert the operator that maintenance is due and to provide a record of quality control actions. 8.1 Daily Checks
On a daily basis, the TEOM’s filter loading percentage should be checked by viewing the filter Data Screen. If the filter loading percentage is between 60 and 75%, the TEOM filters must be replaced. The system status should also be checked to ensure the instrument is working properly. The findings should be recorded in the Salton Sea Daily Data Tracking Sheet.
8.2 Weekly Check
On a weekly basis, record the values found on the Main Screen of the TEOM’s digital display onto the monthly quality control maintenance checksheet.
8.3 Monthly Check
On a monthly basis, the following maintenance procedures must be conducted:
1. Conduct a flow check 2. Record the results of the flow check and the ambient temperature and pressure settings onto the monthly quality control maintenance checksheet. 3. Perform a flow calibration. 4. Perform a leak check 5. Audit and if necessary calibrate the ambient temperature. 6. Calibrate the ambient pressure. 7. Clean the Sample Inlet. 8. Clean the Virtual Impactor. 9. The Rain Jar should be inspected and cleaned.
8.4 Semiannual Check
Every six months perform the following:
1. Replace the large by-pass filters 2. Replace the small PM2.5 and PMcoarse flow In-line filters. 3. Replace the PM10 Inlet O-rings, the Collector Assembly O-rings and the Virtual Impactor O-rings.
69 Quality Assurance Quality Control Plan For The Salton Sea Air Monitoring Network Original 01/27/2010
8.5 Annual Check Once per year perform the following: 1. Clean the air inlet system. 2. Calibrate the Analog Outputs. 3. Audit the Mass Transducer
4. Rebuild the Sample Pump (Every 18 months)

70 Quality Assurance Quality Control Plan For The Salton Sea Air Monitoring Network Original 01/27/2010
TABLE 8.1 IMPERIAL COUNTY AIR POLLUTION CONTROL DISTRICT
MONTHLY QUALITY CONTROL MAINTENANCE CHECKSHEET TEOM 1405-D
Station Name:_________________________ Month/Year:__________________________ Station Number:_______________________ Time:________________________________ Property Number:______________________ Technician:___________________________
Weekly Checks FUNCTION DIGITAL DISPLAY READINGS
Date Checked Operation Mode Status Condition Filter Loading %
PM2.5 Concentration PM Coarse Concentration
PM10 Concentration Data Logger Reading
Case Temperature Cap Temperature
PM2.5 Air Temperature PM Coarse Air Temperature
Enclosure Temperature PM2.5 Flow Rate Coarse Flow Rate Bypass Flow Rate
Frequency Noise
MONTHLY PRECISION CHECKS
Date Total Flow PM2.5 Flow PM Coarse Flow Average
Press/Temp Setting
Indicated LPM % Diff From 16.67
Indicated LPM
% Diff From 3.0
Indicated LPM
% Diff From 1.67
Press Temp
Daily Check: Check Status Conditions and the Filters Load Percentage and recorded in
Daily Data Tracking Sheet. Change Filters when loading % is between 60 and 75%.
Weekly Check: Record values of TEOM's digital display.
Monthly Check: (1)Conduct a Flow Check. (2) Record the results of flow check, average pressure and
temperature settings. If percent difference of flow rate is ± 5.0% notify supervisor.
(3) If instructed, conduct a flow calibration. (4) Perform a Leak Check. (5) Audit and if
necessary calibrate the Ambient Temperature. (6) Audit and if necessary calibrate the
Ambient Pressure. (7) Clean the Sample Inlet. (8) Clean the Virtual Impactor. Inspect and clean the Rain Jar Cap.
Every 6 months: (1) Replace the large by-pass filters. (2) Replace the small PM2.5 and Pmcoarse flow
Annual Check:
in-line filters. (3) Replace the PM10 Inlet O-rings, the Collector Assembly O-rings and the Virtual Impactor O-rings. (1) Clean the air inlet system. (2) Calibrate the Analog Outputs. (3) Audit and if necessary the Mass Transducer.
COMMENTS OR MAINTENANCE PERFOMED DATE

71 Quality Assurance Quality Control Plan For The Salton Sea Air Monitoring Network Original 01/27/2010
9. Meteorological Instruments Maintenance Procedures There are a total of seven (7) types of meteorological instruments that will be in operation as part of the Salton Sea Air Quality Monitoring Network. Some stations will operate more meteorological instruments than others. A description of each meteorological instrument and its required maintenance (if necessary) is discussed in the sections below. Table 9.1 describes what types of meteorological instruments will be operated at each station.
Table 9.1
Met Instrument
Torrez-Martinez
SSRA Headquarters
Bombay Beach
Sonny Bono
Refuge
Naval Test Site
Salton City Total
Manufacturer / Model
Sonic Anemometer 1 1 1 1 1 1 6 RM Young Model 8100
Gill 3-Cup Anemometer 3 3 3 0 3 3 15 RM Young Model 12102
Platinum Temperature
Probe 2 2 2 2 2 2 12 RM Young Model 41342VF
Aspirated Radiation Shield 2 2 2 2 2 2 12 RM Young Model 43502
Relative Humidity/
Temperature Probe 1 1 1 1 1 1 6 RM Young Model 41382VF
Multi-Plate Radiation Shield 1 1 1 1 1 1 6 RM Young Model 41003
Net Radiometer 1 1 1 1 1 1 6 Met One Model 097
9.1 Sonic Anemometer – RM Young Model 8100
The Young Model 8100 measures three-dimensional wind velocity based on the transit time of ultrasonic signals. From speed of sound, sonic temperature is derived. Speed of sound and sonic temperature are corrected for crosswind effects. Operational Requirements: The instrument will be shipped to the manufacturer when an irregular drift is noticed. Instrument audits will be performed once a year by CARB MLD staff. No maintenance is required for this unit. For performance specifications and suggested data screening methodology please refer to Table 10 – Meteorological Instruments and Maintenance Requirements.

72 Quality Assurance Quality Control Plan For The Salton Sea Air Monitoring Network Original 01/27/2010
9.2 Gill 3-Cup Anemometer – Model 12101
The Gill 3-Cup Anemometer measures horizontal wind direction and speed. This instrument has light-weight hemispherical cups made from injection molded UV resistant polypropylene. Operational Requirements: The instrument requires routine calibrations every six months. Instrument audits will be performed once a year by CARB MLD staff. As part of regular maintenance the ball bearings, potentiometer and tach-generator should all be inspected every six months and replaced if necessary. For performance specifications and suggested data screening methodology please refer to Table 10 – Meteorological Instruments and Maintenance Requirements.
9.3 Platinum Temperature Probe – Model 41342VF
The 41342 Platinum Temperature Probe is an accurate 1000 ohm Platinum RTD temperature sensor mounted in a weatherproof junction box. Operational Requirements: The instrument requires routine calibrations every six months by using normal bath calibration methods. For performance specifications and suggested data screening methodology please refer to Table 10 – Meteorological Instruments and Maintenance Requirements.
9.4 Aspirated Radiation Shield – RM Young Model 43502 procurement
The 43502 Aspirated Radiation Shield provides accurate ambient air temperature measurements. Radiation errors are less than 0.2ºC RMS with the shield exposed to solar radiation of 1000 W/m2. The triple wall shield employs three concentric downward facing intake tubes and a canopy shade to isolate the temperature sensor from direct and indirect radiation. The temperature sensor mounts vertically in the center of the intake tubes. Operational Requirements: No calibrations are necessary for this instrument. Instrument audits will be performed once a year by CARB MLD staff. In terms of maintenance only the blower will require replacement and the shield will require cleaning. When replacing the blower, the Air Monitoring Technician should remove the printed circuit card from the blower cover and unsolder the blower leads. Loosen the two screws inside the blower cover which secure the inside chamber and blower to the outside cover. Install the replacement blower in the exact same orientation (with the blower exhaust opposite the printed circuit card). Re-solder the blower leads to the printed circuit card. Make sure to observe correct polarity when reconnecting the blower leads (red – POS, black – NEG, blue/white – TACH). The shield should also be cleaned every three months to maintain optimum performance. This can be done by washing it through the inside and out with mild soap and warm water. It is also important to check the mounting bolts and cable clamps periodically to ensure they are not loose due to vibration. For performance specifications please refer to Table 10 – Meteorological Instruments and Maintenance Requirements. The instrument will not generate data therefore there is no need for data screening.

73 Quality Assurance Quality Control Plan For The Salton Sea Air Monitoring Network Original 01/27/2010
9.5 Relative Humidity / Temperature Probe – RM Young Model 41382VF
The 41382VF probe combines a high accuracy, capacitance type humidity sensor and precision Platinum RTD temperature sensor in one probe. Operational Requirements: The instrument should be inspected every three months and recalibrated if necessary; otherwise, it should be recalibrated every six months. Instrument audits will be performed by CARB MLD staff once a year. In terms of maintenance, the RH sensor protective filter should be cleaned every three months by soaking in clean water or a mild soap solution. For performance specifications and suggested data screening methodology please refer to Table 10 – Meteorological Instruments and Maintenance Requirements.
9.6 Multi-Plate Radiation Shield- RM Young Model 41003
The Multi-Plate Radiation Shield protects temperature and relative humidity sensors from error-producing solar radiation and precipitation. This shield relies on a combination of plate geometry, material and natural ventilation to provide effective shielding. Operational Requirements: No calibrations are necessary for this instrument. Audits will be performed once a year by CARB MLD staff. In terms of maintenance, dirt or dust accumulated on the plates and brackets should be cleaned periodically with soap and water. For performance specifications please refer to Table 10 – Meteorological Instruments and Maintenance Requirements. The instrument will not generate data therefore there is no need for data screening. 9.7 Net Radiometer – MetOne Model 097 The Model 097 Net Radiometer is a high output device designed to measure the sum of all incoming radiation less the outgoing radiation. This is the energy retained by the surface for heating soil and air, plant growth and water evaporation. Incoming radiation consists of direct beam and diffuse of solar radiation and long-wave sky radiation. Outgoing radiation is the reflected radiation and terrestrial long-wave radiation. Operational Requirements: To calibrate the net radiometer the Air Monitoring Technician will be temporary attaching a spare radiometer on the same crossarm and use a multimeter to check the output of both radiometers for precision. Audits will be performed once a year by CARB MLD staff. In terms of maintenance, every two weeks the windshields and the mounting rings should be cleaned. Every month the Silica gel should be inspected to ensure is dry. Every three months the windshields should be replaced. For performance specifications please refer to Table 10 – Meteorological Instruments and Maintenance Requirements. The instrument will not generate data therefore there is no need for data screening.

74 Quality Assurance Quality Control Plan For The Salton Sea Air Monitoring Network Original 01/27/2010
REFERENCES
EPA, 2000. Meteorological Monitoring Guidance for Regulatory Modeling Applications. EPA-454/R-99-005
EPA, 2002. Guidance for Quality Assurance Project Plans. Final. EPA QA/G-5. December.
EPA, 2005. Technical Assistance Document (TAD) for Precursor Gas Measurements in
NCore Multi-pollutant Monitoring Network. Version 4. EPA-454/R-05-003. September.
EPA, 2007. Guideline on the Meaning and the Use of Precision and Bias Data Required
by 40 CFR Part 58 Appendix A. Final Draft. EPA-454/B-07-001. January. EPA, 2008. Quality Assurance Handbook for Air Pollution Measurement Systems,
Volume II, Ambient Air Quality Monitoring Program. EPA-454/B-08-003. December
California Air Resources Board, 1995. Air Monitoring Quality Assurance Volume II
Standard Operation Procedure For Air Quality Monitoring, Appendix Z.1.0, Station Operator’s Procedures For The Rupprecht & Patashnick Series 1400a TEOM PM10 Monitor.
California Air Resources Board, 1995. Air Monitoring Quality Assurance Volume II Standard Operation Procedures For Air Quality Monitoring, Appendix T, Meteorological Parameter Procedures For Wind Speed Sensors.
Code of Federal Regulations, 2009. Title 40: Protection of Environment, Part 50 – National Primary and Secondary Ambient Air Quality Standards; Appendix J To Part 50
Code of Federal Regulations, 2009. Title 40: Protection of Environment, Part 58 – Ambient Air Quality Surveillance; Appendix A to Part 58
EPA, 2008. Quality Assurance Handbook for Air Pollution Measurement Systems: Volume IV: Meteorological Measurements, Version 2.0 (FINAL). EPA-454/B-08-002
Met One Instruments, Model 097 Net Radiometer, Operation Manual Document No. 097-9800
R.M. Young Company, 1990. MODEL 43502 Compact Aspirated Radiation Shield, Manual PN 43502-90

75 Quality Assurance Quality Control Plan For The Salton Sea Air Monitoring Network Original 01/27/2010
R.M. Young Company, 1994. MODEL 12102 Gill 3-Cup Anemometer, Manual PN 12002-12005-90
R.M. Young Company, 1997. MODEL 41342 Platinum Temperature Probe, Instruction Sheet 41342-90
R.M. Young Company, 2001. MODEL 81000 Ultrasonic Anemometer, Manual PN 81000-90.
R.M. Young Company, 2003. MODEL41003 Multi-Plate Radiation Shield, Manual PN 41003-90
R.M Young Company, 2004. MODEL 41382VF Relative Humidity/Temperature Probe, Manual
Thermo Fisher Scientific, 2007. TEOM 1405-D: Dichotomous Ambient Particulate Monitor. 42-010977, Revision A.000, 15Feb2008

76 Quality Assurance Quality Control Plan For The Salton Sea Air Monitoring Network Original 01/27/2010
SALTON SEA AIR QUALITY MONITORING NETWORK
EMERGENCY CONTACTS
Immediate Emergency – Ambulance/Fire/Police: 911 Imperial County Sherriff Department - Dispatch/Communications: (760) 339-6312 Imperial County Fire Department - Fire Administration: (760) 482-2420 Pioneers Memorial Hospital (Brawley, CA) - Main Number: 760-351-3333 John F. Kennedy Memorial Hospital (Indio, CA) - Main Number: 760-347-6191 NON-EMERGENCY CONTACTS
AMERICAN ECOTECH: Rhys Evans, Technical Manager Office: (401) 247-0100 Cell: (401) 569-0399 Seth Cloran, Senior Instrument Specialist Office: (513) 541-0151 Cell: (513) 405-6058 CALIFORNIA AIR RESOURCES BOARD – CALEXICO STATIONS: Tony Royer, Site Technician Office: (760) 768-0132 IMPERIAL COUNTY AIR POLLUTION CONTROL DISTRICT: Main Office: (760) 482-4606 SALTON CITY WASTEWATER TREATMENT FACILITY: Rosa Mesoraca-Reagles, Salton Community Services District Asst. Manager Office: (760) 394-4446 Ken Andrews, Maintenance Superintendent Cell: (760) 587-6422
77 Quality Assurance Quality Control Plan For The Salton Sea Air Monitoring Network Original 01/27/2010
NON-EMERGENCY CONTACTS - Continued SALTON SEA RECREATION AREA: Kathy Dice, Superintendent Office: (760) 393-2460 Cell: (619) 985-7167 Isreal Alejo, On-site Maintenance Worker Office: (760) 393-3852 Cell: (760) 469-6538 SONNY BONO WILDLIFE REFUGE: Chris Shoneman, Project Manager Office: (760) 348-5278 x227 Cell: (760) 336-1816 SOUTH COAST AIR QUALITY MANAGEMENT DISTRICT: Philip Fine, Atmospheric Measurements Manager Office: (909) 396-4178 TORRES MARTINEZ DESERT CAHUILLA INDIANS: Debi Livesay, Water Resources Manager Office: (760) 397-0300 x1235 Cell: (760) 578-6574 Jonathan Chapmen, AQ Monitoring Technician Office: (760) 397-0300 x1224 Cell: (760) 880-7011