qos-b p e of channel -aware /qos-aware …airccj.org/cscp/vol5/csit53805.pdf · ·...
TRANSCRIPT
Jan Zizka et al. (Eds) : DBDM, CICS, CCNET, CSIP - 2015
pp. 49–65, 2015. © CS & IT-CSCP 2015 DOI : 10.5121/csit.2015.50705
QOS-BASED PERFORMANCE EVALUATION
OF CHANNEL-AWARE/QOS-AWARE
SCHEDULING ALGORITHMS FOR VIDEO-
APPLICATIONS OVER LTE/LTE-A
Najem N. Sirhan, Gregory L. Heileman, Christopher C. Lamb, Ricardo
Piro-Rael
Electrical and Computer Engineering Department,
University of New Mexico, Albuquerque, New Mexico, USA [email protected] [email protected] [email protected]
ABSTRACT
Long Term Evolution (LTE) is defined by the Third Generation Partnership Project (3GPP)
standards as Release 8/9. The LTE supports at max 20 MHz channel bandwidth for a carrier.
The number of LTE users and their applications are increasing, which increases the demand on
the system BW. A new feature of the LTE-Advanced (LTE-A) which is defined in the 3GPP
standards as Release 10/11 is called Carrier Aggregation (CA), this feature allows the network
to aggregate more carriers in-order to provide a higher bandwidth. Carrier Aggregation has
three main cases: Intra-band contiguous, Intra-band non-contiguous, Inter-band contiguous.
The main contribution of this paper was in implementing the Intra-band contiguous case by
modifying the LTE-Sim-5, then evaluating the Quality of Service (QoS) performance of the
Modified Largest Weighted Delay First (MLWDF), the Exponential Rule (Exp-Rule), and the
Logarithmic Rule (Log-Rule) scheduling algorithms over LTE/LTE-A in the Down-Link
direction. The QoS performance evaluation is based on the system's average throughput, Packet
Loss Rate (PLR), average packet delay, and fairness among users. Simulation results show that
the use of CA improved the system's average throughput, and almost doubled the system's
maximum throughput. It reduced the PLR values almost by a half. It also reduced the average
packet delay by 20-40\% that varied according to the video bit-rate and the number of users.
The fairness indicator was improved with the use of CA by a factor of 10-20%.
KEYWORDS
Long Term Evolution (LTE), LTE-Advanced (LTE-A), Carrier Aggregation (CA), Quality of
Service (QoS), downlink scheduling.
1. INTRODUCTION
The LTE was introduced as an evolution to the Universal Mobile Telecommunication Systems
(UMTS) to provide cellular network users with high data rates in both the uplink and downlink
direction, decreased latency, and good spectrum utilization [1]. The spectrum utilization could be
achieved by the use of the right scheduling algorithm that meets with the environment's
conditions and the users' requirements demands. There are many scheduling algorithms that exist
50 Computer Science & Information Technology (CS & IT)
in the literature that are used in the LTE scheduling process. These algorithms can be classified in
five main groups: channel-unaware, channel-aware/QoS-unaware, channel-aware/QoS, semi-
persistent for VoIP support, and energy-aware [2]. When the number of users and their
applications increases, such as video-streaming and video-conferencing, this requires higher data
rates and decreased latency, which declines the service that the LTE provides to its users. This
challenge of providing a reliable service up to the users' requirements demands can not be solved
entirely by choosing the right scheduling algorithm, because the performance of these scheduling
algorithms is bounded by the existing LTE capabilities, such as the system's bandwidth. The LTE
supports at max 20 MHz channel bandwidth. However, the LTE-A can support more channel
bandwidth according to the release as specified in the 3GPP's technical specifications. In Release
10 (R10), the maximum aggregated bandwidth is 40MHz. And it is also 40MHz in Release 11
(R11), but with much more CA configurations [3]. This was the motivation to evaluate the QoS
performance of three Channel-aware/QoS-aware scheduling algorithms for video-applications
over the LTE Release 8/9 and LTE-A Release 10/11. The LTE-Sim-5 can only simulate the LTE
network without the use of CA, so the performance of these algorithms over LTE-A could not be
evaluated without making these modifications to the LTE-Sim-5, which motivated us to modify it
in order to make these evaluations.
The structure of this paper is as follows: in section 2, we explained the LTE network architecture.
In section 3, we explained the LTE radio spectrum. In section 4, we explained the carrier
aggregation. In section 5, we explained the general model of LTE scheduling. In section 6, we
explained the LTE scheduling algorithms which we evaluated in this paper. In section 7, we
explained the simulation environment and listed its parameters. In section 8, we used the
simulation results to measure the QoS parameters which we displayed in line charts and then
analysed. In the last section, we provided a concluding remarks.
2. LTE NETWORK ARCHITECTURE
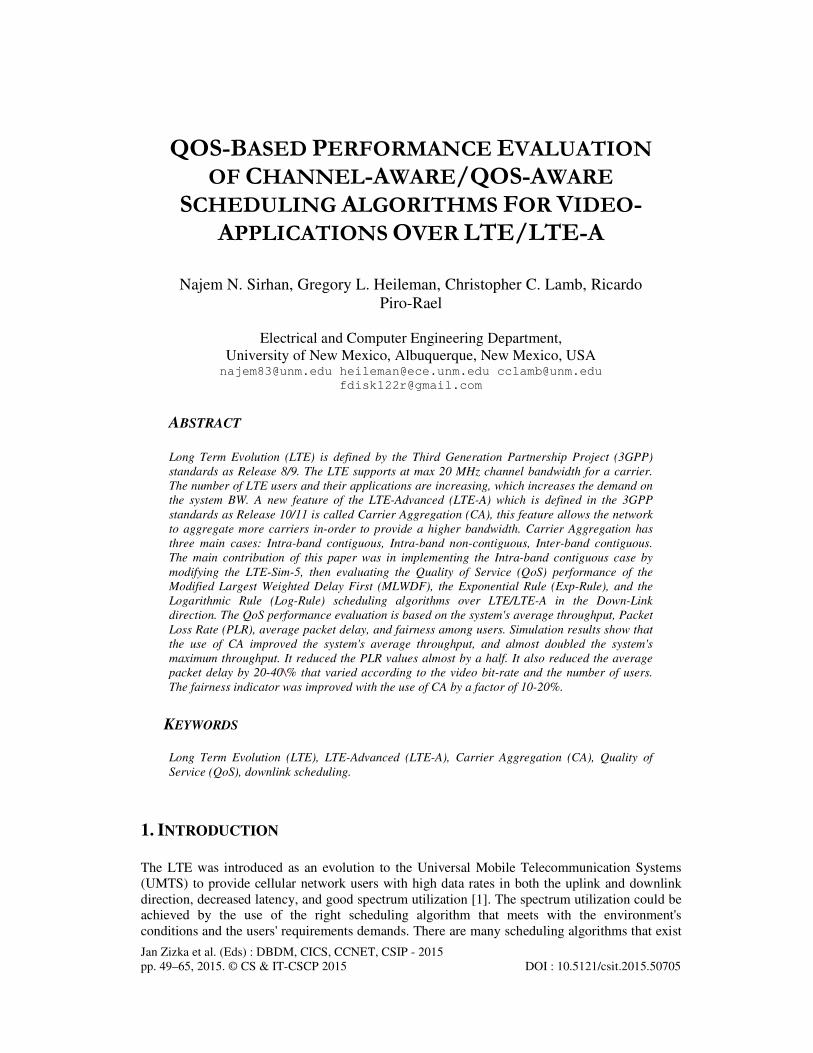
The LTE network architecture can be divided into two main parts: the Radio Access Network
(RAN), and the Evolved Packet Core (EPC) as in Figure 1. The RAN consists of an Evolved
NodeB (eNodeB) and User Equipment (UE). The eNodeB is the connection point for the UE with
the core network. It hosts the PHYsical (PHY), Medium Access Control (MAC), Radio Link
Control (RLC), and Packet Data Control Protocol (PDCP) layers that include the functionality of
user-plane header-compression and encryption. It also offers Radio Resource Control (RRC)
functionality that corresponds to the control plane. Scheduling, admission control, and radio
resource management are also performed in the eNodeB. The EPC part consists of five main
components: the Policy Control and Charging Rules Function (PCRF), the Home Subscriber
Server (HSS), the PDN-Gateway (P-GW), the Serving Gateway (S-GW), and the Mobility
Management Entity (MME). The PCRF is a logical node responsible for policy control decision-
making, and controlling the flow-based charging functionalities in the Policy Control
Enforcement Function (PCEF) that is being hosted at the P-GW. It also decides how a certain data
flow will be treated in the PCEF by providing the QoS authorization, QoS class identification,
and determine the bit rates in accordance with the user's subscription profile. The HSS is the
database of the LTE network, it contains all the users' subscription QoS profile, information about
the Packet Data Networks (PDNs) the user can connect to, dynamic information that relates the
identity of the MME to which the user is currently attached or registered to, and it may also
integrate the Authentication Center (AuC) that generates the vectors for authentication and
security keys. The P-GW is the gateway which is responsible for QoS enforcement for
Guaranteed Bit Rate (GBR) bearers, flow-based charging according to rules from the PCRF, and
the allocation of IP addresses to users. In addition it filters user's IP packets into different QoS-
based bearers based on Traffic Flow Templates (TFTs). It also serves as the mobility anchor for
inter-working with non-3GPP networks such as WiMAX and WiFi. The S-GW is the gateway
Computer Science & Information Technology (CS & IT) 51
that serves as the local mobility anchor for the data bearers while users are moving between
eNodeBs, in which all their IP packets are transferred through it. It temporarily buffers user's
downlink data when it is in the idle state, while the MME initiates paging of the UE to re-
establish the bearers. It performs administrative functions in the visited network such as
collecting information for charging and legal interception. It also serves as the mobility anchor for
inter-working with 3GPP networks such as General Packet Radio Service (GPRS) and Universal
Mobile Telecommunication Systems (UMTS). The MME is the main node in the EPC, it
manages the Authentication and Security, and the subscription profile and service connectivity of
users. It is responsible for all the mobility management tasks such as inter eNodeBs handovers,
inter MMEs handovers, and keeping track of the location of all users [4].
Figure 1. LTE network architecture
3. LTE RADIO SPECTRUM
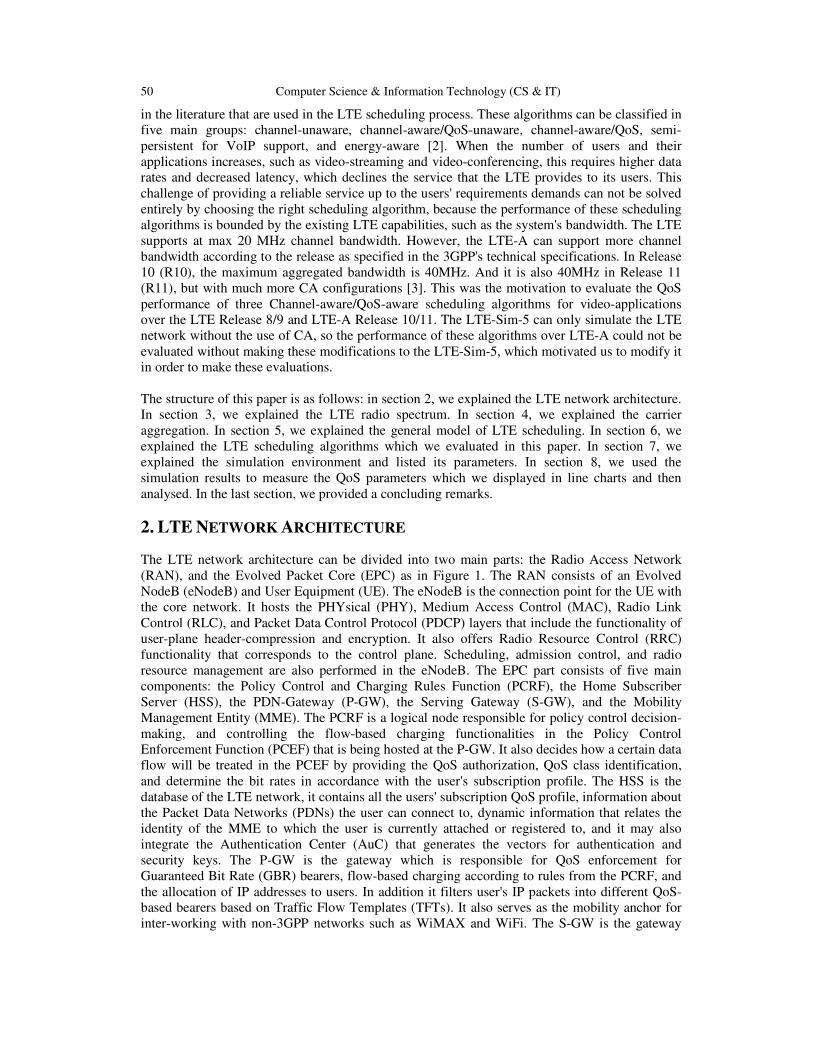
The LTE radio spectrum can be represented in a two dimensional array: one dimension exists in
the time domain, the other one in the frequency domain as shown in Figure 2. In the time domain,
LTE transmissions are organized into radio frames of length 10 ms, each frame is equally divided
into 10 sub-frames “1 ms each”'. This sub-frame is the minimum scheduling unit in LTE, each
sub-frame consists of two equal time slots “0.5 ms each”. There are two types of time slots, one is
the normal cyclic prefix which is combined of 7-OFDM symbols, the other is the extended cyclic
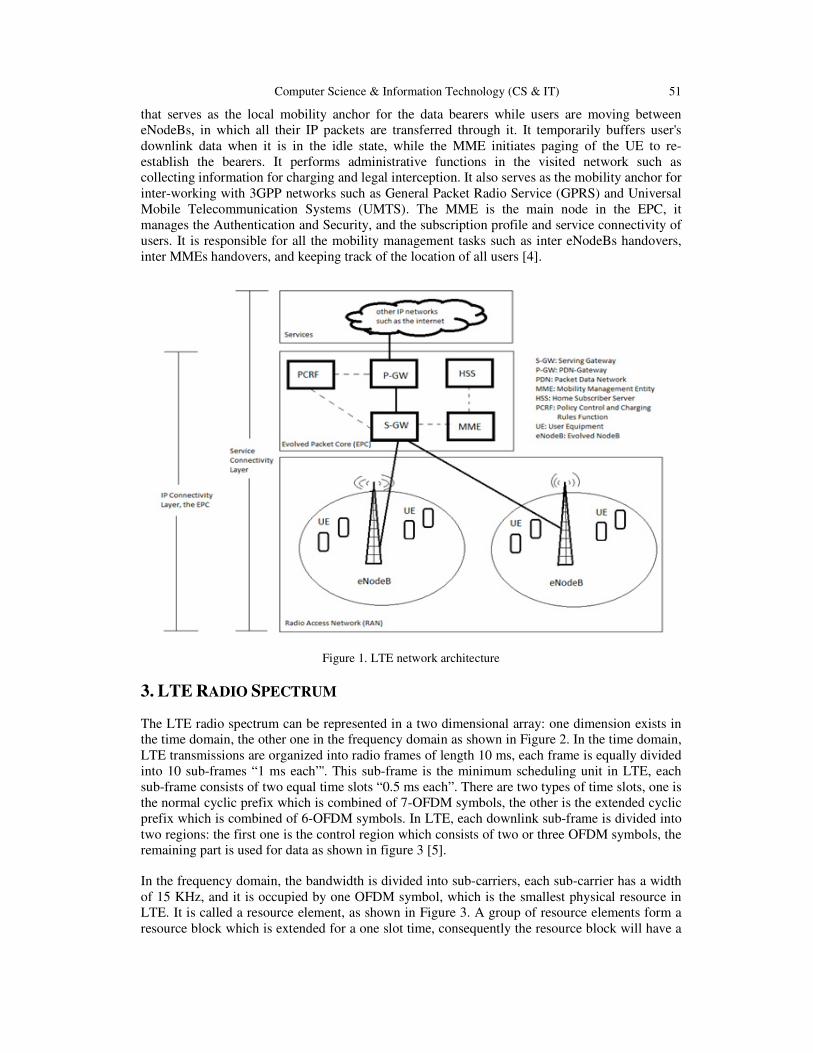
prefix which is combined of 6-OFDM symbols. In LTE, each downlink sub-frame is divided into
two regions: the first one is the control region which consists of two or three OFDM symbols, the
remaining part is used for data as shown in figure 3 [5].
In the frequency domain, the bandwidth is divided into sub-carriers, each sub-carrier has a width
of 15 KHz, and it is occupied by one OFDM symbol, which is the smallest physical resource in
LTE. It is called a resource element, as shown in Figure 3. A group of resource elements form a
resource block which is extended for a one slot time, consequently the resource block will have a
52 Computer Science & Information Technology (CS & IT)
width of 180 KHz “12*15KHz”, and it is the minimum scheduling unit for LTE users. Each sub-
carrier is being modulated using either Quadrature Phase-Shift Keying (QPSK), 16-Quadrature
Amplitude Modulation (16-QAM), or 64-QAM. The number of bits each sub-carrier can occupy
at a period of one OFDM symbol time depends on the modulation type [6].
Figure 2. LTE radio spectrum
Figure 3. The smallest scheduling LTE unit in the time-frequency domain
Computer Science & Information Technology (CS & IT) 53
4. CARRIER AGGREGATION
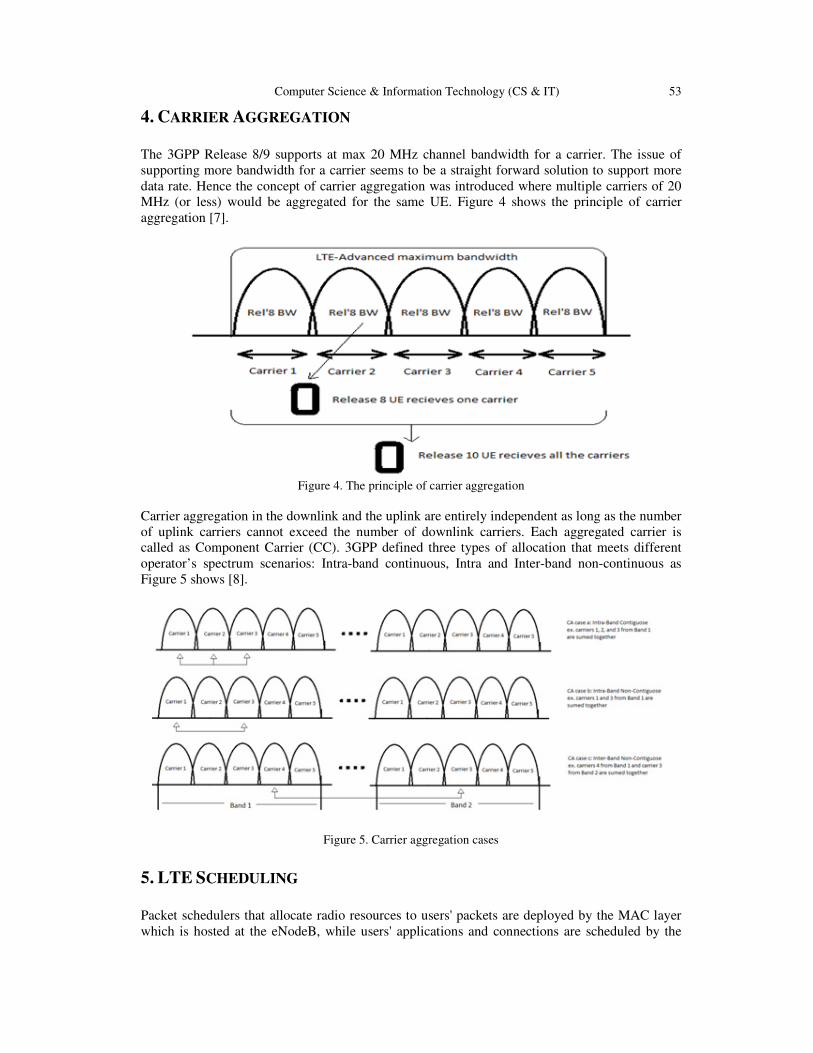
The 3GPP Release 8/9 supports at max 20 MHz channel bandwidth for a carrier. The issue of
supporting more bandwidth for a carrier seems to be a straight forward solution to support more
data rate. Hence the concept of carrier aggregation was introduced where multiple carriers of 20
MHz (or less) would be aggregated for the same UE. Figure 4 shows the principle of carrier
aggregation [7].
Figure 4. The principle of carrier aggregation
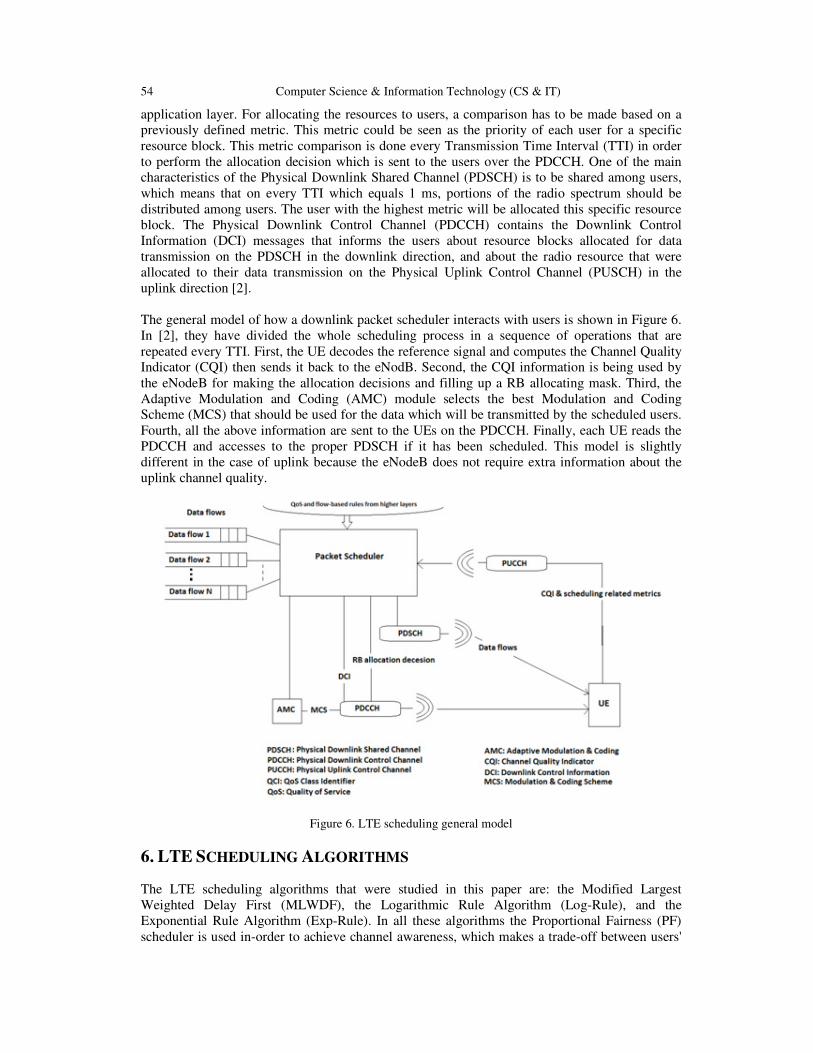
Carrier aggregation in the downlink and the uplink are entirely independent as long as the number
of uplink carriers cannot exceed the number of downlink carriers. Each aggregated carrier is
called as Component Carrier (CC). 3GPP defined three types of allocation that meets different
operator’s spectrum scenarios: Intra-band continuous, Intra and Inter-band non-continuous as
Figure 5 shows [8].
Figure 5. Carrier aggregation cases
5. LTE SCHEDULING
Packet schedulers that allocate radio resources to users' packets are deployed by the MAC layer
which is hosted at the eNodeB, while users' applications and connections are scheduled by the
54 Computer Science & Information Technology (CS & IT)
application layer. For allocating the resources to users, a comparison has to be made based on a
previously defined metric. This metric could be seen as the priority of each user for a specific
resource block. This metric comparison is done every Transmission Time Interval (TTI) in order
to perform the allocation decision which is sent to the users over the PDCCH. One of the main
characteristics of the Physical Downlink Shared Channel (PDSCH) is to be shared among users,
which means that on every TTI which equals 1 ms, portions of the radio spectrum should be
distributed among users. The user with the highest metric will be allocated this specific resource
block. The Physical Downlink Control Channel (PDCCH) contains the Downlink Control
Information (DCI) messages that informs the users about resource blocks allocated for data
transmission on the PDSCH in the downlink direction, and about the radio resource that were
allocated to their data transmission on the Physical Uplink Control Channel (PUSCH) in the
uplink direction [2].
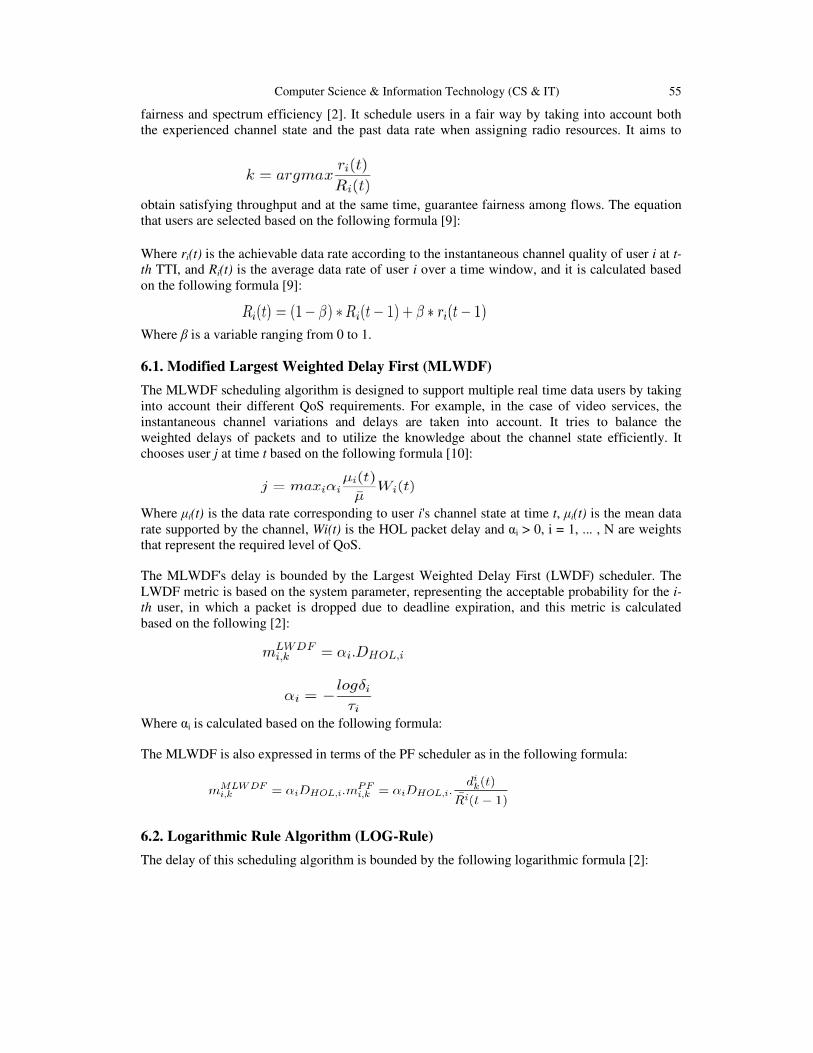
The general model of how a downlink packet scheduler interacts with users is shown in Figure 6.
In [2], they have divided the whole scheduling process in a sequence of operations that are
repeated every TTI. First, the UE decodes the reference signal and computes the Channel Quality
Indicator (CQI) then sends it back to the eNodB. Second, the CQI information is being used by
the eNodeB for making the allocation decisions and filling up a RB allocating mask. Third, the
Adaptive Modulation and Coding (AMC) module selects the best Modulation and Coding
Scheme (MCS) that should be used for the data which will be transmitted by the scheduled users.
Fourth, all the above information are sent to the UEs on the PDCCH. Finally, each UE reads the
PDCCH and accesses to the proper PDSCH if it has been scheduled. This model is slightly
different in the case of uplink because the eNodeB does not require extra information about the
uplink channel quality.
Figure 6. LTE scheduling general model
6. LTE SCHEDULING ALGORITHMS
The LTE scheduling algorithms that were studied in this paper are: the Modified Largest
Weighted Delay First (MLWDF), the Logarithmic Rule Algorithm (Log-Rule), and the
Exponential Rule Algorithm (Exp-Rule). In all these algorithms the Proportional Fairness (PF)
scheduler is used in-order to achieve channel awareness, which makes a trade-off between users'
Computer Science & Information Technology (CS & IT) 55
fairness and spectrum efficiency [2]. It schedule users in a fair way by taking into account both
the experienced channel state and the past data rate when assigning radio resources. It aims to
obtain satisfying throughput and at the same time, guarantee fairness among flows. The equation
that users are selected based on the following formula [9]:
Where ri(t) is the achievable data rate according to the instantaneous channel quality of user i at t-
th TTI, and Ri(t) is the average data rate of user i over a time window, and it is calculated based
on the following formula [9]:
Where β is a variable ranging from 0 to 1.
6.1. Modified Largest Weighted Delay First (MLWDF)
The MLWDF scheduling algorithm is designed to support multiple real time data users by taking
into account their different QoS requirements. For example, in the case of video services, the
instantaneous channel variations and delays are taken into account. It tries to balance the
weighted delays of packets and to utilize the knowledge about the channel state efficiently. It
chooses user j at time t based on the following formula [10]:
Where µi(t) is the data rate corresponding to user i's channel state at time t, µi(t) is the mean data
rate supported by the channel, Wi(t) is the HOL packet delay and αi > 0, i = 1, ... , N are weights
that represent the required level of QoS.
The MLWDF's delay is bounded by the Largest Weighted Delay First (LWDF) scheduler. The
LWDF metric is based on the system parameter, representing the acceptable probability for the i-
th user, in which a packet is dropped due to deadline expiration, and this metric is calculated
based on the following [2]:
Where αi is calculated based on the following formula:
The MLWDF is also expressed in terms of the PF scheduler as in the following formula:
6.2. Logarithmic Rule Algorithm (LOG-Rule)
The delay of this scheduling algorithm is bounded by the following logarithmic formula [2]:
56 Computer Science & Information Technology (CS & IT)
Where αi, bi, c are tunable parameters, and the spectral efficiency for the i-th user on the k-th sub-
channel is represented by:
6.3. Exponential Rule Algorithm (Exp-Rule)
The delay of this scheduling algorithm is bounded by the following Exponential formula [2]:
7. SIMULATION ENVIRONMENT
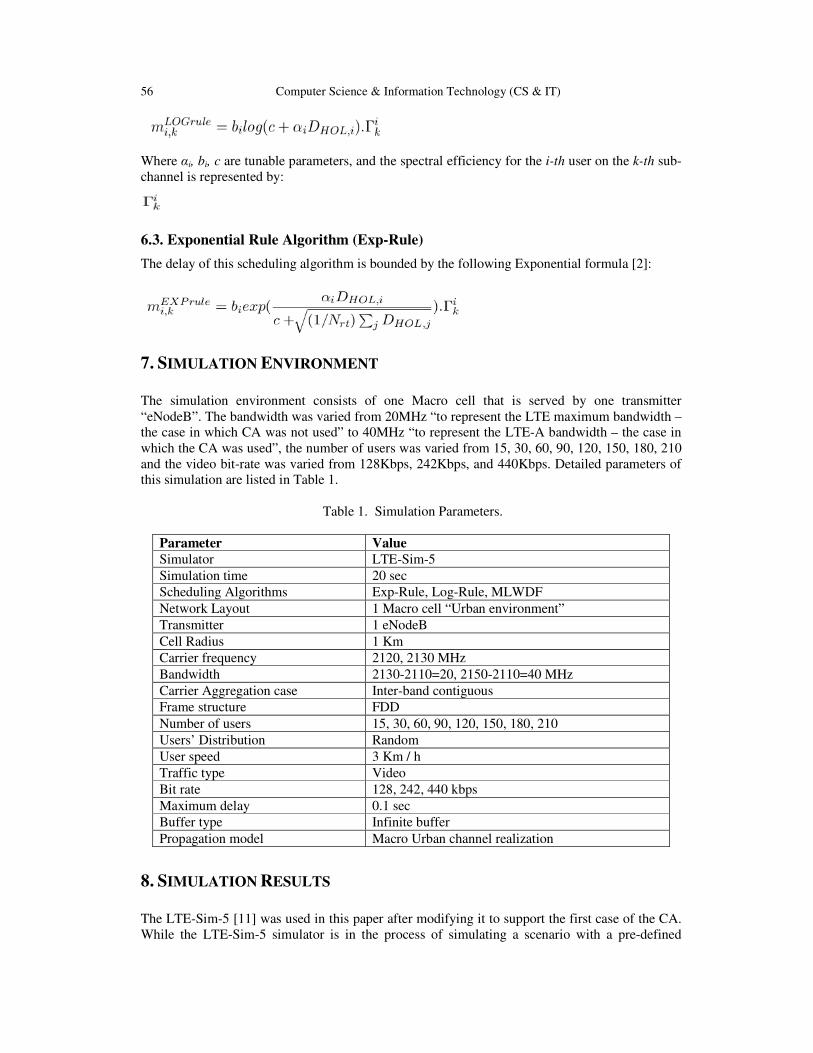
The simulation environment consists of one Macro cell that is served by one transmitter
“eNodeB”. The bandwidth was varied from 20MHz “to represent the LTE maximum bandwidth –
the case in which CA was not used” to 40MHz “to represent the LTE-A bandwidth – the case in
which the CA was used”, the number of users was varied from 15, 30, 60, 90, 120, 150, 180, 210
and the video bit-rate was varied from 128Kbps, 242Kbps, and 440Kbps. Detailed parameters of
this simulation are listed in Table 1.
Table 1. Simulation Parameters.
Parameter Value Simulator LTE-Sim-5 Simulation time 20 sec Scheduling Algorithms Exp-Rule, Log-Rule, MLWDF Network Layout 1 Macro cell “Urban environment” Transmitter 1 eNodeB Cell Radius 1 Km Carrier frequency 2120, 2130 MHz Bandwidth 2130-2110=20, 2150-2110=40 MHz Carrier Aggregation case Inter-band contiguous Frame structure FDD Number of users 15, 30, 60, 90, 120, 150, 180, 210 Users’ Distribution Random User speed 3 Km / h Traffic type Video Bit rate 128, 242, 440 kbps Maximum delay 0.1 sec Buffer type Infinite buffer Propagation model Macro Urban channel realization
8. SIMULATION RESULTS
The LTE-Sim-5 [11] was used in this paper after modifying it to support the first case of the CA.
While the LTE-Sim-5 simulator is in the process of simulating a scenario with a pre-defined
Computer Science & Information Technology (CS & IT) 57
conditions, it takes into account both the signalling and data traffic. However, it only displays the
data traffic in its traces. These data traffic traces are used to measure the QoS parameters, the
system's average throughput, Packet Loss Rate (PLR), average packet delay, and fairness among
users. These measurements are displayed in all the following figures by taking the number of
users as its X-axis factor and the QoS parameter as the Y-axis factor.
8.1. System's Average Throughput
System's average throughput is defined as the amount of the total received packets for all users
per second. The system's average throughput with and without the use of carrier aggregation for
the three scheduling algorithms at different video bit-rates are displayed in the following figures
“fig. 7, 8, and 9.
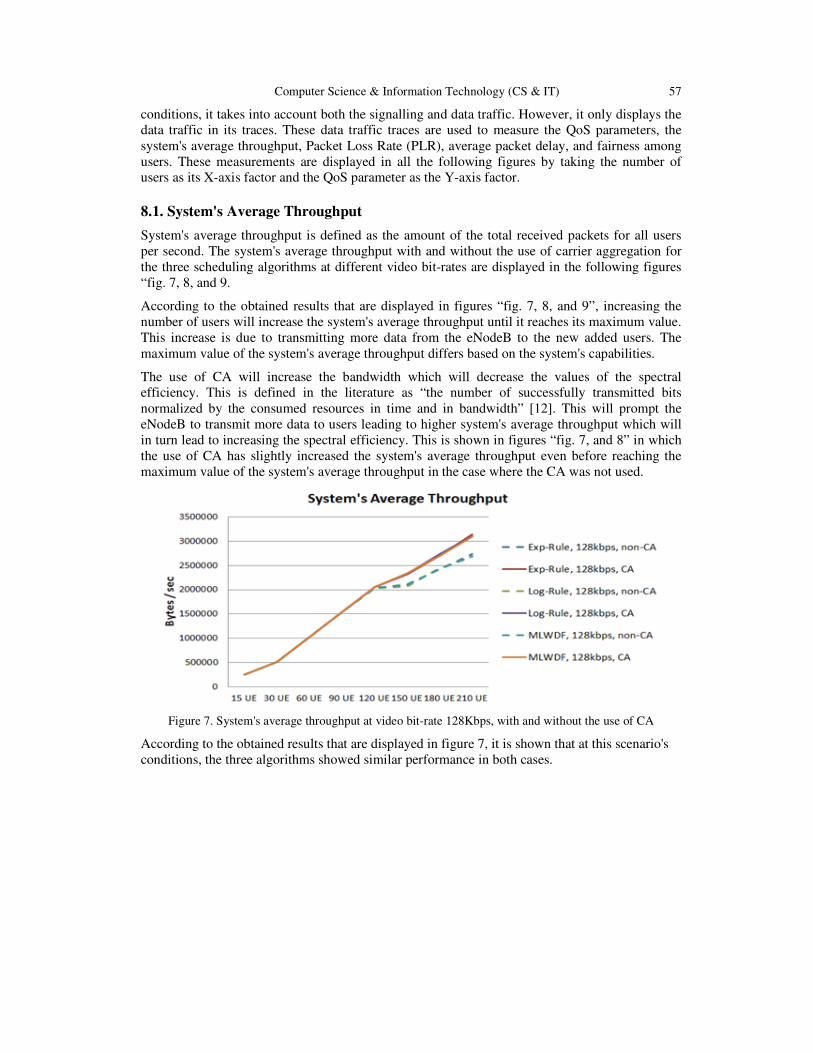
According to the obtained results that are displayed in figures “fig. 7, 8, and 9”, increasing the
number of users will increase the system's average throughput until it reaches its maximum value.
This increase is due to transmitting more data from the eNodeB to the new added users. The
maximum value of the system's average throughput differs based on the system's capabilities.
The use of CA will increase the bandwidth which will decrease the values of the spectral
efficiency. This is defined in the literature as “the number of successfully transmitted bits
normalized by the consumed resources in time and in bandwidth” [12]. This will prompt the
eNodeB to transmit more data to users leading to higher system's average throughput which will
in turn lead to increasing the spectral efficiency. This is shown in figures “fig. 7, and 8” in which
the use of CA has slightly increased the system's average throughput even before reaching the
maximum value of the system's average throughput in the case where the CA was not used.
Figure 7. System's average throughput at video bit-rate 128Kbps, with and without the use of CA
According to the obtained results that are displayed in figure 7, it is shown that at this scenario's
conditions, the three algorithms showed similar performance in both cases.
58 Computer Science & Information Technology (CS & IT)
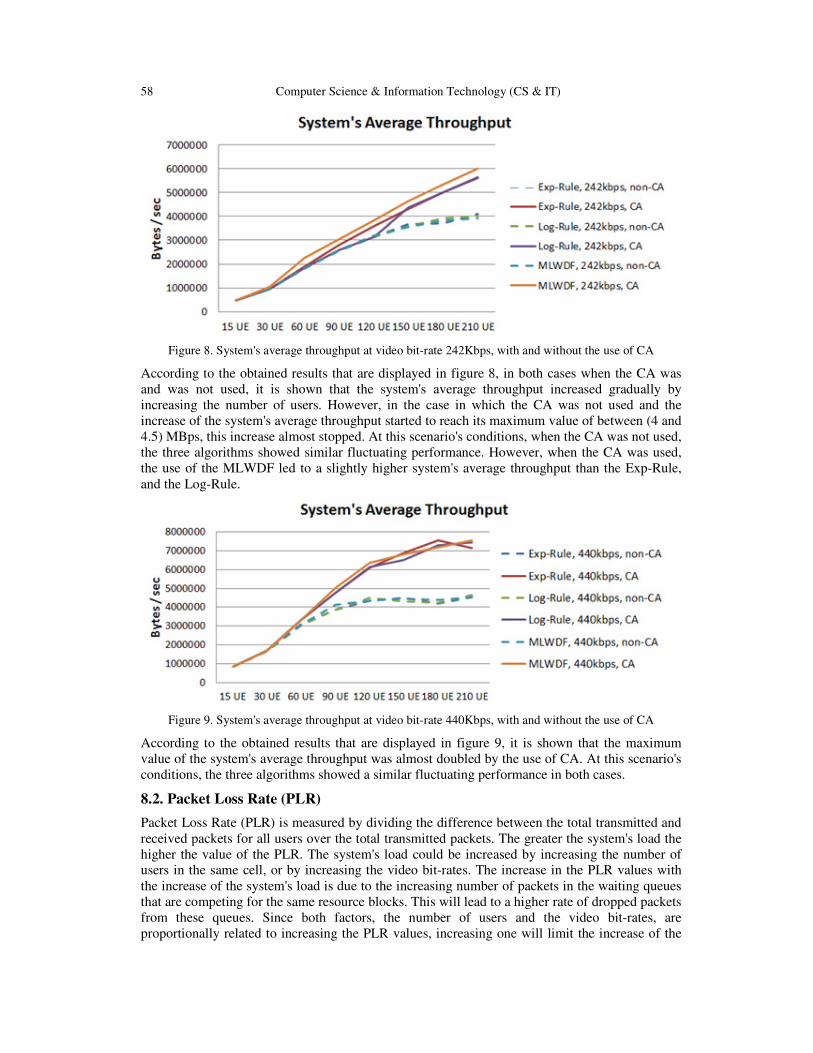
Figure 8. System's average throughput at video bit-rate 242Kbps, with and without the use of CA
According to the obtained results that are displayed in figure 8, in both cases when the CA was
and was not used, it is shown that the system's average throughput increased gradually by
increasing the number of users. However, in the case in which the CA was not used and the
increase of the system's average throughput started to reach its maximum value of between (4 and
4.5) MBps, this increase almost stopped. At this scenario's conditions, when the CA was not used,
the three algorithms showed similar fluctuating performance. However, when the CA was used,
the use of the MLWDF led to a slightly higher system's average throughput than the Exp-Rule,
and the Log-Rule.
Figure 9. System's average throughput at video bit-rate 440Kbps, with and without the use of CA
According to the obtained results that are displayed in figure 9, it is shown that the maximum
value of the system's average throughput was almost doubled by the use of CA. At this scenario's
conditions, the three algorithms showed a similar fluctuating performance in both cases.
8.2. Packet Loss Rate (PLR)
Packet Loss Rate (PLR) is measured by dividing the difference between the total transmitted and
received packets for all users over the total transmitted packets. The greater the system's load the
higher the value of the PLR. The system's load could be increased by increasing the number of
users in the same cell, or by increasing the video bit-rates. The increase in the PLR values with
the increase of the system's load is due to the increasing number of packets in the waiting queues
that are competing for the same resource blocks. This will lead to a higher rate of dropped packets
from these queues. Since both factors, the number of users and the video bit-rates, are
proportionally related to increasing the PLR values, increasing one will limit the increase of the
Computer Science & Information Technology (CS & IT) 59
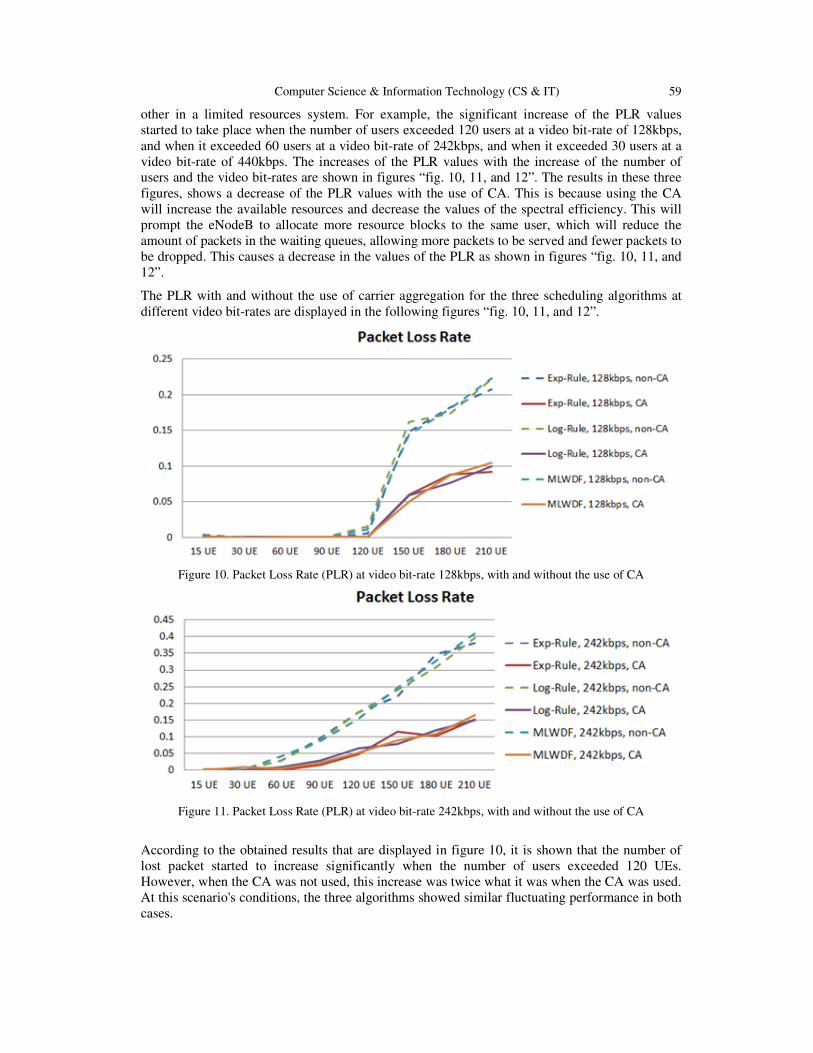
other in a limited resources system. For example, the significant increase of the PLR values
started to take place when the number of users exceeded 120 users at a video bit-rate of 128kbps,
and when it exceeded 60 users at a video bit-rate of 242kbps, and when it exceeded 30 users at a
video bit-rate of 440kbps. The increases of the PLR values with the increase of the number of
users and the video bit-rates are shown in figures “fig. 10, 11, and 12”. The results in these three
figures, shows a decrease of the PLR values with the use of CA. This is because using the CA
will increase the available resources and decrease the values of the spectral efficiency. This will
prompt the eNodeB to allocate more resource blocks to the same user, which will reduce the
amount of packets in the waiting queues, allowing more packets to be served and fewer packets to
be dropped. This causes a decrease in the values of the PLR as shown in figures “fig. 10, 11, and
12”.
The PLR with and without the use of carrier aggregation for the three scheduling algorithms at
different video bit-rates are displayed in the following figures “fig. 10, 11, and 12”.
Figure 10. Packet Loss Rate (PLR) at video bit-rate 128kbps, with and without the use of CA
Figure 11. Packet Loss Rate (PLR) at video bit-rate 242kbps, with and without the use of CA
According to the obtained results that are displayed in figure 10, it is shown that the number of
lost packet started to increase significantly when the number of users exceeded 120 UEs.
However, when the CA was not used, this increase was twice what it was when the CA was used.
At this scenario's conditions, the three algorithms showed similar fluctuating performance in both
cases.
60 Computer Science & Information Technology (CS & IT)
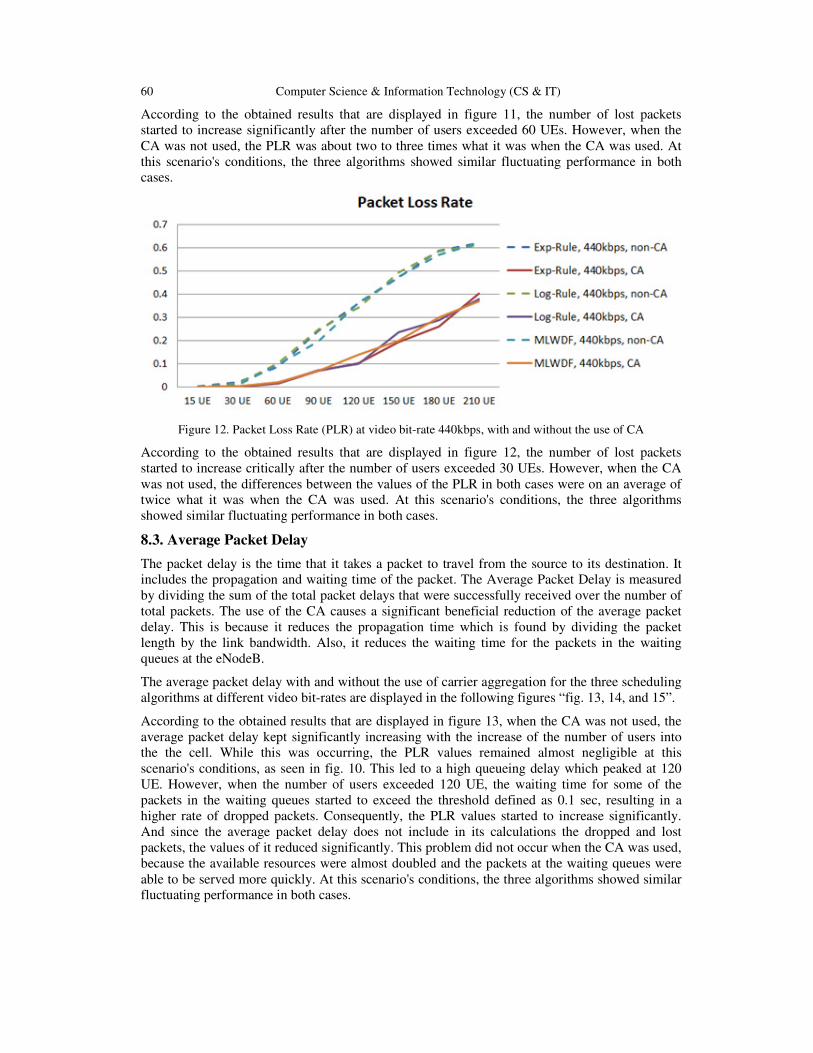
According to the obtained results that are displayed in figure 11, the number of lost packets
started to increase significantly after the number of users exceeded 60 UEs. However, when the
CA was not used, the PLR was about two to three times what it was when the CA was used. At
this scenario's conditions, the three algorithms showed similar fluctuating performance in both
cases.
Figure 12. Packet Loss Rate (PLR) at video bit-rate 440kbps, with and without the use of CA
According to the obtained results that are displayed in figure 12, the number of lost packets
started to increase critically after the number of users exceeded 30 UEs. However, when the CA
was not used, the differences between the values of the PLR in both cases were on an average of
twice what it was when the CA was used. At this scenario's conditions, the three algorithms
showed similar fluctuating performance in both cases.
8.3. Average Packet Delay
The packet delay is the time that it takes a packet to travel from the source to its destination. It
includes the propagation and waiting time of the packet. The Average Packet Delay is measured
by dividing the sum of the total packet delays that were successfully received over the number of
total packets. The use of the CA causes a significant beneficial reduction of the average packet
delay. This is because it reduces the propagation time which is found by dividing the packet
length by the link bandwidth. Also, it reduces the waiting time for the packets in the waiting
queues at the eNodeB.
The average packet delay with and without the use of carrier aggregation for the three scheduling
algorithms at different video bit-rates are displayed in the following figures “fig. 13, 14, and 15”.
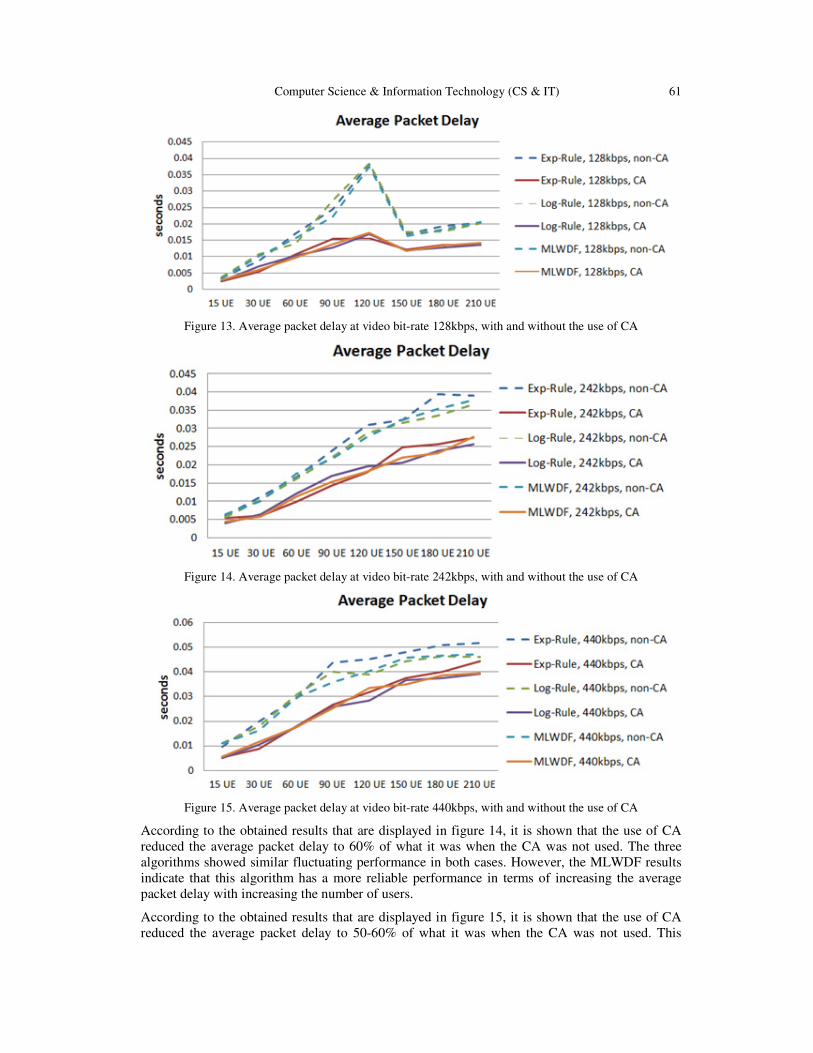
According to the obtained results that are displayed in figure 13, when the CA was not used, the
average packet delay kept significantly increasing with the increase of the number of users into
the the cell. While this was occurring, the PLR values remained almost negligible at this
scenario's conditions, as seen in fig. 10. This led to a high queueing delay which peaked at 120
UE. However, when the number of users exceeded 120 UE, the waiting time for some of the
packets in the waiting queues started to exceed the threshold defined as 0.1 sec, resulting in a
higher rate of dropped packets. Consequently, the PLR values started to increase significantly.
And since the average packet delay does not include in its calculations the dropped and lost
packets, the values of it reduced significantly. This problem did not occur when the CA was used,
because the available resources were almost doubled and the packets at the waiting queues were
able to be served more quickly. At this scenario's conditions, the three algorithms showed similar
fluctuating performance in both cases.
Computer Science & Information Technology (CS & IT) 61
Figure 13. Average packet delay at video bit-rate 128kbps, with and without the use of CA
Figure 14. Average packet delay at video bit-rate 242kbps, with and without the use of CA
Figure 15. Average packet delay at video bit-rate 440kbps, with and without the use of CA
According to the obtained results that are displayed in figure 14, it is shown that the use of CA
reduced the average packet delay to 60% of what it was when the CA was not used. The three
algorithms showed similar fluctuating performance in both cases. However, the MLWDF results
indicate that this algorithm has a more reliable performance in terms of increasing the average
packet delay with increasing the number of users.
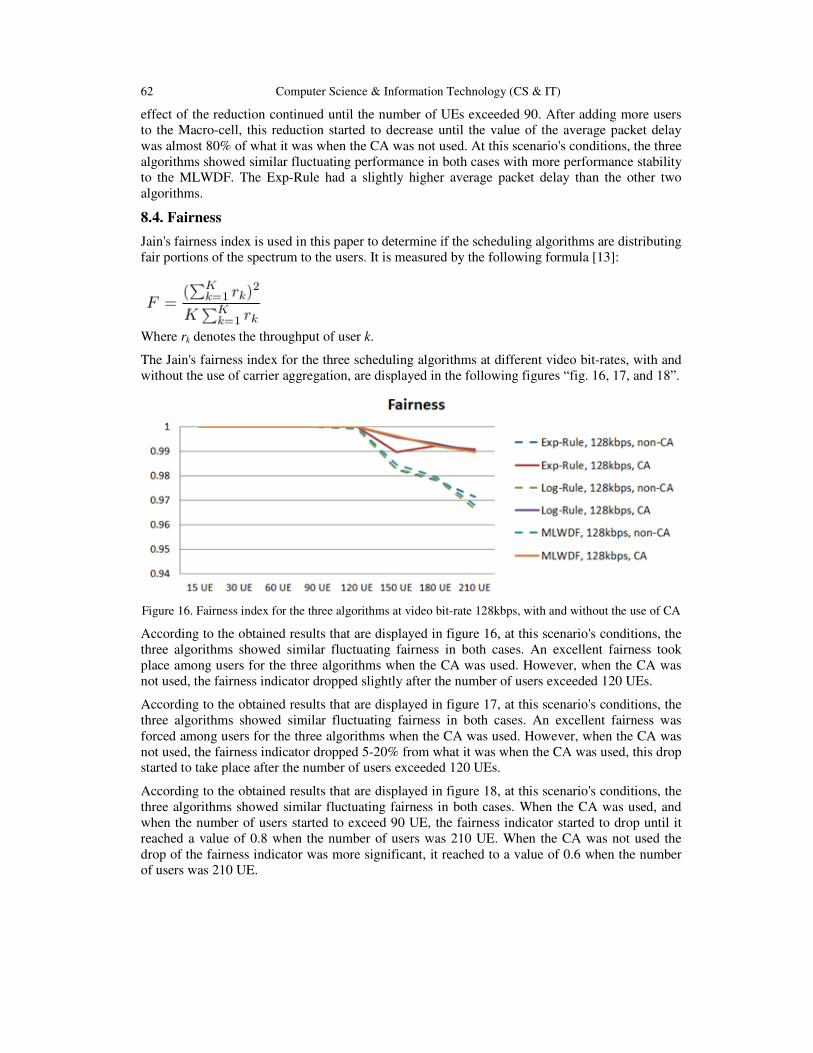
According to the obtained results that are displayed in figure 15, it is shown that the use of CA
reduced the average packet delay to 50-60% of what it was when the CA was not used. This
62 Computer Science & Information Technology (CS & IT)
effect of the reduction continued until the number of UEs exceeded 90. After adding more users
to the Macro-cell, this reduction started to decrease until the value of the average packet delay
was almost 80% of what it was when the CA was not used. At this scenario's conditions, the three
algorithms showed similar fluctuating performance in both cases with more performance stability
to the MLWDF. The Exp-Rule had a slightly higher average packet delay than the other two
algorithms.
8.4. Fairness
Jain's fairness index is used in this paper to determine if the scheduling algorithms are distributing
fair portions of the spectrum to the users. It is measured by the following formula [13]:
Where rk denotes the throughput of user k.
The Jain's fairness index for the three scheduling algorithms at different video bit-rates, with and
without the use of carrier aggregation, are displayed in the following figures “fig. 16, 17, and 18”.
Figure 16. Fairness index for the three algorithms at video bit-rate 128kbps, with and without the use of CA
According to the obtained results that are displayed in figure 16, at this scenario's conditions, the
three algorithms showed similar fluctuating fairness in both cases. An excellent fairness took
place among users for the three algorithms when the CA was used. However, when the CA was
not used, the fairness indicator dropped slightly after the number of users exceeded 120 UEs.
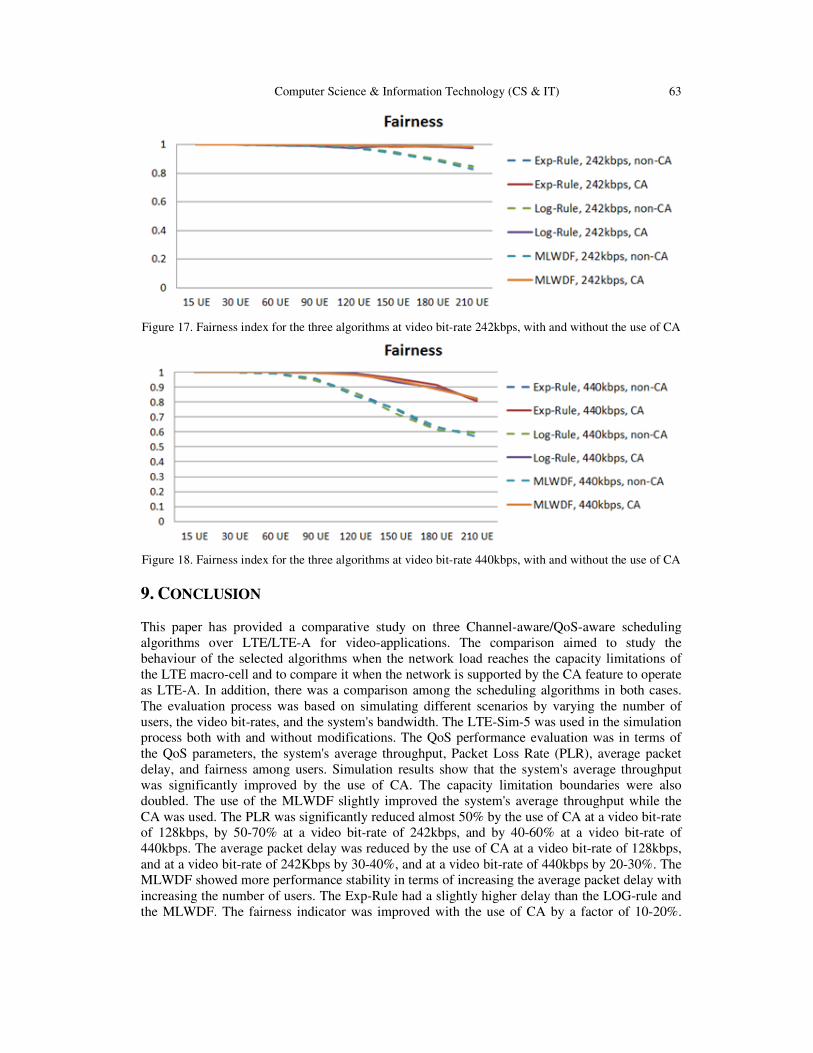
According to the obtained results that are displayed in figure 17, at this scenario's conditions, the
three algorithms showed similar fluctuating fairness in both cases. An excellent fairness was
forced among users for the three algorithms when the CA was used. However, when the CA was
not used, the fairness indicator dropped 5-20% from what it was when the CA was used, this drop
started to take place after the number of users exceeded 120 UEs.
According to the obtained results that are displayed in figure 18, at this scenario's conditions, the
three algorithms showed similar fluctuating fairness in both cases. When the CA was used, and
when the number of users started to exceed 90 UE, the fairness indicator started to drop until it
reached a value of 0.8 when the number of users was 210 UE. When the CA was not used the
drop of the fairness indicator was more significant, it reached to a value of 0.6 when the number
of users was 210 UE.
Computer Science & Information Technology (CS & IT) 63
Figure 17. Fairness index for the three algorithms at video bit-rate 242kbps, with and without the use of CA
Figure 18. Fairness index for the three algorithms at video bit-rate 440kbps, with and without the use of CA
9. CONCLUSION
This paper has provided a comparative study on three Channel-aware/QoS-aware scheduling
algorithms over LTE/LTE-A for video-applications. The comparison aimed to study the
behaviour of the selected algorithms when the network load reaches the capacity limitations of
the LTE macro-cell and to compare it when the network is supported by the CA feature to operate
as LTE-A. In addition, there was a comparison among the scheduling algorithms in both cases.
The evaluation process was based on simulating different scenarios by varying the number of
users, the video bit-rates, and the system's bandwidth. The LTE-Sim-5 was used in the simulation
process both with and without modifications. The QoS performance evaluation was in terms of
the QoS parameters, the system's average throughput, Packet Loss Rate (PLR), average packet
delay, and fairness among users. Simulation results show that the system's average throughput
was significantly improved by the use of CA. The capacity limitation boundaries were also
doubled. The use of the MLWDF slightly improved the system's average throughput while the
CA was used. The PLR was significantly reduced almost 50% by the use of CA at a video bit-rate
of 128kbps, by 50-70% at a video bit-rate of 242kbps, and by 40-60% at a video bit-rate of
440kbps. The average packet delay was reduced by the use of CA at a video bit-rate of 128kbps,
and at a video bit-rate of 242Kbps by 30-40%, and at a video bit-rate of 440kbps by 20-30%. The
MLWDF showed more performance stability in terms of increasing the average packet delay with
increasing the number of users. The Exp-Rule had a slightly higher delay than the LOG-rule and
the MLWDF. The fairness indicator was improved with the use of CA by a factor of 10-20%.
64 Computer Science & Information Technology (CS & IT)
These results show that the use of CA is worth being investigated by researchers, implemented by
the manufacturers, and deployed by the service providers.
APPENDIX A: LIST OF ACRONYMS
3GPP Third Generation Partnership Project
AMC Adaptive Modulation and Coding
AuC Authentication Center
CA Carrier Aggregation
CC Component Carrier
CQI Channel Quality Indicator
DCI Downlink Control Information
eNodeB Evolved NodeB
EPC Evolved Packet Core
Exp-Rule Exponential Rule
FDD Frequency Division Duplex
GBR Guaranteed Bit Rate
GPRS General Packet Radio Service
HOL Head of Line
HSS Exponential Rule
LTE Long Term Evolution
LTE-A LTE-Advanced
Log-Rule Logarithmic Rule
LWDF Largest Weighted Delay First
MAC Medium Access Control
MCS Modulation and Coding Scheme
MLWDF Modified Largest Weighted Delay First
MME Mobility Management Entity
OFDM Orthogonal Frequency Division Multiplexing
PCEF Policy Control Enforcement Function
PCRF Policy Control and Charging Rules Function
PDCCH Physical Downlink Control Channel
PDSCH Physical Downlink Shared Channel
PDCP Packet Data Control Protocol
PDNs Packet Data Networks
PF Proportional Fairness
PLR Packet Loss Rate
PUSCH Physical Uplink Control Channel
P-GW PDN-Gateway
QAM Quadrature Amplitude Modulation
QoS Quality of Service
QPSK Quadrature Phase-Shift Keying
R8/9 Release 8/9
R10/11 Release 10/11
RAN Radio Access Network
RB Resource Block
RLC Radio Link Control
RRC Radio Resource Control
S-GW Serving Gateway
TFTs Traffic Flow Templates
TTI Transmission Time Interval
UE User Equipment
UMTS Universal Mobile Telecommunication Systems
Computer Science & Information Technology (CS & IT) 65
VoIP Voice over IP
Wi-Fi wireless fidelity
WiMAX Worldwide Interoperability for Microwave Access
REFERENCES [1] “3gpp, “lte.” [online]. available:.” http://www.3gpp.org/technologieskeywords-acronyms/98-lte
[2] F. Capozzi, G. Piro, L. A. Grieco, G. Boggia, and P. Camarda, “Downlink packet scheduling in lte
cellular networks: Key design issues and a survey,” Communications Surveys & Tutorials, IEEE, vol.
15, no. 2, pp. 678–700, 2013.
[3] “3gpp, “carrier aggregation explained.” [online]. Available:.”
http://www.3gpp.org/technologies/keywords-acronyms/101-carrier-aggregation-explained
[4] H. Holma and A. Toskala, LTE for UMTS-OFDMA and SC-FDMA based radio access. John Wiley
& Sons, 2009.
[5] S. P. E. Dahlman and J. Skold, 4G LTE/LTE-Advanced for Mobile Broadband. Elseiver, 2011.
[6] “Anritsu, “lte resource guide.” [online]. available:.”
http://www.3gpp.org/technologies/keywords-acronyms/98-lte
[7] A. T. H. Holma, LTE Advanced: 3GPP Solution for IMT-Advanced. Wiley, 2012.
[8] “Anritsu, understanding lte-advanced carrier aggregation. [online]. Available:.”
http://downloadfile.anritsu.com/RefFiles/en-GB/Promotions/Understanding-Carrier-Aggregation-
web.pdf
[9] B. Liu, H. Tian, and L. Xu, “An efficient downlink packet scheduling algorithm for real time traffics
in lte systems,” in Consumer communications and networking conference (CCNC), 2013 IEEE, pp.
364–369, IEEE, 2013.
[10] M. Iturralde, T. Ali Yahiya, A. Wei, and A.-L. Beylot, “Performance study of multimedia services
using virtual token mechanism for resource allocation in lte networks,” in Vehicular Technology
Conference (VTC Fall), 2011 IEEE, pp. 1–5, IEEE, 2011.
[11] G. Piro, L. A. Grieco, G. Boggia, F. Capozzi, and P. Camarda, “Simulating lte cellular systems: an
open-source framework,” Vehicular Technology, IEEE Transactions on, vol. 60, no. 2, pp. 498–513,
2011.
[12] Y. Chen and B. Walke, “Analysis of cell spectral efficiency in 3gpp lte systems,” in Personal Indoor
and Mobile Radio Communications (PIMRC), 2013 IEEE 24th International Symposium on, pp.
1799–1804, IEEE, 2013.
[13] C. Bae and D.-H. Cho, “Fairness-aware adaptive resource allocation scheme in multihop ofdma
systems,” Communications Letters, IEEE, vol. 11, no. 2, pp. 134–136, 2007.
66 Computer Science & Information Technology (CS & IT)
INTENTIONAL BLANK