q4 2017 earnings call - investors.milacron.com/media/files/m/milacron-ir/reports... · income and...
TRANSCRIPT

Q4 2017 EARNINGS CALLFEBRUARY 20, 2018
1
2
IMPORTANT INFORMATION
These slides contain (and the accompanying oral discussion will contain) “forward looking statements”. All statements other than statements of historical fact or relating to present facts or current conditions are forward‐looking statements. Such statements involve known and unknown risks, uncertainties and other factors that could cause the actual results of the Company to differ materially from the results expressed or implied by such statements, including general economic and business conditions, conditions affecting the industries served by the Company and its subsidiaries, conditions affecting the Company’s customers and suppliers, competitor responses to the Company’s products and services, the overall market acceptance of such products and services, increases in the Company’s cost structure, the rate of economic development and growth in emerging markets, the Company’s exposure to fluctuations in currencies, the Company’s ability to successfully implement its strategic initiatives to increase cost savings and improve operating margins, the integration of acquisitions and other factors disclosed in the Company’s periodic reports. Such risks and other factors that may impact management’s beliefs and assumptions are more particularly described in the Company’s Form 10‐K filed with the Securities and Exchange Commission (the “SEC”) on February 28, 2017 under the caption “Risk Factors.” Consequently such forward‐looking statements should be regarded as the Company’s current plans, estimates and beliefs. The forward looking statements in these slides are made only as of the date hereof. The Company does not undertake and specifically declines any obligation to publicly release the results of any revisions to these forward‐looking statements that may be made to reflect any future events or circumstances after the date of such statements or to reflect the occurrence of anticipated or unanticipated events, except to the extent required by law. All of the Company’s forward‐looking statements should be considered in light of these factors.
These slides contain financial measures which have not been calculated in accordance with generally accepted accounting principles in the United States (“U.S. GAAP”), including Adjusted EBITDA, Adjusted Net Income and Free Cash Flow. These non‐GAAP financial measures should be considered only as supplemental to, and not as an alternative to, financial measures prepared in accordance with U.S. GAAP. Please refer to the appendix of this presentation for a reconciliation of Adjusted EBITDA, Adjusted Net Income and Free Cash Flow to the most directly comparable U.S. GAAP financial measures. We believe that the inclusion of Adjusted EBITDA is useful to provide additional information to investors about certain material non‐cash items, as well as items considered to be one‐time or non‐recurring to the operations of the business. We believe the presentation of Adjusted Net Income enhances our investors’ overall understanding of the financial performance and cash flow of our business. We believe the presentation of Free Cash Flow is useful to investors because it measures the operating cash flow of the Company, excluding the capital that is spent to continue and improve business operations, such as investment in the Company's existing business. Our use of the terms Adjusted EBITDA, Adjusted Net Income and Free Cash Flow may vary from that of others in our industry.
This presentation should be read in conjunction with Management’s Discussion and Analysis of Financial Condition and Results of Operations and the Consolidated Financial Statements presented within our Form 10‐K filed with the SEC on February 28, 2017.
Forward Looking Statements
Non‐GAAP Financial Measures
Q4'17 Earnings Presentation | 20 February 2018
3
Q4 Financial HighlightsAdj. EPS(2,3)Adj. Net Income(2,3) Free Cash FlowSales(1) Adj. EBITDA
Q4’16 Q4’17
+9%
$53.6 $60.4
Q4’16 Q4’17
18.5%
18.6%
Q4’16 Q4’17
+28%
Q4’16 Q4’17
+26%
Q4’16 Q4’17
+$66
$315.1
$289.1
$324.9
$32.8
$42.0$0.47
$0.59 $1.5
$95.5
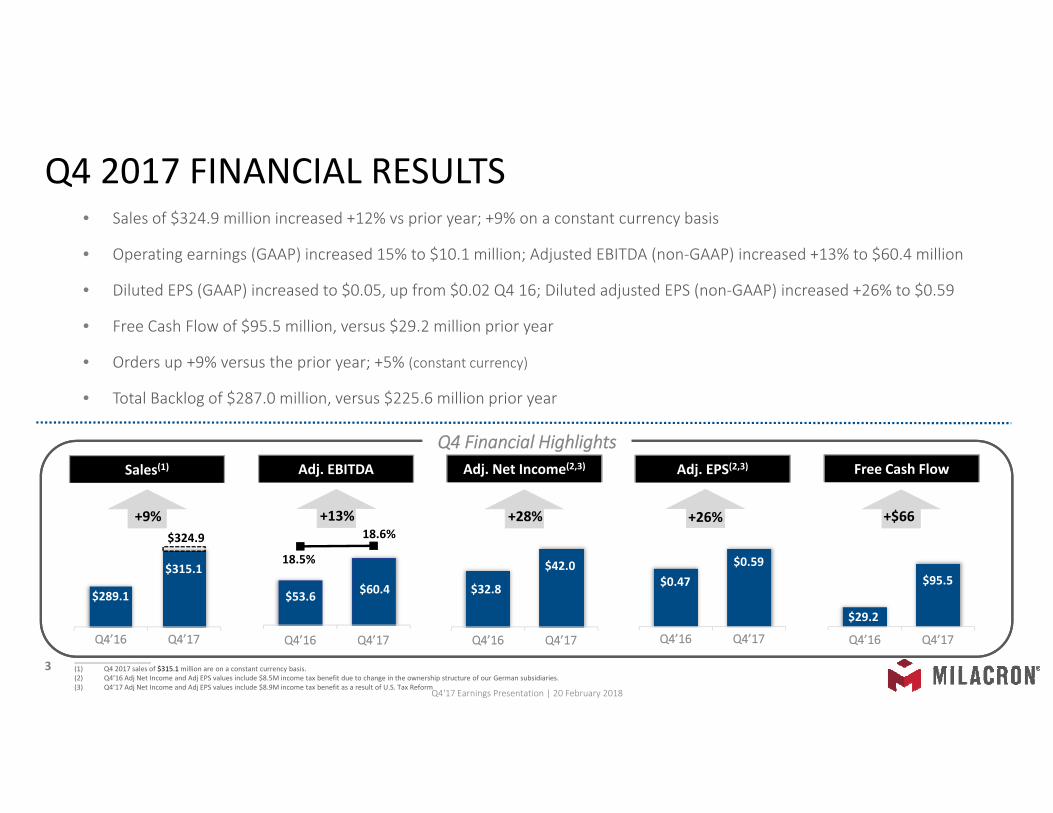
• Sales of $324.9 million increased +12% vs prior year; +9% on a constant currency basis
• Operating earnings (GAAP) increased 15% to $10.1 million; Adjusted EBITDA (non‐GAAP) increased +13% to $60.4 million
• Diluted EPS (GAAP) increased to $0.05, up from $0.02 Q4 16; Diluted adjusted EPS (non‐GAAP) increased +26% to $0.59
• Free Cash Flow of $95.5 million, versus $29.2 million prior year
• Orders up +9% versus the prior year; +5% (constant currency)
• Total Backlog of $287.0 million, versus $225.6 million prior year
____________________(1) Q4 2017 sales of $315.1 million are on a constant currency basis.(2) Q4’16 Adj Net Income and Adj EPS values include $8.5M income tax benefit due to change in the ownership structure of our German subsidiaries.(3) Q4’17 Adj Net Income and Adj EPS values include $8.9M income tax benefit as a result of U.S. Tax Reform
+13%
$29.2
Q4'17 Earnings Presentation | 20 February 2018
Q4 2017 FINANCIAL RESULTS
4
2017 Financial HighlightsAdj. EPS(2,3)Adj. Net Income(2,3) Free Cash FlowSales(1) Adj. EBITDA
YTD ‘16 YTD ‘17
+5%
$212.8
$227.3
YTD ‘16 YTD ‘17
18.2%
18.4%
YTD ‘16 YTD ‘17
+21%
YTD ‘16 YTD ‘17
+20%
YTD ‘16 YTD ‘17
+$23
$1,227
$1,167
$1,234
$105.7
$128.2
$1.51
$1.81 $1.5$83.2
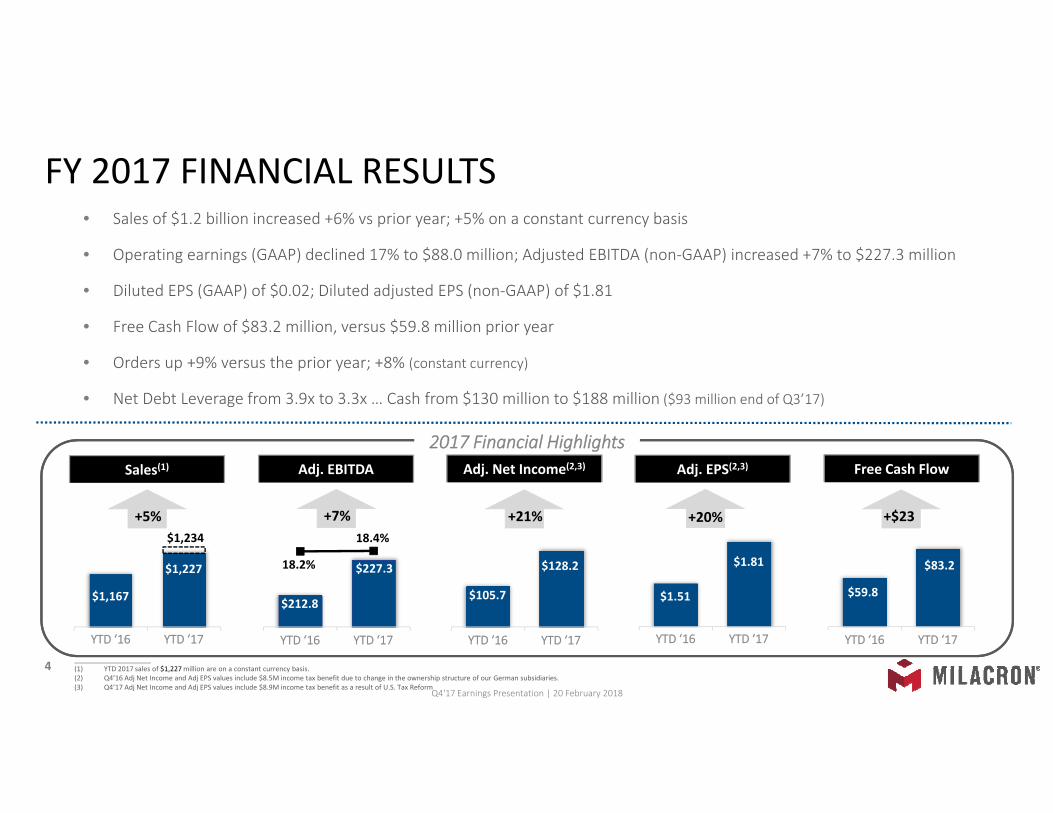
____________________(1) YTD 2017 sales of $1,227 million are on a constant currency basis.(2) Q4’16 Adj Net Income and Adj EPS values include $8.5M income tax benefit due to change in the ownership structure of our German subsidiaries.(3) Q4’17 Adj Net Income and Adj EPS values include $8.9M income tax benefit as a result of U.S. Tax Reform
+7%
$59.8
Q4'17 Earnings Presentation | 20 February 2018
• Sales of $1.2 billion increased +6% vs prior year; +5% on a constant currency basis
• Operating earnings (GAAP) declined 17% to $88.0 million; Adjusted EBITDA (non‐GAAP) increased +7% to $227.3 million
• Diluted EPS (GAAP) of $0.02; Diluted adjusted EPS (non‐GAAP) of $1.81
• Free Cash Flow of $83.2 million, versus $59.8 million prior year
• Orders up +9% versus the prior year; +8% (constant currency)
• Net Debt Leverage from 3.9x to 3.3x … Cash from $130 million to $188 million ($93 million end of Q3’17)
FY 2017 FINANCIAL RESULTS
ORDERS
5
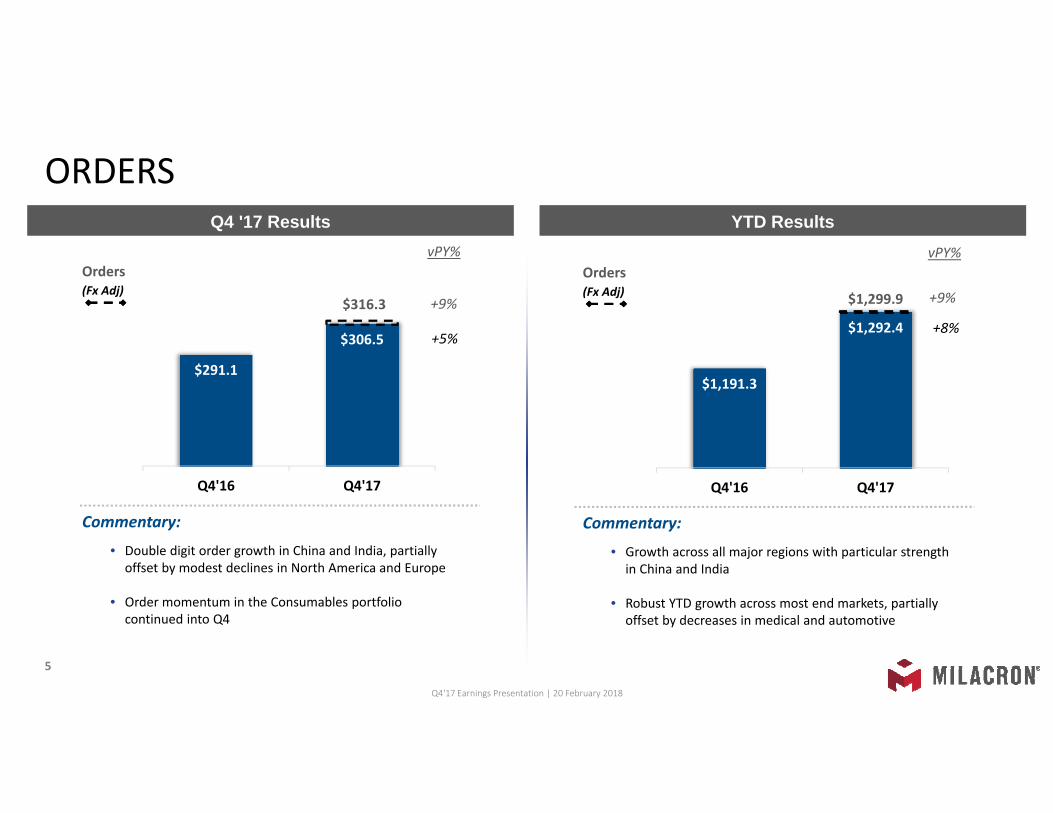
Q4 '17 Results YTD Results
$291.1
$306.5
$316.3
Q4'16 Q4'17
vPY%
+5%
+9%
Commentary:
• Double digit order growth in China and India, partially offset by modest declines in North America and Europe
• Order momentum in the Consumables portfolio continued into Q4
Orders(Fx Adj)
vPY%
+8%
+9%
Commentary:
• Growth across all major regions with particular strength in China and India
• Robust YTD growth across most end markets, partially offset by decreases in medical and automotive
Orders(Fx Adj)
$1,191.3
$1,292.4
$1,299.9
Q4'16 Q4'17
Q4'17 Earnings Presentation | 20 February 2018
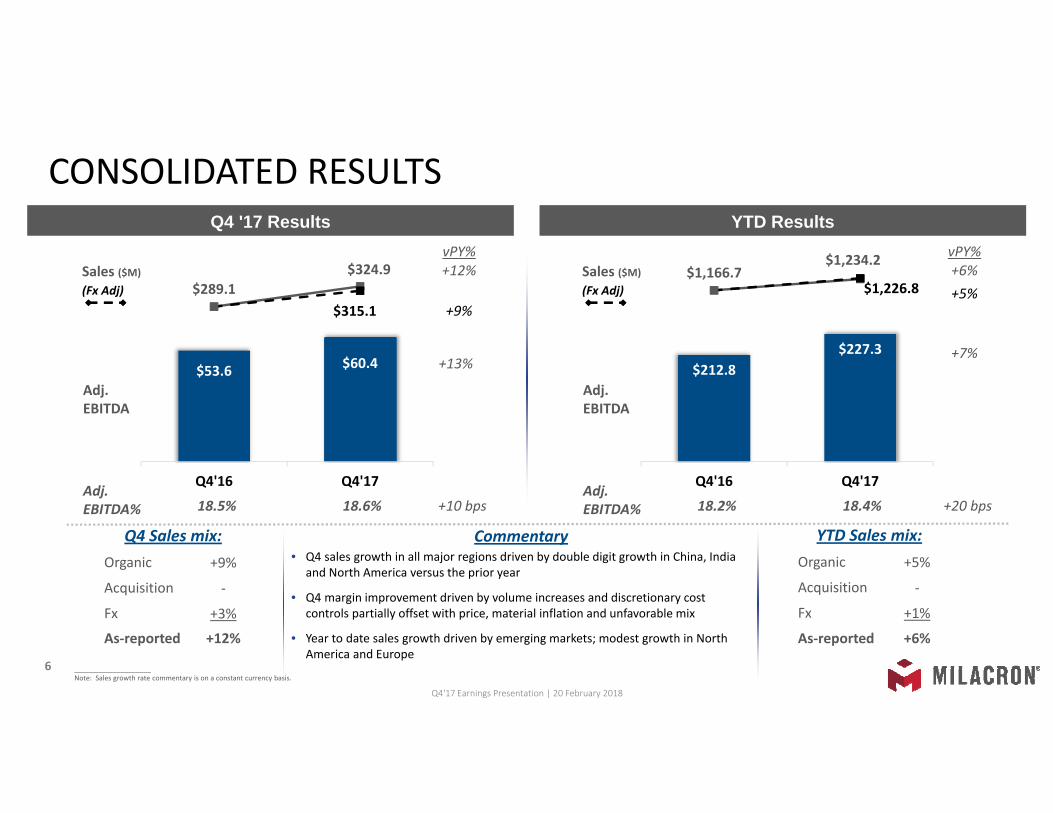
$53.6 $60.4
$289.1$324.9
$315.1
Q4'16 Q4'17
CONSOLIDATED RESULTS
6
Q4 '17 Results YTD ResultsvPY%
+9%
+12%Sales ($M)
(Fx Adj)
Adj.EBITDA
Adj.EBITDA% 18.5% 18.6% +10 bps
+13% $212.8$227.3
$1,166.7$1,226.8
$1,234.2
Q4'16 Q4'17
vPY%
+5%+6%Sales ($M)
(Fx Adj)
Adj.EBITDA
Adj.EBITDA% 18.2% 18.4% +20 bps
+7%
As‐reported
YTD Sales mix:Organic
Acquisition
Fx
As‐reported
+5%
‐
+1%
+6%
CommentaryQ4 Sales mix:Organic
Acquisition
Fx
+9%
‐
+3%
+12%
• Q4 sales growth in all major regions driven by double digit growth in China, India and North America versus the prior year
• Q4 margin improvement driven by volume increases and discretionary cost controls partially offset with price, material inflation and unfavorable mix
• Year to date sales growth driven by emerging markets; modest growth in North America and Europe
____________________Note: Sales growth rate commentary is on a constant currency basis.
Q4'17 Earnings Presentation | 20 February 2018
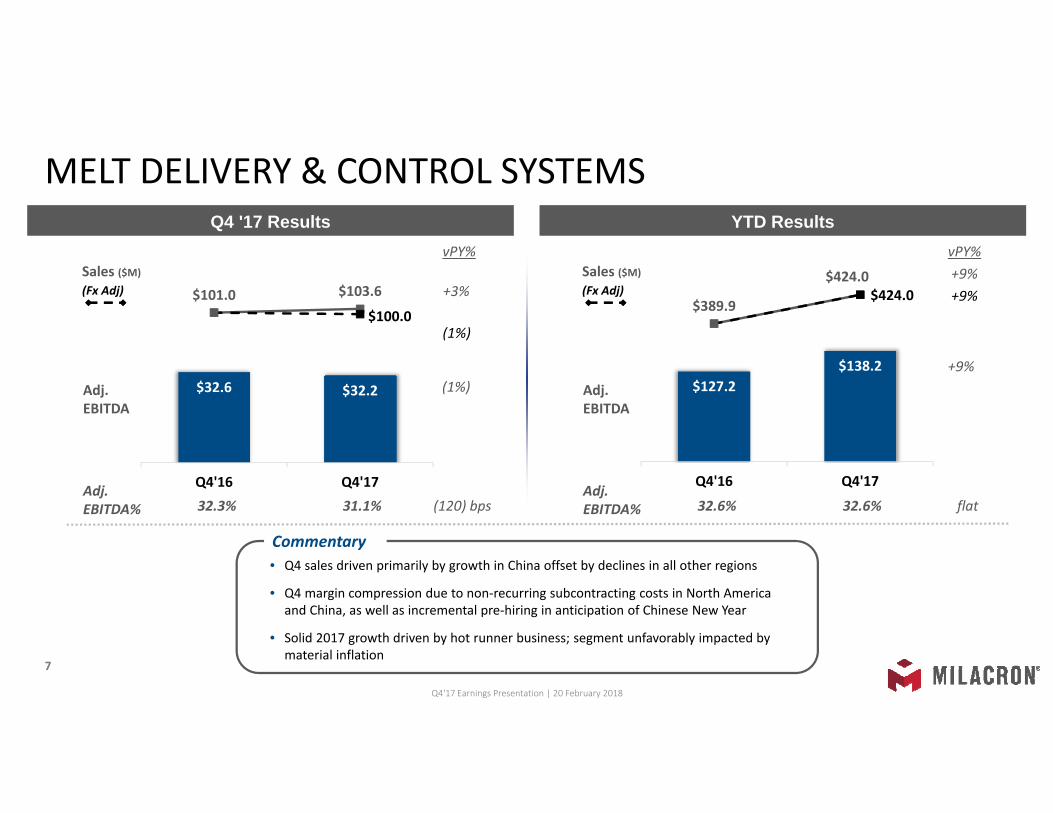
$32.6 $32.2
$101.0 $103.6
$100.0
Q4'16 Q4'17
MELT DELIVERY & CONTROL SYSTEMS
7
Q4 '17 Results YTD Results
Commentary• Q4 sales driven primarily by growth in China offset by declines in all other regions
• Q4 margin compression due to non‐recurring subcontracting costs in North America and China, as well as incremental pre‐hiring in anticipation of Chinese New Year
• Solid 2017 growth driven by hot runner business; segment unfavorably impacted by material inflation
vPY%
(1%)
+3%Sales ($M)
(Fx Adj)
Adj.EBITDA
Adj.EBITDA% 32.3% 31.1% (120) bps
(1%) $127.2$138.2
$389.9$424.0
$424.0
Q4'16 Q4'17
vPY%
+9%+9%Sales ($M)
(Fx Adj)
Adj.EBITDA
Adj.EBITDA% 32.6% 32.6% flat
+9%
Q4'17 Earnings Presentation | 20 February 2018
FLUID TECHNOLOGIES
8
Q4 '17 Results YTD Results
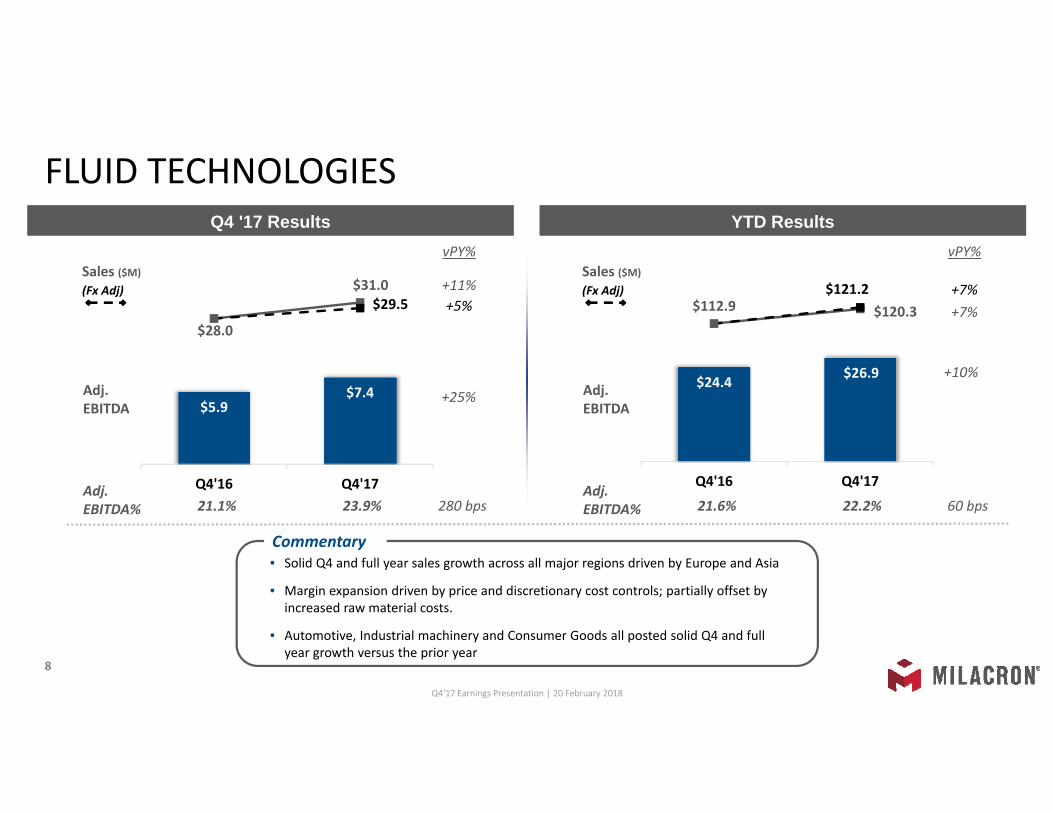
Commentary• Solid Q4 and full year sales growth across all major regions driven by Europe and Asia
• Margin expansion driven by price and discretionary cost controls; partially offset by increased raw material costs.
• Automotive, Industrial machinery and Consumer Goods all posted solid Q4 and full year growth versus the prior year
$5.9$7.4
$28.0
$31.0$29.5
Q4'16 Q4'17
vPY%
+5%+11%
Sales ($M)
(Fx Adj)
Adj.EBITDA
Adj.EBITDA% 21.1% 23.9% 280 bps
+25%$24.4 $26.9
$112.9 $120.3$121.2
Q4'16 Q4'17
vPY%
+7%+7%
Sales ($M)
(Fx Adj)
Adj.EBITDA
Adj.EBITDA% 21.6% 22.2% 60 bps
+10%
Q4'17 Earnings Presentation | 20 February 2018
ADVANCED PLASTICS PROCESSING TECHNOLOGIES
9
Q2' 17 Results YTD Results
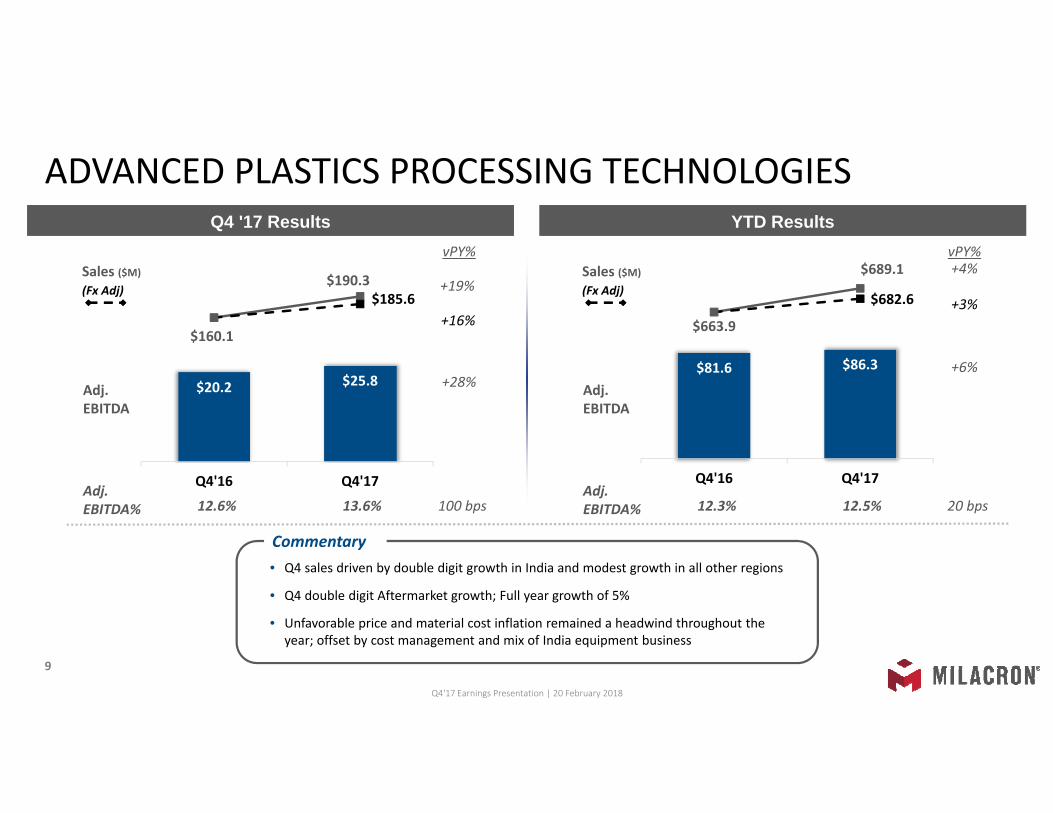
Commentary• Q4 sales driven by double digit growth in India and modest growth in all other regions
• Q4 double digit Aftermarket growth; Full year growth of 5%
• Unfavorable price and material cost inflation remained a headwind throughout the year; offset by cost management and mix of India equipment business
$20.2 $25.8
$160.1
$190.3$185.6
Q4'16 Q4'17
Q4 '17 Results YTD ResultsvPY%
+19%
+16%
Sales ($M)
(Fx Adj)
Adj.EBITDA
Adj.EBITDA% 12.6% 13.6% 100 bps
+28%$81.6 $86.3
$663.9
$689.1
$682.6
Q4'16 Q4'17
vPY%
+3%
+4%Sales ($M)
(Fx Adj)
Adj.EBITDA
Adj.EBITDA% 12.3% 12.5% 20 bps
+6%
Q4'17 Earnings Presentation | 20 February 2018
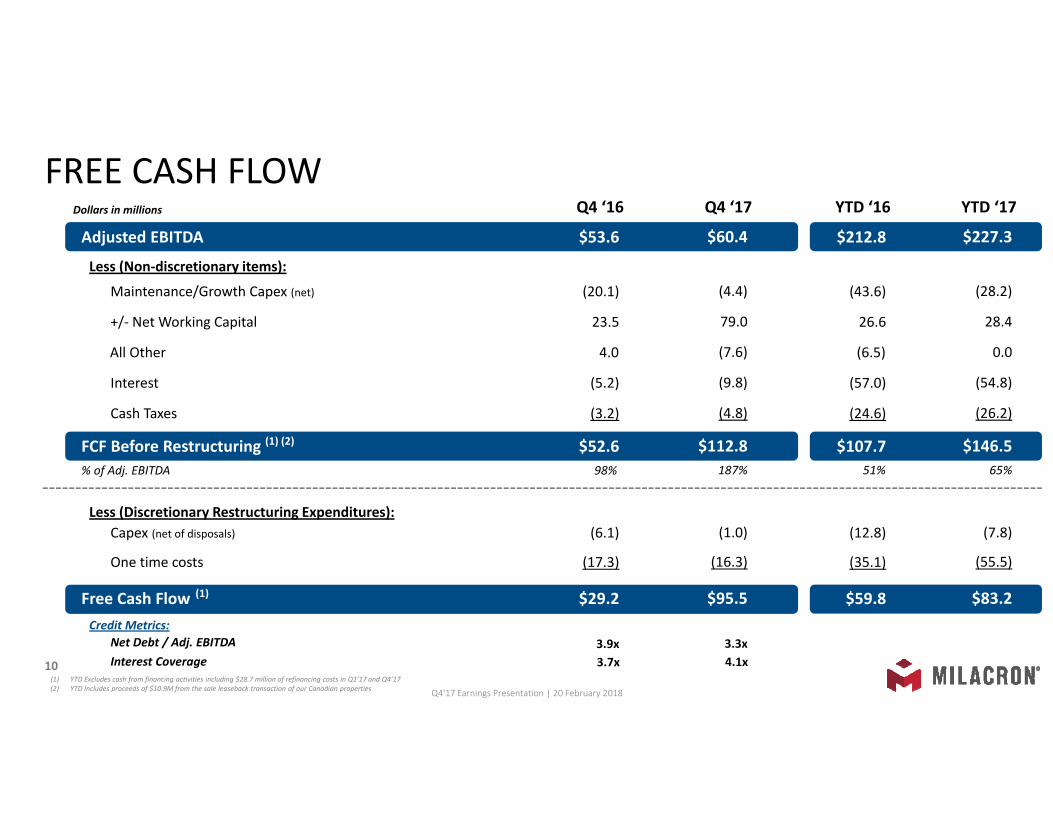
FREE CASH FLOW
10
Adjusted EBITDA $53.6
Less (Non‐discretionary items):
Maintenance/Growth Capex (net)
+/‐ Net Working Capital
(20.1)
23.5
FCF Before Restructuring (1) (2) $52.6
Less (Discretionary Restructuring Expenditures):
Interest
Cash Taxes
(5.2)
(3.2)
Free Cash Flow (1) $29.2
One time costs (17.3)
% of Adj. EBITDA 98%
Dollars in millions Q4 ‘16 Q4 ‘17
$60.4
(4.4)
79.0
$112.8
(9.8)
(4.8)
$95.5
(16.3)
187%
All Other 4.0 (7.6)
Capex (net of disposals) (6.1) (1.0)
Credit Metrics:Net Debt / Adj. EBITDAInterest Coverage
3.9x 3.3x3.7x 4.1x
(1) YTD Excludes cash from financing activities including $28.7 million of refinancing costs in Q1’17 and Q4’17(2) YTD Includes proceeds of $10.9M from the sale leaseback transaction of our Canadian properties
$212.8
(43.6)
26.6
$107.7
(57.0)
(24.6)
$59.8
(35.1)
YTD ‘16 YTD ‘17
$227.3
(28.2)
28.4
$146.5
(54.8)
(26.2)
$83.2
(55.5)
65%
(6.5) 0.0
(12.8) (7.8)
51%
Q4'17 Earnings Presentation | 20 February 2018
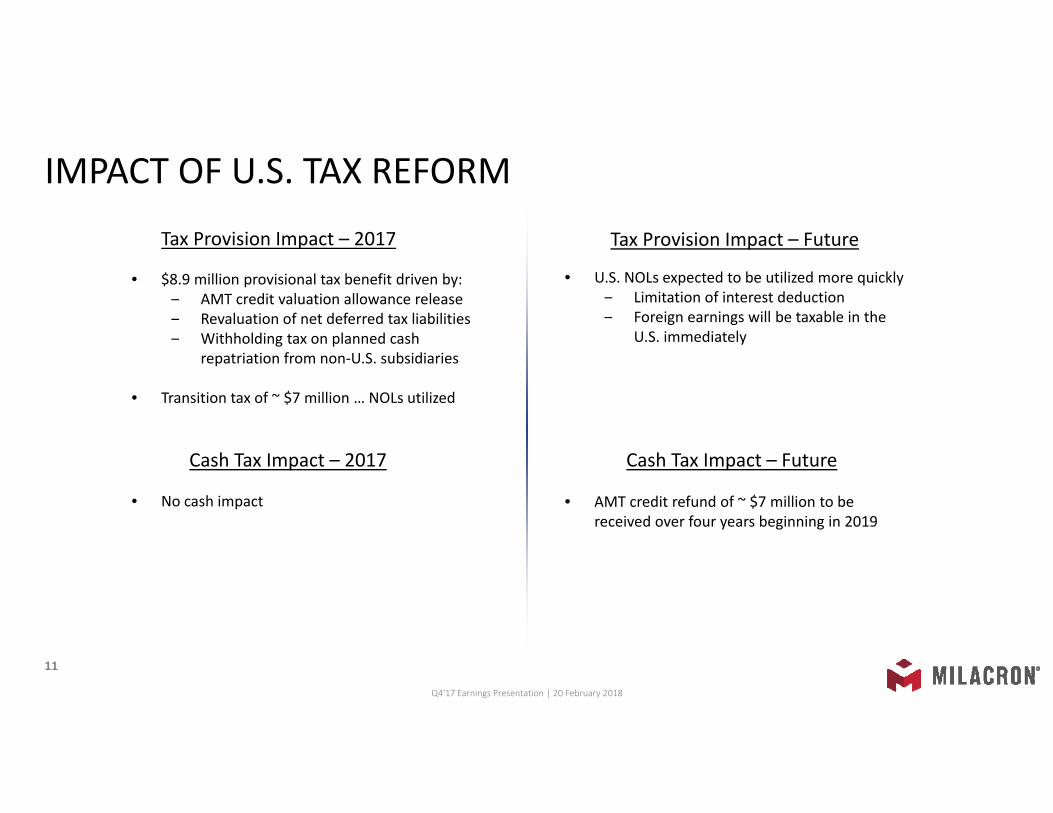
IMPACT OF U.S. TAX REFORM
11
Q4'17 Earnings Presentation | 20 February 2018
Tax Provision Impact – 2017
Cash Tax Impact – 2017
Tax Provision Impact – Future
Cash Tax Impact – Future
• $8.9 million provisional tax benefit driven by:‒ AMT credit valuation allowance release‒ Revaluation of net deferred tax liabilities‒ Withholding tax on planned cash
repatriation from non‐U.S. subsidiaries
• Transition tax of ~ $7 million … NOLs utilized
• No cash impact
• U.S. NOLs expected to be utilized more quickly‒ Limitation of interest deduction‒ Foreign earnings will be taxable in the
U.S. immediately
• AMT credit refund of ~ $7 million to be received over four years beginning in 2019
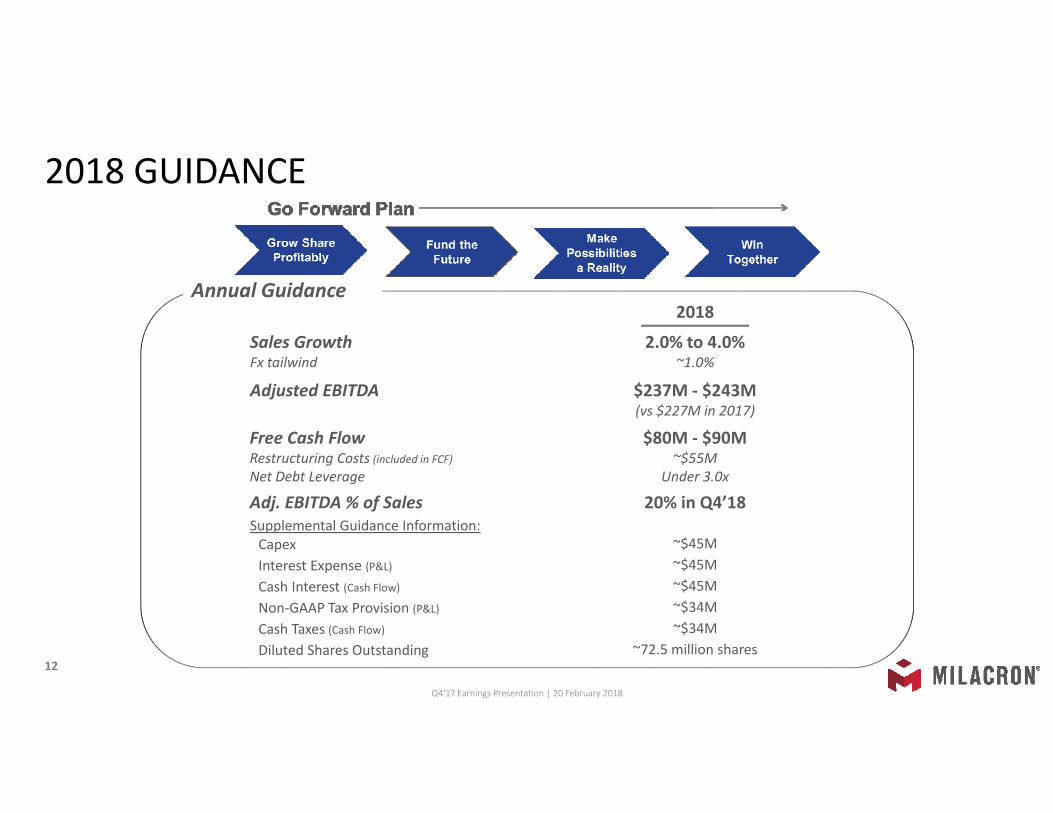
2018 GUIDANCE
12
Sales GrowthFx tailwind
Adjusted EBITDA
2018
2.0% to 4.0%~1.0%
$237M ‐ $243M(vs $227M in 2017)
Annual Guidance
Supplemental Guidance Information:CapexInterest Expense (P&L)
Cash Taxes (Cash Flow)Diluted Shares Outstanding
~$45M~$45M
~$34M~72.5 million shares
Free Cash Flow Restructuring Costs (included in FCF)Net Debt Leverage
$80M ‐ $90M~$55M
Under 3.0x
Cash Interest (Cash Flow) ~$45MNon‐GAAP Tax Provision (P&L) ~$34M
Q4'17 Earnings Presentation | 20 February 2018
Adj. EBITDA % of Sales 20% in Q4’18
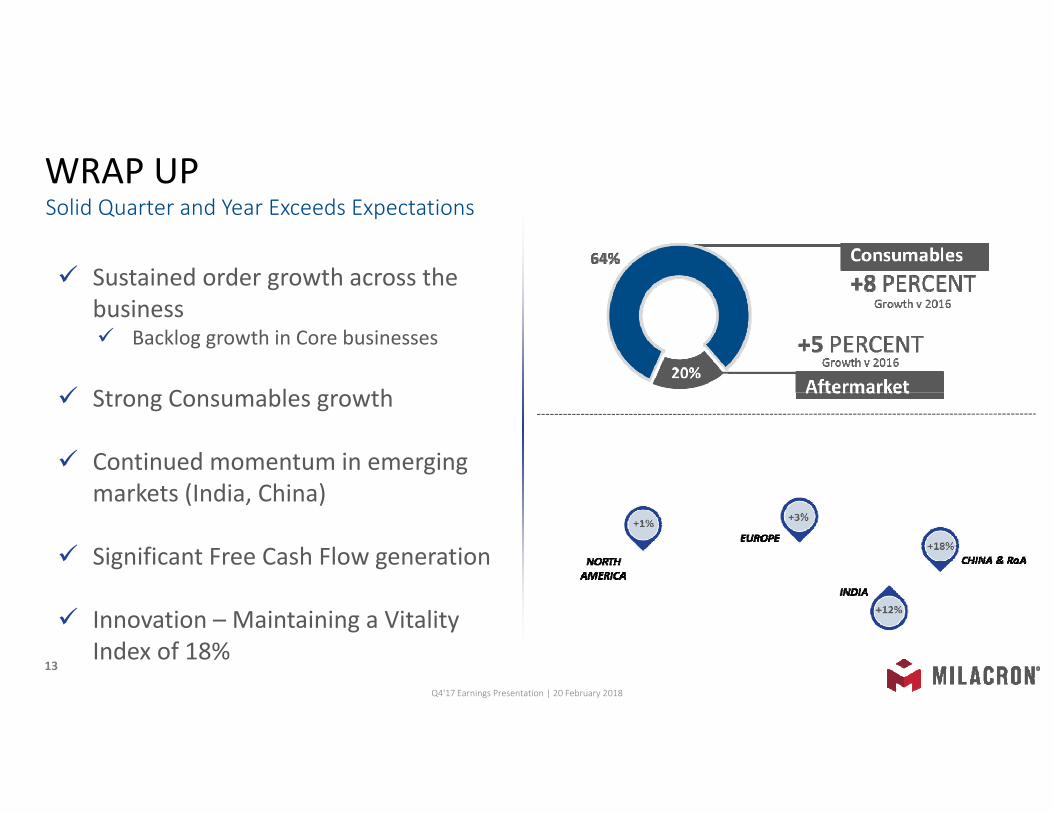
WRAP UP
13
Solid Quarter and Year Exceeds Expectations
Sustained order growth across the business Backlog growth in Core businesses
Strong Consumables growth
Continued momentum in emerging markets (India, China)
Significant Free Cash Flow generation
Innovation – Maintaining a Vitality Index of 18%
Q4'17 Earnings Presentation | 20 February 2018
14
APPENDIX
Q4'17 Earnings Presentation | 20 February 2018
15
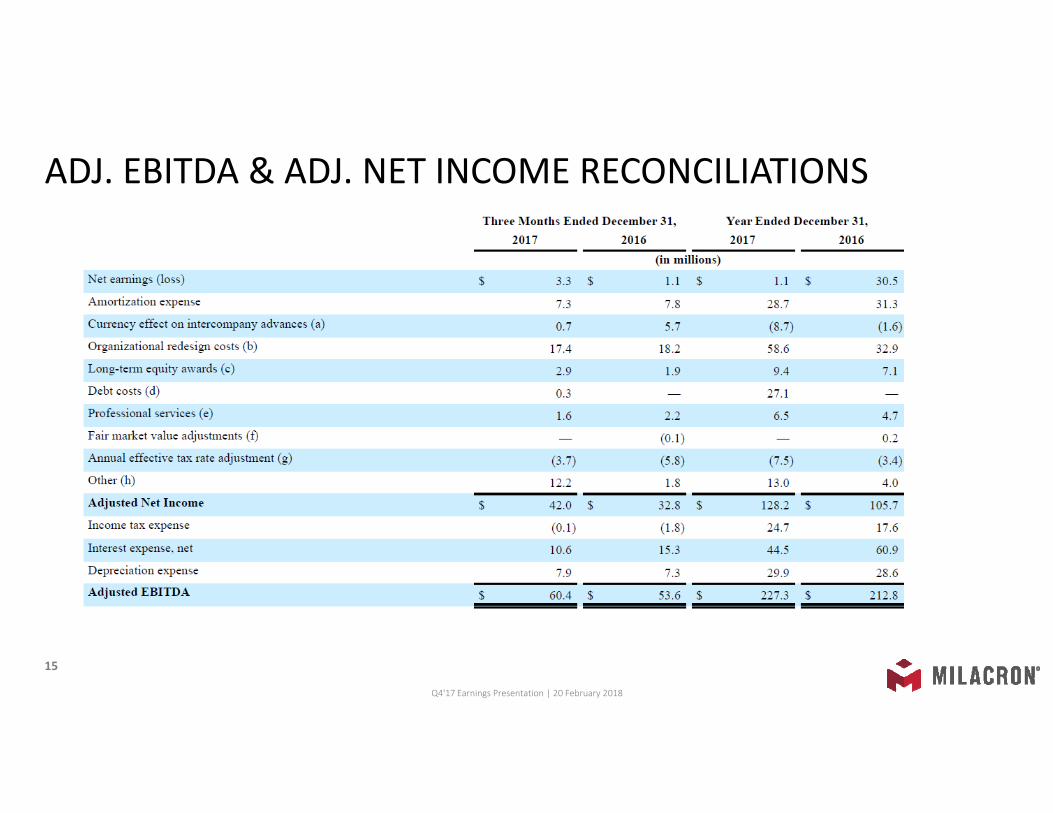
ADJ. EBITDA & ADJ. NET INCOME RECONCILIATIONS
Q4'17 Earnings Presentation | 20 February 2018
16
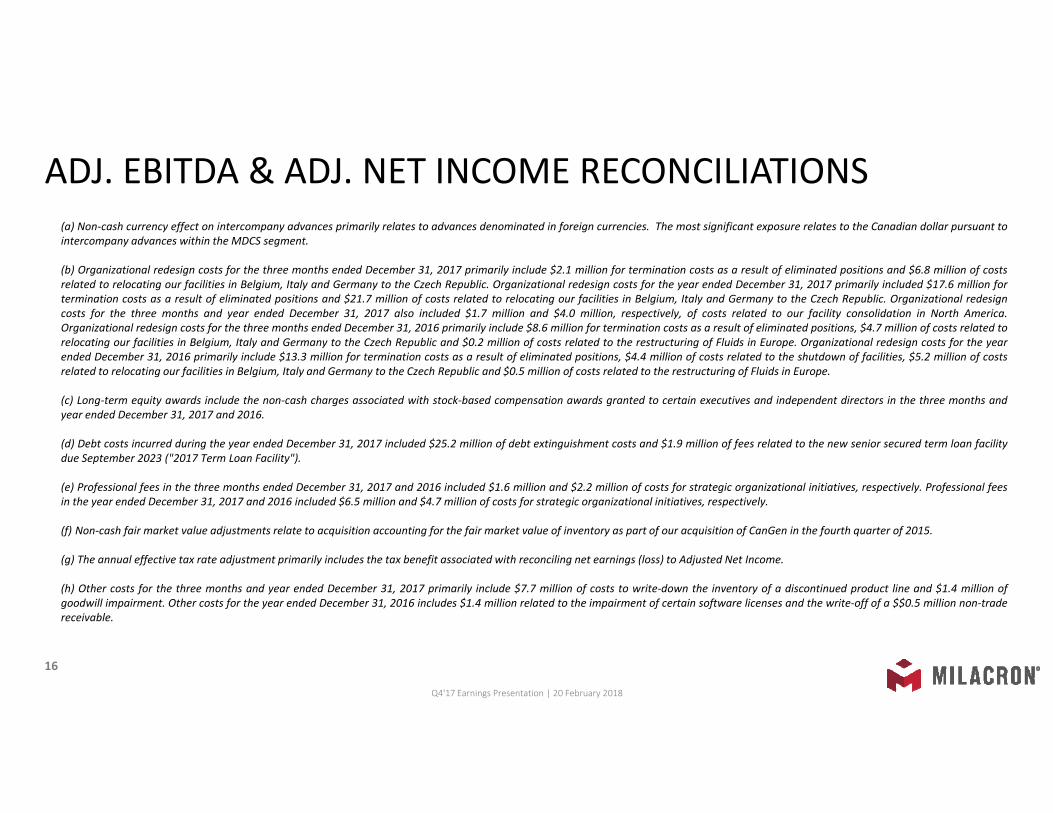
ADJ. EBITDA & ADJ. NET INCOME RECONCILIATIONS(a) Non‐cash currency effect on intercompany advances primarily relates to advances denominated in foreign currencies. The most significant exposure relates to the Canadian dollar pursuant tointercompany advances within the MDCS segment.
(b) Organizational redesign costs for the three months ended December 31, 2017 primarily include $2.1 million for termination costs as a result of eliminated positions and $6.8 million of costsrelated to relocating our facilities in Belgium, Italy and Germany to the Czech Republic. Organizational redesign costs for the year ended December 31, 2017 primarily included $17.6 million fortermination costs as a result of eliminated positions and $21.7 million of costs related to relocating our facilities in Belgium, Italy and Germany to the Czech Republic. Organizational redesigncosts for the three months and year ended December 31, 2017 also included $1.7 million and $4.0 million, respectively, of costs related to our facility consolidation in North America.Organizational redesign costs for the three months ended December 31, 2016 primarily include $8.6 million for termination costs as a result of eliminated positions, $4.7 million of costs related torelocating our facilities in Belgium, Italy and Germany to the Czech Republic and $0.2 million of costs related to the restructuring of Fluids in Europe. Organizational redesign costs for the yearended December 31, 2016 primarily include $13.3 million for termination costs as a result of eliminated positions, $4.4 million of costs related to the shutdown of facilities, $5.2 million of costsrelated to relocating our facilities in Belgium, Italy and Germany to the Czech Republic and $0.5 million of costs related to the restructuring of Fluids in Europe.
(c) Long‐term equity awards include the non‐cash charges associated with stock‐based compensation awards granted to certain executives and independent directors in the three months andyear ended December 31, 2017 and 2016.
(d) Debt costs incurred during the year ended December 31, 2017 included $25.2 million of debt extinguishment costs and $1.9 million of fees related to the new senior secured term loan facilitydue September 2023 ("2017 Term Loan Facility").
(e) Professional fees in the three months ended December 31, 2017 and 2016 included $1.6 million and $2.2 million of costs for strategic organizational initiatives, respectively. Professional feesin the year ended December 31, 2017 and 2016 included $6.5 million and $4.7 million of costs for strategic organizational initiatives, respectively.
(f) Non‐cash fair market value adjustments relate to acquisition accounting for the fair market value of inventory as part of our acquisition of CanGen in the fourth quarter of 2015.
(g) The annual effective tax rate adjustment primarily includes the tax benefit associated with reconciling net earnings (loss) to Adjusted Net Income.
(h) Other costs for the three months and year ended December 31, 2017 primarily include $7.7 million of costs to write‐down the inventory of a discontinued product line and $1.4 million ofgoodwill impairment. Other costs for the year ended December 31, 2016 includes $1.4 million related to the impairment of certain software licenses and the write‐off of a $$0.5 million non‐tradereceivable.
Q4'17 Earnings Presentation | 20 February 2018
17
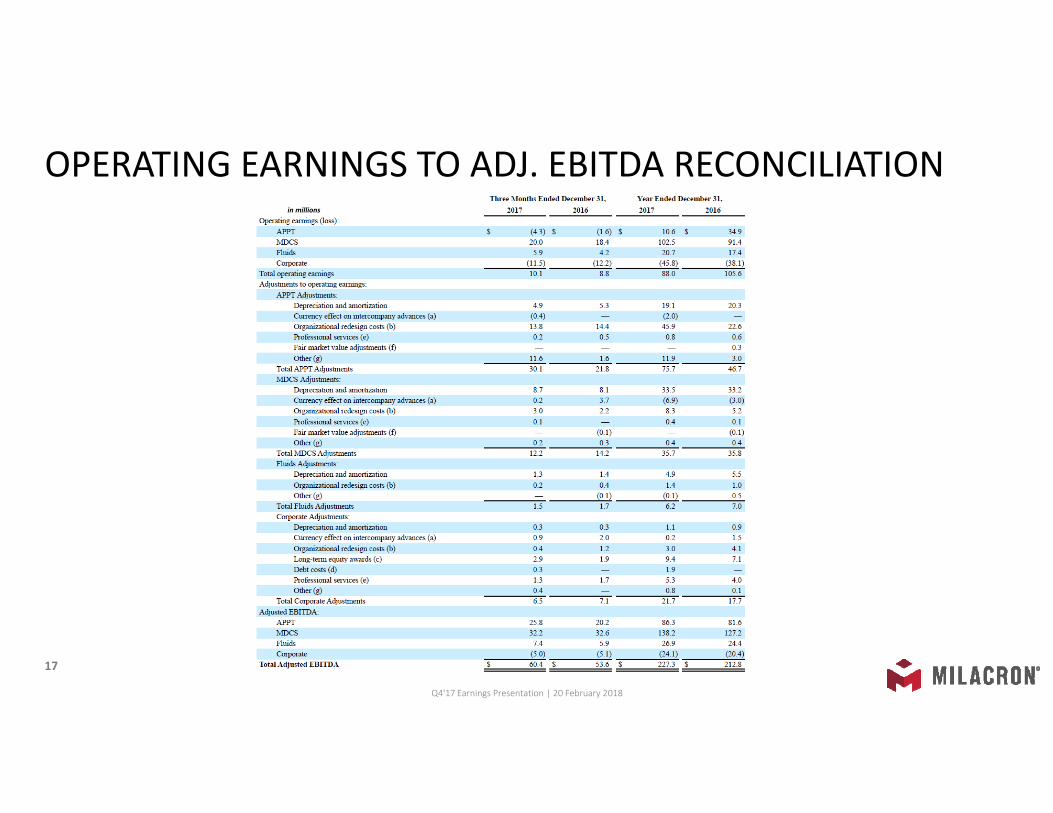
OPERATING EARNINGS TO ADJ. EBITDA RECONCILIATION
Q4'17 Earnings Presentation | 20 February 2018
in millions
18
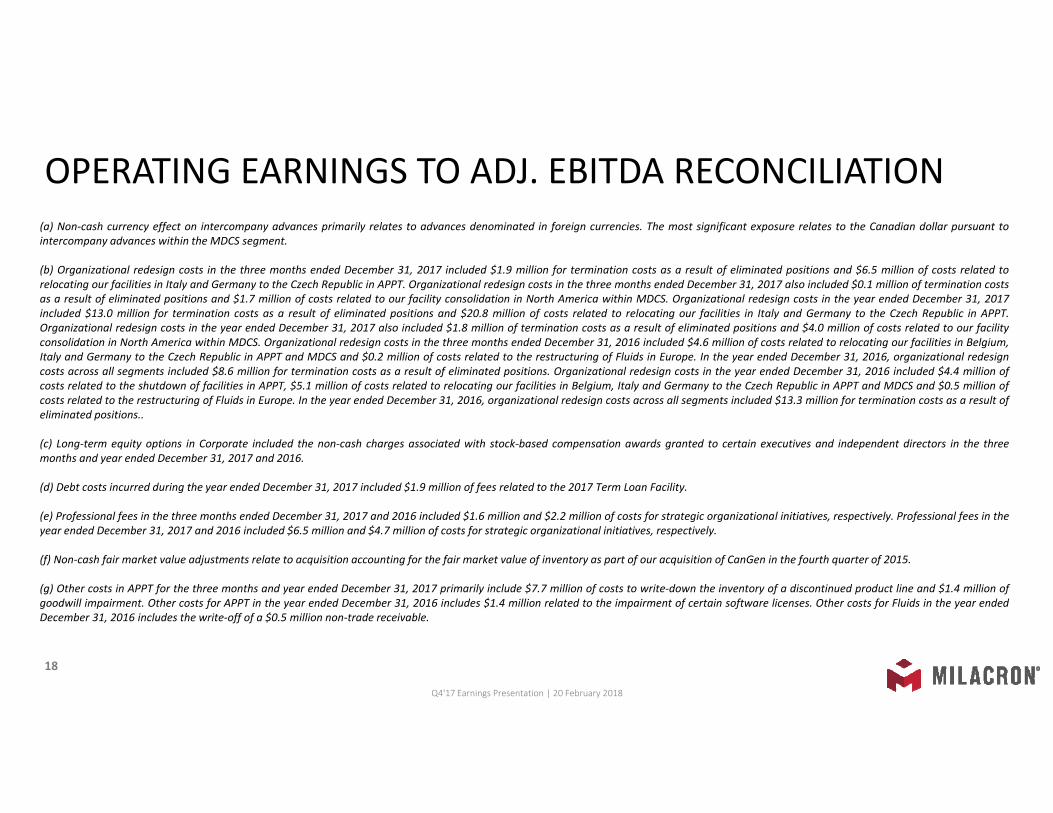
OPERATING EARNINGS TO ADJ. EBITDA RECONCILIATION(a) Non‐cash currency effect on intercompany advances primarily relates to advances denominated in foreign currencies. The most significant exposure relates to the Canadian dollar pursuant tointercompany advances within the MDCS segment.
(b) Organizational redesign costs in the three months ended December 31, 2017 included $1.9 million for termination costs as a result of eliminated positions and $6.5 million of costs related torelocating our facilities in Italy and Germany to the Czech Republic in APPT. Organizational redesign costs in the three months ended December 31, 2017 also included $0.1 million of termination costsas a result of eliminated positions and $1.7 million of costs related to our facility consolidation in North America within MDCS. Organizational redesign costs in the year ended December 31, 2017included $13.0 million for termination costs as a result of eliminated positions and $20.8 million of costs related to relocating our facilities in Italy and Germany to the Czech Republic in APPT.Organizational redesign costs in the year ended December 31, 2017 also included $1.8 million of termination costs as a result of eliminated positions and $4.0 million of costs related to our facilityconsolidation in North America within MDCS. Organizational redesign costs in the three months ended December 31, 2016 included $4.6 million of costs related to relocating our facilities in Belgium,Italy and Germany to the Czech Republic in APPT and MDCS and $0.2 million of costs related to the restructuring of Fluids in Europe. In the year ended December 31, 2016, organizational redesigncosts across all segments included $8.6 million for termination costs as a result of eliminated positions. Organizational redesign costs in the year ended December 31, 2016 included $4.4 million ofcosts related to the shutdown of facilities in APPT, $5.1 million of costs related to relocating our facilities in Belgium, Italy and Germany to the Czech Republic in APPT and MDCS and $0.5 million ofcosts related to the restructuring of Fluids in Europe. In the year ended December 31, 2016, organizational redesign costs across all segments included $13.3 million for termination costs as a result ofeliminated positions..
(c) Long‐term equity options in Corporate included the non‐cash charges associated with stock‐based compensation awards granted to certain executives and independent directors in the threemonths and year ended December 31, 2017 and 2016.
(d) Debt costs incurred during the year ended December 31, 2017 included $1.9 million of fees related to the 2017 Term Loan Facility.
(e) Professional fees in the three months ended December 31, 2017 and 2016 included $1.6 million and $2.2 million of costs for strategic organizational initiatives, respectively. Professional fees in theyear ended December 31, 2017 and 2016 included $6.5 million and $4.7 million of costs for strategic organizational initiatives, respectively.
(f) Non‐cash fair market value adjustments relate to acquisition accounting for the fair market value of inventory as part of our acquisition of CanGen in the fourth quarter of 2015.
(g) Other costs in APPT for the three months and year ended December 31, 2017 primarily include $7.7 million of costs to write‐down the inventory of a discontinued product line and $1.4 million ofgoodwill impairment. Other costs for APPT in the year ended December 31, 2016 includes $1.4 million related to the impairment of certain software licenses. Other costs for Fluids in the year endedDecember 31, 2016 includes the write‐off of a $0.5 million non‐trade receivable.
Q4'17 Earnings Presentation | 20 February 2018
19
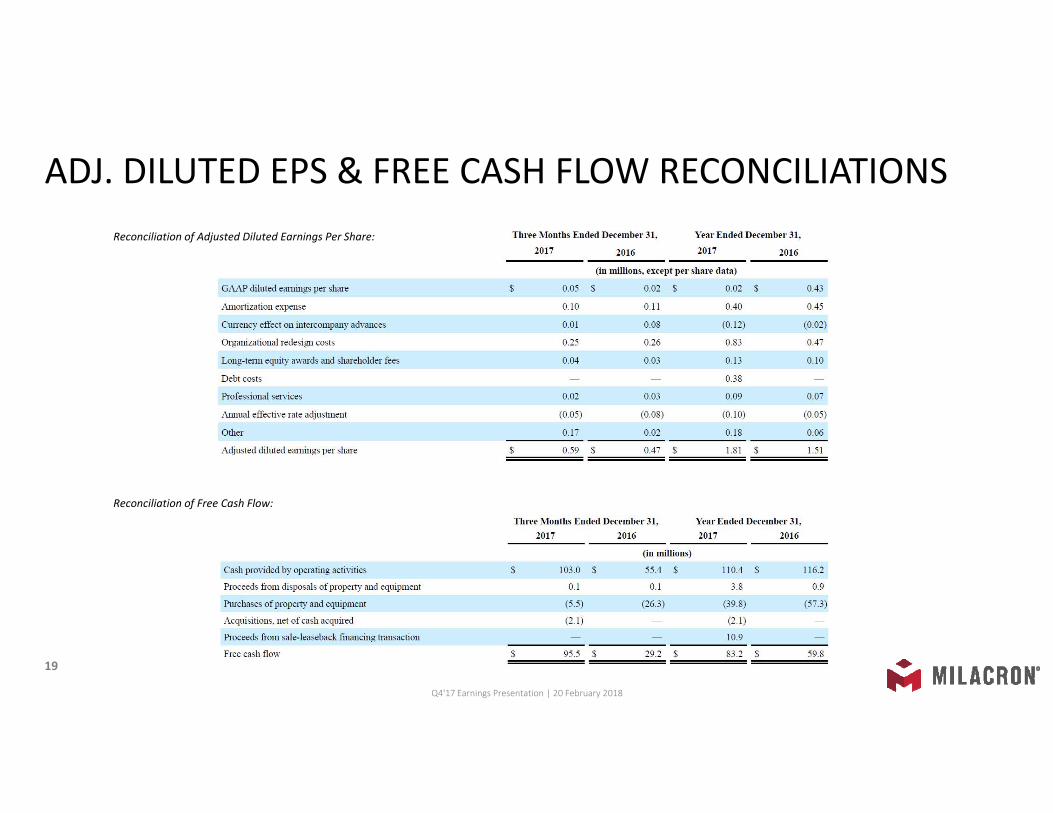
ADJ. DILUTED EPS & FREE CASH FLOW RECONCILIATIONS
Q4'17 Earnings Presentation | 20 February 2018
Reconciliation of Free Cash Flow:
Reconciliation of Adjusted Diluted Earnings Per Share: