q3 2017 results call nov 9 2017 conf call
TRANSCRIPT

2017 Q3 Results
NOVEMBER 9, 2017

Certain statements contained in this presentation may be deemed "forward-looking statements". All statements in this release, other than statements of historical fact, that address future events, developments or performancethat Osisko (the “Corporation”) expect to occur, including managements’ expectations regarding the Corporation’s growth, results of operations, estimated future revenues, statements or estimates of mineral resources and reserves,requirements for additional capital, future demand for and prices of commodities, business prospects and opportunities are forward looking statements. Forward looking statements are statements that are not historical facts and aregenerally, but not always, identified by the words "expects", "plans", "anticipates", "believes", "intends", "estimates", "projects", "potential", "scheduled" and similar expressions or variations (including negative variations), or that events orconditions "will", "would", "may", "could" or "should" occur including, without limitation, that all conditions precedent a transaction will be met and the realization of the anticipated benefits deriving therefrom for shareholders of theCorporation, the view on the quality and the potential of the Corporation’s assets, production forecasts for properties in which the Corporation holds a royalty or other interest. Although the Corporation believes the expectations expressed insuch forward-looking statements are based on reasonable assumptions, such statements involve known and unknown risks, uncertainties and other factors and are not guarantees of future performance and actual results may accordinglydiffer materially from those in forward looking statements. Factors that could cause the actual results to differ materially from those in forward-looking statements include, without limitation: fluctuations in the prices of the commodities thatdrive royalties held by the Corporation; fluctuations in the value of the Canadian dollar relative to the U.S. dollar; risks related to the operators of the properties in which the Corporation holds a royalty or other interest; the unfavorableoutcome of litigation relating to any of the properties in which Osisko holds a royalty or other interest; development, permitting, infrastructure, operating or technical difficulties on any of the properties in which the Corporation hold a royaltyor other interest; rate and timing of production differences from mineral resource estimates or production forecasts by operators of properties in which the Corporation hold a royalty or other interest; risks and hazards associated with thebusiness of exploring, development and mining on any of the properties in which the Corporation hold a royalty or other interest, including, but not limited to unusual or unexpected geological and metallurgical conditions, slope failures orcave-ins, flooding and other natural disasters or civil unrest; regulatory changes by national and local government, including corporate law, permitting and licensing regimes and taxation policies; regulations and political or economicdevelopments in any of the countries where properties in which the Corporation hold a royalty or other interest are located or through which they are held); continued availability of capital and financing and general economic, market orbusiness conditions; business opportunities that become available to, or are pursued by the Corporation; the impossibility to acquire royalties and to fund precious metal streams; other uninsured risks. The forward looking statementscontained in this presentation are based upon assumptions management believes to be reasonable, including, without limitation: the ongoing operation of the properties in which the Corporation holds a royalty or other interest by theowners or operators of such properties in a manner consistent with past practice; the accuracy of public statements and disclosures made by the owners or operators of such underlying properties; no material adverse change in the marketprice of the commodities that underlie the asset portfolio; no adverse development in respect of any significant property in which the Corporation holds a royalty, stream or other interest; the accuracy of publicly disclosed expectations forthe development of underlying properties that are not yet in production; and the absence of any other factors that could cause actions, events or results to differ from those anticipated, estimated or intended. For additional information onrisks, uncertainties and assumptions, please refer to the Corporation’s most recent Annual Information Form filed on SEDAR at www.sedar.com. The Corporation cautions that the foregoing list of risk and uncertainties is not exhaustive.Investors and others who base themselves on the forward looking statements contained herein should carefully consider the above factors as well as the uncertainties they represent and the risk they entail. The Corporation believes that theexpectations reflected in those forward-looking statements are reasonable, but no assurance can be given that these expectations will prove to be correct and such forward-looking statements included in this presentation should not beunduly relied upon. These statements speak only as of the date of this presentation. The Corporation undertakes no obligation to publicly update or revise any forward-looking statements, whether as a result of new information, futureevents or otherwise, other than as required by applicable law.
Safe Harbour Statement
This PowerPoint presentation has been prepared for informational purposes only in order to assist prospective investors in evaluating an investment in Osisko Gold Royalties Ltd.Inquiries regarding this confidential PowerPoint presentation can be made to the senior management of the Corporation.
Cautionary Note to U.S. Investors Regarding Mineral Reserve and Mineral Resource Estimates
Osisko is subject to the reporting requirements of the applicable Canadian securities laws, and as a result, reports its mineral resources and reserves according to Canadian standards. Canadian reporting requirements for disclosure of mineralproperties are governed by National Instrument 43-101 (“NI 43-101”). The definitions of NI 43-101 are adopted from those given by the Canadian Institute of Mining, Metallurgy and Petroleum (“CIM”). U.S. reporting requirements aregoverned by the Industry Guide 7 (“Guide 7”) of the Security and Exchange Commission ("SEC"). This presentation includes estimates of mineral reserves and mineral resources reported in accordance with NI 43-101. These reportingstandards have similar goals in terms of conveying an appropriate level of confidence in the disclosures being reported, but embody different approaches and definitions. For example, under Guide 7, mineralization may not be classified as a“reserve” unless the determination has been made that the mineralization could be economically and legally produced or extracted at the time the reserve determination is made. Consequently, the definitions of “Proven Mineral Reserves”and “Probable Mineral Reserves” under CIM standards differ in certain respects from the standards of the SEC. Osisko also reports estimates of “mineral resources” in accordance with NI 43-101. While the terms “Mineral Resource,”“Measured Mineral Resource,” “Indicated Mineral Resource” and “Inferred Mineral Resource” are recognized by NI 43-101, they are not defined terms under standards of the SEC and, generally, U.S. companies are not permitted to reportestimates of mineral resources of any category in documents filed with the SEC. As such, certain information contained in this presentation concerning descriptions of mineralization and estimates of mineral reserves and mineral resourcesunder Canadian standards is not comparable to similar information made public by United States companies subject to the reporting and disclosure requirements of the SEC. Readers are cautioned not to assume that all or any part ofMeasured Mineral Resources or Indicated Mineral Resource exists, or is economically or legally mineable. Further, an “Inferred Mineral Resource” has a great amount of uncertainty as to its existence and as to its economic and legalfeasibility, and a reader cannot assume that all or any part of an Inferred Mineral Resource will ever be upgraded to a higher category. Under Canadian rules, estimates of Inferred Mineral Resources may not form the basis of feasibility orother economic studies.
Forward Looking Statements
2

Q3 Highlights
3
Q3 2017 On July 31, 2017, Osisko closed the acquisition of a precious
metals portfolio of assets from Orion for $1.1 billion- Consisting of 74 royalties, streams and precious metal
offtakes, including a 9.6% diamond stream on the Renarddiamond mine and a 4% gold and silver stream on the Brucejack gold and silver mine, both of which are new mines in Canada, in addition to a 100% silver stream on the Mantos Blancos copper mine in Chile;
Declaration of a quarterly dividend of $0.05 per common share payable on October 16, 2017 to shareholders of record as of the close of business on September 30, 2017, representing a 25% increase from the previous quarter;
On November 3, 2017, Osisko closed a bought deal offering of convertible senior unsecured debentures of $300 million
On November 8, 2017, declaration of a quarterly dividend of $0.05 per common share payable on January 15, 2018 to shareholders of record as of the close of business on December 29, 2017
The payment will result in approximately $55 million being distributed to our shareholders since our commencement of activities in June 2014
On November 8, 2017, announced US$65 million gold stream and private placement with Aquila Resources
Subsequent to Sep. 30, 2017

Transaction with Aquila Resources
4
US$55M gold stream referenced to Aquila’s flagship Back Forty Project in Michigan, USA
Osisko entitled to 18.5% of payable gold until 105k oz have been delivered, and 9.25% thereafter for the life-of-mine
Staged upfront deposit payable at pre-determined project milestones, and ongoing payments equal to 30% of spot gold to a maximum of US$600/oz
Concurrent US$10M equity private placement in Aquila for ~15% pro forma ownership interest 1
Adding to Osisko’s existing 75% silver stream on Back Forty
1. Assuming existing top-up rights are exercised.
Transaction Summary Significant streaming interest on an
advanced-stage North American project
Mid-term cash flow from a premier jurisdiction
Upside potential through further exploration of the Project
Maintains Osisko’s focus on low-risk jurisdictions
Adds value to Osisko’s existing silver stream on the Project
Execution on new pipeline of opportunities acquired through Orion transaction
Leveraging new partnerships acquired through Orion transaction

5
Back Forty Project
HIGH-GRADE, POLYMETALLIC ASSET IN ADVANCED STAGE OF PERMITTING
OsiskoInterest:
18.5% stream on gold production until 105k ozAu delivered; 9.25% thereafter75% stream on LOM silver production
Location: Michigan, USA
Primary Commodity: Zinc, Gold
Mineral Resources:
M&I: 1.0Bn lbs Zn, 1.0M oz Au, 11.9M oz AgInferred: 113M lbs Zn, 0.2M oz Au, 2.0M oz Ag
Total Payable Production(PEA):
Gold: 532,000 ouncesSilver: 4,645,000 ounces
Feasibility study in progress
Strong economics based on PEA
Main deposit open at depth, with potential to extend mine life and enhance project economics
Granted three of four main permits, with Wetlands Protection Permit application in progress
Benefit from infrastructure advantage
Attractive consolidation target in base metals space
Source: Company disclosure.

Q3 Financial Highlights
6
Record quarterly gold equivalent ounces (“GEOs”) earned of 16,6641
- 65% increase compared to Q3 20162;
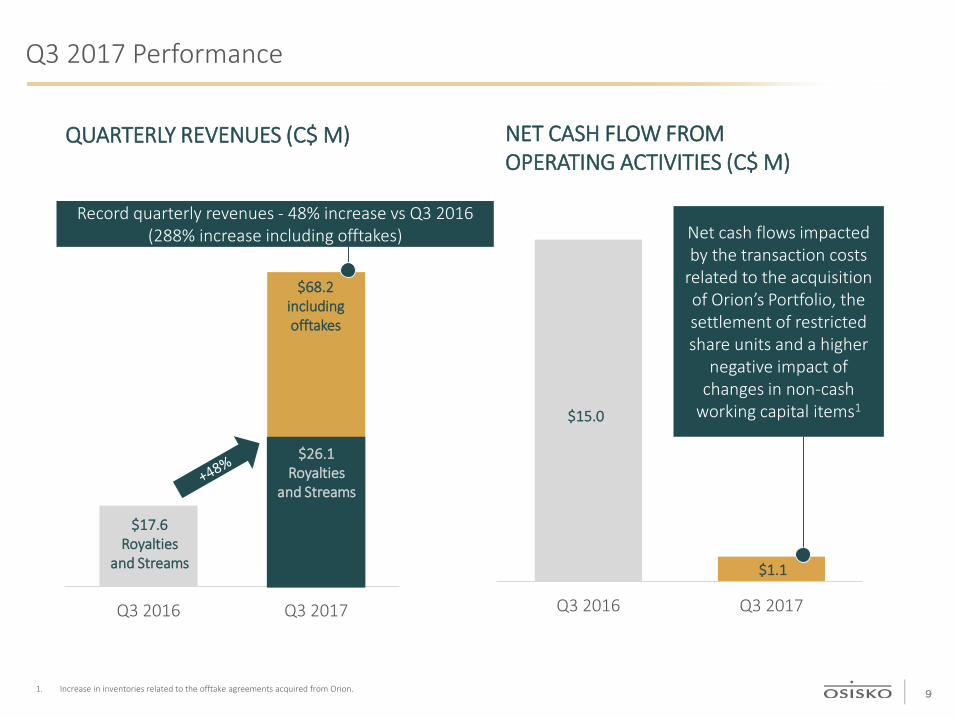
Record quarterly revenues from royalties and streams of $26.1 million ($68.2 million including offtakes)- 48% increase compared to Q3 2016 (288% increase including offtakes);
Net cash flows provided by operating activities of $1.1 million- compared to $15.0 million in Q3 2016;
Net earnings attributable to Osisko’s shareholders of $6.7 million, $0.05 per basic share (compared to $17.8 million, $0.17 per basic share in Q3 2016); and
Adjusted earnings3 of $8.0 million, $0.06 per basic share3 (compared to $12.0 million, $0.11 per basic share in Q3 2016).
1. GEOs include royalties, streams and offtakes. Silver was converted to gold equivalent ounces by multiplying the silver ounces by the average silver price for the period and dividing by the average gold price for the period. Diamonds, other metals and cash royalties were converted into gold equivalent ounces by dividing the associated revenue by the average gold price for the period. . Offtake agreements were converted using the financial settlement equivalent divided by the average gold price for the period. Refer to the portfolio of royalty, stream and other interests section for average metal prices used.
2. Three months ended September 30, 2016 or third quarter of 2016 (“Q3 2016”).3. “Adjusted earnings” and “Adjusted earnings per basic share” are non-IFRS financial performance measures which have no standard definition under IFRS. Refer to the non-IFRS measures provided
under the Non-IFRS Financial Performance Measures section of this Management’s Discussion and Analysis.

Q3 2016 Q3 2017
7
Q3 2017 Performance
GOLD EQUIVALENT OUNCES (GEOs1)EARNED (oz AuEq)
65% increase year over year in GEOs during Q3
1. GEOs include royalties, streams and offtakes. Silver was converted to gold equivalent ounces by multiplying the silver ounces by the average silver price for the period and dividing by the average gold price for the period. Diamonds, other metals and cash royalties were converted into gold equivalent ounces by dividing the associated revenue by the average gold price for the period. . Offtake agreements were converted using the financial settlement equivalent divided by the average gold price for the period. Refer to the portfolio of royalty, stream and other interests section for average metal prices used.
10,102 oz AuEq
16,664 oz AuEq
GUIDANCE (oz AuEq)
55,300 – 65,700 oz AuEq
2017E
YTD: 37,943 oz AuEq
Expected Contribution
from Q4
Only two months of Orion asset production

8
Q3 2017 Performance – GEOs Split by Commodity
GOLD11,637
70%
SILVER2,67716%
DIAMONDS1,96012%
OTHER METALS3902%
16,664Attributable
GEOs
Q3 2016 Q3 2017
9
Q3 2017 Performance
NET CASH FLOW FROM OPERATING ACTIVITIES (C$ M)
QUARTERLY REVENUES (C$ M)
1. Increase in inventories related to the offtake agreements acquired from Orion.
Q3 2016 Q3 2017
Net cash flows impacted by the transaction costs
related to the acquisition of Orion’s Portfolio, the settlement of restricted share units and a higher
negative impact of changes in non-cash
working capital items1
$17.6Royalties
and Streams
$26.1Royalties
and Streams
$68.2 including offtakes
Record quarterly revenues - 48% increase vs Q3 2016 (288% increase including offtakes)
$15.0
$1.1

10
2017 Q3 Results
3 MONTHS ENDED
(C$ 000) Sep. 30, 2017 Sep. 30, 2016
GOLD PRODUCTION (oz) 11,637 9,966
SILVER PRODUCTION (oz AuEq) 2,677 136
DIAMONDS PRODUCTION (oz AuEq) 1,960 -
OTHER METALS (oz AuEq) 390 -
REALIZED GOLD PRICE (C$ per oz) 1,616 1,743
REALIZED GOLD PRICE (US$ per oz) 1,296 1,335
AVERAGE GOLD PRICE (US$ per oz) 1,278 1,335
REVENUES $68,179 $17,570
COST OF SALES ($44,214) $45
DEPLETION OF ROYALTY, STREAM AND OTHER INTERESTS ($8,324) ($2,629)
GROSS PROFIT $15,641 $14,986
NET CASH FLOW FROM OPERATING ACTIVITIES $1,094 $14,978
NET EARNINGS1 $6,728 $17,757
NET EARNINGS PER SHARE - BASIC1 $0.05 $0.17
1. Attributable to Osisko’s shareholders

3 MONTHS ENDED
(C$ 000) Sep. 30, 2017 Sep. 30, 2016
ROYALTIES:
Revenues $19,405 $17,570
Cost of Sales ($78) $45
Depletion ($4,758) ($2,629)
Gross Profit $14,209 $14,986
STREAMS:
Revenues $7,048 --
Cost of Sales ($2,712) --
Depletion ($3,239) --
Gross Profit $1,097 --
OFFTAKES:
Revenues 42,086 --
Cost of Sales ($41,424) --
Depletion ($327) --
Gross Profit $335 --
TOTAL GROSS PROFIT $15,641 $14,986
11
2017 Q3 Revenue Breakdown

0.05 $
$0.00
$0.01
$0.02
$0.03
$0.04
$0.05
Q3 2014 Q4 2014 Q1 2015 Q2 2015 Q3 2015 Q4 2015 Q1 2016 Q2 2016 Q3 2016 Q4 2016 Q1 2017 Q2 2017 Q3 2017 Q4 2017
12
Dividend
RETURNING CAPITAL TO SHAREHOLDERS
STABLE DIVIDENDAND GROWING

13
Balance Sheet
Balance Sheet Items as at Sep. 30, 2017 Sep. 30 2017 Pro Forma Convertible Debenture Financing
Cash and Cash Equivalents (C$ M) $108.9 $398.1
Debt (C$ M) $193.7 $462.4
Investments (C$ M) ~$420
Basic Shares Outstanding (M) 157.0
Quarterly Dividend (C$/Share) $0.05

14
Quality Cash Flowing Assets
CORNERSTONE ASSETS IN TOP JURISDICTIONS

15
Near & Medium-Term Cash Flowing Assets
Denotes acquired assets from Orion Mine Finance
UPPER BEAVER KIRKLAND LAKE CAMP
2% NSR
CARIBOO2.25% NSR
MARBAN0.425% NSR
LAMAQUE0.85% NSR
WINDFALL1.5% NSR
HERMOSA1% NSR
HORNE 51% NSR
FARM-IN AGREEMENTJAMES BAY - LABRADOR TROUGH PROPERTIES
1.5% - 3.5% NSR
ODYSSEY NORTH & SOUTH3% & 5% NSR
PANDORA2% NSR
BACK FORTY75% Ag STREAM18.5% Au Stream
AMULSAR4.22% Au, 62.5% Ag STREAM
82% Au OFFTAKE

16
Updates on Cash Flowing Assets
2.2 - 3.5% NSR Mine grade expected to increase
in the second half of 2017. Ramp- up to 7,000 tonnes per day,
expected to be achieved in late 2018.
ÉLÉONORE
GIBRALTAR
CANADIANMALARTIC
SEABEE
5% NSR Q3 quarterly production:⁻ 54,952 tpd⁻ 164.2 koz (152.9 koz for Q3 2016) Deviation of highway underway,
expected to take two years. Contribution of Barnat to guidance
in late 2019
ISLANDGOLD
1.38-2.55% NSR
Guidance for 89-93koz reiterated. Mine is on track to beat the high end of guidance as sale to Alamos is finalized.
RENARD
1-4% GSR
P&P mineral reserves were doubled to 2.1 Moz in Q1 The detailed engineering work at
the Vantage Complex in the South area is progressing on schedule. The permitting process is
proceeding as planned.
BALDMOUNTAIN
BRUCEJACK1
4% Au, Ag STREAMS Brucejack is on track to produce
~180koz in its first year 82,203 ounces of gold produced 96.49 % gold recovery rate 10.52g/t
9.6% DIAMOND STREAM An ore sorter (C$22M) is being
installed to remove the hard internal waste in an effort to reduce breakage. Commissioning of ore sorting
expected in 1Q18.
75% Ag STREAM
Third quarter copper sales volumes were affected by wild fires throughout central BC. Gibraltar has maintained a stable
level of operations and has achieved solid operating results over the third quarter.
3% NSR
Company on track to meet 80koz guidance for year. PEA outlines an expansion of the
Seabee Gold Operation to a sustained mining and milling rate of 1,050 tonnes per day for a seven-year period. Extends production profile to 2024.
1. Subject to a 100% buy-back provision by the operator in 2018

17
Tier 1 Jurisdictional Focus
8
1
3
13
4
Represents total royalty/streaming assets
103
2018 2023
North America: 78% 76%
South America: 8% 13%
Asia: 7% 7%
Europe: 3% 3%
Australia: 2% 1%
Africa: 2% 1%
Geographical CF Distribution

18
Best in Class Portfolio: Growth & Diversification
Growth and diversification while maintaining low risk
Consensus NPV by Geography
Source: Research reports and Osisko management estimates.
81%
56%
32% 27%
19%
44%
68% 73%
Osisko Royal Gold WheatonPrecious Metals
Franco-Nevada
North America Elsewhere

APPENDIX A:Mineral Reserves & Resources

20
Mineral Reserves and Resources
1. Agnico Eagle and Yamana public disclosure – as at December 31, 20162. Goldcorp public disclosure – as at June 30, 20173. Richmont public disclosure – as at December 31, 2016
CANADIAN MALARTIC1
RESERVES
CATEGORY AU GRADE (G/T) AU (M OZ) TONNES (MT)
Proven 0.95 1.57 51.1
Probable 1.13 5,53 152.5
Total Proven & Probable 1.08 7.10 203.7
GLOBAL RESOURCES (EXCLUDING RESERVES)*
CATEGORY AU GRADE (G/T) AU (M OZ) TONNES (MT)
Measured 1.34 0.17 4.0
Indicated 1.56 1.12 22.2
Total Meas. & Ind. 1.53 1.29 26.2
Inferred 1.46 0.43 9.2
ÉLÉONORE2
RESERVES
CATEGORY AU GRADE (G/T) AU (M OZ) TONNES (MT)
Total Proven & Probable 6.02 3.80 19.61
GLOBAL RESOURCES (EXCLUDING RESERVES)
CATEGORY AU GRADE (G/T) AU (M OZ) TONNES (MT)
Total Meas. & Ind. 5.81 1.34 7.16
Inferred 7.31 1.99 8.45
ISLAND GOLD3
RESERVES
CATEGORY AU GRADE (G/T) AU (K OZ) TONNES (KT)
Proven 8.68 159.8 573
Probable 9.31 592.4 1,978
Total Proven & Probable 9.17 752.2 2,551
GLOBAL RESOURCES (EXCLUDING RESERVES)
CATEGORY AU GRADE (G/T) AU (K OZ) TONNES (KT)
Measured 4.94 5.35 33.5
Indicated 6.01 86.10 445.5
Total Meas. & Ind. 5.94 91.45 479.0
Inferred 10.18 995.7 3,042

AMULSAR3
CATEGORYAU GRADE
(G/T)AG GRADE
(G/T)AU
(M OZ)AG
(M OZ)TONNES
(MT)Proven 0.8 4.6 1.2 6.6 44.7
Probable 0.8 3.3 1.4 6.1 57.9
Total P&P 0.8 3.9 2.6 12.7 102.7
CATEGORYAU GRADE
(G/T)AG GRADE
(G/T)AU
(M OZ)AG
(M OZ)TONNES
(MT)Measured 0.8 4.7 1.4 7.7 51.5
Indicated 0.7 3.4 2.1 9.8 90.7
Total M&I 0.8 3.8 3.5 17.5 142.2
Inferred 0.6 3.3 1.3 7.6 72.2*Au cut-off grade: 0.24 g/t; gold price - US$1,500/oz, silver price - US$25.00/oz
RESERVES*
GLOBAL RESOURCES (INCLUDING RESERVES)*
BRUCEJACK2
CATEGORYAU GRADE
(G/T)AG GRADE
(G/T)AU
(M OZ)AG
(M OZ)TONNES
(MT)Proven 14.5 12.9 1.6 1.4 3.3
Probable 16.5 11.3 6.5 4.5 12.3
Total P&P 16.1 11.7 8.1 5.9 15.6
CATEGORYAU GRADE
(G/T)AG GRADE
(G/T)AU
(M OZ)AG
(M OZ)TONNES
(MT)Measured 17.0 15.3 1.9 1.7 3.5
Indicated 17.3 15.0 7.2 6.2 13.0
Total M&I 17.2 15.0 9.1 7.9 16.4
Inferred 21.0 26.9 3.1 4.0 4.6
*NSR cut-off of C$180/t; gold Price - US$1,100/oz, silver Price - US$17.00/oz and a CAD:USD FX rate of 0.92
GLOBAL RESOURCES (INCLUDING RESERVES)
RESERVES*
RENARD1
PROBABLE RESERVES*
GRADE (CPHT) CARATS (M) TONNES (MT)
Total Probable 66.5 22.0 33.0
*Estimated at a +1 DTC sieve size cut-off
GLOBAL RESOURCES (EXCLUDING RESERVES)
GRADE (CPHT) CARATS (M) TONNES (MT)
Total Indicated 27.0 0.9 3.4
Inferred 54.0 13.4 24.5
21
Mineral Reserves and Resources
1. Stornoway public disclosure - as at February 6, 2017.2. Pretium pubic disclosure - as at December 15, 2016. 3. Lydian public disclosure - as at February 27, 2017.

CASINO3
CATEGORYCU GRADE
(%)AU GRADE
(G/T)CU
(B LBS)AU
(M OZ)TONNES
(MT)Proven 0.26% 0.4 0.7 1.8 123
Probable 0.17% 0.2 3.7 7.1 999
Total P&P 0.18% 0.2 4.5 8.9 1,123
CATEGORYCU GRADE
(%)AU GRADE
(G/T)CU
(B LBS)AU
(M OZ)TONNES
(MT)Measured 0.26% 0.5 0.7 1.8 124
Indicated 0.18% 0.2 4.0 7.1 1,016
Total M&I 0.20% 0.2 4.7 8.9 1,140
Inferred 0.14% 0.2 5.4 9.0 1,713*Au cut-off grade: 0.25% Cu Eq. & 0.25 g/t Au. Table excludes silver and moly.
RESERVES*
GLOBAL RESOURCES (INCLUDING RESERVES)*
BALD MOUNTAIN4
RESERVES*
CATEGORY AU GRADE (G/T) AU (M OZ) TONNES (MT)
Proven 0.8 0.3 10.3
Probable 0.6 1.9 100.2
Total P&P 0.6 2.1 110.5
*Gold Price: US$1,200/oz Au
GLOBAL RESOURCES (EXCLUDING RESERVES)*
CATEGORY AU GRADE (G/T) AU (M OZ) TONNES (MT)
Measured 0.6 0.5 24.9
Indicated 0.5 3.0 176.1
Total M&I 0.5 3.5 200.9
Inferred 0.4 0.6 49.5*Gold Price: US$1,400/oz Au
BACK FORTY1
GLOBAL RESOURCES*
CATEGORY AG GRADE (G/T) AG (M OZ) TONNES (MT)
Measured 27.3 5.9 6.7
Indicated 22.2 6.0 8.4
Total M&I 24.5 11.9 15.1
Inferred 26.5 2.0 2.3*NSR cut-off : US$27.78/oz Ag
SEABEE2
RESERVES*
CATEGORY AU GRADE (G/T) AU (M OZ) TONNES (MT)
Proven 7.0 0.1 0.5
Probable 8.9 0.3 0.9
Total P&P 8.2 0.4 1.4
*Au cut-off grade: 4.92 g/t Seabee & 3.65 g/t Santoy
GLOBAL RESOURCES (INCLUDING RESERVES)*
CATEGORY AU GRADE (G/T) AU (M OZ) TONNES (MT)
Measured 7.7 0.2 0.8
Indicated 8.1 0.4 1.4
Total M&I 8.0 0.6 2.2
Inferred 7.7 0.6 2.6*Au cut-off grade: 4.40 g/t Seabee & 3.26 g/t Santoy
22
Mineral Reserves and Resources (cont’d)
1. Aquila public disclosure - as at March 15, 2017.2. Silver Standard public disclosure - as at March 22, 2017.3. Western Copper and Gold disclosure - as at June 2017. 4. Kinross public disclosure - as at March 31, 2017.