q2 2018 earnings deck · q2 2018 earnings deck. august 2018. safe harbor statement. this...
TRANSCRIPT

Q2 2018 EARNINGS DECKAugust 2018
Safe Harbor StatementThis presentation contains forward-looking statements, within the meaning of the Private Securities Litigation Reform Act of 1995, that involve risks and uncertainties, including statements regarding our financial outlook for the third quarter 2018 and the full year of 2018; expected device mix; the rate of decline in tracker sales; expected trends in revenue, average selling price, operating expenses, free cash flow, capital expenditures, gross margins, stock based compensation and non-GAAP effective tax rate; product supply, including Versa; M&A investments; and consumer and retail demand for trackers and smartwatches. These forward-looking statements are only predictions and may differ materially from actual results due to a variety of factors, including: the effects of the highly competitive market in which we operate, including competition from much larger technology companies; our ability to anticipate and satisfy consumer preferences in a timely manner; our ability to successfully develop and timely introduce new products and services or enhance existing products and services; retail and customer acceptance of existing and new products; any inability to accurately forecast consumer demand and adequately manage our inventory; our ability to ship products on the timelines we anticipate and unexpected delays; our ability to detect, prevent or fix quality issues in our products or services; uncertain ability to retain employees; our reliance on third-party suppliers, contract manufacturers, and logistics providers, and our limited control over such parties; delays in procuring components and product from these third parties or their suppliers; the ability of third parties to successfully manufacture and ship in a timely manner quality products; seasonality; product liability issues, security breaches or other defects, which may adversely affect product performance, our reputation and brand awareness and overall market acceptance of our products and services; ability to integrate acquired technologies and employees into our operations, particularly in new geographies; warranty claims; the fact that the market for connected health and fitness devices is relatively new and unproven; the ability of our channel partners to sell our products; litigation and related costs; privacy; the impact of changes in tax law; the impact of tariffs; and other general market, political, economic and business conditions.
Additional risks and uncertainties that could affect our financial results are included under the caption “Risk Factors” in our Annual Report on Form 10-K for the full year ended December 31, 2017, which is available on our Investor Relations website at investor.fitbit.com and on the SEC website at www.sec.gov. Additional information will also be set forth in our Quarterly Report on Form 10-Q for the quarter ended June 30, 2018. All forward-looking statements contained herein are based on information available to us as of the date hereof and we do not assume any obligation to update these statements as a result of new information or future events. We may not actually achieve the plans, intentions, or expectations disclosed in our forward-looking statements and you should not place undue reliance on our forward-looking statements. Our forward-looking statements do not reflect the potential impact of any future acquisitions, mergers, dispositions, joint ventures, or investments we may make.
This presentation also includes certain financial measures that are not calculated in accordance with U.S. generally accepted accounting principles, or GAAP. These non-GAAP financial measures are in addition to, and not as a substitute for or superior to measures of financial performance prepared in accordance with GAAP. There are a number of limitations related to the use of these non-GAAP financial measures versus their nearest GAAP equivalents. For example, other companies may calculate non-GAAP financial measures differently or may use other measures to evaluate their performance, all of which could reduce the usefulness of our non-GAAP financial measures as tools for comparison. We have provided a reconciliation of those measures to the most directly comparable GAAP measures, which is available in the appendix.
Trademarks: Fitbit and the Fitbit logo are trademarks or registered trademarks of Fitbit, Inc. in the United States and other countries. Additional Fitbit trademarks can be found at www.fitbit.com/legal/trademark-list. Third-party trademarks are the property of their respective owners.
2

©2017 Fitbit, Inc. All rights reserved. Proprietary & Confidential.
TO MAKE EVERYONE IN THE WORLD HEALTHIER
3
Our Assets
Brand:#1 Wearables Brand Globally
Community:Large Social Fitness Network with 25 million active users*
Data:One of the largest activity, exercise, & sleep databases
*(As of 12/31/17)4

81M
39K WIDE RANGE of devices and
price pointsStores
Health & Fitness app on iOS and Android (U.S.)*
86 CountriesWearable brand globally
1#
1# Devices sold to date
(*As of 12/31/17)5

©2017 Fitbit, Inc. All rights reserved. Proprietary & Confidential. ©2017 Fitbit Inc. All rights reserved. 6
DiabetesHeart HealthSleep Apnea
Manage WeightGet More Active & FitSleep BetterReduce Stress
Focus on Outcomes and Conditions
Wellness Health
Across All Ages
Mental Health
6
• Generated $299 million of revenue, non-GAAP net loss per share of ($0.22).
• Average selling price up 6% y/y to $106 per device. Accessory and other revenue added an additional $5.23 per device.
• Non-GAAP gross margin decreased 210 basis points y/y to 40.9% driven by the change in mix towards smartwatches, partially offset by improved warranty costs.
• Non-GAAP operating expenses increased 2% y/y to $194 million.
• $580 million in cash, cash equivalents, and marketable securities on the balance sheet as of the quarter end.
Q2 Financial Highlights
7
Q2 Business Highlights• Smartwatch revenue grew to 55% of revenue, up from 30% on a
sequential basis.
• Fitbit VersaTM , Fitbit’s first “mass-appeal” smartwatch, sold out in the quarter and outsold Samsung, Garmin and Fossil smartwatches combined in North America.
• The success of Versa has improved the company’s positioning with retailers, solidified shelf space for the Fitbit brand and has provided a halo effect to other product offerings.
• Tracker device sales impacted from inventory draw down. EMEA disproportionately impacted given its relatively high market share. Expect Q2 to be the trough in y/y decline in tracker sales.
• Fitbit Health Solutions continues to add partnerships, now has the ability to provide solutions to over 100 health plans across the U.S.
• Paid premium subscription revenue grew 34%, up from 30% on a sequential basis.
8
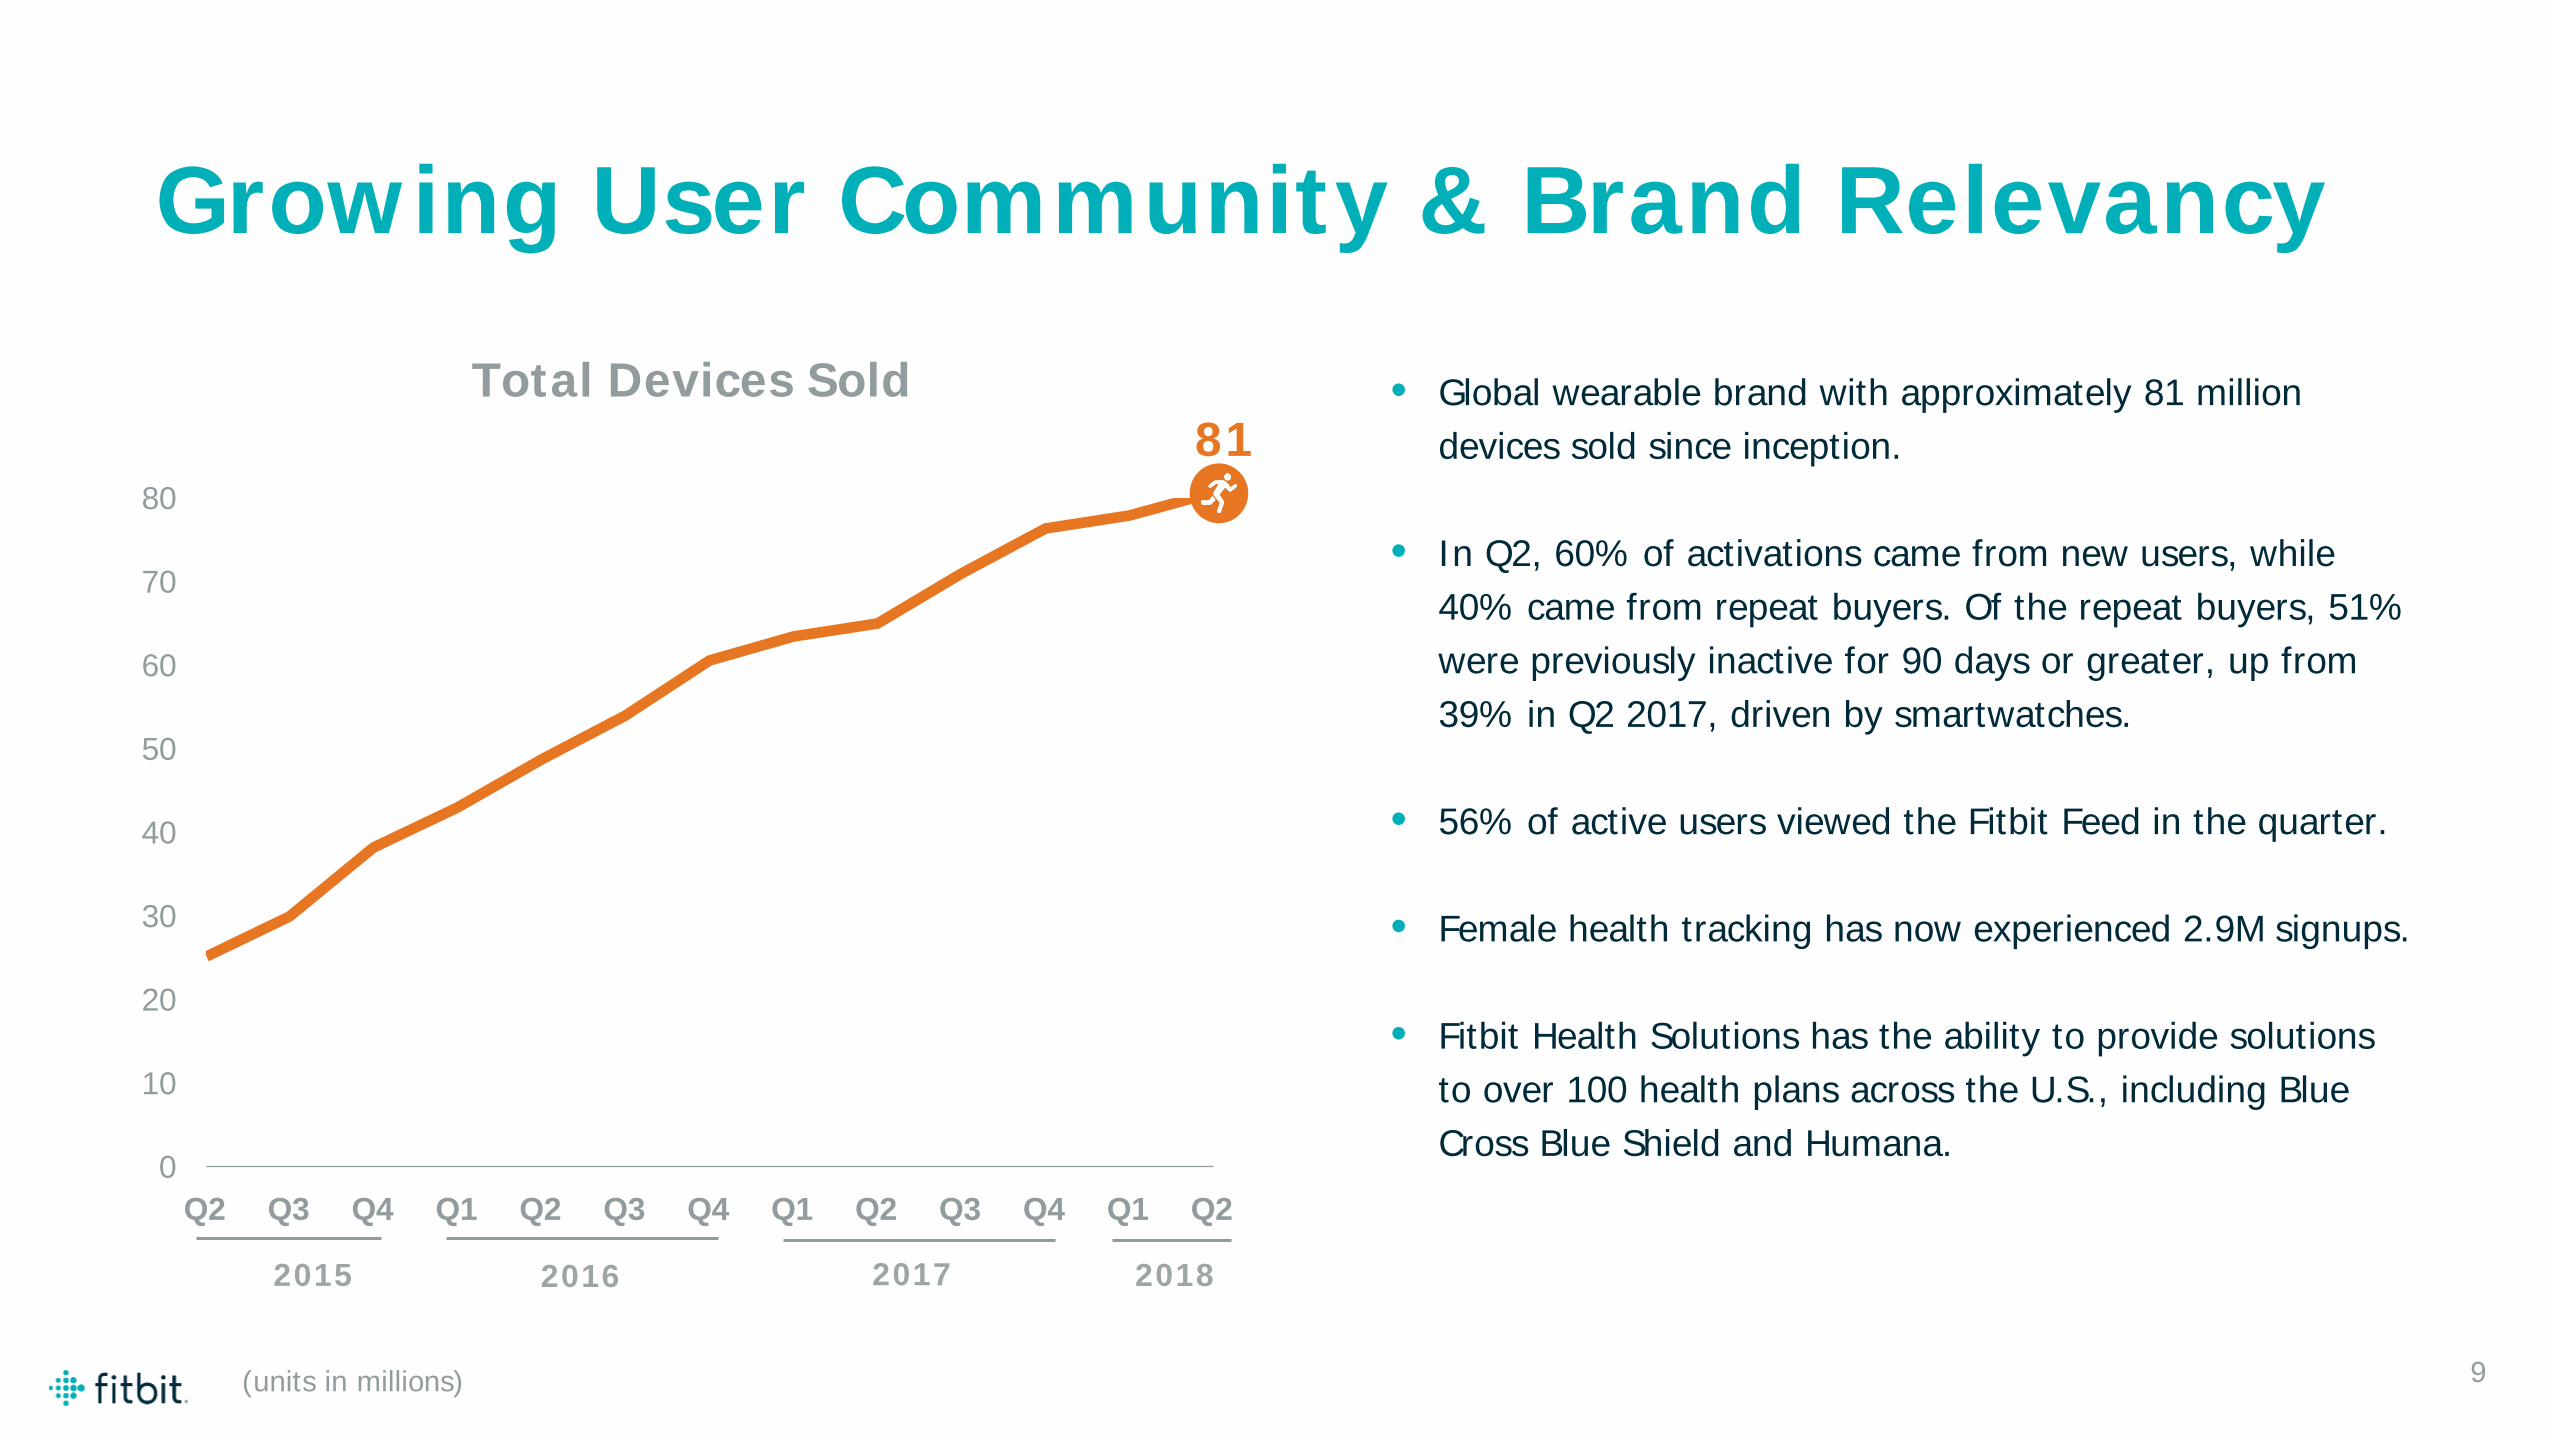
• Global wearable brand with approximately 81 million devices sold since inception.
• In Q2, 60% of activations came from new users, while 40% came from repeat buyers. Of the repeat buyers, 51% were previously inactive for 90 days or greater, up from 39% in Q2 2017, driven by smartwatches.
• 56% of active users viewed the Fitbit Feed in the quarter.
• Female health tracking has now experienced 2.9M signups.
• Fitbit Health Solutions has the ability to provide solutions to over 100 health plans across the U.S., including Blue Cross Blue Shield and Humana.
60
0
10
20
30
40
50
60
70
80
Q2 Q3 Q4 Q1 Q2 Q3 Q4 Q1 Q2 Q3 Q4 Q1 Q2
Total Devices Sold81
2015 2016 2017 2018
9
Growing User Community & Brand Relevancy
(units in millions)
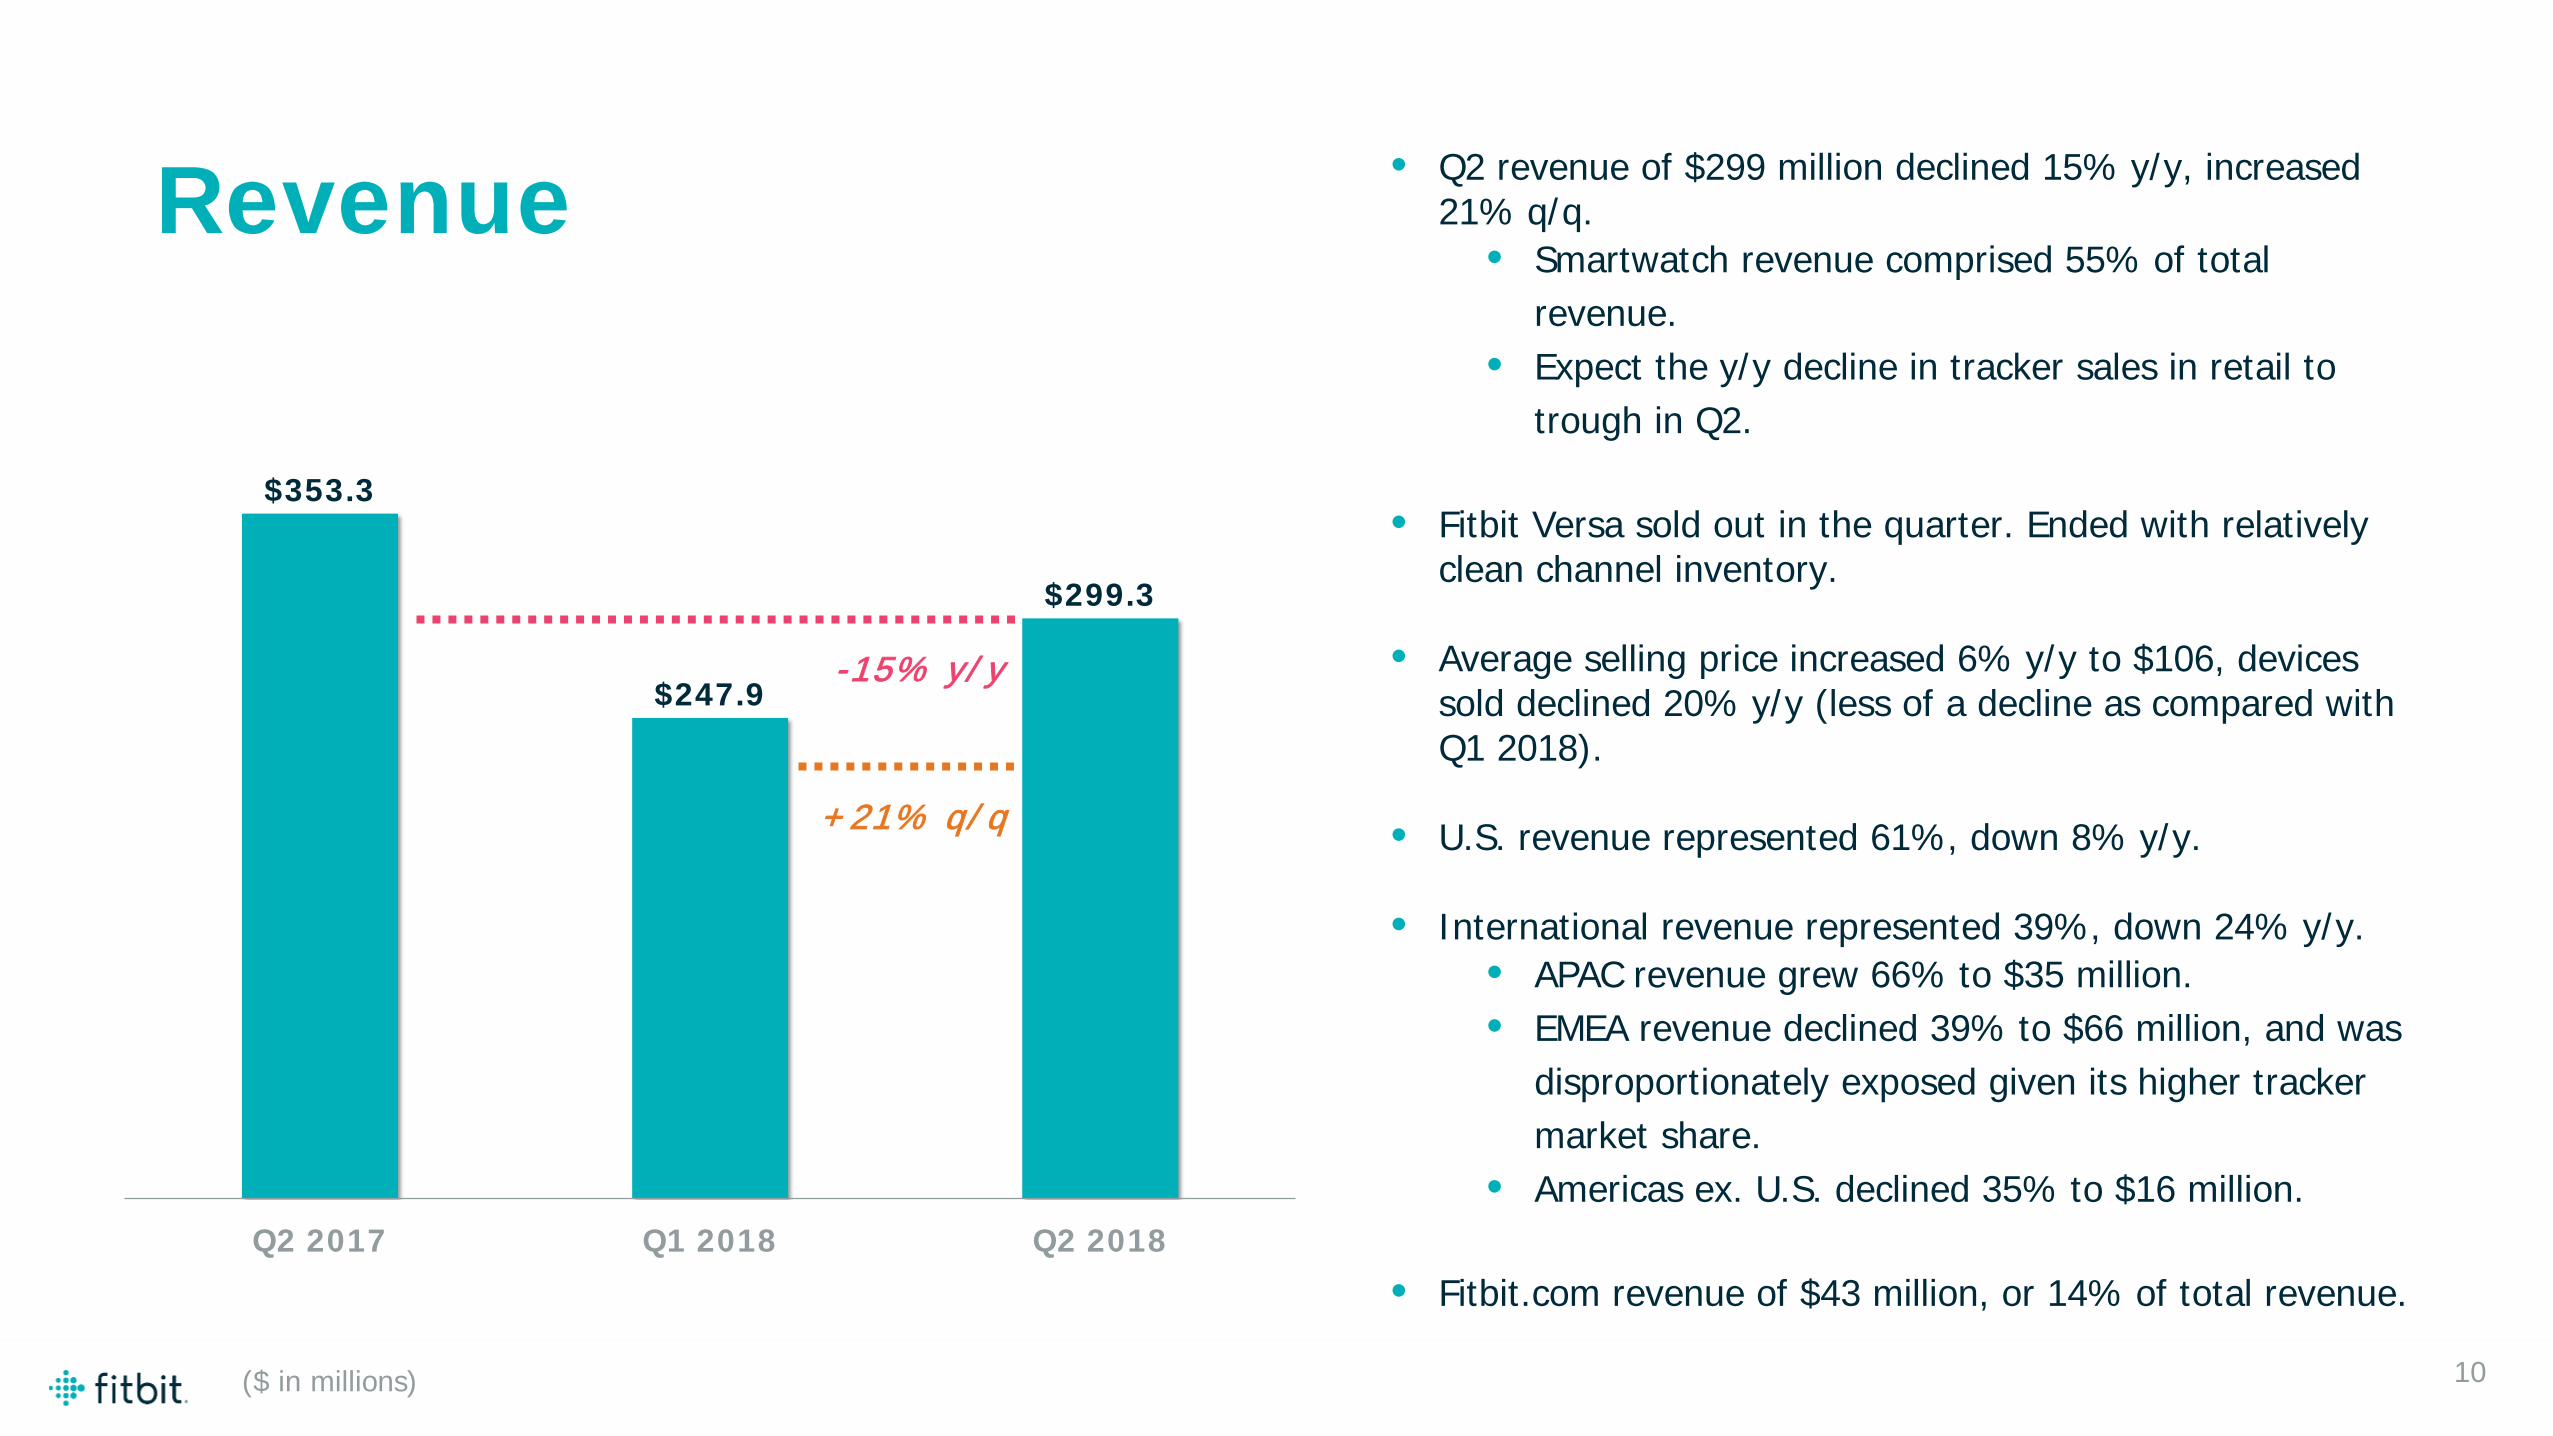
$353.3
$247.9
$299.3
Q2 2017 Q1 2018 Q2 2018
10
-15% y/ y
Revenue • Q2 revenue of $299 million declined 15% y/y, increased 21% q/q.
• Smartwatch revenue comprised 55% of total revenue.
• Expect the y/y decline in tracker sales in retail to trough in Q2.
• Fitbit Versa sold out in the quarter. Ended with relatively clean channel inventory.
• Average selling price increased 6% y/y to $106, devices sold declined 20% y/y (less of a decline as compared with Q1 2018).
• U.S. revenue represented 61%, down 8% y/y.
• International revenue represented 39%, down 24% y/y. • APAC revenue grew 66% to $35 million.• EMEA revenue declined 39% to $66 million, and was
disproportionately exposed given its higher tracker market share.
• Americas ex. U.S. declined 35% to $16 million.
• Fitbit.com revenue of $43 million, or 14% of total revenue.
($ in millions)
+21% q/ q
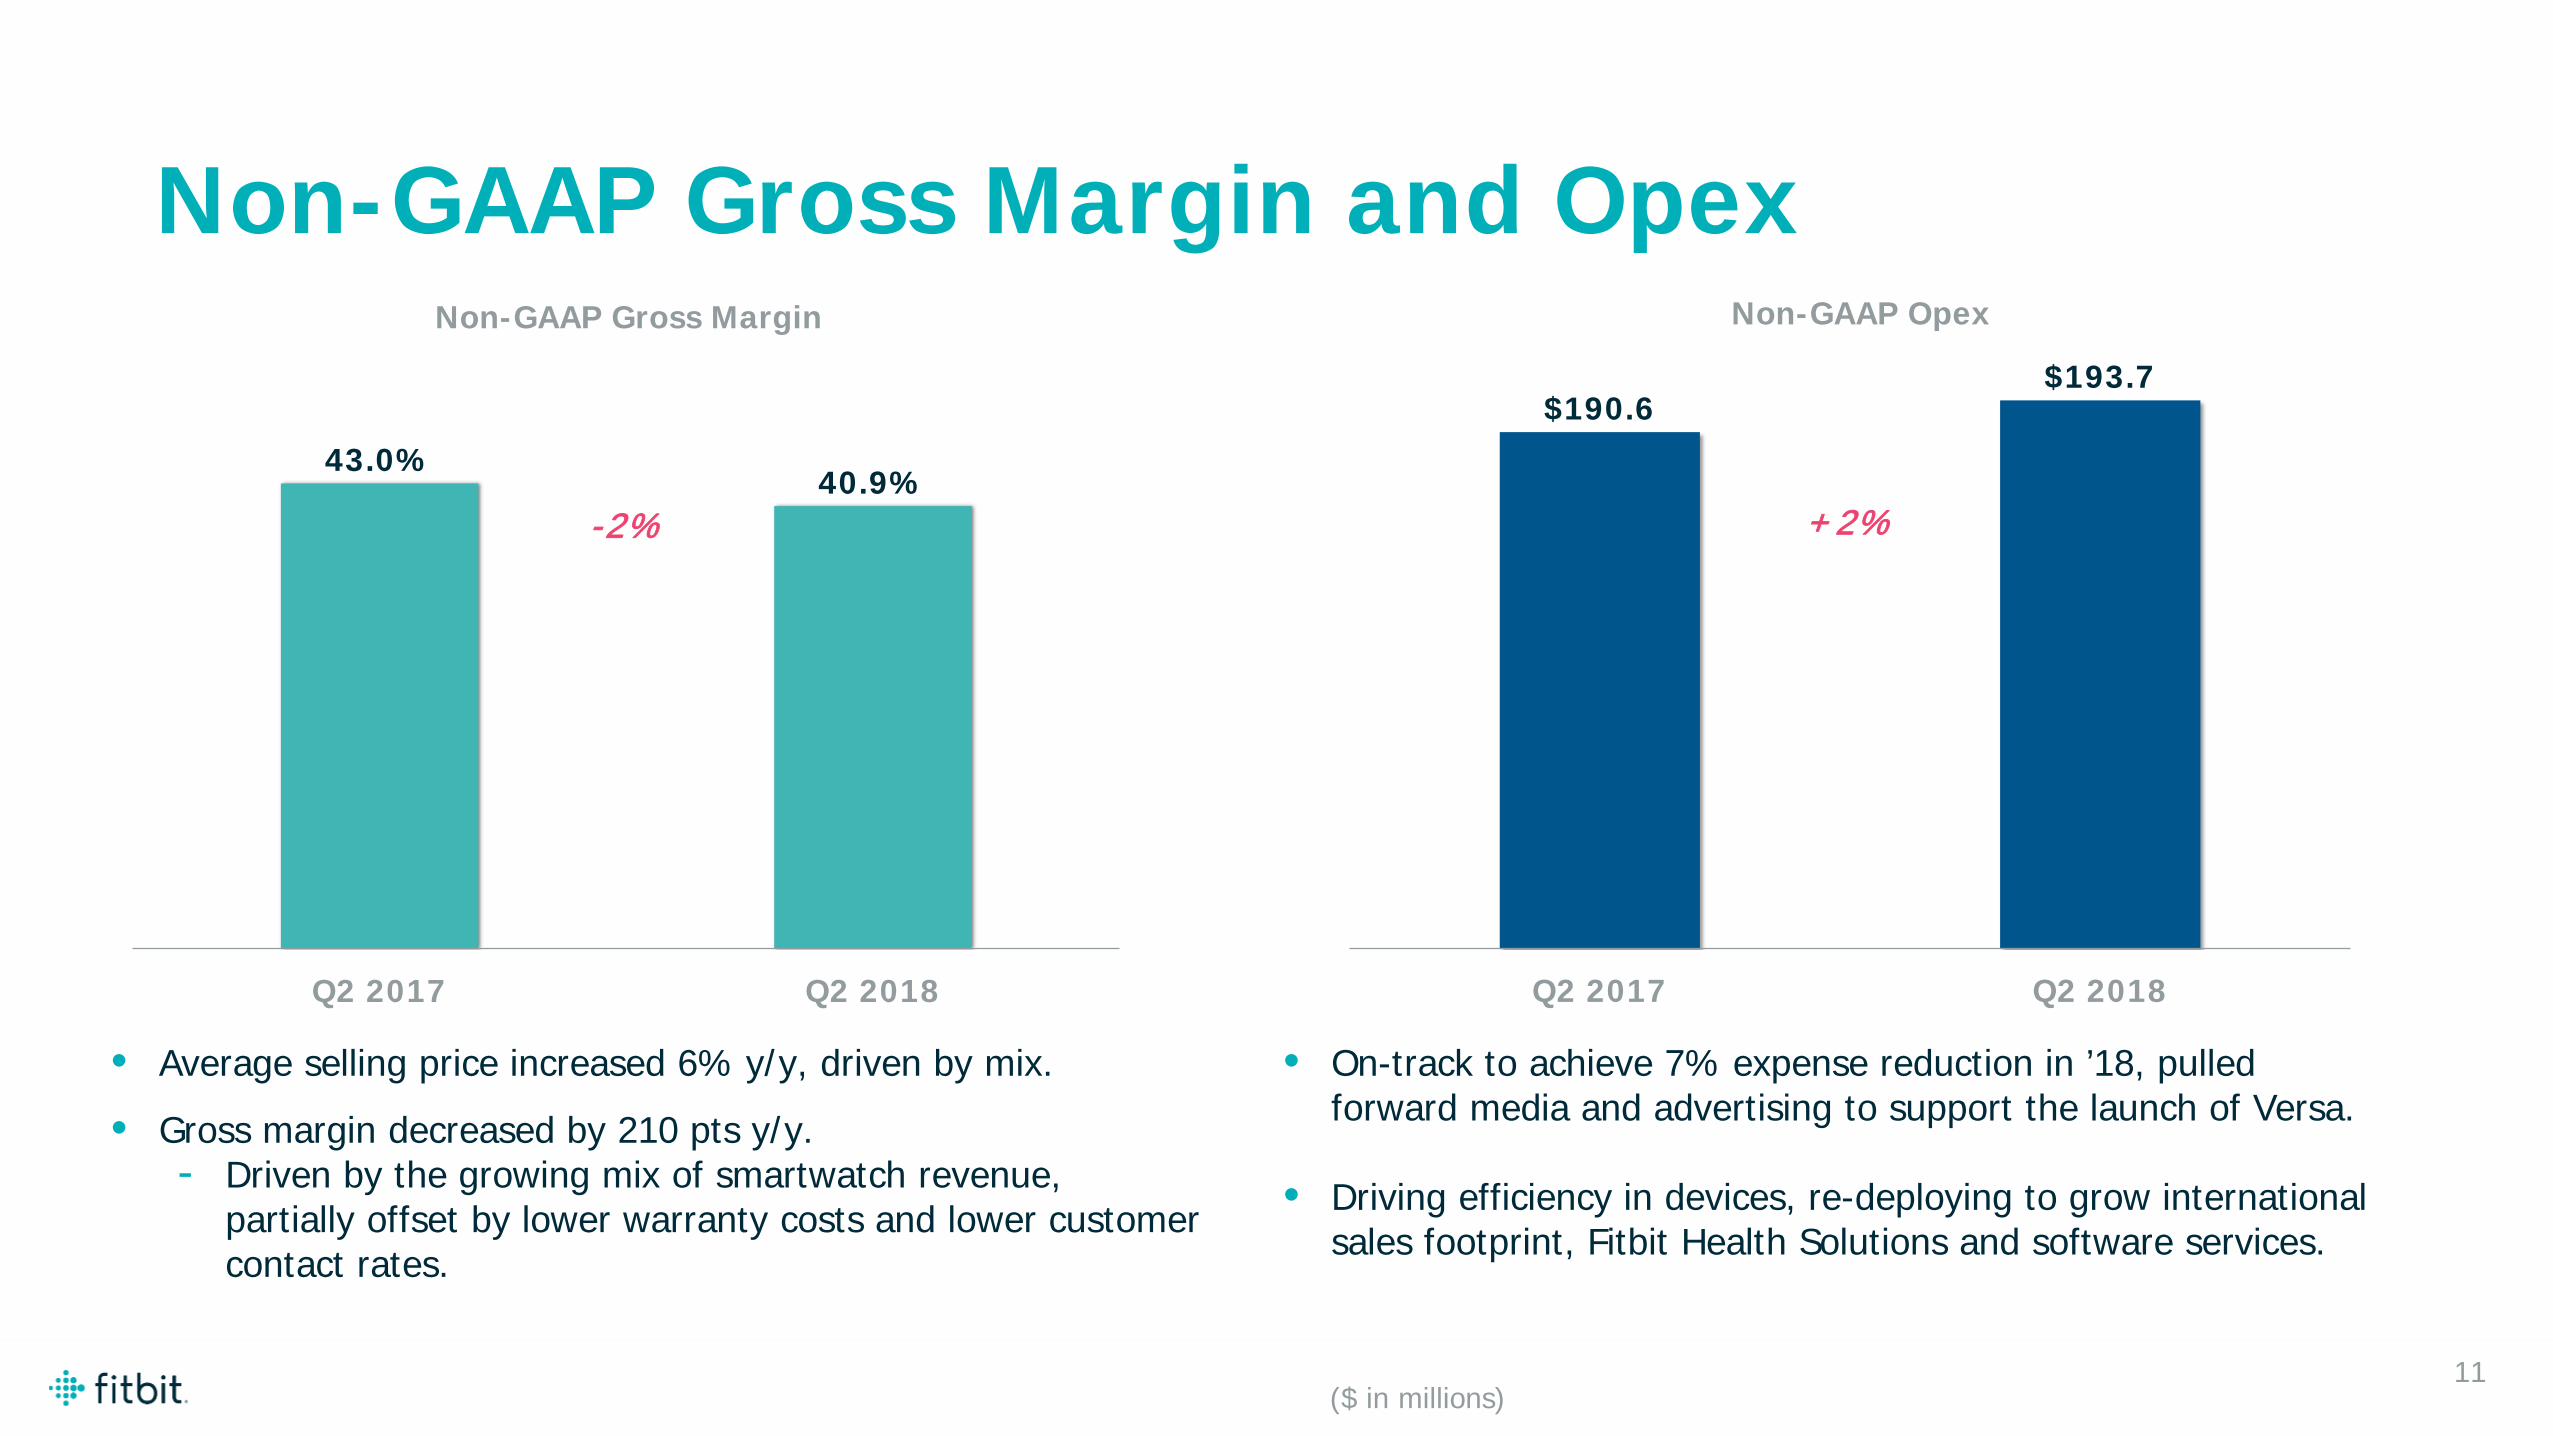
$190.6$193.7
Q2 2017 Q2 2018
Non-GAAP Opex
• Average selling price increased 6% y/y, driven by mix.• Gross margin decreased by 210 pts y/y.
- Driven by the growing mix of smartwatch revenue, partially offset by lower warranty costs and lower customer contact rates.
• On-track to achieve 7% expense reduction in ’18, pulled forward media and advertising to support the launch of Versa.
• Driving efficiency in devices, re-deploying to grow international sales footprint, Fitbit Health Solutions and software services.
11
+2%
Non-GAAP Gross Margin and Opex
43.0% 40.9%
Q2 2017 Q2 2018
Non-GAAP Gross Margin
-2%
($ in millions)
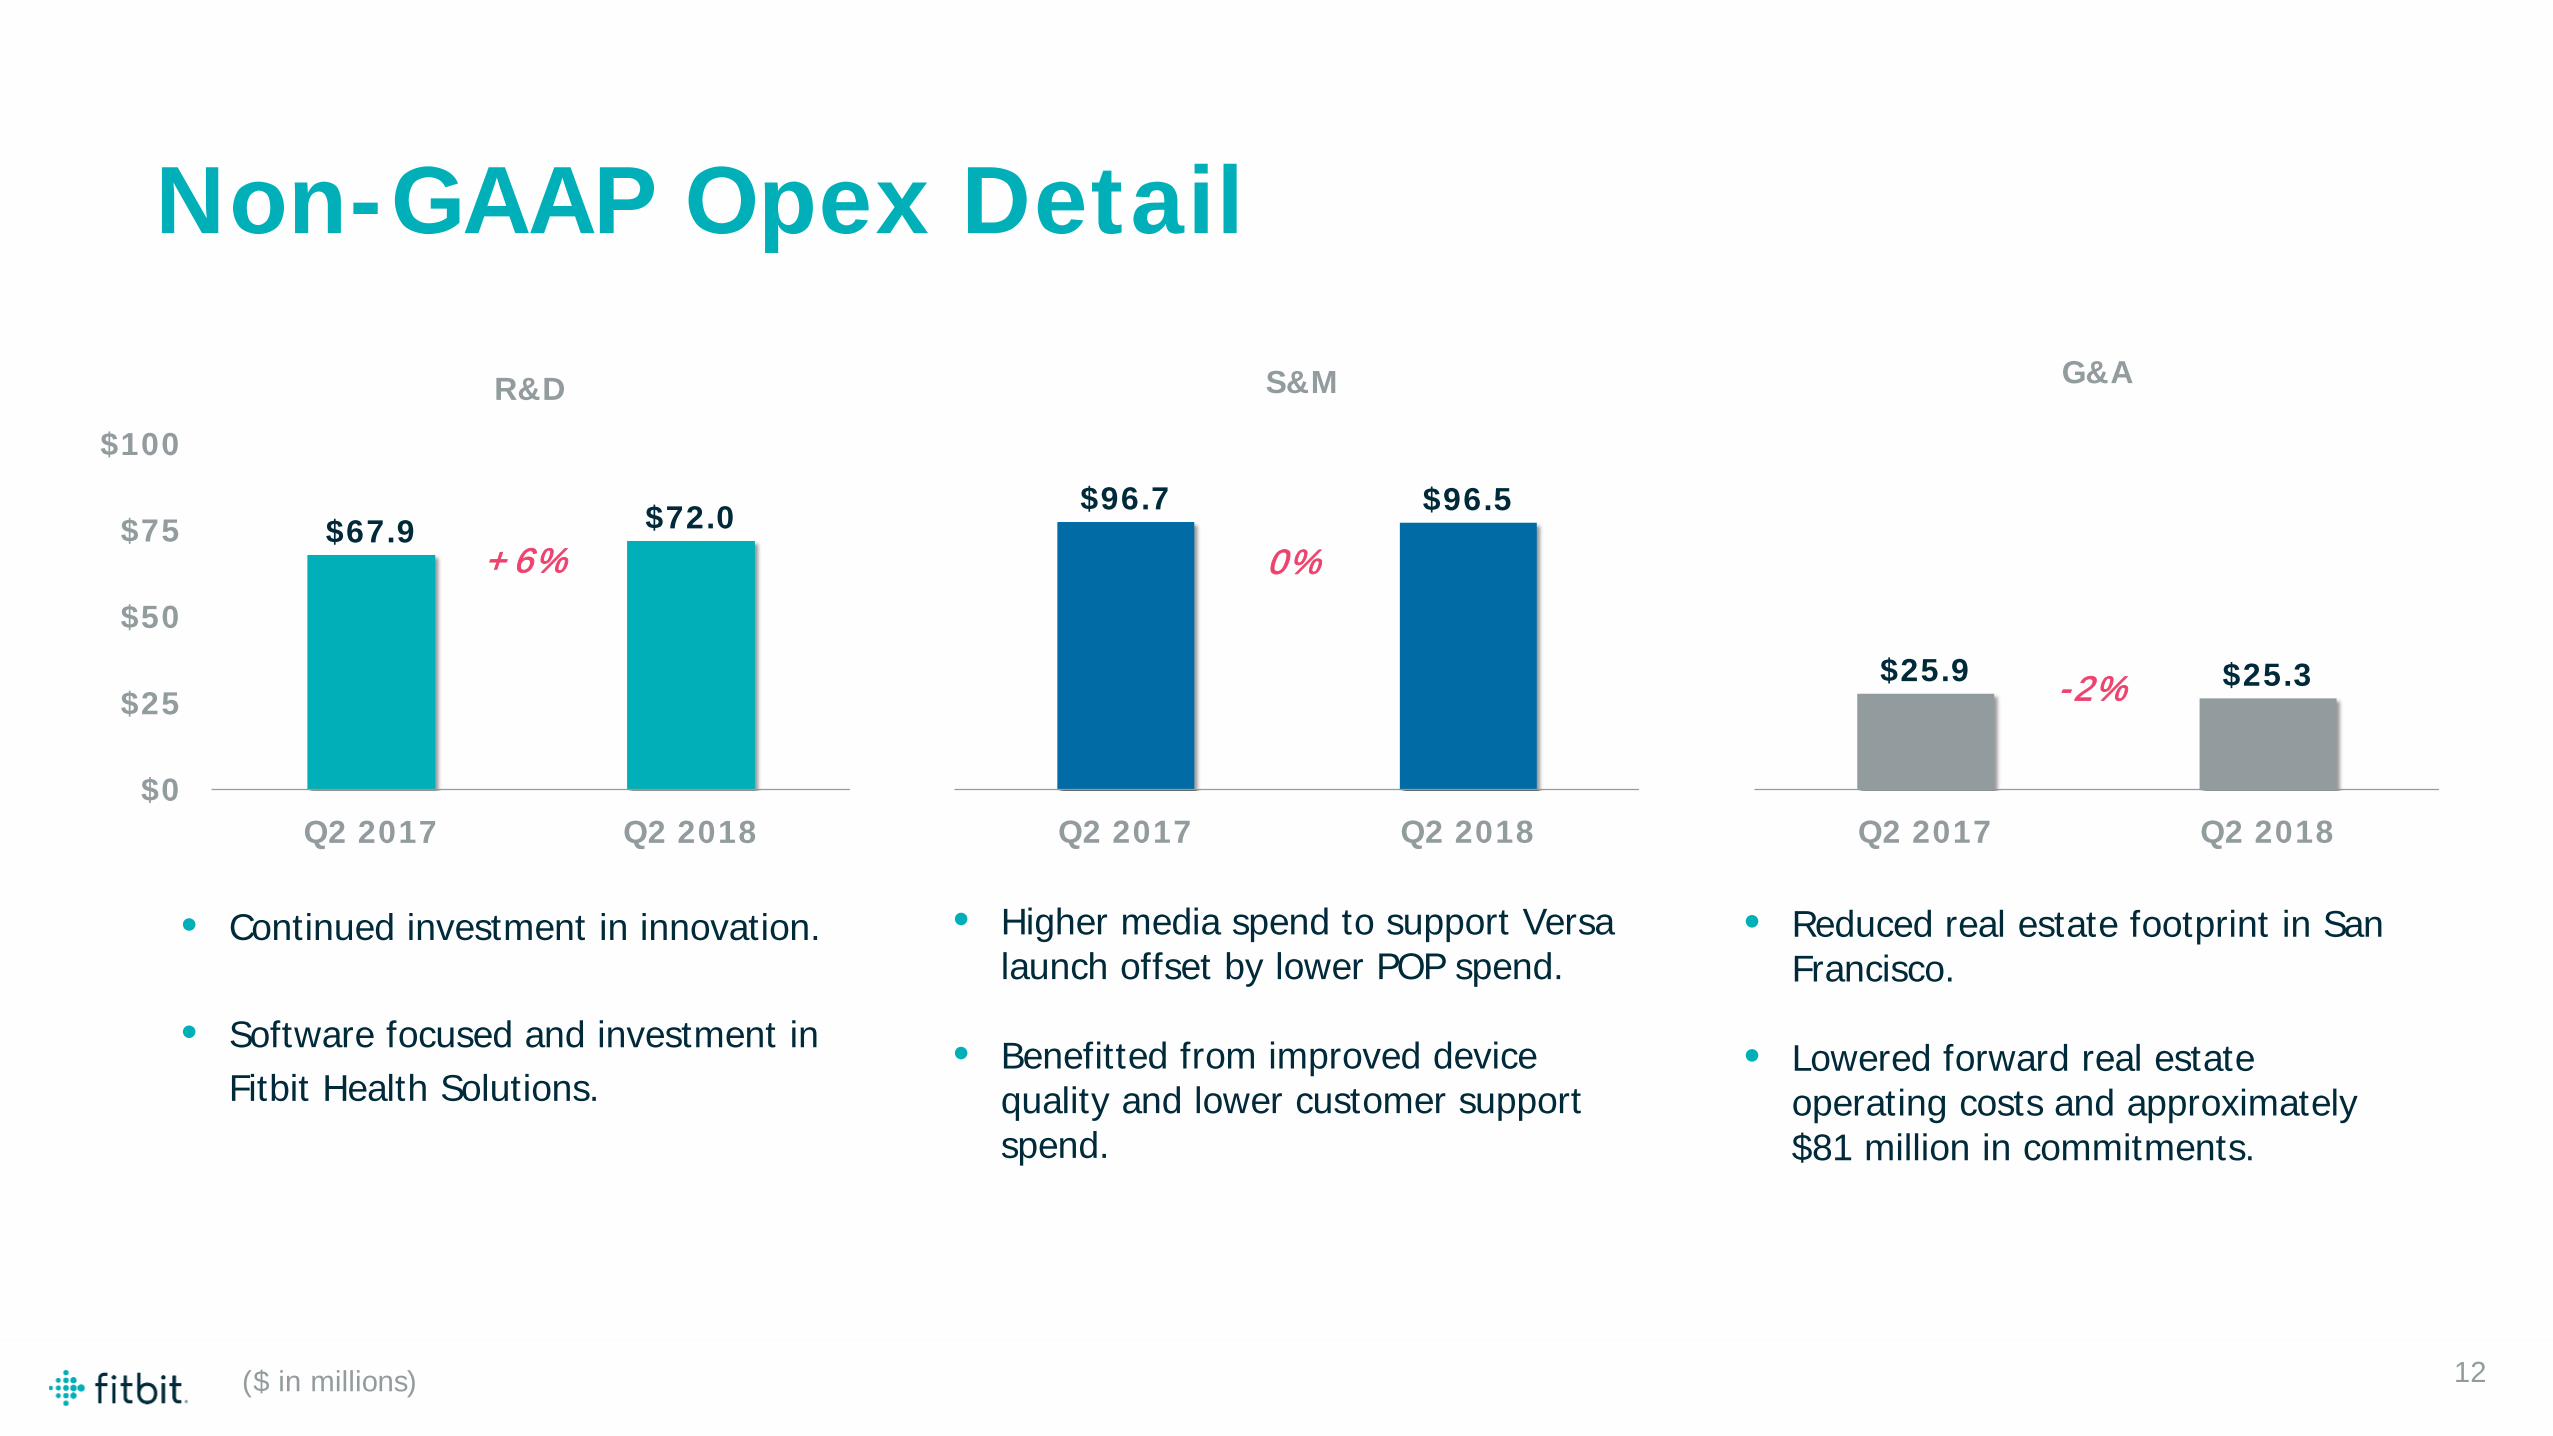
$96.7 $96.5
0
25
50
75
100
125
Q2 2017 Q2 2018
S&M
$67.9 $72.0
$0
$25
$50
$75
$100
Q2 2017 Q2 2018
R&D
$25.9 $25.3
0
25
50
75
100
Q2 2017 Q2 2018
G&A
• Continued investment in innovation.
• Software focused and investment in Fitbit Health Solutions.
• Higher media spend to support Versa launch offset by lower POP spend.
• Benefitted from improved device quality and lower customer support spend.
• Reduced real estate footprint in San Francisco.
• Lowered forward real estate operating costs and approximately $81 million in commitments.
12
+6% 0%
-2%
Non-GAAP Opex Detail
($ in millions)

• Received $72 million in a tax refund payment in early July.
• Will continue to augment organic investment with targeted M&A.
• Starting in Q1’18, sales return reserve is now included in Accrued Liabilities instead of netted against Account Receivables as required by ASC 606. Sales return reserve balance as of March 31, 2018 and June 30, 2018 was $83 million and $75 million, respectively.
Q4’16 Q1’17 Q2’17
13
Q3’17 Q4’17Inventory $141.5 $138.8 $123.9 $145.4 $140.4
Inventory Turns 4.8 6.3 9.8 4.0 5.0
Accounts Receivables $216.3 $261.0 $406.0 $214.4 $242.0
Days Sales Outstanding 74 67 76 61 70
Capital Expenditures (capex) $11.7 $18.4 $31.0 $12.6 $15.9
Capex as % of Revenue 3.3% 4.7% 4.9% 5.1% 5.3%
Free Cash Flow ($57.6) ($12.9) $24.6 ($2.5) ($83.3)
Cash & Marketable Securities $675.8 $659.2 $679.3 $658.4 $580.5
Q2’17 Q3’17 Q4’17 Q1’18 Q2’18
Balance Sheet and Cash Flow
($ in millions, except percentages, inventory turns and DSO)

Q3’18 Guidance
Guidance Context:
• Q3’18 results are expected to benefit from the lessening of the y/y decline of tracker revenue and continued growth of the smartwatch franchise.
• Expect gross margins to be flat from Q2’18.
• Tax rate driven by geography of revenue, tax credits. Expect quarterly volatility.
14
Revenue $370M $390M
y/y decline (6%) (1%)Non-GAAP net loss/gain per share ($0.02) $0.01
Capex as a % of revenue 5%
Free cash flow (~$30M)
Non-GAAP tax rate ~2%
Stock-based compensation ~$26M
Non-GAAP share count (basic) ~247M
Low High
FY ’17 Guidance
($ in millions, except percentages and per share amounts)
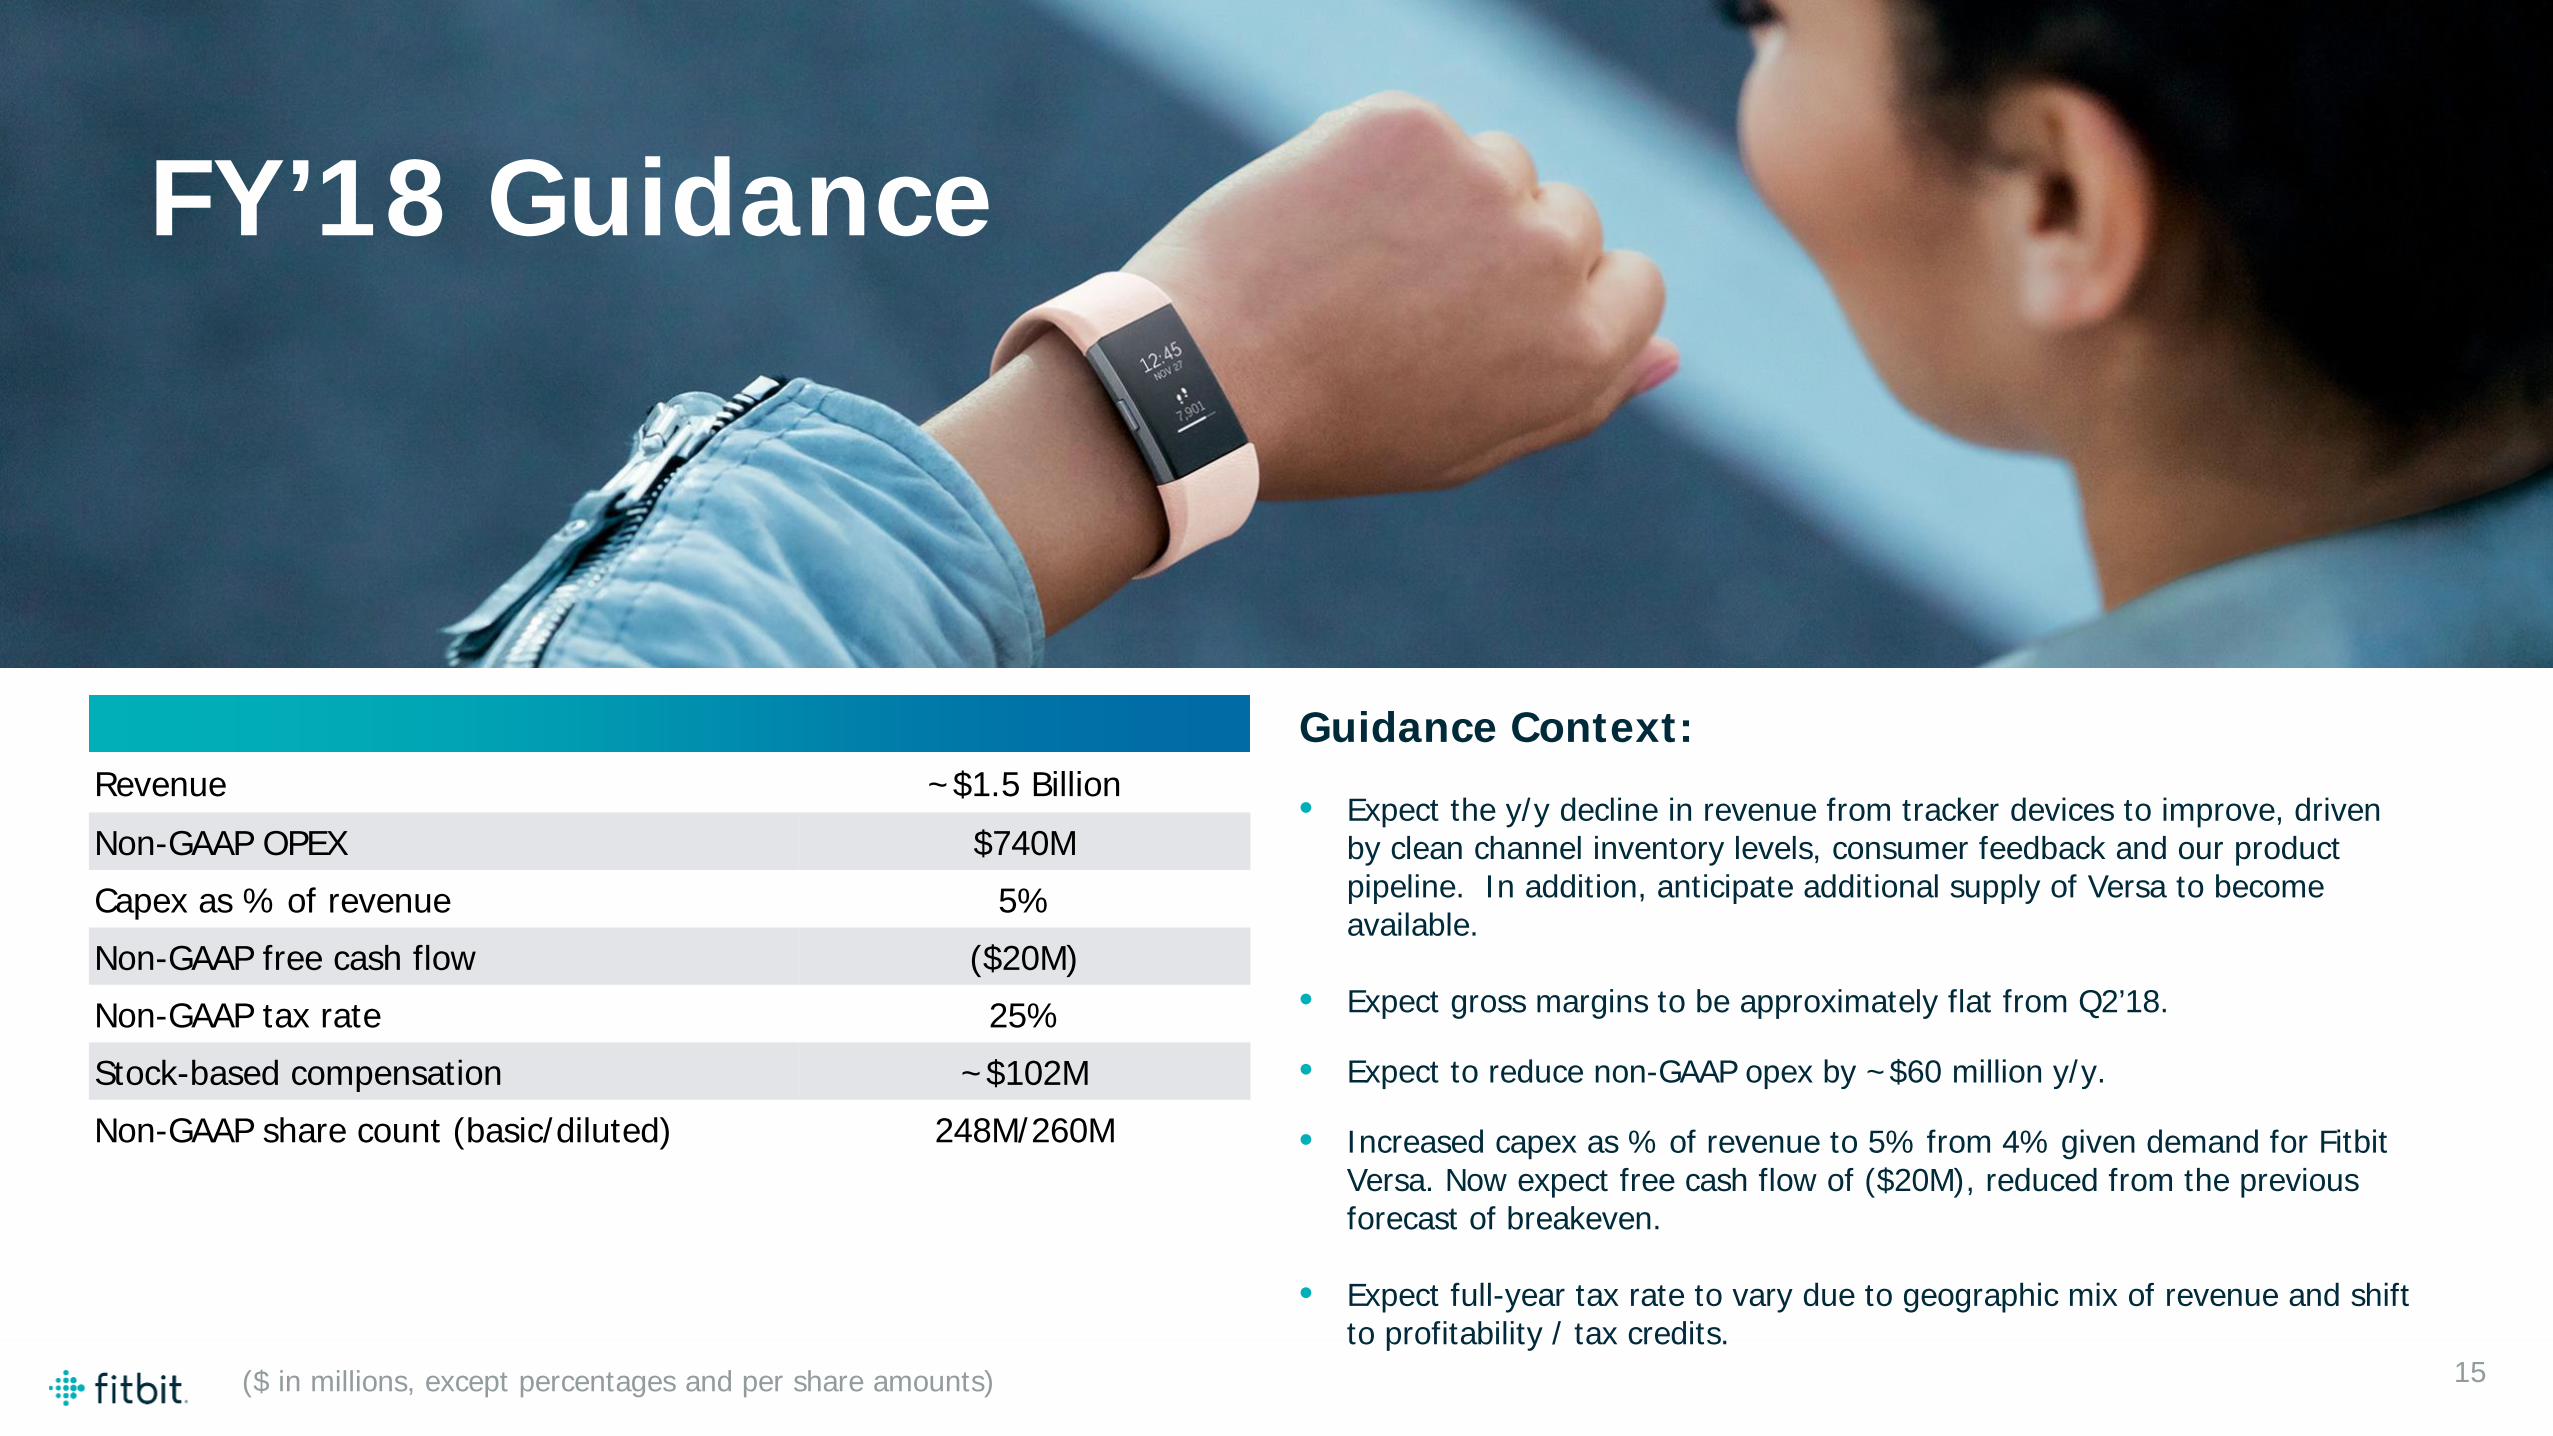
FY’18 Guidance
Revenue ~$1.5 BillionNon-GAAP OPEX $740MCapex as % of revenue 5%Non-GAAP free cash flow ($20M)Non-GAAP tax rate 25%Stock-based compensation ~$102MNon-GAAP share count (basic/diluted) 248M/260M
15
Guidance Context:
• Expect the y/y decline in revenue from tracker devices to improve, driven by clean channel inventory levels, consumer feedback and our product pipeline. In addition, anticipate additional supply of Versa to become available.
• Expect gross margins to be approximately flat from Q2’18.
• Expect to reduce non-GAAP opex by ~$60 million y/y.
• Increased capex as % of revenue to 5% from 4% given demand for Fitbit Versa. Now expect free cash flow of ($20M), reduced from the previous forecast of breakeven.
• Expect full-year tax rate to vary due to geographic mix of revenue and shift to profitability / tax credits.
©2017 Fitbit, Inc. All rights reserved. Proprietary & Confidential.
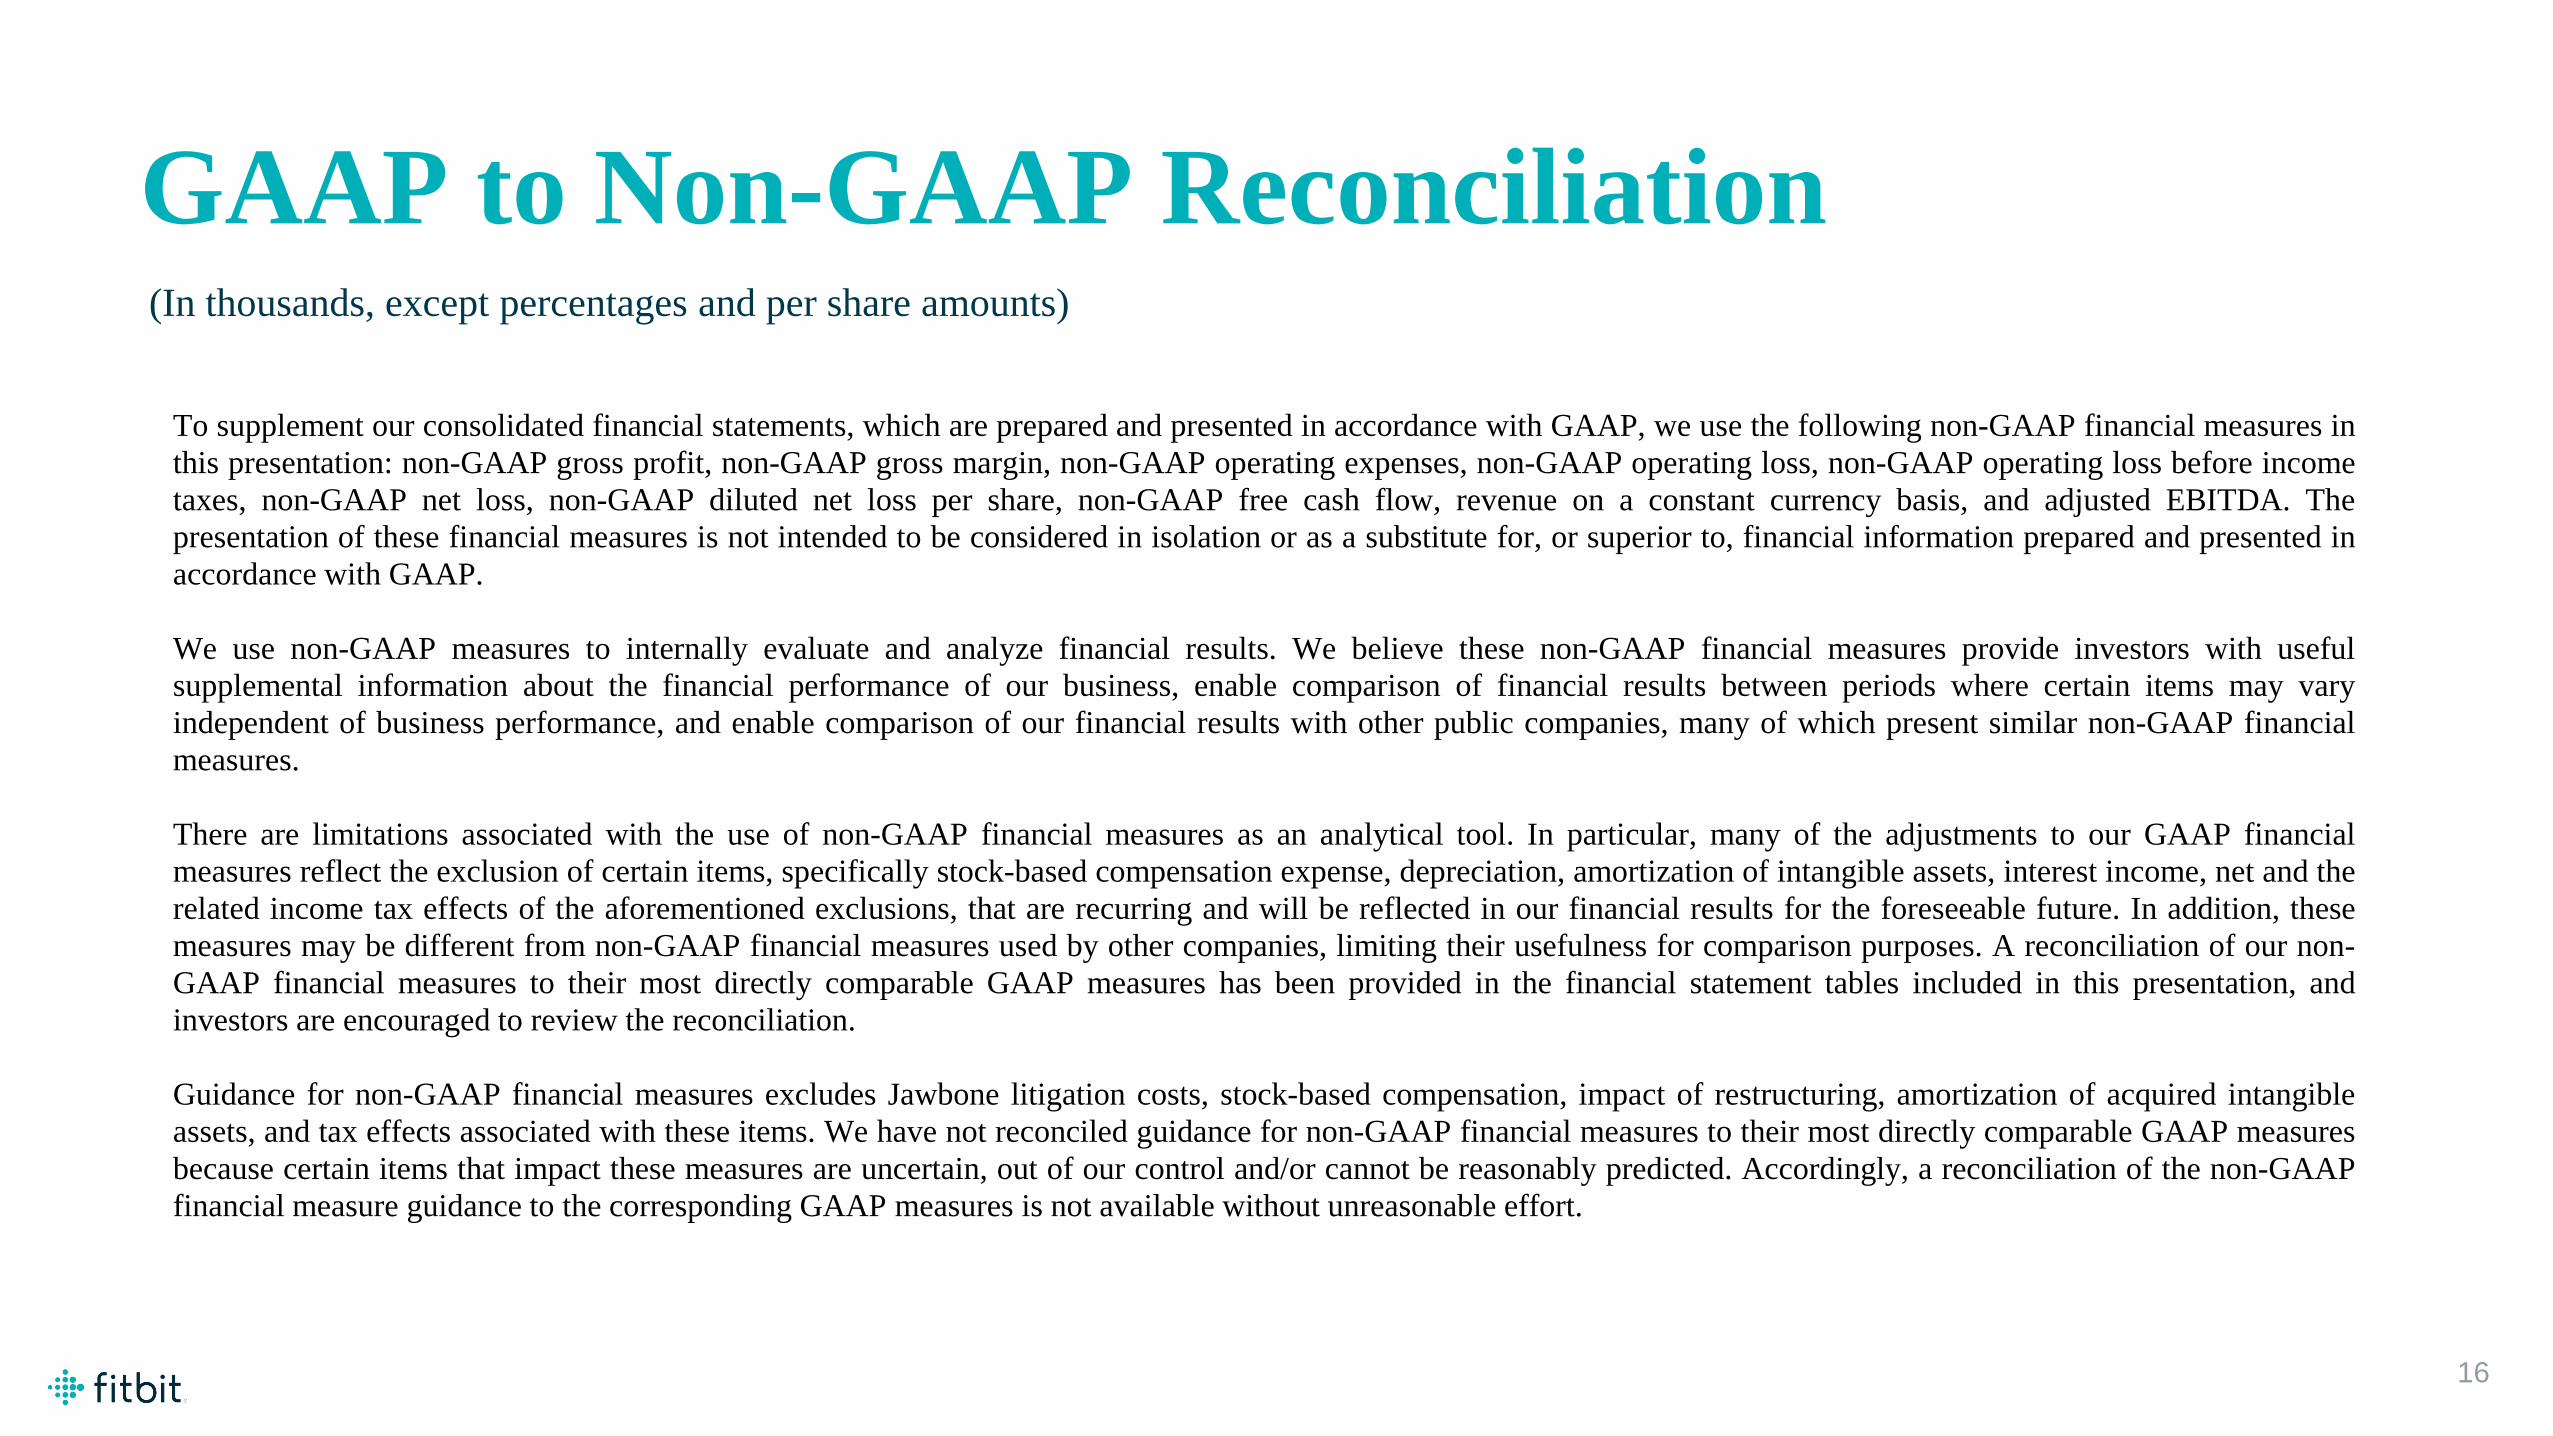
GAAP to Non-GAAP Reconciliation(In thousands, except percentages and per share amounts)
To supplement our consolidated financial statements, which are prepared and presented in accordance with GAAP, we use the following non-GAAP financial measures inthis presentation: non-GAAP gross profit, non-GAAP gross margin, non-GAAP operating expenses, non-GAAP operating loss, non-GAAP operating loss before incometaxes, non-GAAP net loss, non-GAAP diluted net loss per share, non-GAAP free cash flow, revenue on a constant currency basis, and adjusted EBITDA. Thepresentation of these financial measures is not intended to be considered in isolation or as a substitute for, or superior to, financial information prepared and presented inaccordance with GAAP.
We use non-GAAP measures to internally evaluate and analyze financial results. We believe these non-GAAP financial measures provide investors with usefulsupplemental information about the financial performance of our business, enable comparison of financial results between periods where certain items may varyindependent of business performance, and enable comparison of our financial results with other public companies, many of which present similar non-GAAP financialmeasures.
There are limitations associated with the use of non-GAAP financial measures as an analytical tool. In particular, many of the adjustments to our GAAP financialmeasures reflect the exclusion of certain items, specifically stock-based compensation expense, depreciation, amortization of intangible assets, interest income, net and therelated income tax effects of the aforementioned exclusions, that are recurring and will be reflected in our financial results for the foreseeable future. In addition, thesemeasures may be different from non-GAAP financial measures used by other companies, limiting their usefulness for comparison purposes. A reconciliation of our non-GAAP financial measures to their most directly comparable GAAP measures has been provided in the financial statement tables included in this presentation, andinvestors are encouraged to review the reconciliation.
Guidance for non-GAAP financial measures excludes Jawbone litigation costs, stock-based compensation, impact of restructuring, amortization of acquired intangibleassets, and tax effects associated with these items. We have not reconciled guidance for non-GAAP financial measures to their most directly comparable GAAP measuresbecause certain items that impact these measures are uncertain, out of our control and/or cannot be reasonably predicted. Accordingly, a reconciliation of the non-GAAPfinancial measure guidance to the corresponding GAAP measures is not available without unreasonable effort.
16

©2017 Fitbit, Inc. All rights reserved. Proprietary & Confidential.
GAAP to Non-GAAP Reconciliation(In thousands, except percentages and per share amounts)
The following are explanations of the adjustments that are reflected in one or more of our non-GAAP financial measures:
Stock-based compensation expense relates to equity awards granted primarily to our employees. We exclude stock-based compensation expense because we believe that thenon-GAAP financial measures excluding this item provide meaningful supplemental information regarding operational performance. In particular, companies calculatestock-based compensation expense using a variety of valuation methodologies and subjective assumptions.
In January 2017, the Company conducted a reorganization of its business, including a reduction in workforce. The restructuring costs impacted our results for the firstquarter of 2017. Restructuring costs primarily included severance-related costs. We believe that excluding expenses provides great visibility to the underlying performanceof our business operations, facilitates comparison of our results with other periods, and may also facilitate comparison with the results of other companies in our industry.
Litigation expense relates to legal costs incurred due to litigation with Aliphcom, Inc. d/b/a Jawbone. We exclude these expenses because we do not believe these expenseshave a direct correlation to the operations of our business and because of the singular nature of the claims underlying the Jawbone litigation matters. We began excludingJawbone litigation costs in the second quarter of 2016 as these costs significantly increased in 2016.
Amortization of intangible assets relates to our acquisitions of FitStar, Pebble, Vector and Twine Health. We exclude these amortization expenses because we do notbelieve these expenses have a direct correlation to the operation of our business.
Income tax effect of non-GAAP adjustments relates to the tax effect of the adjustments that we incorporate into non-GAAP financial measures such as stock-basedcompensation, amortization of intangibles, restructuring and valuation allowance in order to provide a more meaningful measure of non-GAAP net income (loss).
17
©2017 Fitbit, Inc. All rights reserved. Proprietary & Confidential.
GAAP to Non-GAAP Reconciliation(In thousands, except percentages and per share amounts)
GAAP gross profit
18
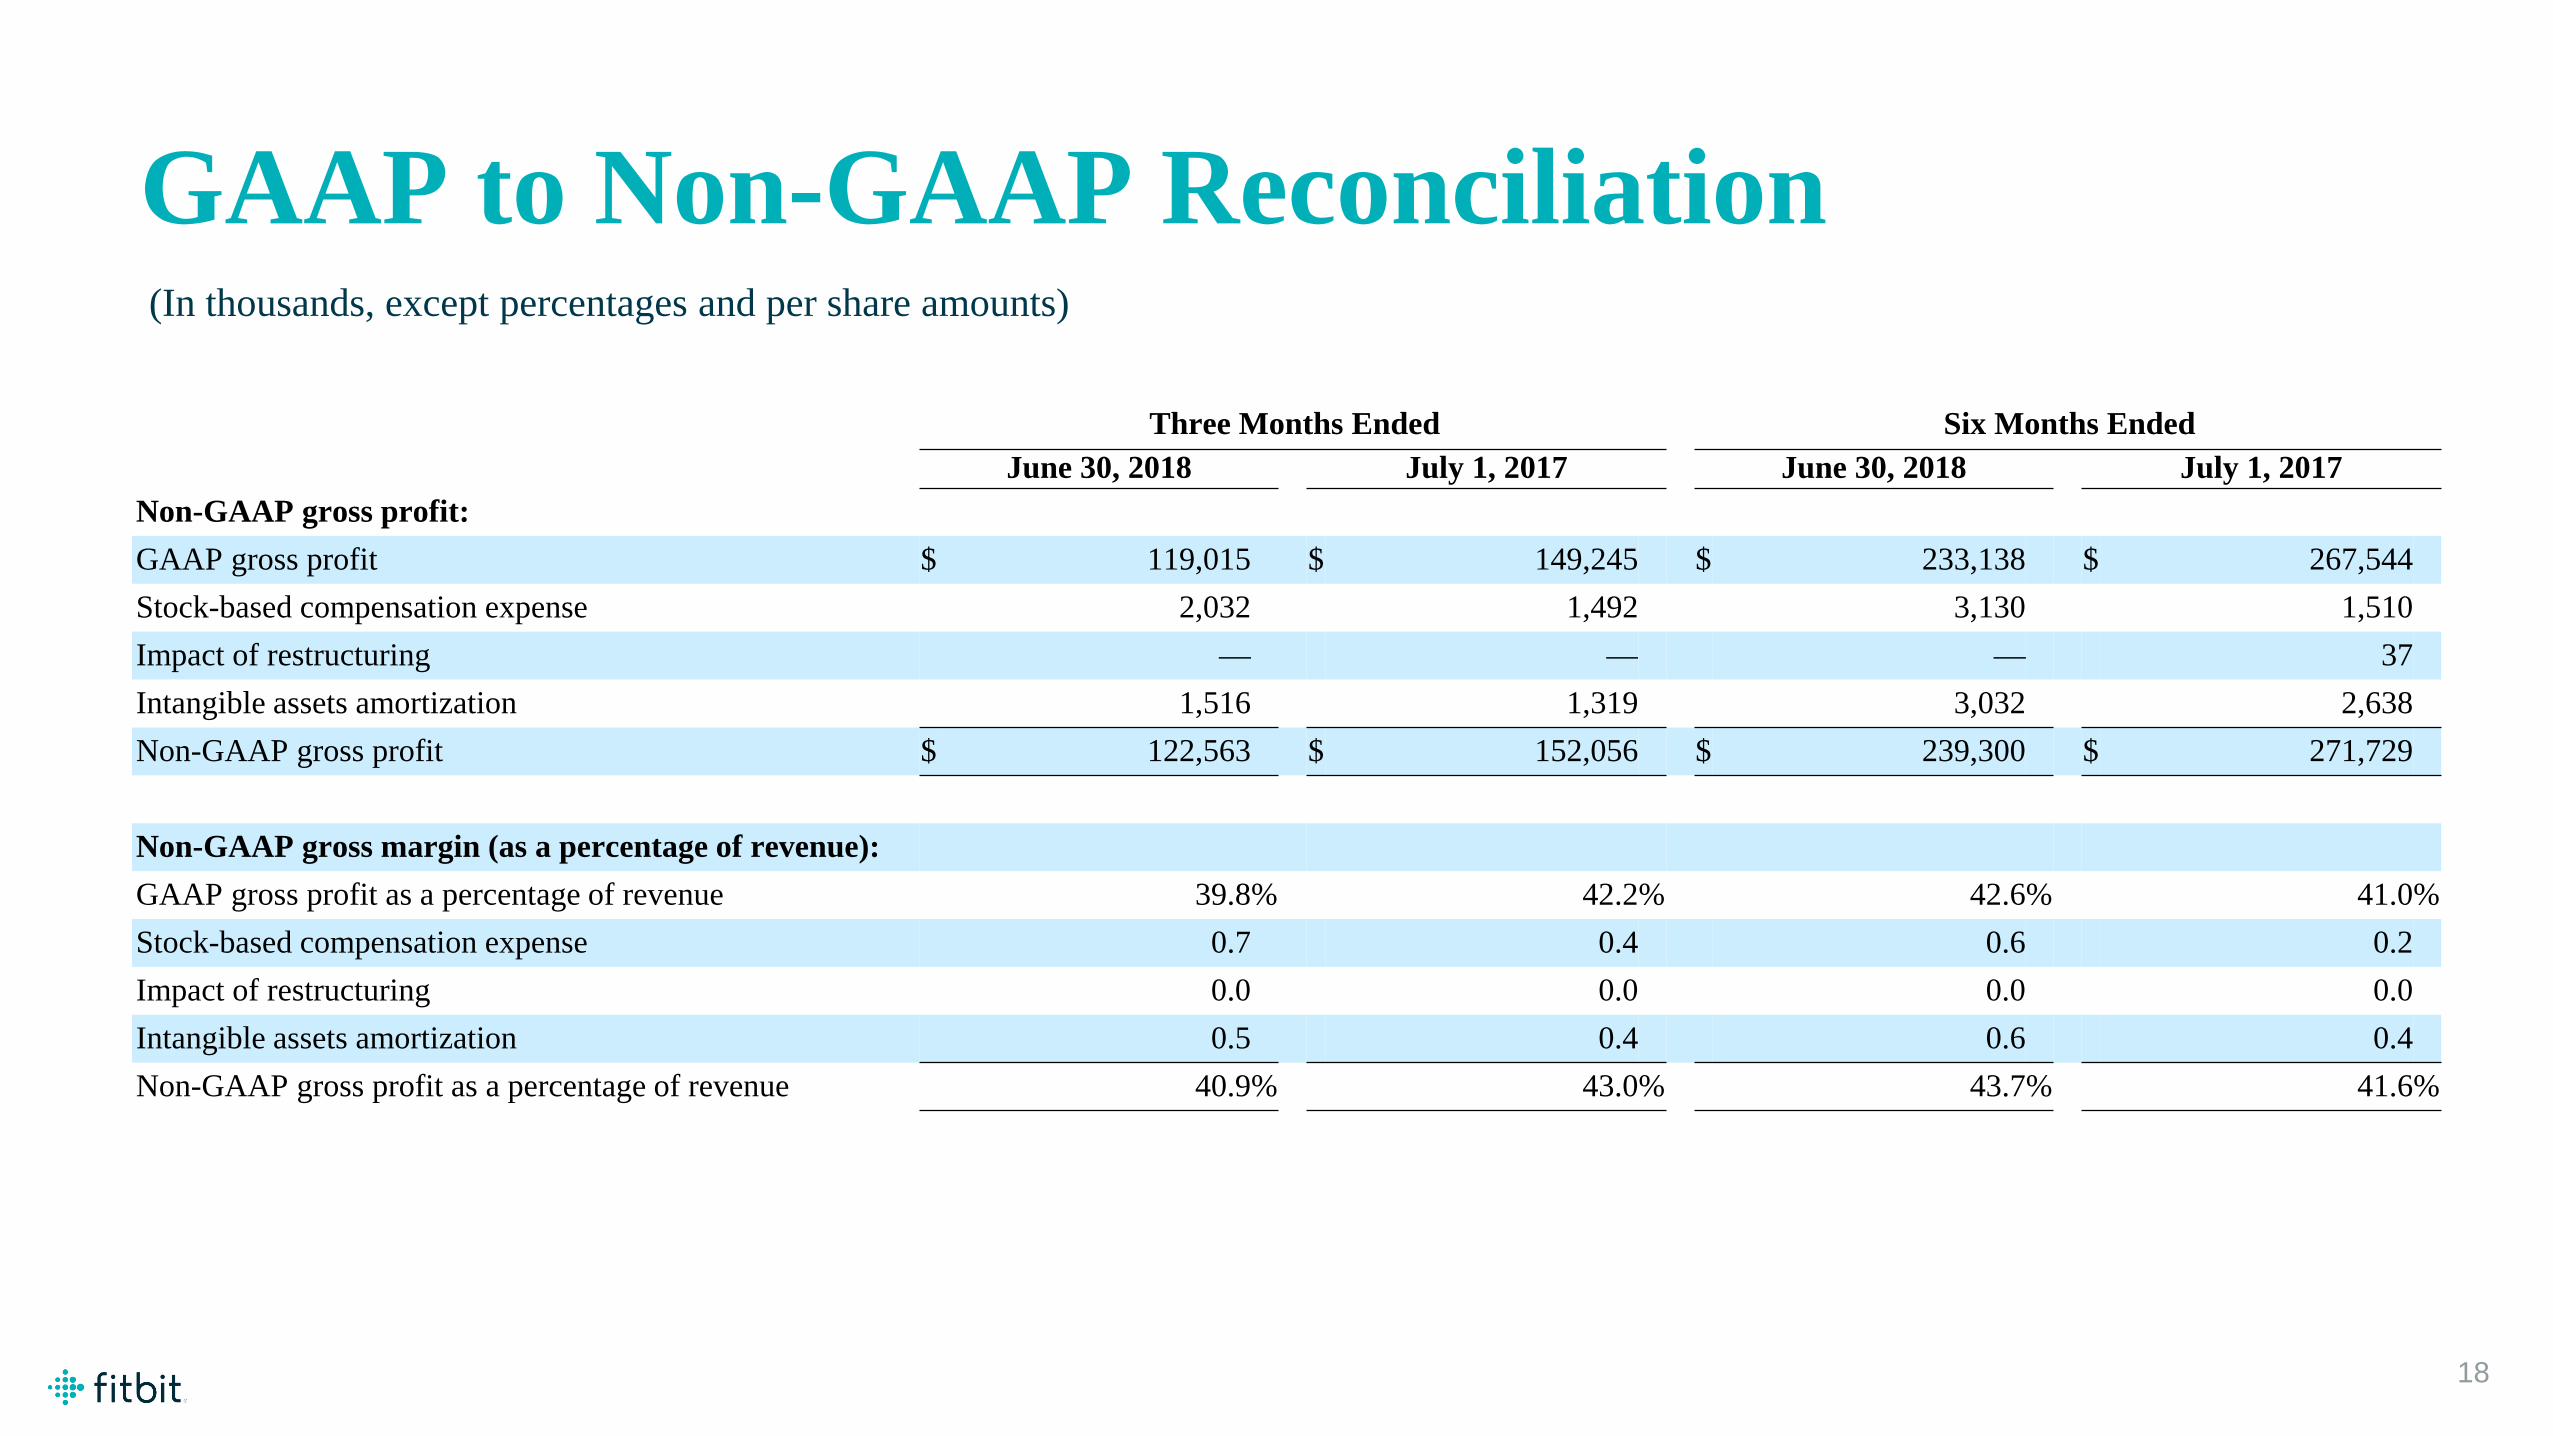
Three Months Ended Six Months EndedJune 30, 2018 July 1, 2017 June 30, 2018 July 1, 2017
Non-GAAP gross profit:GAAP gross profit $ 119,015 $ 149,245 $ 233,138 $ 267,544Stock-based compensation expense 2,032 1,492 3,130 1,510Impact of restructuring — — — 37Intangible assets amortization 1,516 1,319 3,032 2,638Non-GAAP gross profit $ 122,563 $ 152,056 $ 239,300 $ 271,729
Non-GAAP gross margin (as a percentage of revenue):GAAP gross profit as a percentage of revenue 39.8% 42.2% 42.6% 41.0%Stock-based compensation expense 0.7 0.4 0.6 0.2Impact of restructuring 0.0 0.0 0.0 0.0Intangible assets amortization 0.5 0.4 0.6 0.4Non-GAAP gross profit as a percentage of revenue 40.9% 43.0% 43.7% 41.6%

©2017 Fitbit, Inc. All rights reserved. Proprietary & Confidential.
GAAP to Non-GAAP Reconciliation(In thousands, except percentages and per share amounts)
19
Three Months Ended Six Months EndedJune 30, 2018 July 1, 2017 June 30, 2018 July 1, 2017
Non-GAAP research and development:GAAP research and development $ 87,047 $ 80,543 $ 176,383 $ 168,301Stock-based compensation expense (15,090) (12,648) (29,762) (26,992)Impact of restructuring — — — (2,744)Non-GAAP research and development $ 71,957 $ 67,895 $ 146,621 $ 138,565
Non-GAAP sales and marketing:GAAP sales and marketing $ 100,845 $ 100,732 $ 172,897 $ 191,906Stock-based compensation expense (3,911) (3,987) (7,358) (7,235)Impact of restructuring — — — (2,000)Intangible assets amortization $ (470) $ — (630) —Non-GAAP sales and marketing $ 96,464 $ 96,745 $ 164,909 $ 182,671
Non-GAAP general and administrative:GAAP general and administrative $ 30,211 $ 31,379 $ 66,299 $ 62,125Stock-based compensation expense (4,824) (3,839) (9,249) (7,994)Litigation expense — (1,533) (765) (1,419)Impact of restructuring — — — (1,594)Intangible assets amortization (71) (58) (143) (115)Non-GAAP general and administrative $ 25,316 $ 25,949 $ 56,142 $ 51,003

©2017 Fitbit, Inc. All rights reserved. Proprietary & Confidential.
GAAP to Non-GAAP Reconciliation(In thousands, except percentages and per share amounts)
20
Three Months Ended Six Months Ended
June 30, 2018 July 1, 2017 June 30, 2018 July 1, 2017Non-GAAP operating expenses:GAAP operating expenses $ 218,103 $ 212,654 $ 415,579 $ 422,332Stock-based compensation expense (23,825) (20,474) (46,369) (42,221)Litigation expense — (1,533) (765) (1,419)Impact of restructuring — — — (6,338)Intangible assets amortization (541) (58) (773) (115)Non-GAAP operating expenses $ 193,737 $ 190,589 $ 367,672 $ 372,239
©2017 Fitbit, Inc. All rights reserved. Proprietary & Confidential.
GAAP to Non-GAAP Reconciliation(In thousands, except percentages and per share amounts)
21
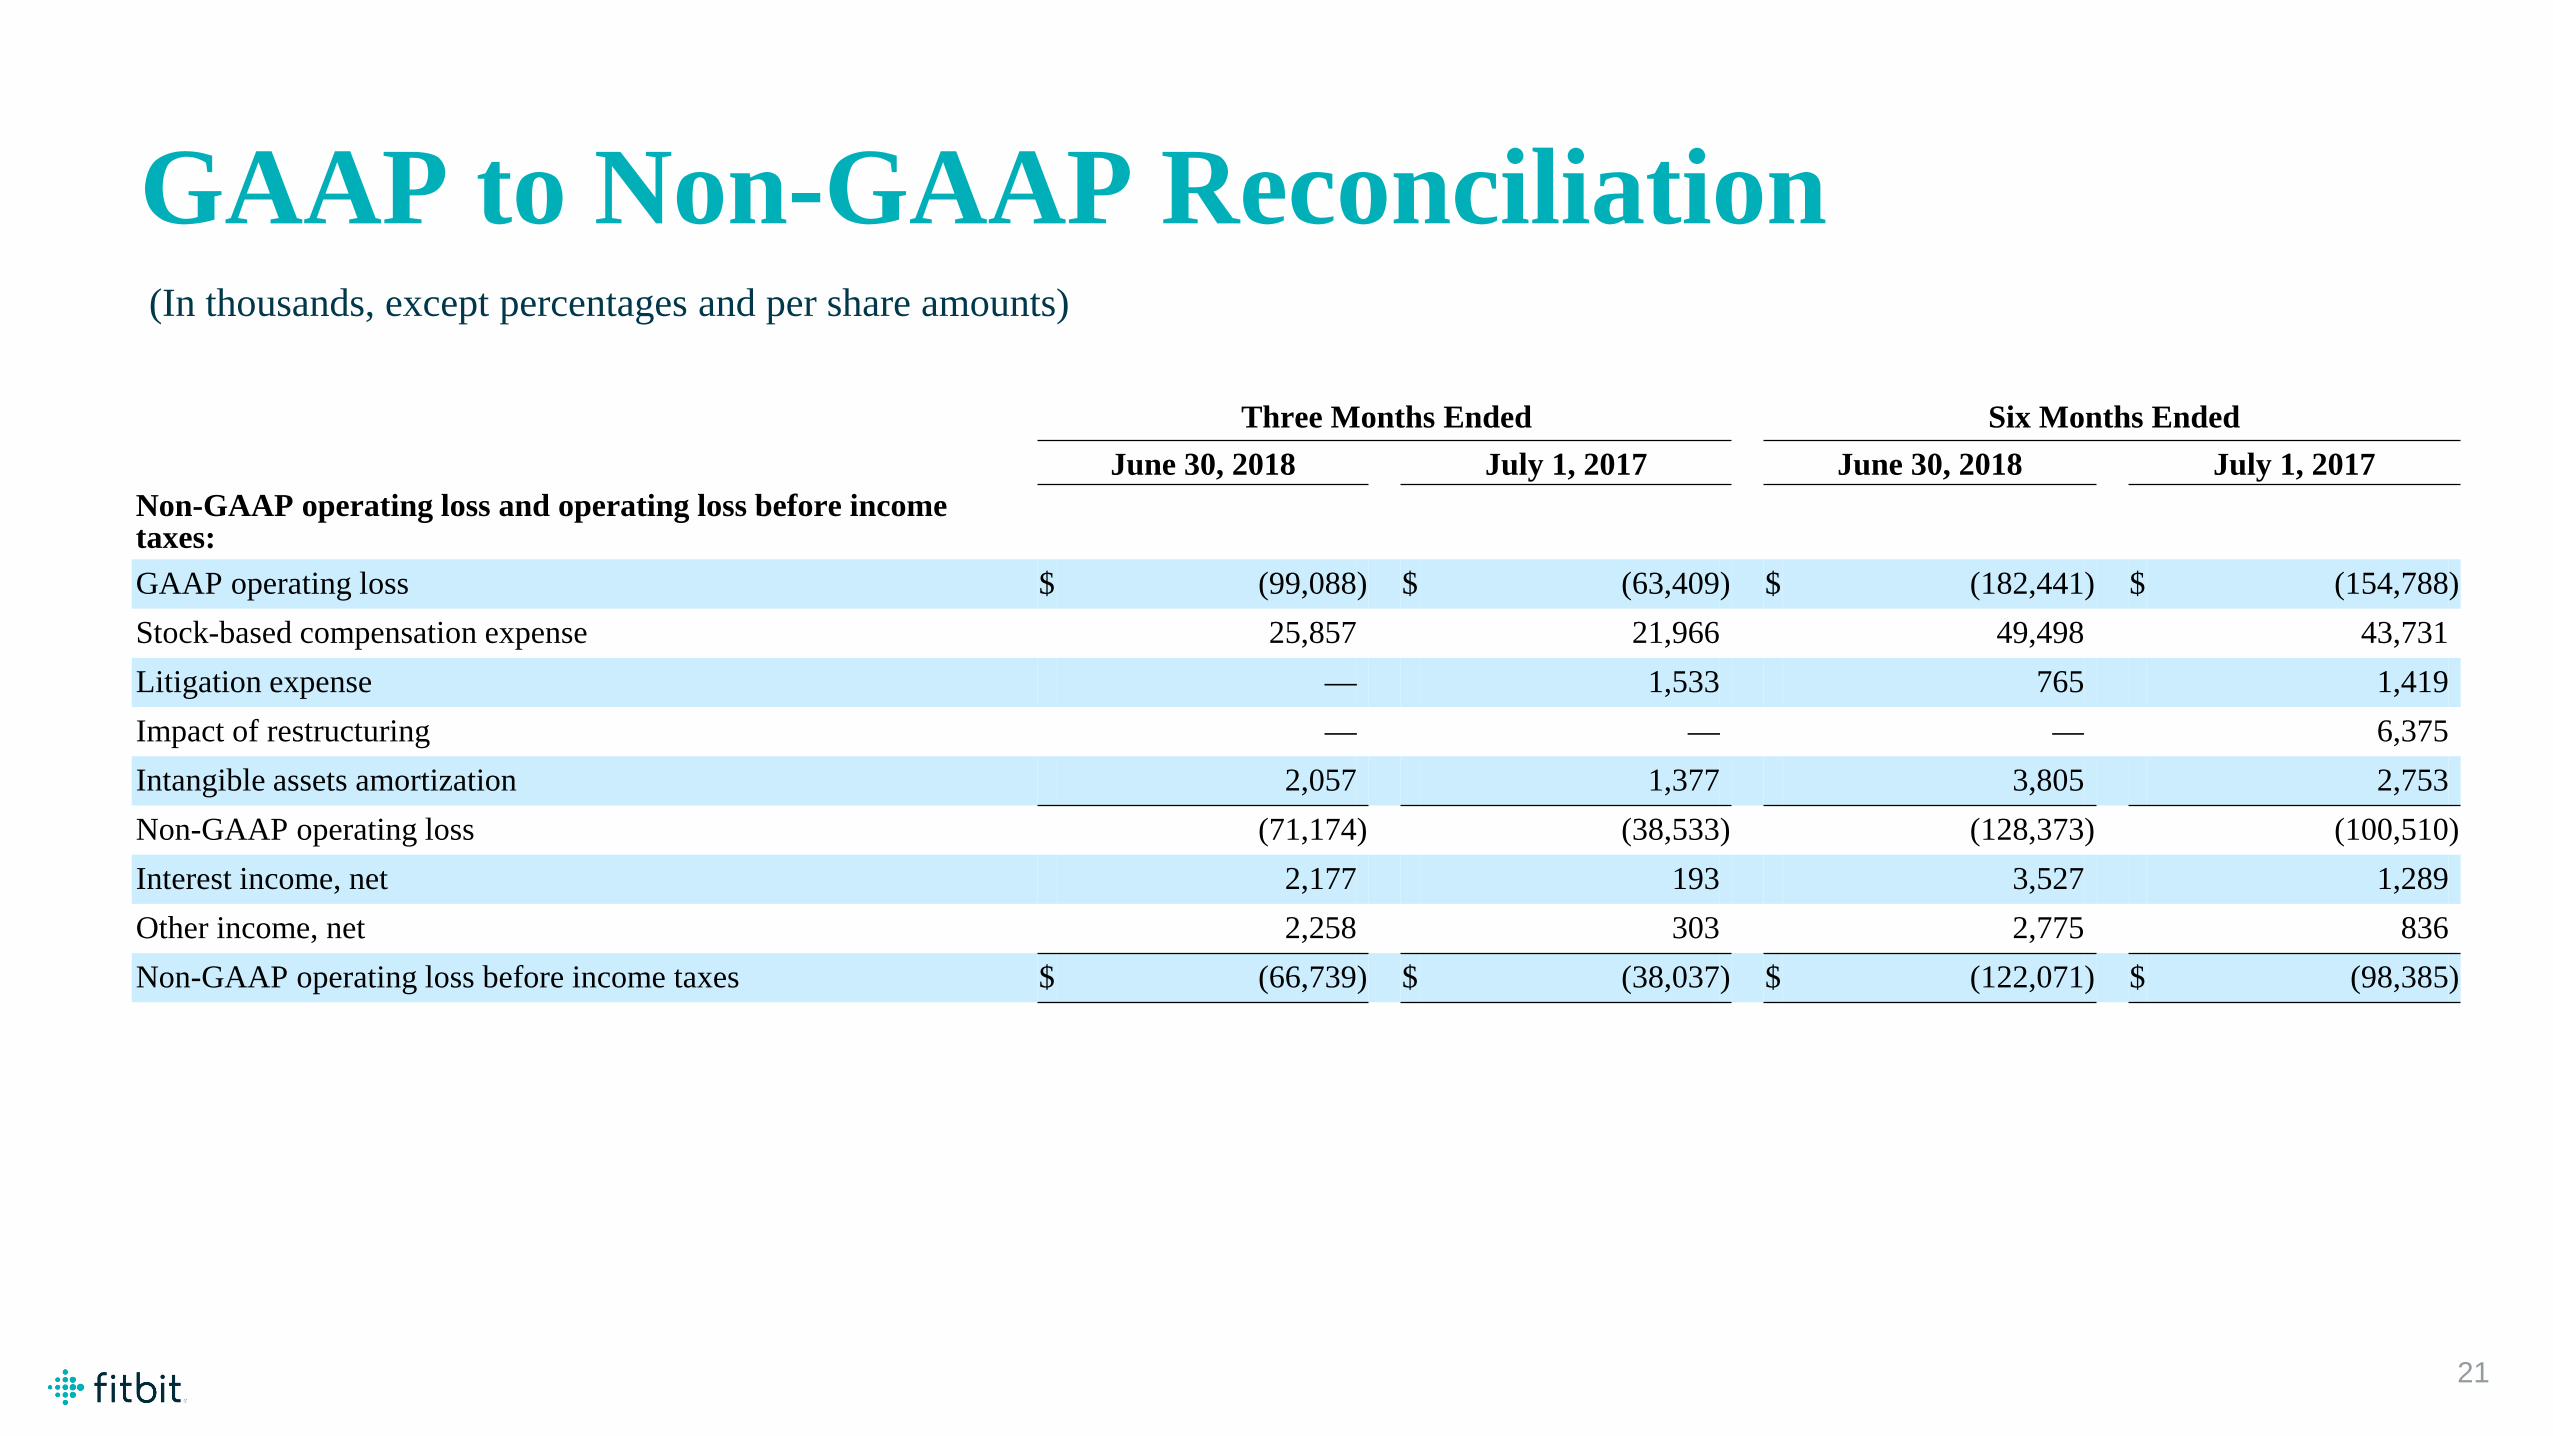
Three Months Ended Six Months EndedJune 30, 2018 July 1, 2017 June 30, 2018 July 1, 2017
Non-GAAP operating loss and operating loss before income taxes:GAAP operating loss $ (99,088) $ (63,409) $ (182,441) $ (154,788)Stock-based compensation expense 25,857 21,966 49,498 43,731Litigation expense — 1,533 765 1,419Impact of restructuring — — — 6,375Intangible assets amortization 2,057 1,377 3,805 2,753Non-GAAP operating loss (71,174) (38,533) (128,373) (100,510)Interest income, net 2,177 193 3,527 1,289Other income, net 2,258 303 2,775 836Non-GAAP operating loss before income taxes $ (66,739) $ (38,037) $ (122,071) $ (98,385)
©2017 Fitbit, Inc. All rights reserved. Proprietary & Confidential.
GAAP to Non-GAAP Reconciliation(In thousands, except percentages and per share amounts)
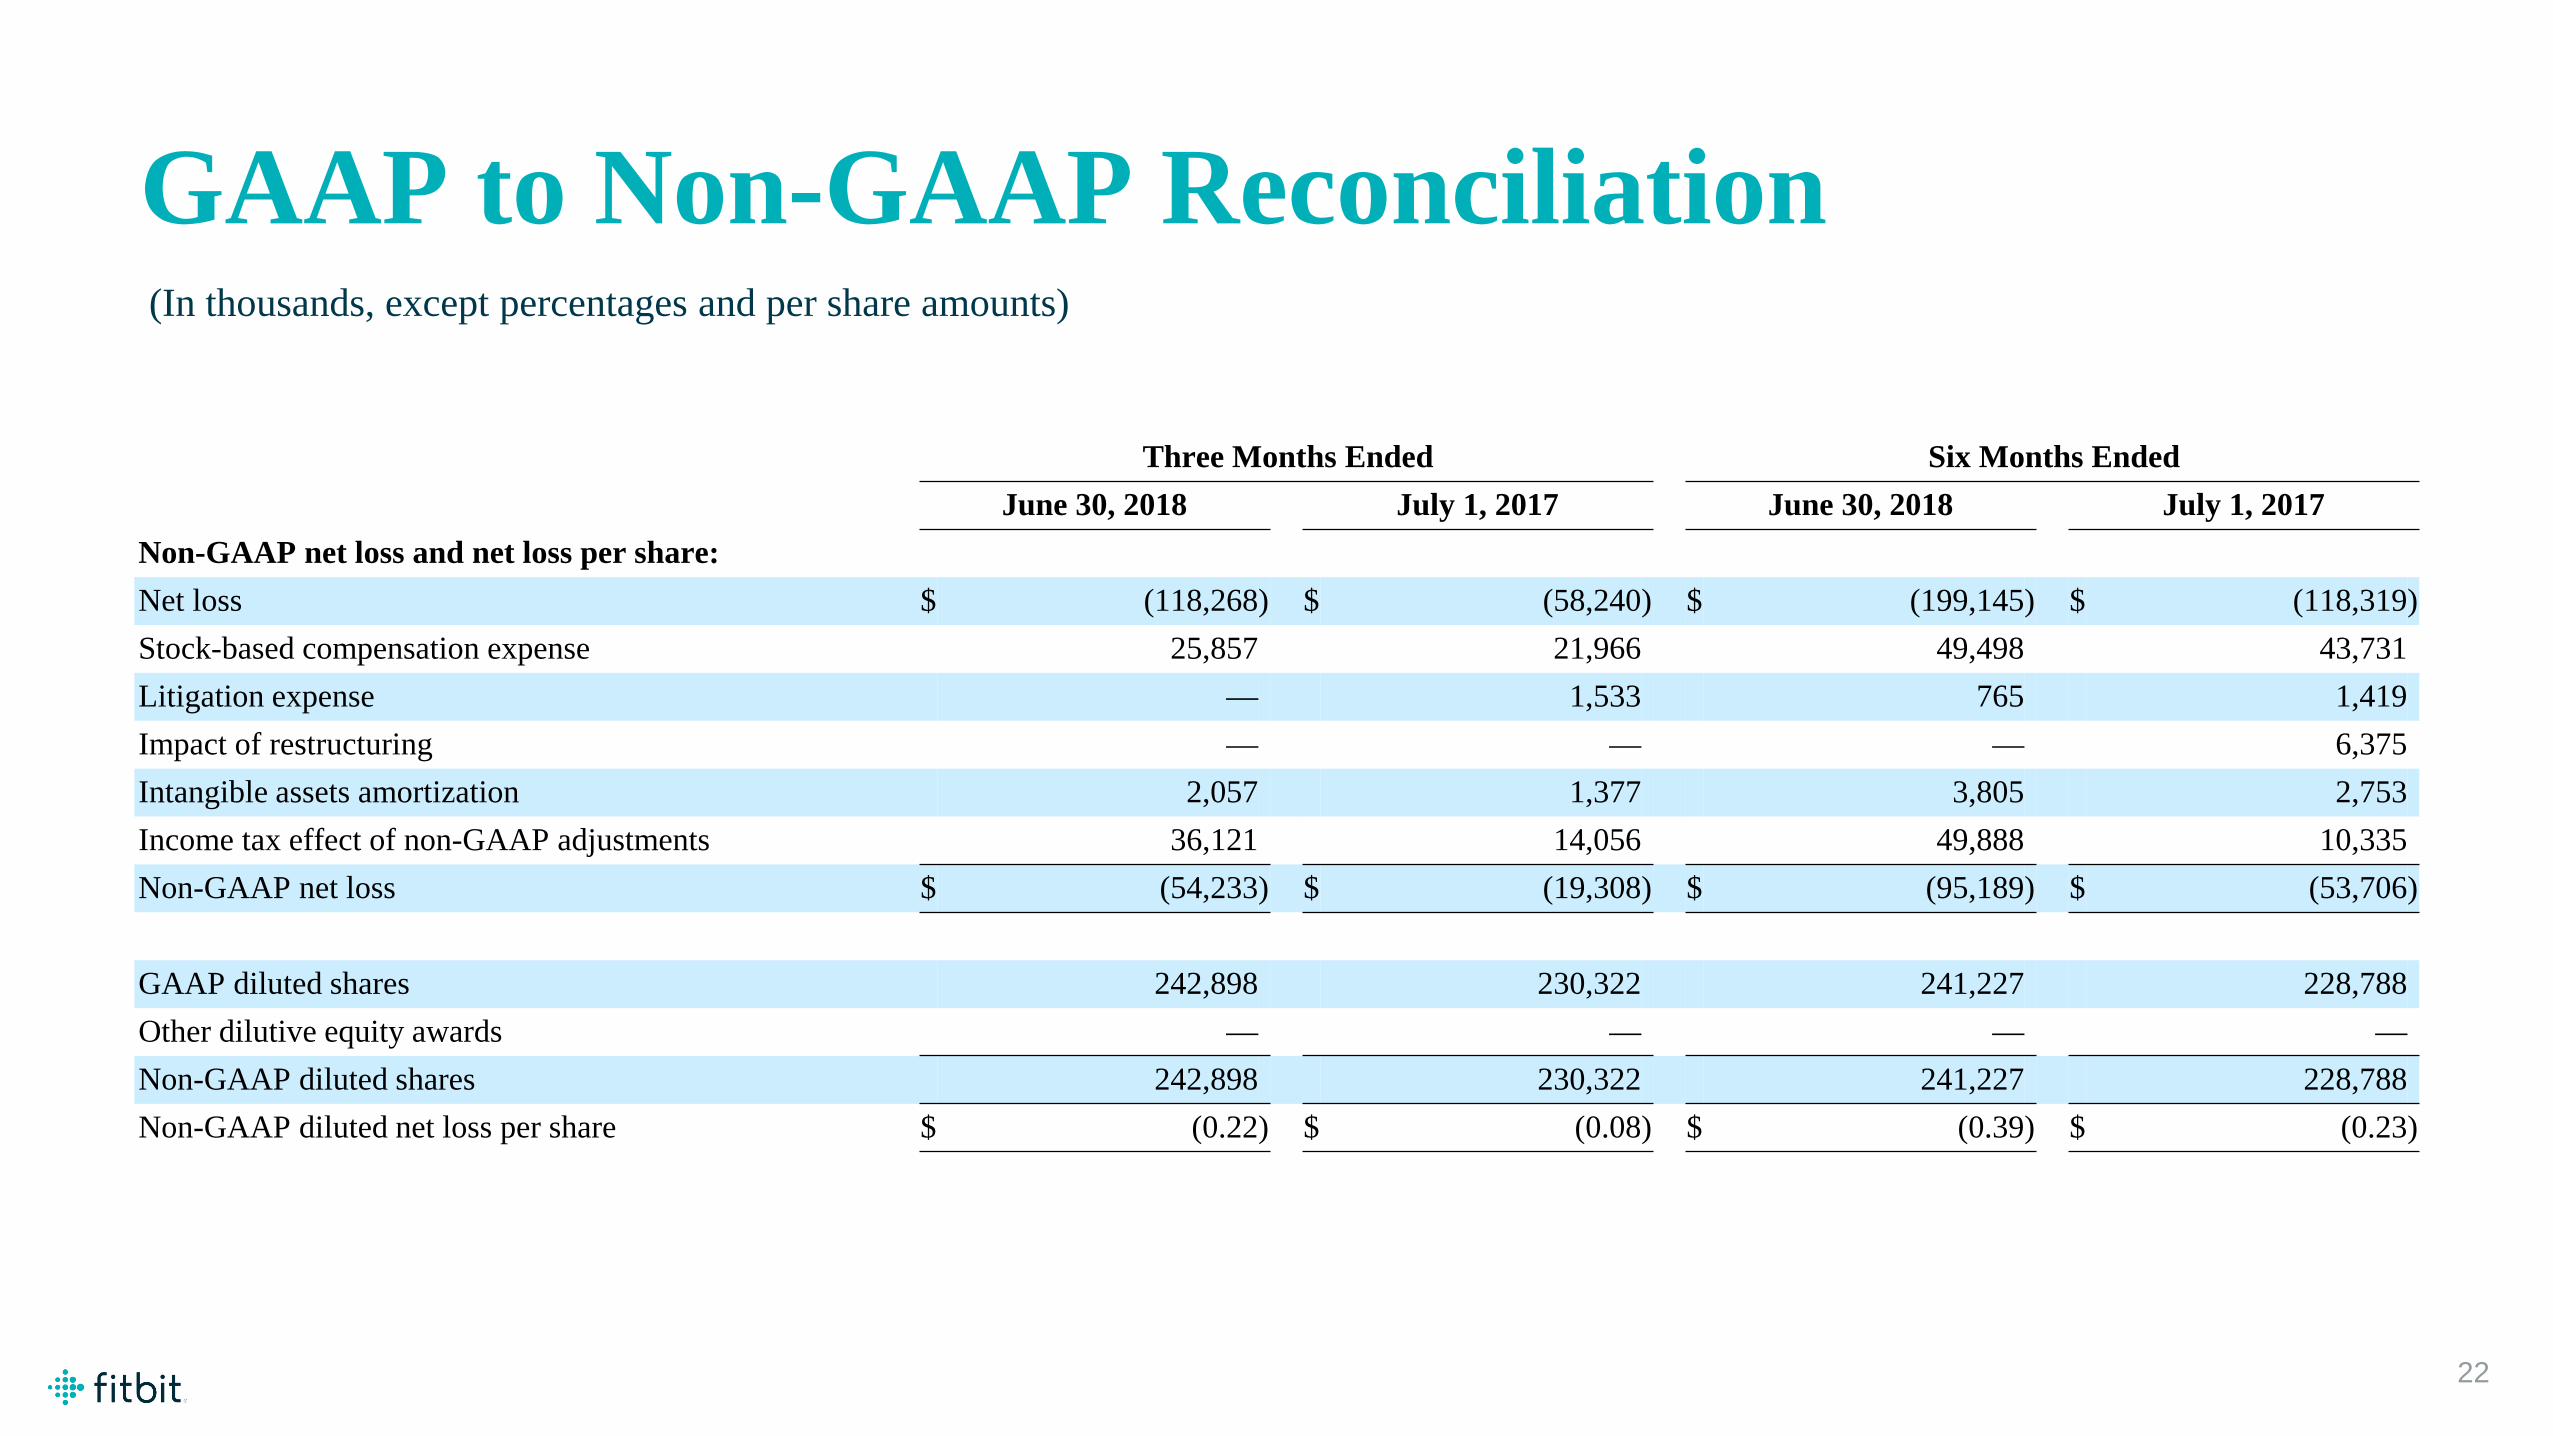
22
Three Months Ended Six Months EndedJune 30, 2018 July 1, 2017 June 30, 2018 July 1, 2017
Non-GAAP net loss and net loss per share:Net loss $ (118,268) $ (58,240) $ (199,145) $ (118,319)Stock-based compensation expense 25,857 21,966 49,498 43,731Litigation expense — 1,533 765 1,419Impact of restructuring — — — 6,375Intangible assets amortization 2,057 1,377 3,805 2,753Income tax effect of non-GAAP adjustments 36,121 14,056 49,888 10,335Non-GAAP net loss $ (54,233) $ (19,308) $ (95,189) $ (53,706)
GAAP diluted shares 242,898 230,322 241,227 228,788Other dilutive equity awards — — — —Non-GAAP diluted shares 242,898 230,322 241,227 228,788Non-GAAP diluted net loss per share $ (0.22) $ (0.08) $ (0.39) $ (0.23)

©2017 Fitbit, Inc. All rights reserved. Proprietary & Confidential.
GAAP to Non-GAAP Reconciliation(In thousands, except percentages and per share amounts)
23
Three Months Ended Six Months EndedJune 30, 2018 July 1, 2017 June 30, 2018 July 1, 2017
Non-GAAP free cash flow:Net cash provided by (used in) operating activities $ (67,375) $ (45,910) $ (57,217) $ 3,228Purchases of property and equipment (15,908) (11,660) (28,524) (39,817)Non-GAAP Free cash flow $ (83,283) $ (57,570) $ (85,741) $ (36,589)Net cash provided by (used in) investing activities $ 12,193 $ (17,011) $ 43,363 $ 7,455Net cash provided by financing activities $ 4,938 $ 6,719 $ 4 $ 6,173
©2017 Fitbit, Inc. All rights reserved. Proprietary & Confidential.
GAAP to Non-GAAP Reconciliation(In thousands, except percentages and per share amounts)
24
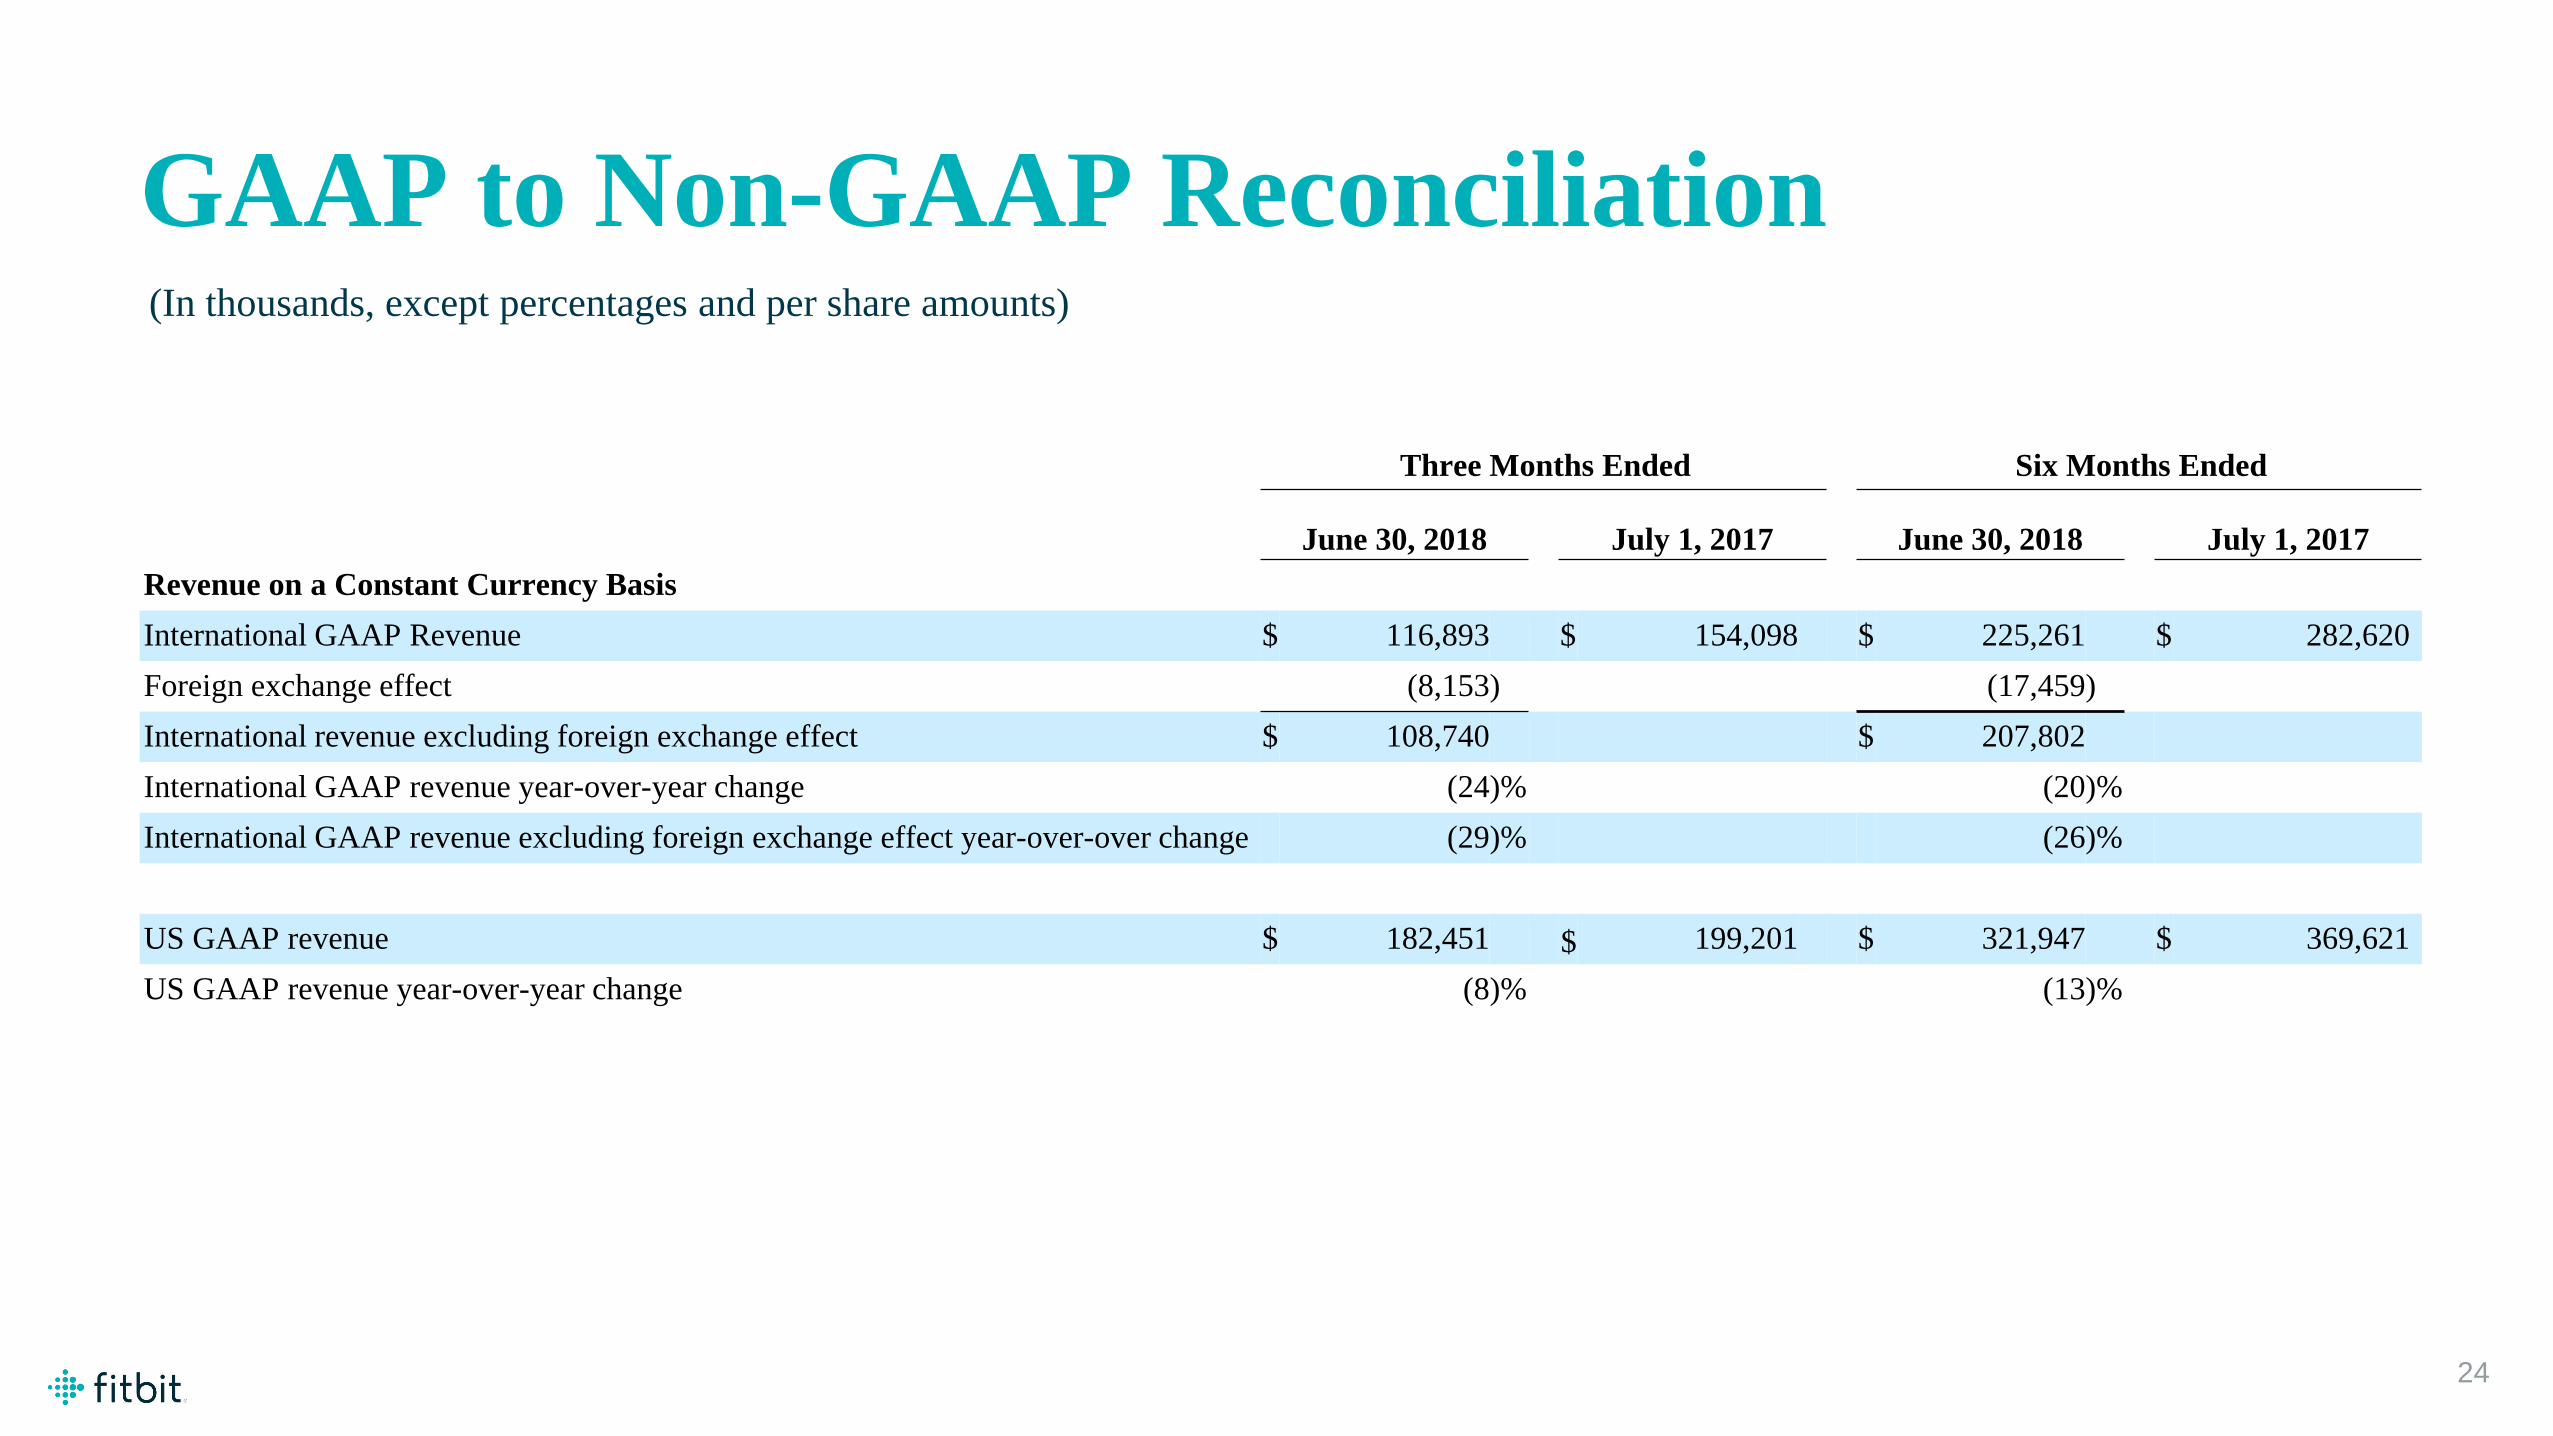
Three Months Ended Six Months Ended
June 30, 2018 July 1, 2017 June 30, 2018 July 1, 2017Revenue on a Constant Currency BasisInternational GAAP Revenue $ 116,893 $ 154,098 $ 225,261 $ 282,620Foreign exchange effect (8,153) (17,459)International revenue excluding foreign exchange effect $ 108,740 $ 207,802International GAAP revenue year-over-year change (24)% (20)%International GAAP revenue excluding foreign exchange effect year-over-over change (29)% (26)%
US GAAP revenue $ 182,451 $ 199,201 $ 321,947 $ 369,621US GAAP revenue year-over-year change (8)% (13)%

©2017 Fitbit, Inc. All rights reserved. Proprietary & Confidential.
GAAP to Non-GAAP Reconciliation(In thousands, except percentages and per share amounts)
25
Three Months Ended Six Months EndedJune 30, 2018 July 1, 2017 June 30, 2018 July 1, 2017
Adjusted EBITDA:Net income (loss) $ (118,268) $ (58,240) $ (199,145) $ (118,319)Stock-based compensation expense 25,857 21,966 49,498 43,731Litigation expense — 1,533 765 1,419Impact of restructuring — — — 6,375Depreciation and intangible assets amortization 15,173 11,435 27,377 21,952Interest income, net (2,177) (193) (3,527) (1,289)Income tax expense 23,615 (4,673) 23,006 (34,344)Adjusted EBITDA $ (55,800) $ (28,172) $ (102,026) $ (80,475)
* A portion of stock-based compensation expense for the six months ended July 1, 2017 was allocated to and included in "Impact of restructuring," thus explaining the difference between the total by function presented in this table compared to the amounts presented in the above tables.

THANK YOU