q2 2017 results - agfa corporate · 5 225 225 239 257 239 238 206 242 253 219 225 260 241 235 0 100...
TRANSCRIPT

Q2 2017 Results
23 August 2017

2
Q2'16 Q2'17 ∆ % (excl. X-rate)
H1'16 H1'17 ∆ % (excl. X-rate)
Sales 645 622 -3.6%(-4.6%) 1,248 1,210 -3.0%(-4.3%)
Gross Profit* 230 212 -7.8% 425 405 -4.7% as a % of sales 35.7% 34.1% 34.1% 33.5%
SG&A* -129 -129 0.0% -256 -258 0.8% as % of sales 20.0% 20.7% 20.5% 21.3%
R&D* -35 -36 2.9% -70 -74 5.7%
Other operating items* 0 0 0 -1
Recurring EBITDA* 78 60 -23.1% 126 99 -21.4% as a % of sales 12.1% 9.6% 10.1% 8.2%
Recurring EBIT* 64 47 -26.6% 98 73 -25.5% as a % of sales 9.9% 7.6% 7.9% 6.0%
Profit & Loss: Key Figures (in million Euro)
* Before restructuring charges and non-recurring items
3
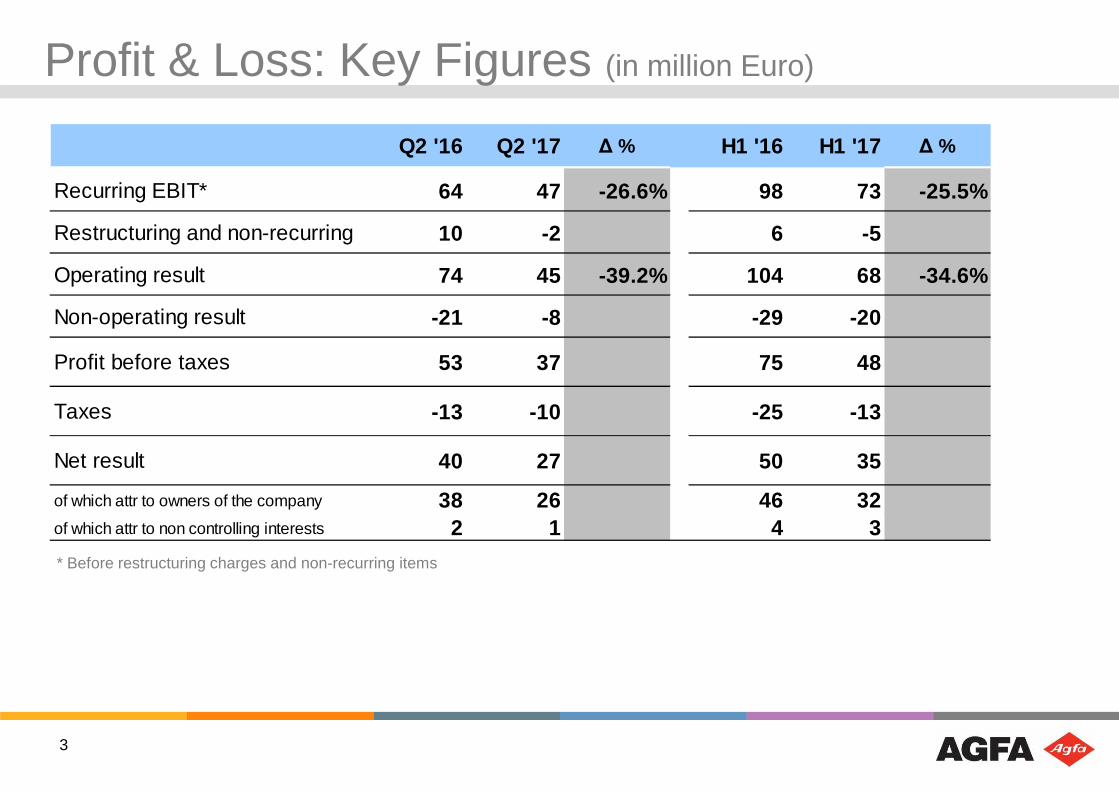
Profit & Loss: Key Figures (in million Euro)
Q2 '16 Q2 '17 ∆ % H1 '16 H1 '17 ∆ %
Recurring EBIT* 64 47 -26.6% 98 73 -25.5%
Restructuring and non-recurring 10 -2 6 -5
Operating result 74 45 -39.2% 104 68 -34.6%
Non-operating result -21 -8 -29 -20
Profit before taxes 53 37 75 48
Taxes -13 -10 -25 -13
Net result 40 27 50 35
of which attr to owners of the company 38 26 46 32of which attr to non controlling interests 2 1 4 3
* Before restructuring charges and non-recurring items
4
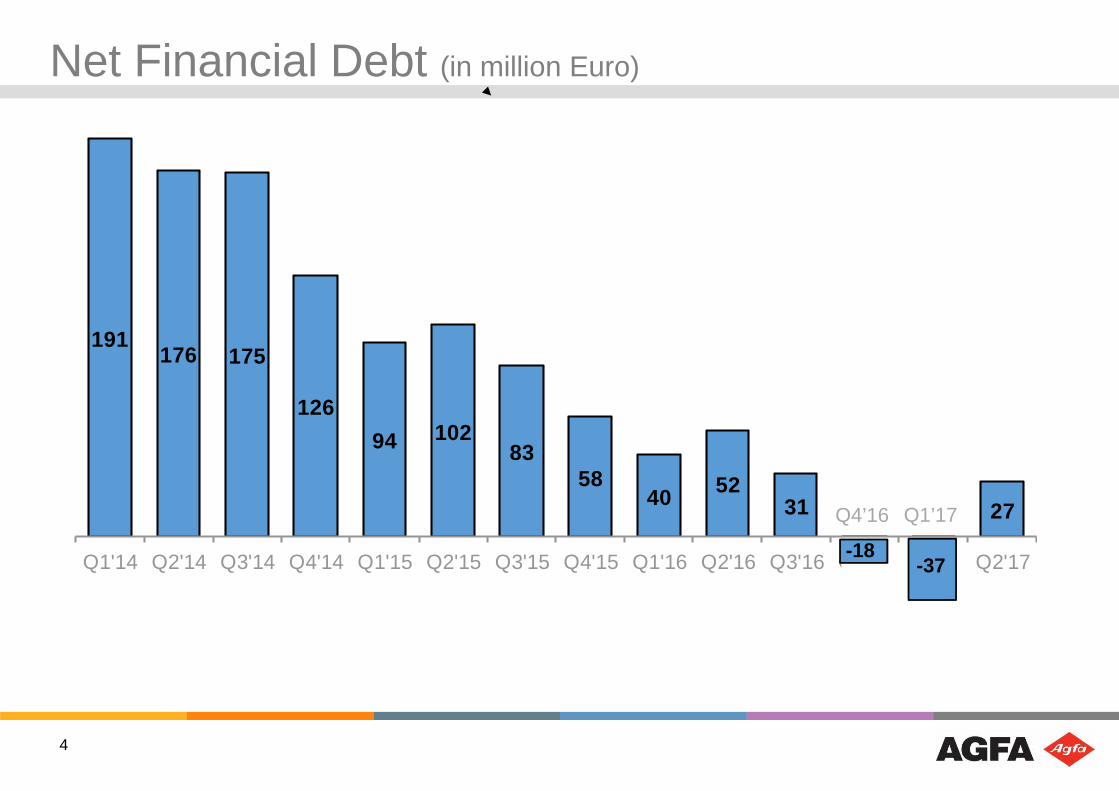
Net Financial Debt (in million Euro)
191176 175
126
94 10283
5840 52
31 27
Q1'14 Q2'14 Q3'14 Q4'14 Q1'15 Q2'15 Q3'15 Q4'15 Q1'16 Q2'16 Q3'16 Q4'16 Q1'17 Q2'17-18-37
Q4’16 Q1’17
5
225 225 239257
239 238206
242 253219 225
260235241
0
100
200
300
400
500
600
700
800
Q1'1
4Q
2'14
Q3'1
4Q
4'14
Q1'1
5Q
2'15
Q3'1
5Q
4'15
Q1'1
6Q
2'16
Q3'1
6Q
4'16
Q1'1
7Q
2'17
44 4339 42 41
46 44 4651 47 47
4149 52
46 4856
51
421388
413384 371 363 374
349 351 337364
324 330
399
0
100
200
300
400
500
600
700
800
Q1'1
4Q
2'14
Q3'1
4Q
4'14
Q1'1
5Q
2'15
Q3'1
5Q
4'15
Q1'1
6Q
2'16
Q3'1
6Q
4'16
Q1'1
7Q
2'17
6257 56
6155 55 52 55
48 50 50 52 49 49 50 50 4856
544580
512
577 575 563
512 528 542 537
483
531 534561
0
100
200
300
400
500
600
700
800
Q1'1
4Q
2'14
Q3'1
4Q
4'14
Q1'1
5Q
2'15
Q3'1
5Q
4'15
Q1'1
6Q
2'16
Q3'1
6Q
4'16
Q1'1
7Q
2'17
103 10296100
107114
102115114111
102106112114104
115116112
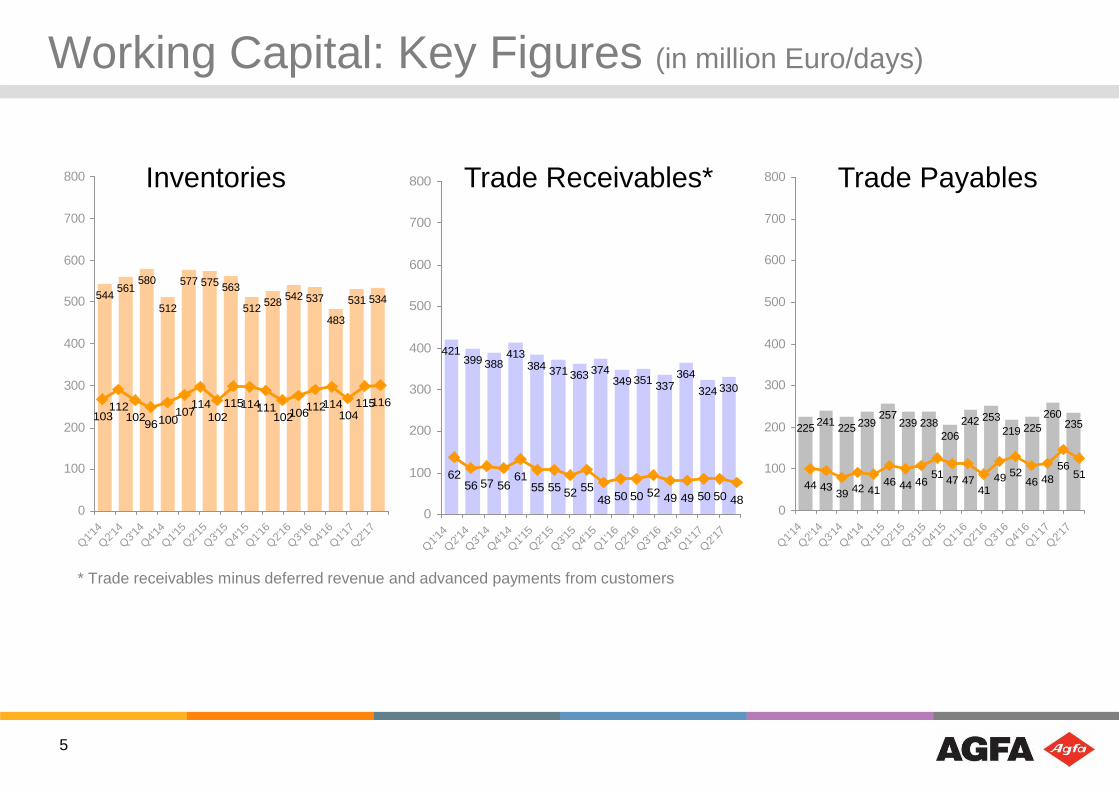
Working Capital: Key Figures (in million Euro/days)
Inventories Trade Receivables* Trade Payables
* Trade receivables minus deferred revenue and advanced payments from customers
6
Main Group Drivers behind Key Figures
Q2 2017
• Good performance of most of the growth engines• Top line impacted by the reorganization of the hardcopy
distribution channels in China• Net profit of 27 million Euro• Net financial debt of 27 million Euro

Graphics

8
Inkjet, Software, Service
24%
Analog Prepress
10%Digital Prepress
66%
Graphics: YTD Sales per Business Segment
1H 2017
100% = 609 million Euro
9
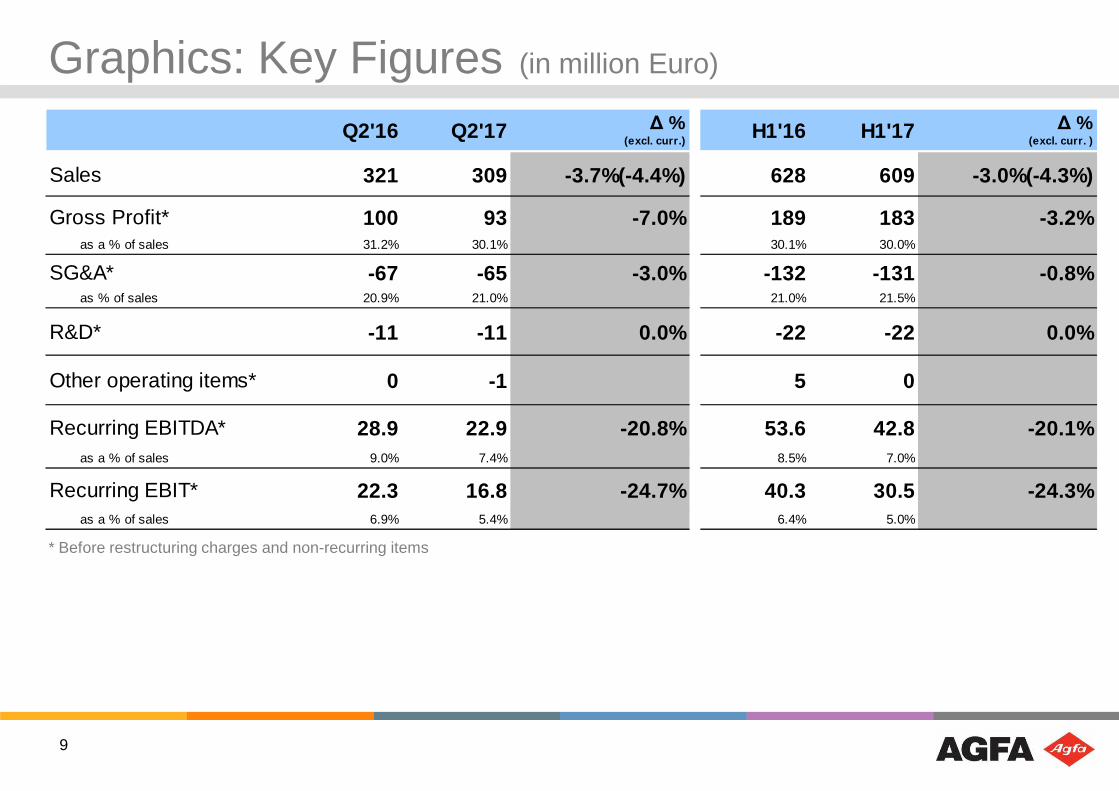
Q2'16 Q2'17 ∆ % (excl. curr.)
H1'16 H1'17 ∆ % (excl. curr. )
Sales 321 309 -3.7%(-4.4%) 628 609 -3.0%(-4.3%)
Gross Profit* 100 93 -7.0% 189 183 -3.2% as a % of sales 31.2% 30.1% 30.1% 30.0%
SG&A* -67 -65 -3.0% -132 -131 -0.8% as % of sales 20.9% 21.0% 21.0% 21.5%
R&D* -11 -11 0.0% -22 -22 0.0%
Other operating items* 0 -1 5 0
Recurring EBITDA* 28.9 22.9 -20.8% 53.6 42.8 -20.1% as a % of sales 9.0% 7.4% 8.5% 7.0%
Recurring EBIT* 22.3 16.8 -24.7% 40.3 30.5 -24.3% as a % of sales 6.9% 5.4% 6.4% 5.0%
Graphics: Key Figures (in million Euro)
* Before restructuring charges and non-recurring items
10
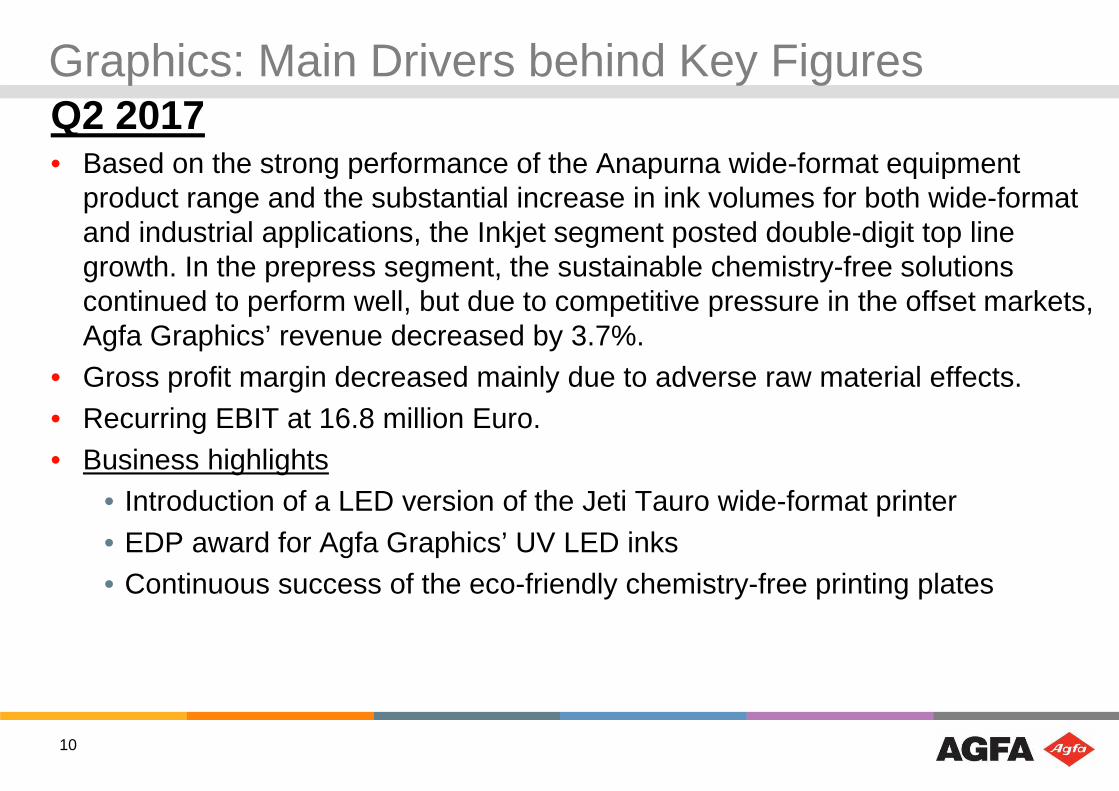
Graphics: Main Drivers behind Key FiguresQ2 2017• Based on the strong performance of the Anapurna wide-format equipment
product range and the substantial increase in ink volumes for both wide-format and industrial applications, the Inkjet segment posted double-digit top line growth. In the prepress segment, the sustainable chemistry-free solutions continued to perform well, but due to competitive pressure in the offset markets, Agfa Graphics’ revenue decreased by 3.7%.
• Gross profit margin decreased mainly due to adverse raw material effects. • Recurring EBIT at 16.8 million Euro.• Business highlights
• Introduction of a LED version of the Jeti Tauro wide-format printer• EDP award for Agfa Graphics’ UV LED inks• Continuous success of the eco-friendly chemistry-free printing plates

HealthCare
12
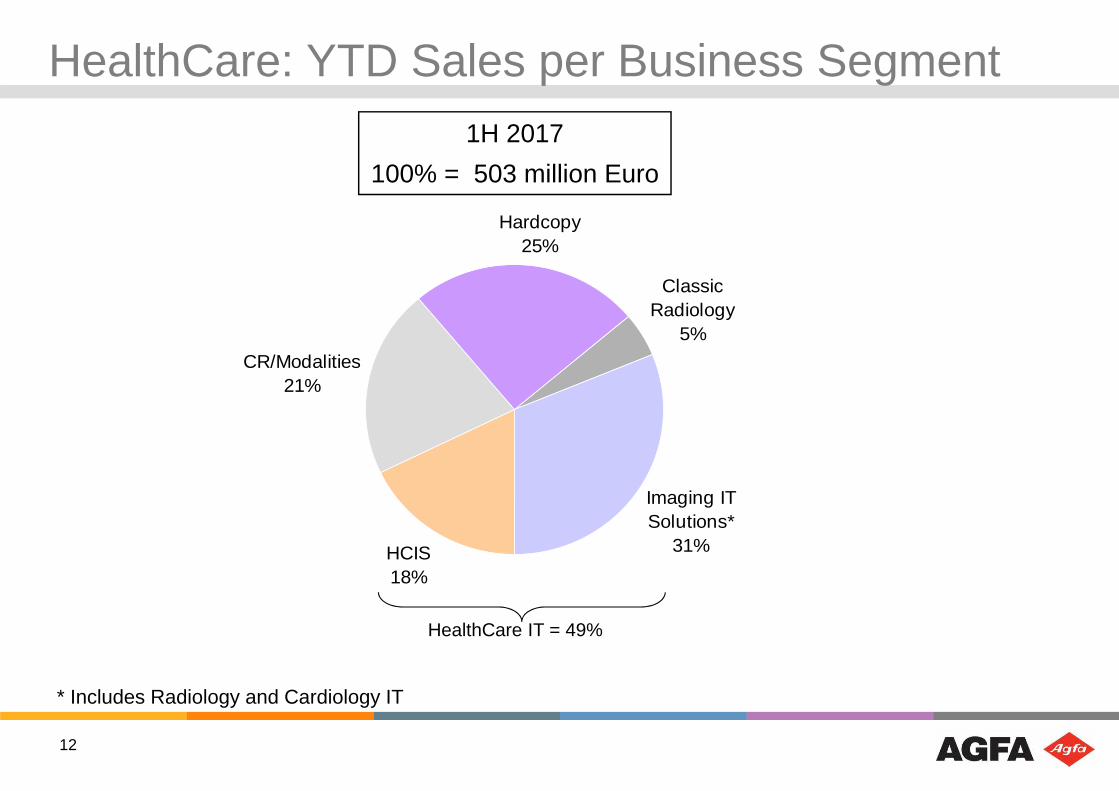
HealthCare: YTD Sales per Business Segment
Classic Radiology
5%
CR/Modalities21%
Hardcopy25%
HCIS18%
Imaging IT Solutions*
31%
HealthCare IT = 49%
* Includes Radiology and Cardiology IT
1H 2017
100% = 503 million Euro
13
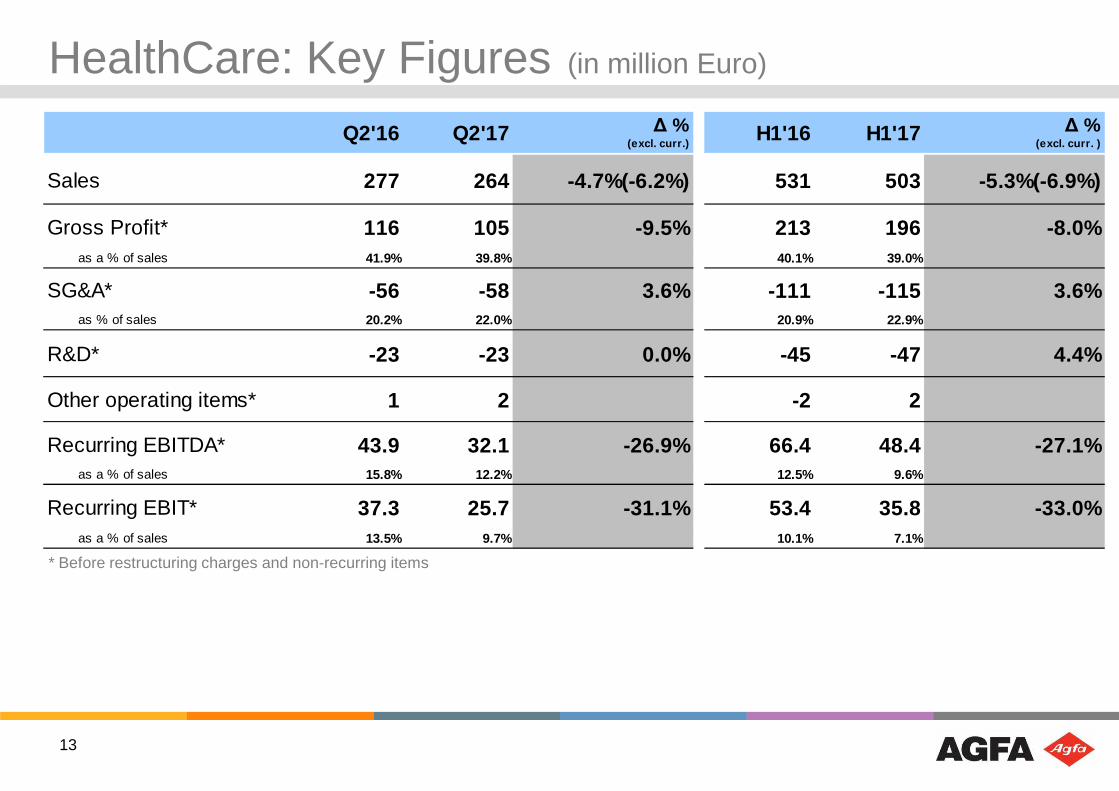
Q2'16 Q2'17 ∆ % (excl. curr.)
H1'16 H1'17 ∆ % (excl. curr. )
Sales 277 264 -4.7%(-6.2%) 531 503 -5.3%(-6.9%)
Gross Profit* 116 105 -9.5% 213 196 -8.0% as a % of sales 41.9% 39.8% 40.1% 39.0%
SG&A* -56 -58 3.6% -111 -115 3.6% as % of sales 20.2% 22.0% 20.9% 22.9%
R&D* -23 -23 0.0% -45 -47 4.4%
Other operating items* 1 2 -2 2
Recurring EBITDA* 43.9 32.1 -26.9% 66.4 48.4 -27.1% as a % of sales 15.8% 12.2% 12.5% 9.6%
Recurring EBIT* 37.3 25.7 -31.1% 53.4 35.8 -33.0% as a % of sales 13.5% 9.7% 10.1% 7.1%
HealthCare: Key Figures (in million Euro)
* Before restructuring charges and non-recurring items
14
HealthCare: Main Drivers behind Key Figures
Q2 2017• The DR growth engine performed well, while the HealthCare Information
Solutions range posted continuous top line and order book growth. The Imaging IT Solutions range saw a temporary slowdown, but the continuously strong order book for the Enterprise Imaging platform ensures future top line growth. Agfa HealthCare’s top line decrease was mainly attributable to the reorganization of the hardcopy distribution channels in China.
• The business group’s gross profit margin amounted to 39.8% of revenue. Recurring EBIT at 25.7 million Euro
• Business highlights• Successful completion of the re-certification audit cycle for the
Information Security Management System• Introduction of the new version of the Integrated Care Suite• Agfa HealthCare customer Medius Klinik Nürtingen became the 1st
hospital in Germany to be certified EMRAM stage 6
Specialty Products
16
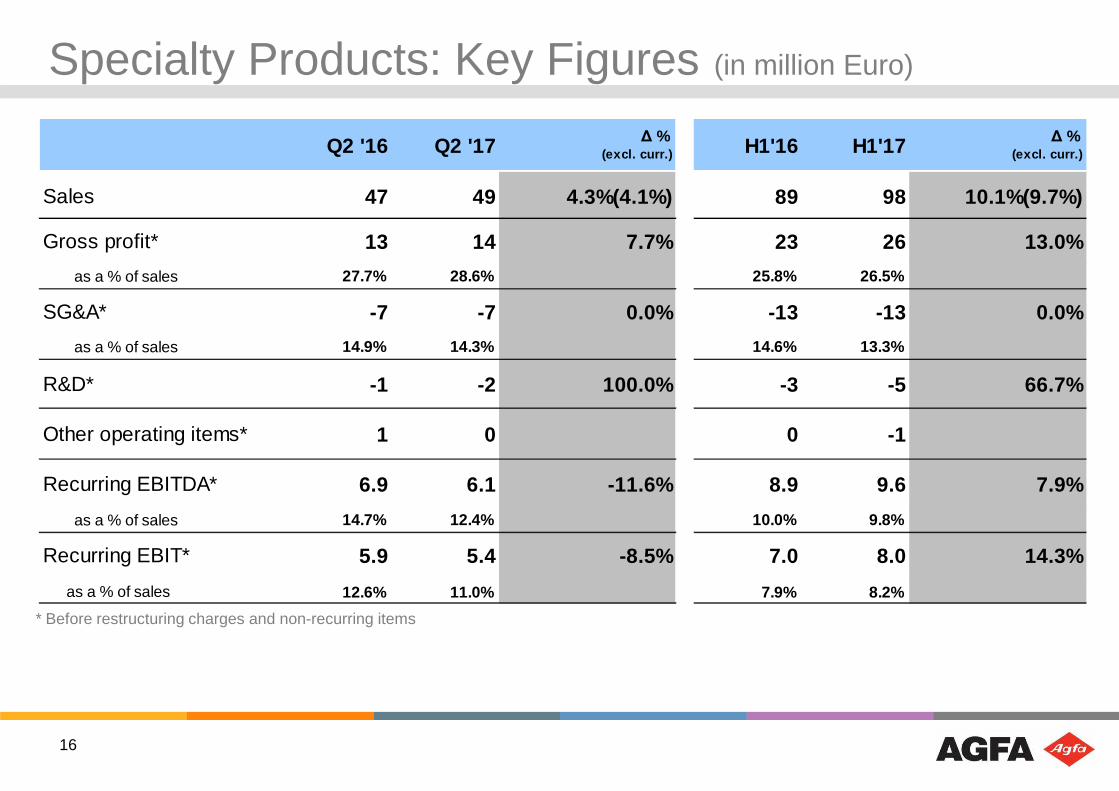
Q2 '16 Q2 '17 ∆ % (excl. curr.) H1'16 H1'17 ∆ %
(excl. curr.)
Sales 47 49 4.3%(4.1%) 89 98 10.1%(9.7%)
Gross profit* 13 14 7.7% 23 26 13.0%
as a % of sales 27.7% 28.6% 25.8% 26.5%
SG&A* -7 -7 0.0% -13 -13 0.0%
as a % of sales 14.9% 14.3% 14.6% 13.3%
R&D* -1 -2 100.0% -3 -5 66.7%
Other operating items* 1 0 0 -1
Recurring EBITDA* 6.9 6.1 -11.6% 8.9 9.6 7.9%
as a % of sales 14.7% 12.4% 10.0% 9.8%
Recurring EBIT* 5.9 5.4 -8.5% 7.0 8.0 14.3%
as a % of sales 12.6% 11.0% 7.9% 8.2%
Specialty Products: Key Figures (in million Euro)
* Before restructuring charges and non-recurring items
17
Specialty Products: Main Drivers behind Key Figures
Q2 2017
• Agfa Specialty Products’ revenue increased to 49 million Euro. The future-oriented businesses (mainly Synaps Synthetic Paper and Orgacon Electronic Materials), the Printed Circuit Board business, as well as a number of classic film product ranges performed well.
• Recurring EBIT at 5.4 million Euro
• Business highlights• Successful delivery of the voting cards for the General Parliament elections in
Malta• Launch of UNIQOAT, the next generation high reflective backsheet product
range
Study aiming at focused growth
19
Agfa announces study aiming at focused growth
• Agfa-Gevaert NV (Agfa) today announced that the Board of Directors has asked the Management to study how to organise the HealthCare IT activities into a stand-alone legal entity structure and organisation within the Agfa-Gevaert Group.
• Increasing the independence of the HealthCare IT activities would be a natural progression in the continued transformation of the Group. In such a set-up, HealthCare IT would be able to increase its focus on the large and attractive markets it is already in. The main part of the Agfa-Gevaert Group, which would consist of Agfa Graphics, Agfa Specialty Products and Agfa HealthCare’s Imaging business, would also be better positioned to pursue growth, profitability and new opportunities.
Questions & Answers