q2 2016 results by sanofi
TRANSCRIPT
Q2 2016 RESULTS July 29, 2016
2
Forward Looking Statements
This presentation contains forward-looking statements as defined in the Private Securities Litigation Reform Act of
1995, as amended. Forward-looking statements are statements that are not historical facts. These statements include
projections and estimates and their underlying assumptions, statements regarding plans, objectives, intentions and
expectations with respect to future financial results, events, operations, services, product development and potential,
and statements regarding future performance. Forward-looking statements are generally identified by the words
“expects”, “anticipates”, “believes”, “intends”, “estimates”, “plans” and similar expressions. Although Sanofi’s
management believes that the expectations reflected in such forward-looking statements are reasonable, investors are
cautioned that forward-looking information and statements are subject to various risks and uncertainties, many of which
are difficult to predict and generally beyond the control of Sanofi, that could cause actual results and developments to
differ materially from those expressed in, or implied or projected by, the forward-looking information and statements.
These risks and uncertainties include among other things, the uncertainties inherent in research and development,
future clinical data and analysis, including post marketing, decisions by regulatory authorities, such as the FDA or the
EMA, regarding whether and when to approve any drug, device or biological application that may be filed for any such
product candidates as well as their decisions regarding labelling and other matters that could affect the availability or
commercial potential of such product candidates, the absence of guarantee that the product candidates if approved will
be commercially successful, the future approval and commercial success of therapeutic alternatives, the Company’s
ability to benefit from external growth opportunities and/or obtain regulatory clearances, risks associated with
intellectual property and any related pending or future litigation and the ultimate outcome of such litigation, trends in
exchange rates and prevailing interest rates, volatile economic conditions, the impact of cost containment initiatives
and subsequent changes thereto, the average number of shares outstanding as well as those discussed or identified in
the public filings with the SEC and the AMF made by Sanofi, including those listed under “Risk Factors” and
“Cautionary Statement Regarding Forward-Looking Statements” in Sanofi’s annual report on Form 20-F for the year
ended December 31, 2015. Other than as required by applicable law, Sanofi does not undertake any obligation to
update or revise any forward-looking information or statements.
3
Agenda
3
Key Highlights
● Olivier Brandicourt - Chief Executive Officer
Sustaining Innovation in R&D
● Elias Zerhouni - President, Global R&D
Financial Results
● Jérôme Contamine - Executive Vice President, Chief Financial Officer
Q&A Session
● Olivier Charmeil - Executive Vice President, General Medicines & Emerging Markets
● Peter Guenter - Executive Vice President, Diabetes & Cardiovascular
● Carsten Hellmann - Executive Vice President, Merial
● David Loew - Executive Vice President, Sanofi Pasteur
● David P. Meeker - Executive Vice President, Sanofi Genzyme

KEY HIGHLIGHTS
4
Olivier Brandicourt
Chief Executive Officer

Q2 2016 FX
Impact
-€0.07
Decremental
EPS at CER
-€0.03
Q2 2015
Aggregate(1) Company Sales Business EPS
Aggregate Sales Down Slightly in Q2 2016 Largely Due to
Currency Headwinds in Emerging Markets
5
(1) Including Merial
(2) Reflecting reclassification of VaxServe from Sales to Other revenues
(3) On a reported basis, Q2 2016 Aggregate Sales were down -4.3% and Business EPS was down -7.1%
-2.1% at CER(3)
Q2 2016 FX
Impact
-€382m
Venezuela
-€193m
Incremental
Sales at
CER
+€175m
Q2 2015
-0.2% at CER(3)
€9,268m
€8,868m
€1.41
€1.31
(2)

6
Growth
at CER
Q2 2016 GBU Performance Supported By Double-Digit
Growth of Sanofi Genzyme and Moderating DCV(1) Decline
(1) DCV: Diabetes and Cardiovascular
(2) Does not include Emerging Markets sales
(3) Includes Emerging Markets sales for Diabetes & Cardiovascular and Specialty Care
(4) Emerging Markets: World excluding U.S., Canada, Western & Eastern Europe (except Eurasia), Japan,
South Korea, Australia, New Zealand and Puerto Rico
(5) Excluding Venezuela: -1.9% at CER
(6) Reflecting reclassification of VaxServe from Sales to Other revenues from Jan 1, 2016. Pictures by Freepik
Q2 2016 Aggregate Sales by Global Business Unit
Company Aggregate Sales €8,868m
-0.2%
€725m
Animal Health
+9.1%
€1,603m
Diabetes & Cardiovascular -3.5% (2)
€1,245m
Sanofi Genzyme +20.1% (2)
€4,498m
General Medicines & Emerging Markets -5.6% (5) (3,4)
€797m
Vaccines
+6.3% (6)

7
Franchise Sales Driven by Specialty Care, Vaccines and
Animal Health Offset by Established Products
(1) Excluding Venezuela sales were up +11.4% at CER
(2) Excluding Plavix® in Japan, sales were down -4.9% at CER
(3) Excluding Venezuela sales were up +1.5% at CER
(4) Excluding Venezuela sales were down -1.8% at CER
Q2 2016 Aggregate Sales by Franchise
Developed Markets Emerging Markets
Growth
at CER
Total
Sales Growth Sales
Animal Health
+9.1% €725m +15.6% +7.3% €565m €160m
Specialty Care +19.5% €1,493m
+16.8% +20.1% €1,245m
€248m
Diabetes & Cardiovascular -2.0% €1,962m
+4.7% -3.5% €1,603m
€359m
Sales Growth
Vaccines
+6.3% €797m
+9.8% +3.8% €463m
€334m
Established Rx Products -9.7% €2,617m
-7.7% -10.9% €1,676m
€941m
Generics -1.9% €474m +2.6% -5.5% €271m €203m
Consumer Healthcare -4.3% €800m
-13.0% +2.1% €511m
€289m
(1)
(3)
(4)
(6)
(5) Excluding Venezuela sales were up +8.2% at CER
(6) Reflecting reclassification of VaxServe from Sales to Other revenues
from Jan 1, 2016
(5)
(2)
Q2 2015 Q2 2016
RareDiseases
MultipleSclerosis
Oncology
8
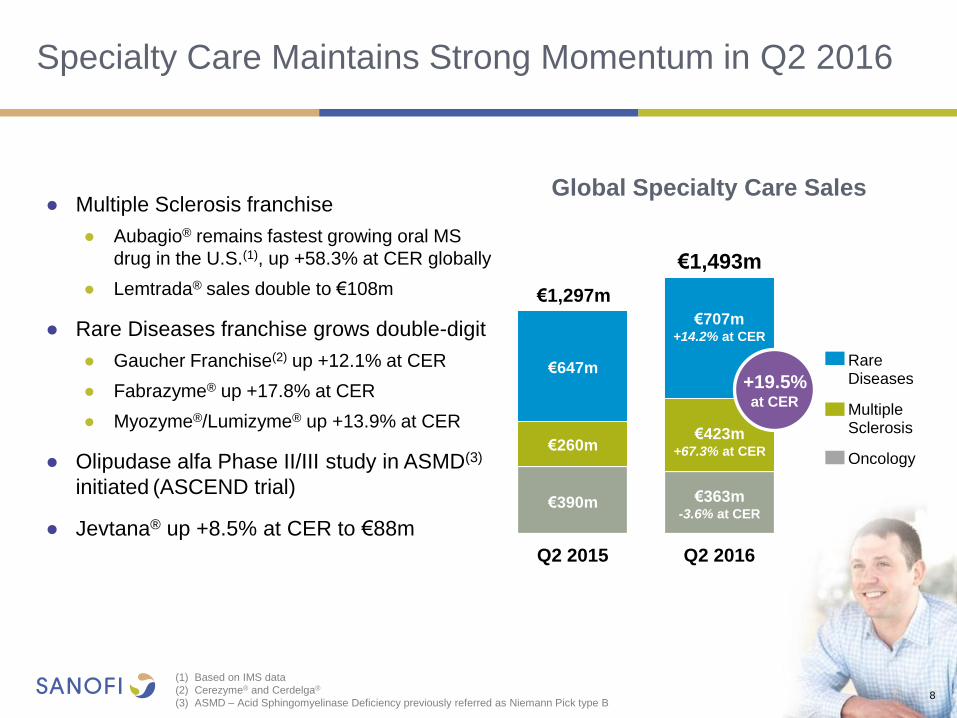
Specialty Care Maintains Strong Momentum in Q2 2016
● Multiple Sclerosis franchise
● Aubagio® remains fastest growing oral MS
drug in the U.S.(1), up +58.3% at CER globally
● Lemtrada® sales double to €108m
● Rare Diseases franchise grows double-digit
● Gaucher Franchise(2) up +12.1% at CER
● Fabrazyme® up +17.8% at CER
● Myozyme®/Lumizyme® up +13.9% at CER
● Olipudase alfa Phase II/III study in ASMD(3)
initiated (ASCEND trial)
● Jevtana® up +8.5% at CER to €88m
€243m
€647m
€1,493m
€707m +14.2% at CER
€423m +67.3% at CER
Global Specialty Care Sales
€260m
(1) Based on IMS data
(2) Cerezyme® and Cerdelga®
(3) ASMD – Acid Sphingomyelinase Deficiency previously referred as Niemann Pick type B
€390m €363m
-3.6% at CER
€1,297m
+19.5% at CER
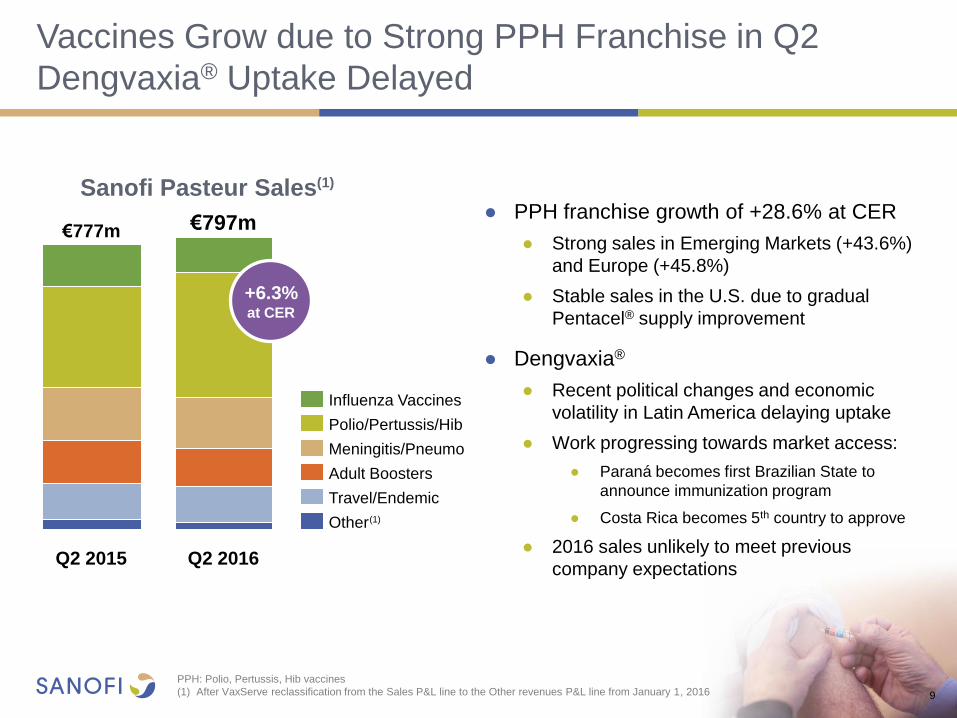
Vaccines Grow due to Strong PPH Franchise in Q2
Dengvaxia® Uptake Delayed
9
PPH: Polio, Pertussis, Hib vaccines
(1) After VaxServe reclassification from the Sales P&L line to the Other revenues P&L line from January 1, 2016
● PPH franchise growth of +28.6% at CER
● Strong sales in Emerging Markets (+43.6%)
and Europe (+45.8%)
● Stable sales in the U.S. due to gradual
Pentacel® supply improvement
● Dengvaxia®
● Recent political changes and economic
volatility in Latin America delaying uptake
● Work progressing towards market access:
● Paraná becomes first Brazilian State to
announce immunization program
● Costa Rica becomes 5th country to approve
● 2016 sales unlikely to meet previous
company expectations
Sanofi Pasteur Sales(1)
Q2 2016
€797m
Q2 2015
€777m
Travel/Endemic
Meningitis/Pneumo
Other
Adult Boosters
Polio/Pertussis/Hib
Influenza Vaccines
(1)
+6.3% at CER

10
Diabetes Franchise Performs In-Line with Expectations
● Global Diabetes sales decline -3.2% at CER(1)
to €1,857m
● U.S. sales down -7.1%
● Emerging Markets sales up +5.0%(2)
● Toujeo® reached €141m in global sales
and 6.1% TRx market share in the U.S.(3)
● Adlyxin™ (lixisenatide), a once-daily mealtime
GLP-1R, FDA approved in July
● LixiLan(4) recommended for approval by FDA
Advisory Committee
(1) Growth excluding Venezuela was -2.0% at CER
(2) Growth excluding Venezuela +11.7% at CER
(3) IMS Rapid weekly as of July 15th 2016
(4) LixiLan is a project name and is not the intended brand name for the combination of insulin glargine and lixisenatide
€7m €13m
€46m
€98m €103m
€141m
Q1 Q2 Q3 Q4 Q1 Q2
Ex U.S.
U.S.
Quarterly Sales
2015 2016
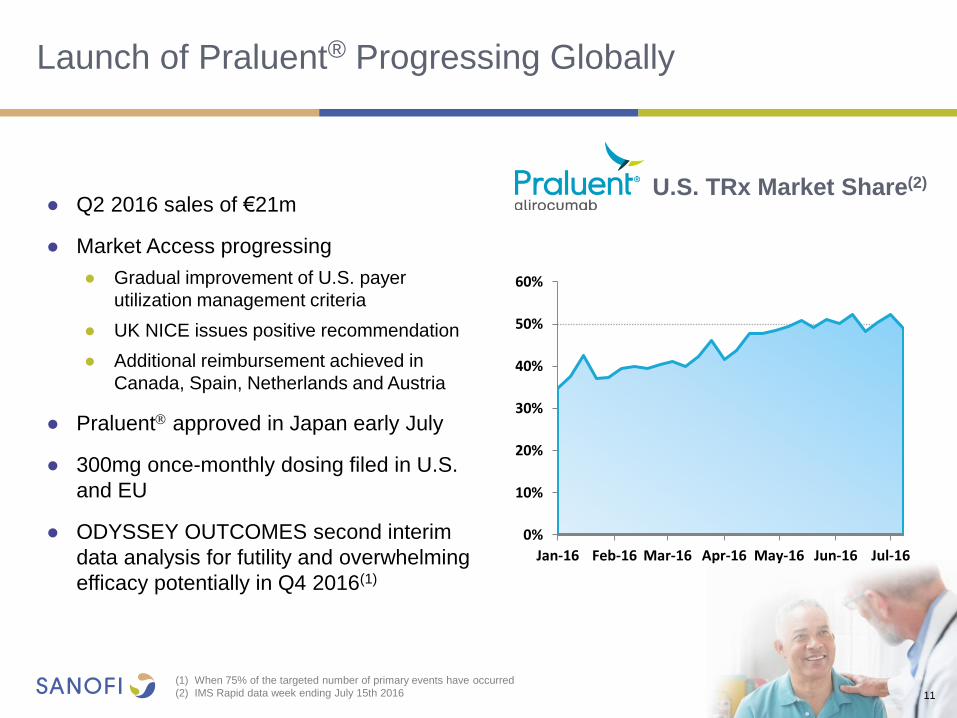
Launch of Praluent® Progressing Globally
● Q2 2016 sales of €21m
● Market Access progressing
● Gradual improvement of U.S. payer
utilization management criteria
● UK NICE issues positive recommendation
● Additional reimbursement achieved in
Canada, Spain, Netherlands and Austria
● Praluent approved in Japan early July
● 300mg once-monthly dosing filed in U.S.
and EU
● ODYSSEY OUTCOMES second interim
data analysis for futility and overwhelming
efficacy potentially in Q4 2016(1)
U.S. TRx Market Share(2)
(1) When 75% of the targeted number of primary events have occurred
(2) IMS Rapid data week ending July 15th 2016 11
0%
10%
20%
30%
40%
50%
60%
Jan-16 Feb-16 Mar-16 Apr-16 May-16 Jun-16 Jul-16

Emerging
Markets
€289m (-12.7%)
or
-1.5% excluding
Venezuela
12
CHC Franchise Grows by +2.7%
Excluding Venezuela Impact and at Constant Structure(1)
● Developed Markets
● Europe (+8.5%)(2) driven by cough and cold
season delayed to Q2 and strong Doliprane
performance due to successful DTC campaign
● U.S. sales (-0.8%) impacted by mild allergy
season
● Emerging Markets
● Down -12.7% as a result of Venezuela
currency devaluation and challenging
economic environment in Russia
● Boehringer Ingelheim asset swap signed in
June and expected to close by end of 2016(3)
(1) -4.3% at CER including Venezuela and small divested products
(2) Including the sales of small divested products in the 2015 base, growth at CER was +0.9%
(3) Subject to regulatory clearances
(4) Including the sales of small divested products in the 2015 base, growth at CER was +2.1%
Q2 2016 CHC Sales (growth at CER and constant structure)
36% 64%
Developed
Markets
€511m (+5.4%)(4)
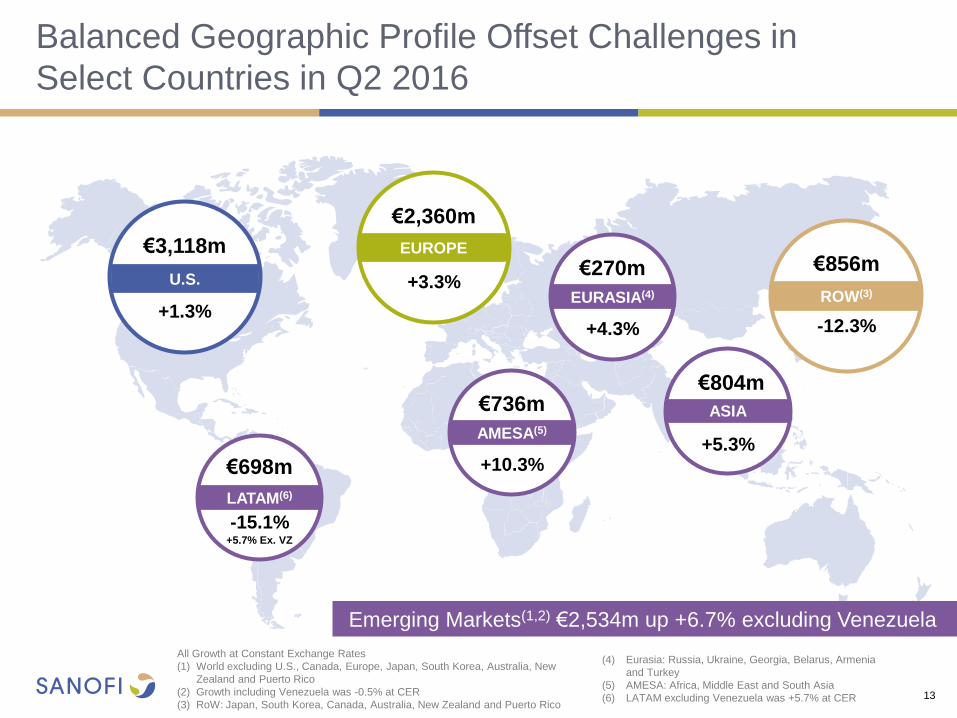
€3,118m
€2,360m
€804m
€856m
€698m
EUROPE
+3.3%
ASIA
+5.3%
ROW(3)
-12.3%
LATAM(6)
-15.1%
U.S.
Balanced Geographic Profile Offset Challenges in
Select Countries in Q2 2016
13
Emerging Markets(1,2) €2,534m up +6.7% excluding Venezuela
+1.3%
€736m
AMESA(5)
+10.3%
€270m
EURASIA(4)
+4.3%
All Growth at Constant Exchange Rates
(1) World excluding U.S., Canada, Europe, Japan, South Korea, Australia, New
Zealand and Puerto Rico
(2) Growth including Venezuela was -0.5% at CER
(3) RoW: Japan, South Korea, Canada, Australia, New Zealand and Puerto Rico
(4) Eurasia: Russia, Ukraine, Georgia, Belarus, Armenia
and Turkey
(5) AMESA: Africa, Middle East and South Asia
(6) LATAM excluding Venezuela was +5.7% at CER
+5.7% Ex. VZ

Q2 2016 – Executing on our 2020 Strategic Roadmap
14
(1) Including Merial
(2) On a reported basis, Q2 2016 Aggregate Sales were down -4.3%.
Excluding Venezuela Aggregate Sales were up +1.9%at CER
(3) On a reported basis, Q2 2016 Business EPS was down -7.1%
(4) Subject to regulatory clearances
● Toujeo® U.S. TRx share reaches 6.1%(5), achieving global sales of €141m
● Praluent® gains TRx share, equally sharing the U.S. PCSK9i market
● Dengvaxia® uptake delayed by political changes and economic volatility in LatAm
Launches
3
● Delivered Aggregate(1) Company Sales of €8,868m, slightly down -0.2% at CER(2)
● Business EPS decline of -2.1% at CER(3) to €1.31
Financial Results
1
● Animal Health / CHC asset swap with Boehringer Ingelheim signed in June 2016 and expected to close by year-end(4)
Portfolio
2
● FDA approves Adlyxin™ (lixisenatide), a once-daily mealtime GLP-1R agonist
● FDA Advisory Committee recommends LixiLan(6) for approval in the U.S.(7) Innovation
4
(5) IMS data as of July 15th 2016
(6) LixiLan is a project name and is not the intended brand name
for the combination of insulin glargine and lixisenatide
(7) The members of the Advisory Committee voted 12-2 for an
approval of LixiLan

SUSTAINING INNOVATION IN R&D
15
Elias Zerhouni
President, Global R&D

Positive 16 and 52-week Safety and Efficacy
Data in Combination with Topical Corticosteroids
16
● Positive dupilumab 16 and 52-week
LIBERTY AD CHRONOS(1) study
● Statistically significant benefit on both
clearing/near clearing of the skin and EASI-
75 score versus placebo at 16 and 52-week
● 52 week data consistent with 16 week data
● Safety profile consistent with SOLO-1 and
SOLO-2 trials conducted with dupilumab in
monotherapy
● Phase III study in Asthma ongoing
● Phase III study in Nasal Polyposis
expected to start in Q1 2017
Dupilumab is developed in collaboration with Regeneron AD: Atopic Dermatitis
Dupilumab is an investigational agent under clinical development and its safety and efficacy has not been fully evaluated by any Regulatory Authority
The SOLO 1 , SOLO 2, and CHRONOS trials are part of the LIBERTY AD clinical trial program
1) LIBERTY AD CHRONOS evaluated dupilumab in combination with topical corticosteroids (TCS) in patients inadequately controlled with topical
medications
2) Adverse events that were noted to have a higher rate with dupilumab included injection site reactions (20/16% dupilumab; 9% placebo)
and conjunctivitis (19/13% dupilumab; 8% placebo)
Clearing or near-clearing of skin lesions
39% 40%
dupilumab 300mg
QW + TCS
Placebo + TCS dupilumab 300mg
Q2W + TCS
12% 12.5%
39% 36%
52 Weeks (Secondary endpoint)
16 Weeks (Primary endpoint)
65% 64%
22%
64% 69%
23%
EASI-75
Dupilumab CHRONOS:
Primary and Secondary Endpoints

Expected Regulatory Decisions Q2 Q3 Q4 Q1
● Dengvaxia® in endemic countries
● Adlyxin™ (lixisenatide) in Diabetes (U.S.)
● LixiLan in Diabetes (U.S.)
● Sarilumab in Rheumatoid Arthritis (U.S.)
Expected Regulatory Fillings Q2 Q3 Q4 Q1
● Sarilumab in Rheumatoid Arthritis (EU)
● Dupilumab in Atopic Dermatitis (U.S.)
Expected Phase III / IIIb Topline Data Q2 Q3 Q4 Q1
● Dupilumab in Atopic Dermatitis (CHRONOS)
● Insulin lispro in Diabetes (SORELLA-1 & 2)
● Praluent® ODYSSEY OUTCOMES 2nd interim analysis(1)
Expected Phase III Starts Q2 Q3 Q4 Q1
● PD-1 Inhibitor in advanced CSCC(2) pivotal Phase II
● Olipudase alfa ASCEND in ASMD(3)
● NeoGAA in Pompe
● Efpeglenatide in Diabetes
● Sotagliflozin in Diabetes
● Isatuximab in Multiple Myeloma
● Dupilumab in Nasal Polyposis
● Fitusiran (ALN-AT3) in Hemophilia
17
Potential Important Regulatory Approvals for Dengvaxia®,
LixiLan, Sarilumab and Dupilumab in the Next 12 Months
* SORELLA-1 data was presented at ADA 2016
*
(1) Second interim data analysis for futility and overwhelming efficacy when ~75% of events have occurred
(2) Cutaneous Squamous Cell Carcinoma
(3) Pivotal Phase II/III trial. ASMD – Acid Sphingomyelinase Deficiency previously referred as Niemann Pick type B
FINANCIAL RESULTS
Jérôme Contamine
Executive Vice President, Chief Financial Officer
18

CER: Constant Exchange Rates
(1) Reflecting reclassification of VaxServe from Sales to Other revenues. VaxServe sales of non-Company products were €110m in Q2 2015
and €89m in Q2 2016 19
Q2 2016 Aggregate BOI Impacted by Anticipated
Challenges
€m Q2 2016 Q2 2015 % Change
(reported €)
% Change (CER)
Aggregate Company sales 8,868 9,268 -4.3% -0.2%
Aggregate Other revenues 173 193 -10.4% -8.3%
Aggregate Gross profit 6,276 6,523 -3.8% +0.2%
Aggregate R&D (1,325) (1,290) +2.7% +4.5%
Aggregate SG&A (2,650) (2,648) +0.1% +3.9%
Aggregate Other current operating income & expenses (23) (20) - -
Aggregate Share of profit/loss of associates 30 30 - -
Aggregate Minority interests (23) (29) - -
Aggregate Business Operating Income 2,285 2,566 -11.0% -5.8%
Aggregate Business operating margin 25.8% 27.7% - -
Effective tax rate 24.0% 25.0% - -
Business net income 1,680 1,840 -8.7% -3.3%
Business EPS €1.31 €1.41 -7.1% -2.1%
(1)
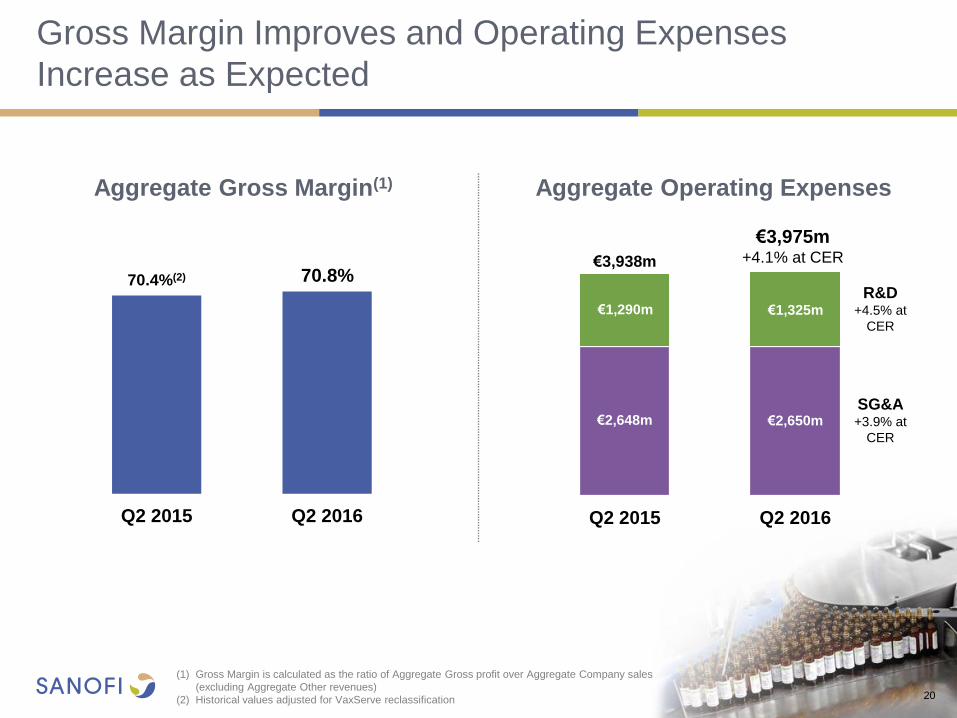
Q2 2015 Q2 2016
€3,975m +4.1% at CER €3,938m
€1,325m €1,290m
€2,650m €2,648m
R&D +4.5% at
CER
SG&A +3.9% at
CER
Gross Margin Improves and Operating Expenses
Increase as Expected
20
Aggregate Operating Expenses
(1) Gross Margin is calculated as the ratio of Aggregate Gross profit over Aggregate Company sales
(excluding Aggregate Other revenues)
(2) Historical values adjusted for VaxServe reclassification
Q2 2015 Q2 2016
Aggregate Gross Margin(1)
70.4%(2) 70.8%
21
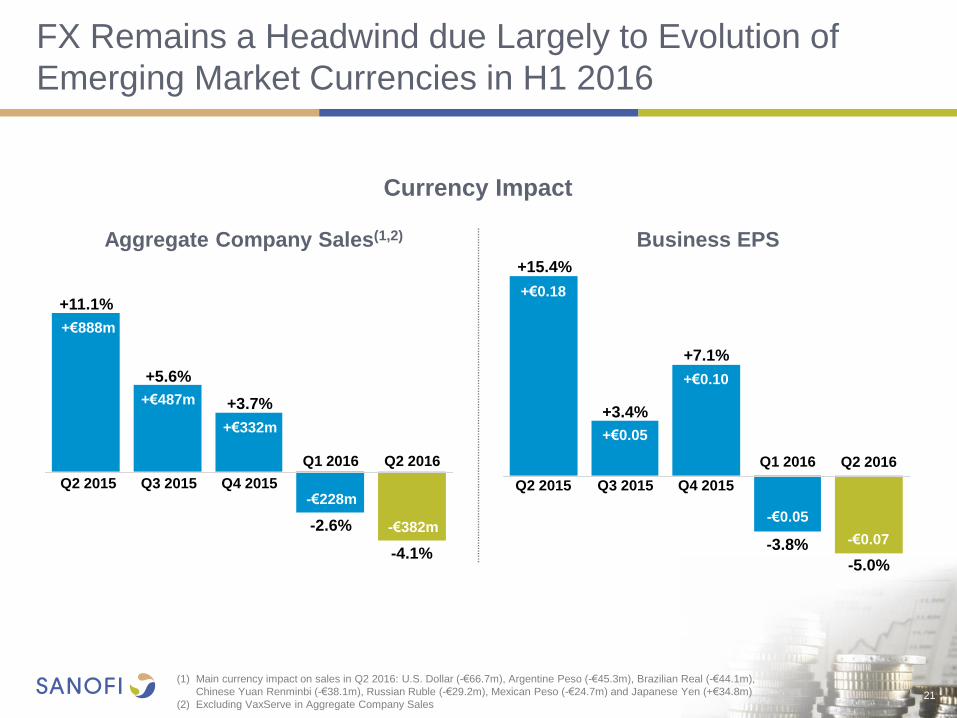
FX Remains a Headwind due Largely to Evolution of
Emerging Market Currencies in H1 2016
(1) Main currency impact on sales in Q2 2016: U.S. Dollar (-€66.7m), Argentine Peso (-€45.3m), Brazilian Real (-€44.1m),
Chinese Yuan Renminbi (-€38.1m), Russian Ruble (-€29.2m), Mexican Peso (-€24.7m) and Japanese Yen (+€34.8m)
(2) Excluding VaxServe in Aggregate Company Sales
+11.1%
+€888m
+5.6%
+€487m
-2.6%
-€228m
Q2 2016
Q2 2015 Q3 2015 Q4 2015
Q1 2016
+3.7%
+€332m
Q2 2016
Q2 2015 Q3 2015 Q4 2015
Q1 2016
+15.4%
+€0.18
+€0.05
+3.4%
+7.1%
+€0.10
-3.8%
-€0.05
Currency Impact
Aggregate Company Sales(1,2) Business EPS
-4.1%
-€382m
-5.0%
-€0.07

Net Debt
June 30, 2016
Other
-€463m
Dividends
-€3,759m
Acquisitions,
Licensing, Net
of Disposals
-€663m
Share
Repurchase
-€1,403m
CapEx
-€700m
Net Cash from
Operating
Activities
Net Debt
Dec 31, 2015
22
(1)
(2)
€7,254m
€11,001m
€3,241m
(4) (1)
FCF
€2,541m
(3)
FCF: Free Cash Flow
(1) Including derivatives related to the financial debt +€152m at December 31st 2015 and +€189m at June 30th 2016
(2) Excluding Restructuring costs
(3) Including Hanmi Pharmaceuticals of €400m, Verily JV of €165m and Regeneron anti-dilutive share purchase of €114m
(4) Other including Restructuring costs and Fx impact
Net Debt
22
H1 2016 Net Debt Increase Due to Dividend Payment and
Higher Investments and In-Licensing Activities

23
(1) Barring major unforeseen adverse events
(2) FY 2015 Business EPS of €5.64
(3) Difference between variation on a reported basis and variation at CER when applying June 2016 average exchange rates
to the remaining quarters of the year
Confirmed Broadly Stable 2016 Business EPS at CER
Business EPS Growth
Around -4%(3)
based on June 2016 average exchange rates
Broadly stable at CER(1,2)
FY 2016
FX impact on Business EPS
CLOSING REMARKS
24
Olivier Brandicourt
Chief Executive Officer
25
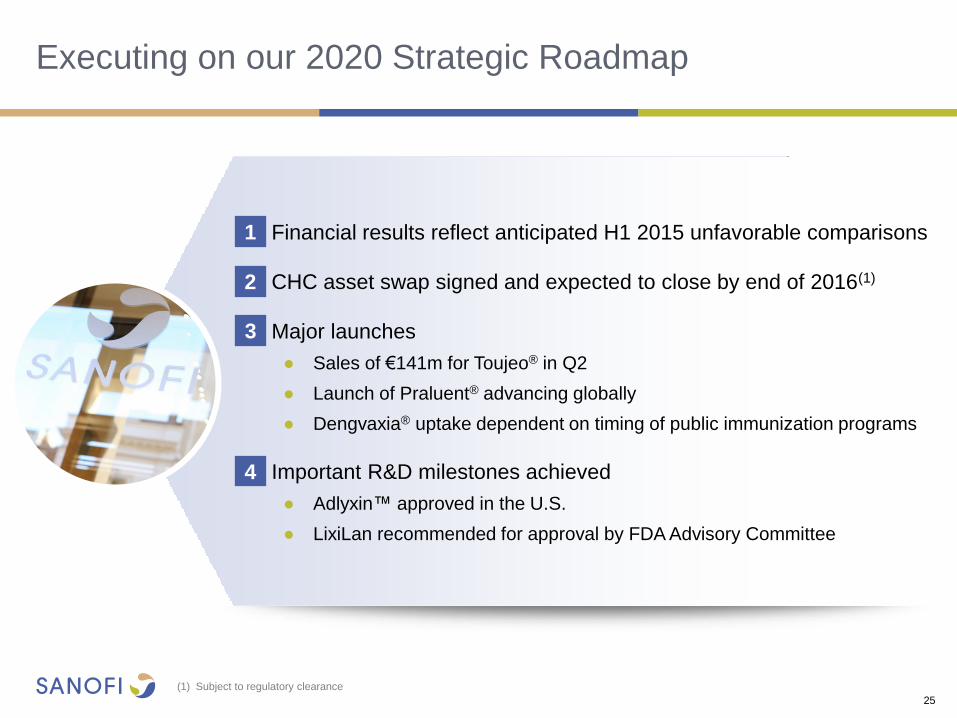
Executing on our 2020 Strategic Roadmap
● Financial results reflect anticipated H1 2015 unfavorable comparisons
● CHC asset swap signed and expected to close by end of 2016(1)
● Major launches
● Sales of €141m for Toujeo® in Q2
● Launch of Praluent® advancing globally
● Dengvaxia® uptake dependent on timing of public immunization programs
● Important R&D milestones achieved
● Adlyxin™ approved in the U.S.
● LixiLan recommended for approval by FDA Advisory Committee
1
2
4
3
(1) Subject to regulatory clearance

26
Q&A SESSION

27
APPENDICES
R&D Pipeline

dupilumab Anti-IL4Rα mAb Nasal polyposis;
Eosinophilic oesophagitis
olipudase alfa rhASM Deficiency
Niemann-Pick type B
SAR156597 IL4/IL13 Bi-specific mAb
Idiopathic pulmonary fibrosis
GZ402671 Oral GCS inhibitor
Fabry Disease
SAR100842 LPA1 receptor antagonist
Systemic sclerosis
SAR422459 ABCA4 gene therapy
Stargardt disease
sotagliflozin Oral SGLT-1&2 inhibitor
Type 2 diabetes
Combination
ferroquine / OZ439 Antimalarial
efpeglenatiden Long-acting GLP-1 receptor agonist
Type 2 diabetes
Rabies VRVg Purified vero rabies vaccine
sarilumab Anti-IL6R mAb
Uveitis
Tuberculosis Recombinant subunit vaccine
isatuximab Anti-CD38 naked mAb
Multiple myeloma
Fluzone® QIV HD Quadrivalent inactivated
influenza vaccine - High dose
SAR439684 PD-1 inhibitor
Advanced CSCC (Skin cancer)
Immuno-inflammation
Infectious Diseases
MS, Neurology, Ophthalmology
GZ402668 GLD52 (anti-CD52 mAb)
Relapsing multiple sclerosis
GZ402666 neoGAA
Pompe Disease
GZ389988 TRKA antagonist
Osteoarthritis
SAR339375 Anti-miR21 RNA
Alport syndrome
SAR425899 GLP-1R/GCGR dual agonist
Type 2 diabetes
fitusiran (ALN-AT3)
siRNA targeting Anti-Thrombin
Hemophilia
SAR438335 GLP-1R/GIPR dual agonist
Type 2 diabetes
UshStat® Myosin 7A gene therapy
Usher syndrome 1B
SAR440067 (LAPS Insulin 115)nn
Long acting insulin analog
Type 1 & 2 diabetes
SAR228810 Anti-protofibrillar AB mAb
Alzheimer’s disease
SAR566658
Maytansin-loaded anti-CA6 mAb
Solid tumors
SAR439152 Myosin inhibitor
Hypertrophic cardiomyopathy
SAR408701 Maytansin-loaded
Anti-CEACAM5 mAb
Solid tumors
SAR407899 rho kinase
Microvascular angina
SAR428926 Maytansin loaded anti-Lamp1 mAb
Cancer
SAR366234 EP2 receptor agonist
Elevated intraocular pressure
Streptococcus pneumonia Meningitis & pneumonia vaccine
Herpes Simplex Virus Type 2 HSV-2 vaccine
R&D Pipeline – Pharma & Vaccines
Phase I
N
N
N
N
N
N
N
N
N
N
N
N
N
N
Phase II N
N
N N
N
SAR342434 insulin lispro
Type 1+2 diabetes
sotagliflozin n
Oral SGLT-1&2 inhibitor
Type 1 diabetes
dupilumab Anti-IL4Rα mAb
Atopic dermatitis, Asthma
patisiran (ALN-TTR02)
siRNA inhibitor targeting TTR Familial amyloidotic polyneuropathy
revusiran (ALN-TTRsc)
siRNA inhibitor targeting TTR Familial amyloidotic cardiomyopathy
Clostridium difficile Toxoid vaccine
VaxiGrip® QIV IM Quadrivalent inactivated
influenza vaccine (6-35 months)
Pediatric pentavalent vaccine DTP-Polio-Hib
Japan
Men Quad TT 2nd generation meningococcal
ACYW conjugate vaccine
Phase III
N
N
N
N
Registration
LixiLan Fixed-Ratio insulin glargine+lixisenatide
Type 2 diabetes, U.S., EU
sarilumab Anti-IL6R mAb
Rheumatoid arthritis, U.S., EU
Dengvaxia®(1) Mild-to-severe
dengue fever vaccine
PR5i DTP-HepB-Polio-Hib
Pediatric hexav. vaccine, U.S.
VaxiGrip® QIV IM Quadrivalent inactivated
influenza vaccine (3 years+)
N
N
N
(1) Approved in Brazil, Mexico, the Philippines, El Salvador and Costa Rica 28
N N
N
N New Molecular Entity
Rare Diseases
Oncology Diabetes
Vaccines
Cardiovascular Diseases
N
N
N

29
Phase I Phase II Phase III Registration TOTAL
Oncology 3 2 0 0 5
Diabetes 3 1 2 1 7
Cardiovascular Diseases 2 0 0 0 2
Immuno-inflammation 1 2 1 1 5
Infectious Diseases 0 1 0 0 1
Rare Diseases 4 3 2 0 9
Multiple Sclerosis,
Neurology,
Ophthalmology
3 0 0 0 3
Vaccines 2 3 4 3 12
TOTAL 18
12 9 5
R&D Pipeline Summary Table(1)
30 14
NMEs & Vaccines
44
29
32
(1) Excluding life cycle management programs
30
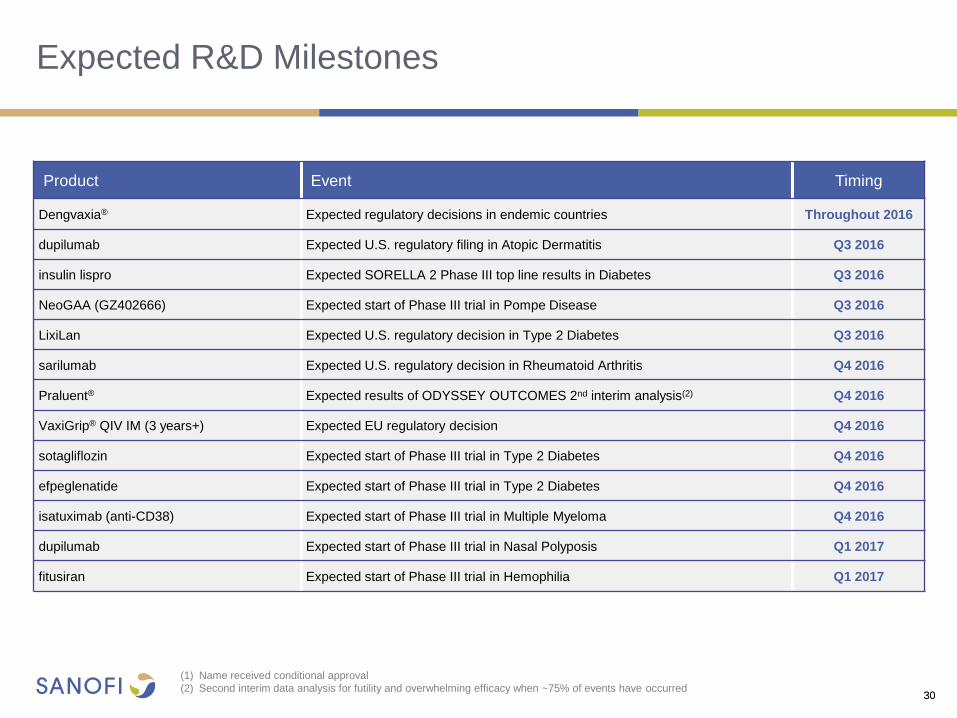
Expected R&D Milestones
30
Product Event Timing
Dengvaxia® Expected regulatory decisions in endemic countries Throughout 2016
dupilumab Expected U.S. regulatory filing in Atopic Dermatitis Q3 2016
insulin lispro Expected SORELLA 2 Phase III top line results in Diabetes Q3 2016
NeoGAA (GZ402666) Expected start of Phase III trial in Pompe Disease Q3 2016
LixiLan Expected U.S. regulatory decision in Type 2 Diabetes Q3 2016
sarilumab Expected U.S. regulatory decision in Rheumatoid Arthritis Q4 2016
Praluent® Expected results of ODYSSEY OUTCOMES 2nd interim analysis(2) Q4 2016
VaxiGrip® QIV IM (3 years+) Expected EU regulatory decision Q4 2016
sotagliflozin Expected start of Phase III trial in Type 2 Diabetes Q4 2016
efpeglenatide Expected start of Phase III trial in Type 2 Diabetes Q4 2016
isatuximab (anti-CD38) Expected start of Phase III trial in Multiple Myeloma Q4 2016
dupilumab Expected start of Phase III trial in Nasal Polyposis Q1 2017
fitusiran Expected start of Phase III trial in Hemophilia Q1 2017
(1) Name received conditional approval
(2) Second interim data analysis for futility and overwhelming efficacy when ~75% of events have occurred

APPENDICES
FINANCE
31
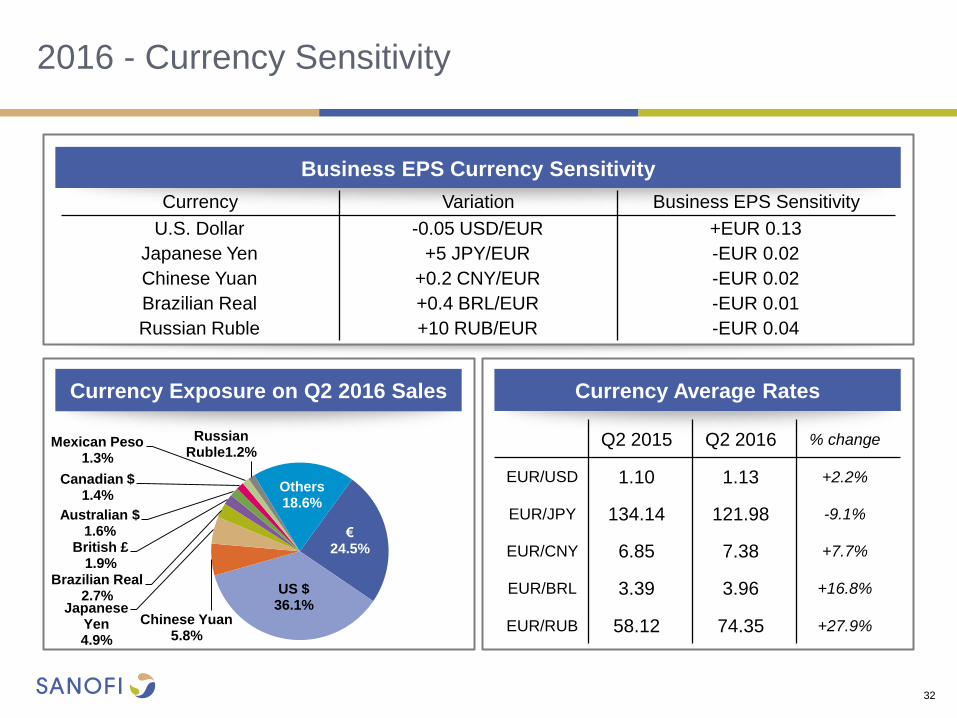
Business EPS Currency Sensitivity
Currency Exposure on Q2 2016 Sales Currency Average Rates
2016 - Currency Sensitivity
32
Q2 2015 Q2 2016 % change
EUR/USD 1.10 1.13 +2.2%
EUR/JPY 134.14 121.98 -9.1%
EUR/CNY 6.85 7.38 +7.7%
EUR/BRL 3.39 3.96 +16.8%
EUR/RUB 58.12 74.35 +27.9%
Currency Variation Business EPS Sensitivity
U.S. Dollar -0.05 USD/EUR +EUR 0.13
Japanese Yen +5 JPY/EUR -EUR 0.02
Chinese Yuan +0.2 CNY/EUR -EUR 0.02
Brazilian Real +0.4 BRL/EUR -EUR 0.01
Russian Ruble +10 RUB/EUR -EUR 0.04
€ 24.5%
US $ 36.1%
Chinese Yuan 5.8%
Japanese Yen 4.9%
Brazilian Real 2.7%
British £ 1.9%
Australian $ 1.6%
Canadian $ 1.4%
Mexican Peso 1.3%
Russian Ruble1.2%
Others 18.6%

33
Business Net Income Statement
* Net of tax.
** Determined on the basis of Business income before tax, associates and non-controlling interests.
*** Based on an average number of shares outstanding of 1,286.8 million in the second quarter of 2016 and 1,305.9 million in the second quarter of 2015.
(1) Pursuant to IFRS5 presentation requirement as "discontinued operations”, Animal Health business net result is reported on the single income statement line Net income from
held-for-exchange Animal Health business for 2016 and prior years. Until the closing of the transaction, Animal Health remains an operating segment of the Company.
(2) Including Animal Health Business which is reported on a single line in the consolidated income statements in accordance with IFRS5 (Non-current held for sale and
discontinued operations).
(3) As per a change in accounting presentation, VaxServe sales of non-Company products are reported in Other revenues from 2016 onwards. Prior period Net sales and Other
revenues have been represented accordingly.
(4) Aggregate amount including Animal Health business.
Second Quarter 2016 Pharmaceuticals Vaccines Others Total Company Animal Health (1) Total: aggregate basis (2)
€ million Q2 2016 Q2 2015 Change Q2 2016 Q2 2015 Change Q2 2016 Q2 2015 Q2 2016 Q2 2015 Q2 2016 Q2 2015 Change Q2 2016 Q2 2015 Change
Net sales 7,346 7,800 (5.8%) 797 777 2.6% - - 8,143 8,577 725 691 4.9% 8,868 9,268 (4.3%)
Other revenues (3) 68 67 1.5% 97 118 (17.8%) - - 165 185 8 8 - 173 193 (10.4%)
Cost of sales (2,046) (2,252) (9.1%) (477) (450) 6.0% - - (2,523) (2,702) (242) (236) 2.5% (2,765) (2,938) (5.9%)
As % of net sales (27.9%) (28.9%) (59.8%) (57.9%) - - (31.0%) (31.5%) (33.4%) (34.2%) (31.2%) (31.7%)
Gross profit 5,368 5,615 (4.4%) 417 445 (6.3%) - - 5,785 6,060 491 463 6.0% 6,276 6,523 (3.8%)
As % of net sales 73.1% 72.0% 52.3% 57.3% - - 71.0% 70.7% 67.7% 67.0% 70.8% 70.4%
Research and development
expenses (1,138) (1,104) 3.1% (141) (142) (0.7%) - - (1,279) (1,246) (46) (44) 4.5% (1,325) (1,290) 2.7%
As % of net sales (15.5%) (14.2%)
(17.7%) (18.3%) - - (15.7%) (14.5%) (6.3%) (6.4%) (14.9%) (13.9%)
Selling and general expenses (2,215) (2,216) (0.0%) (182) (188) (3.2%) - - (2,397) (2,404) (253) (244) 3.7% (2,650) (2,648) 0.1%
As % of net sales (30.2%) (28.4%) (22.8%) (24.2%) - - (29.4%) (28.0%) (34.9%) (35.3%) (29.9%) (28.6%)
Other current operating
income/expenses 3 (11) (1) 1 (25) (15) (23) (25) - 5 (23) (20)
Share of profit/loss of
associates* and joint ventures 28 29 2 1 - - 30 30 - - 30 30
Net income attributable to
non-controlling interests (23) (29) - - - - (23) (29) - - (23) (29)
Business operating income 2,023 2,284 (11.4%) 95 117 (18.8%) (25) (15) 2,093 2,386 192 180 6.7% 2,285 2,566 (11.0%)
As % of net sales 27.5% 29.3% 11.9% 15.1% 25.7% 27.8% 26.5% 26.0% 25.8% 27.7%
Financial income and
expenses (4) (76) (112)
Income tax expense (4) (529) (614)
Tax rate** 24.0% 25.0%
Business net income 1,680 1,840 (8.7%)
As % of net sales 18.9% 19.9%
Business earnings per
share*** (in euros) 1.31 1.41 (7.1%)

34
Business Net Income Statement
* Net of tax.
** Determined on the basis of Business income before tax, associates and non-controlling interests.
*** Based on an average number of shares outstanding of 1,287.6 million in the first semester of 2016 and 1,307.2 million in the first semester of 2015.
(1) Pursuant to IFRS5 presentation requirement as "discontinued operations”, Animal Health business net result is reported on the single income statement line Net income
from held-for-exchange Animal Health business for 2016 and prior years. Until the closing of the transaction, Animal Health remains an operating segment of the Company.
(2) Including Animal Health Business which is reported on a single line in the consolidated income statements in accordance with IFRS5 (Non-current held for sale and
discontinued operations).
(3) As per a change in accounting presentation, VaxServe sales of non-Company products are reported in Other revenues from 2016 onwards. Prior period Net sales and
Other revenues have been represented accordingly.
(4) Aggregate amount including Animal Health business.
First Half 2016 Pharmaceuticals Vaccines Others Total Company Animal Health (1) Total: aggregate basis (2)
€ million H1 2016 H1 2015 Change H1 2016 H1 2015 Change H1 2016 H1 2015 H1 2016 H1 2015 H1 2016 H1 2015 Change H1 2016 H1 2015 Change
Net sales 14,504 15,255 (4.9%) 1,422 1,374 3.5% - - 15,926 16,629 1,485 1,349 10.1% 17,411 17,978 (3.2%)
Other revenues (3) 122 129 (5.4%) 188 224 (16.1%) - - 310 353 18 20 (10.0%) 328 373 (12.1%)
Cost of sales (4,143) (4,442) (6.7%) (827) (826) 0.1% - - (4,970) (5,268) (488) (456) 7.0% (5,458) (5,724) (4.6%)
As % of net sales (28.6%) (29.1%) (58.2%) (60.1%) - - (31.2%) (31.7%) (32.9%) (33.8%) (31.3%) (31.8%)
Gross profit 10,483 10,942 (4.2%) 783 772 1.4% - - 11,266 11,714 1,015 913 11.2% 12,281 12,627 (2.7%)
As % of net sale 72.3% 71.7% 55.1% 56.2% - - 70.7% 70.4% 68.4% 67.7% 70.5% 70.2%
Research and development
expenses (2,246) (2,143) 4.8% (268) (262) 2.3% - - (2,514) (2,405) (89) (84) 6.0% (2,603) (2,489) 4.6%
As % of net sales (15.5%) (14.0%) (18.8%) (19.1%) - - (15.8%) (14.5%) (6.0%) (6.2%) (15.0%) (13.8%)
Selling and general expenses (4,261) (4,310) (1.1%) (348) (344) 1.2% - - (4,609) (4,654) (459) (432) 6.3% (5,068) (5,086) (0.4%)
As % of net sales (29.4%) (28.3%) (24.5%) (25.0%) - - (28.9%) (28.0%) (30.9%) (32.0%) (29.1%) (28.3%)
Other current operating
income/expenses 110 (39) (1) 2 (39) (55) 70 (92) (14) 5 56 (87)
Share of profit/loss of
associates* and joint ventures 44 61 9 - - - 53 61 - - 53 61
Net income attributable to
non-controlling interests (50) (62) - - - - (50) (62) - - (50) (62)
Business operating income 4,080 4,449 (8.3%) 175 168 4.2% (39) (55) 4,216 4,562 453 402 12.7% 4,669 4,964 (5.9%)
As % of net sales 28.1% 29.2% 12.3% 12.2% - 26.5% 27.4% 30.5% 29.8% 26.8% 27.6%
Financial income and
expenses (4) (194) (209)
Income tax expense (4) (1,073) (1,189)
Tax rate** 24.0% 25.0%
Business net income 3,402 3,566 (4.6%)
As % of net sales 19.5% 19.8%
Business earnings per
share*** (in euros) 2.64 2.73 (3.3%)
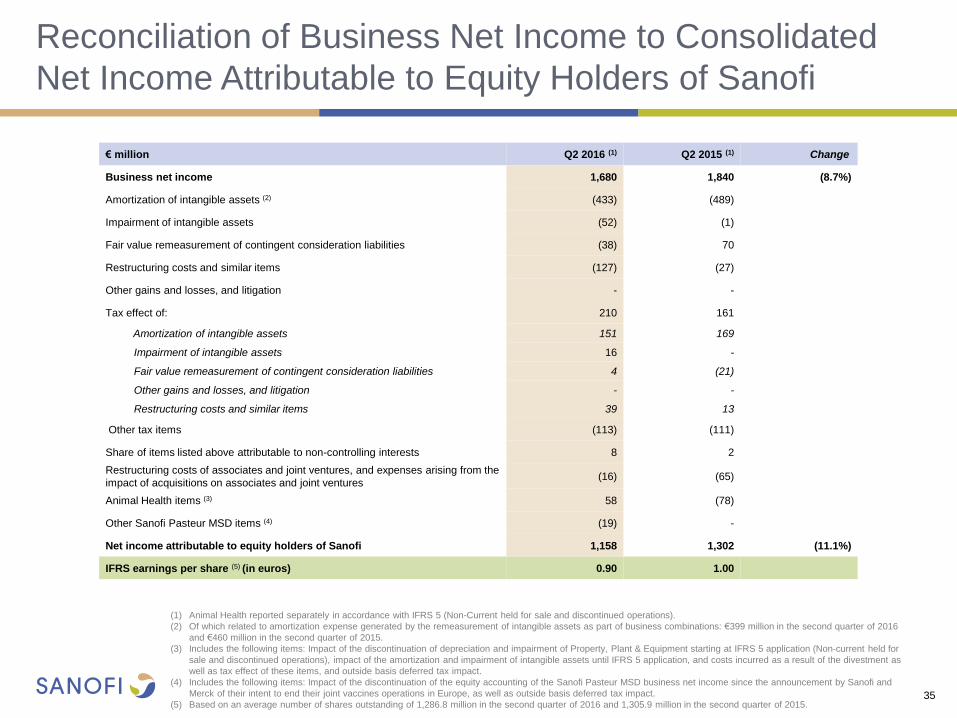
Reconciliation of Business Net Income to Consolidated
Net Income Attributable to Equity Holders of Sanofi
35
(1) Animal Health reported separately in accordance with IFRS 5 (Non-Current held for sale and discontinued operations).
(2) Of which related to amortization expense generated by the remeasurement of intangible assets as part of business combinations: €399 million in the second quarter of 2016
and €460 million in the second quarter of 2015.
(3) Includes the following items: Impact of the discontinuation of depreciation and impairment of Property, Plant & Equipment starting at IFRS 5 application (Non-current held for
sale and discontinued operations), impact of the amortization and impairment of intangible assets until IFRS 5 application, and costs incurred as a result of the divestment as
well as tax effect of these items, and outside basis deferred tax impact.
(4) Includes the following items: Impact of the discontinuation of the equity accounting of the Sanofi Pasteur MSD business net income since the announcement by Sanofi and
Merck of their intent to end their joint vaccines operations in Europe, as well as outside basis deferred tax impact.
(5) Based on an average number of shares outstanding of 1,286.8 million in the second quarter of 2016 and 1,305.9 million in the second quarter of 2015.
€ million Q2 2016 (1) Q2 2015 (1) Change
Business net income 1,680 1,840 (8.7%)
Amortization of intangible assets (2) (433) (489)
Impairment of intangible assets (52) (1)
Fair value remeasurement of contingent consideration liabilities (38) 70
Restructuring costs and similar items (127) (27)
Other gains and losses, and litigation - -
Tax effect of: 210 161
Amortization of intangible assets 151 169
Impairment of intangible assets 16 -
Fair value remeasurement of contingent consideration liabilities 4 (21)
Other gains and losses, and litigation - -
Restructuring costs and similar items 39 13
Other tax items (113) (111)
Share of items listed above attributable to non-controlling interests 8 2
Restructuring costs of associates and joint ventures, and expenses arising from the
impact of acquisitions on associates and joint ventures (16) (65)
Animal Health items (3) 58 (78)
Other Sanofi Pasteur MSD items (4) (19) -
Net income attributable to equity holders of Sanofi 1,158 1,302 (11.1%)
IFRS earnings per share (5) (in euros) 0.90 1.00

Reconciliation of Business Net Income to Consolidated
Net Income Attributable to Equity Holders of Sanofi
36
(1) Animal Health reported separately in accordance with IFRS 5 (Non-Current Assets Held for Sale and Discontinued Operations).
(2) Of which related to amortization expense generated by the remeasurement of intangible assets as part of business combinations: 809 million in the first semester of 2016 and
€931 million in the first semester of 2015.
(3) Includes the following items: Impact of the discontinuation of depreciation and impairment of Property, Plant & Equipment starting at IFRS 5 application
(Non-current held for sale and discontinued operations), impact of the amortization and impairment of intangible assets until IFRS 5 application, and costs incurred as a result
of the divestment as well as tax effect of these items.
(4) Includes the following items: Impact of the discontinuation of the equity accounting of the Sanofi Pasteur MSD business net income since the announcement by Sanofi and Merck of
their intent to end their joint vaccins operations in Europe, as well as outside basis deferred tax impact.
(5) Based on an average number of shares outstanding of 1,287.6 million in the first semester of 2016 and 1,307.2 million in the first semester of 2015.
€ million H1 2016 (1) H1 2015 (1) Change
Business net income 3,402 3,566 (4.6%)
Amortization of intangible assets (2) (877) (988)
Impairment of intangible assets (52) (28)
Fair value remeasurement of contingent consideration liabilities (67) 71
Restructuring costs (627) (380)
Other gains and losses, and litigation - -
Tax effect of items listed above: 548 473
Amortization of intangible assets 307 343
Impairment of intangible assets 16 10
Fair value remeasurement of contingent consideration liabilities 15 (14)
Other gains and losses, and litigation - -
Restructuring costs and similar items 210 134
Other tax items (113) (111)
Share of items listed above attributable to non-controlling interests 9 3
Restructuring costs of associates and joint ventures, and expenses arising from the
impact of acquisitions on associates and joint ventures 54 (127)
Animal Health items (3) (13) (154)
Other Sanofi Pasteur MSD items (4) (19) -
Net income attributable to equity holders of Sanofi 2,245 2,325 (3.4%)
Consolidated earnings per share (5) (in euros) 1.74 1.78

37
Consolidated Income Statements
(1) Including Animal Health Business which is reported on a single line in the consolidated income statements in accordance with IFRS5
(Non-current held for sale and discontinued operations).
(2) As per a change in accounting presentation, VaxServe sales of non-Company products are reported in Other revenues from 2016 onwards. Prior period
Net sales and Other revenues have been restated accordingly.
€ million Q2 2016 (1) Q2 2015 (1)(2) H1 2016 (1) H2 2015 (1)(2)
Net sales 8,143 8,577 15,926 16,629
Other revenues 165 185 310 353
Cost of sales (2,523) (2,702) (4,970) (5,268)
Gross profit 5,785 6,060 11,266 11,714
Research and development expenses (1,279) (1,246) (2,514) (2,405)
Selling and general expenses (2,397) (2,404) (4,609) (4,654)
Other operating income 48 40 265 74
Other operating expenses (71) (65) (195) (166)
Amortization of intangible assets (433) (489) (877) (988)
Impairment of intangible assets (52) (1) (52) (28)
Fair value remeasurement of contingent consideration liabilities (38) 70 (67) 71
Restructuring costs and similar items (127) (27) (627) (380)
Operating income 1,436 1,938 2,590 3,238
Financial expenses (112) (131) (241) (262)
Financial income 38 21 50 57
Income before tax and associates and joint ventures 1,362 1,828 2,399 3,033
Income tax expense (380) (508) (497) (692)
Share of profit / loss of associates and joint ventures 5 (35) 98 (66)
Net income excluding the held for exchange Animal Health business 987 1,285 2,000 2,275
Net income from the held for exchange Animal Health Business 186 44 286 109
Net income 1,173 1,329 2,286 2,384
Net income attributable to non-controlling interests 15 27 41 59
Net income attributable to equity holders of Sanofi 1,158 1,302 2,245 2,325
Average number of shares outstanding (million) 1,286.8 1,305.9 1,287.6 1,307.2
Earnings per share excluding the held for exchange Animal Health Business (in euros) 0.76 0.96 1.52 1.70
IFRS earnings per share (in euros) 0.90 1.00 1.74 1.78

38
Cash Flow Statements
(1) Excluding restructuring costs and similar items.
€ million 2016 2015
Business net income 3,402 3,566
Depreciation amortization and impairment of property, plant and equipment and software 638 628
Gains and losses on disposals of non-current assets, net of tax (27) (44)
Other non-cash items (19) (218)
Operating cash flow before changes in working capital(1) 3,994 3,932
Changes in working capital(1) (753) (181)
Acquisitions of property, plant and equipment and software (700) (667)
Free cash flow(1) 2,541 3,084
Acquisitions of intangibles assets, excluding software (556) (280)
Acquisitions of investments in consolidated undertakings including assumed debt (1) (369) (169)
Restructuring costs and similar items paid (347) (345)
Proceeds from disposals of property, plant and equipment, intangibles assets and other non-current assets, net of
tax 262 86
Issuance of Sanofi shares 17 462
Dividends paid to shareholders of Sanofi (3,759) (3,694)
Acquisition of treasury shares (1,403) (1,243)
Disposals of treasury shares, net of tax - 1
Transactions with non-controlling interests including dividends (9) (16)
Foreign exchange impact 107 (391)
Other items (231) (50)
Change in net debt (3,747) (2,555)
39
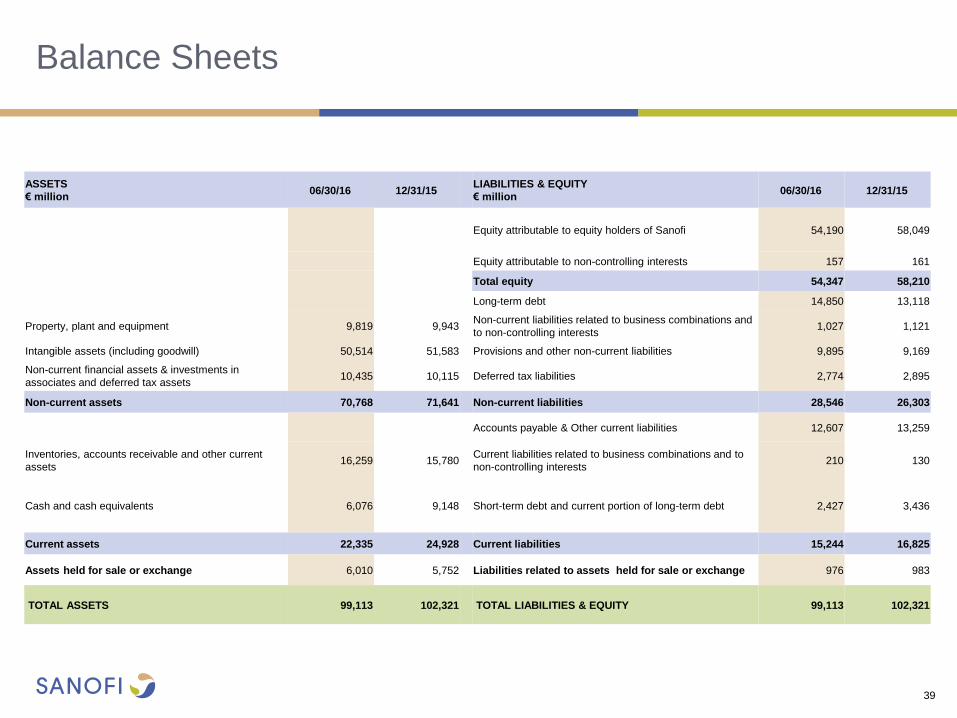
Balance Sheets
ASSETS
€ million 06/30/16 12/31/15
LIABILITIES & EQUITY
€ million 06/30/16 12/31/15
Equity attributable to equity holders of Sanofi 54,190 58,049
Equity attributable to non-controlling interests 157 161
Total equity 54,347 58,210
Long-term debt 14,850 13,118
Property, plant and equipment 9,819 9,943 Non-current liabilities related to business combinations and
to non-controlling interests 1,027 1,121
Intangible assets (including goodwill) 50,514 51,583 Provisions and other non-current liabilities 9,895 9,169
Non-current financial assets & investments in
associates and deferred tax assets 10,435 10,115 Deferred tax liabilities 2,774 2,895
Non-current assets 70,768 71,641 Non-current liabilities 28,546 26,303
Accounts payable & Other current liabilities 12,607 13,259
Inventories, accounts receivable and other current
assets 16,259 15,780
Current liabilities related to business combinations and to
non-controlling interests 210 130
Cash and cash equivalents 6,076 9,148 Short-term debt and current portion of long-term debt 2,427 3,436
Current assets 22,335 24,928 Current liabilities 15,244 16,825
Assets held for sale or exchange 6,010 5,752 Liabilities related to assets held for sale or exchange 976 983
TOTAL ASSETS 99,113 102,321 TOTAL LIABILITIES & EQUITY 99,113 102,321