q1 fy2018 consolidated financial results - sony.net · 0 q1 fy2018consolidated financial results...
TRANSCRIPT

0
Q1 FY2018 Consolidated Financial Results
(Three months ended June 30, 2018)
Sony Corporation
July 31, 2018
Please be aware that, in the following remarks, statements made with respect to Sony‘s current plans, estimates, strategies and beliefs and other statements that are not historical facts are forward-looking statements about the future performance of Sony. These statements are based on management’sassumptions in light of the information currently available to it, and, therefore, youshould not place undue reliance on them.
Sony cautions you that a number of important factors could cause actual results to differ materially from those discussed in the forward-looking statements. For additional information as to risks and uncertainties, as well as other factors that could cause actual results to differ, please refer to today's press release, which can be accessed by visiting www.sony.net/IR.
0

Q1 FY2018 Consolidated Results and FY2018 Consolidated Forecast
Segments Outlook
I am CFO Hiroki Totoki. Thank you for your time today.
Today I would like to explain two topics in the next 15 minutes:
1

Q1 FY2018 Consolidated Results
Q1 FY17 Q1 FY18 ChangeQ1 FY18
USD Amount*1
Sales & operating revenue 1,858.1 1,953.6 +95.5 bln yen
(+5%)$17,907
Operating income 157.6 195.0 +37.4 bln yen
(+24%)1,787
Income before income taxes 148.9 312.1 +163.2 bln yen
(+110%)2,861
Net income attributable to Sony Corporation’s stockholders
80.9 226.4 +145.6 bln yen
(+180%)2,076
Net income attributable to Sony Corporation’sstockholders per share of common stock (diluted) 62.70 yen 174.80 yen +112.10 yen 1.60 USD
Restructuring charges*2 2.4 1.3 -46% 12
Additions to long-lived assets*3 67.4 63.0 -7% 577
Depreciation and amortization*4 83.3 86.2 +4% 790
Research and development expenses 101.8 107.5 +6% 985
Average rate
1 US dollar 111.1 yen 109.1 yen
1 Euro 122.1 yen 130.1 yen
(Bln Yen, Mln US dollars)
*1 US dollar amounts have been translated from yen, for convenience only, using the average rate listed on this slide*2 Restructuring charges are included in operating income as operating expenses (applies to all following pages)*3 Does not include the increase in intangible assets resulting from acquisitions (applies to all following pages) *4 Includes amortization expenses for intangible assets and for deferred insurance acquisition costs (applies to all following pages)
FY18 Q1 consolidated sales increased 5% compared to the same quarter of theprevious fiscal year (“year-on-year”) to 1 trillion 953.6 billion yen and consolidatedoperating income increased 24% year-on-year to 195.0 billion yen. Net incomeattributable to Sony Corporation’s stockholders for the quarter was 226.4 billionyen, approximately 2.8 times that of the same quarter of the previous fiscal year.
2
Operating Income
Adjusted Operating
IncomeAdjusted Operating Income excludes the following items*
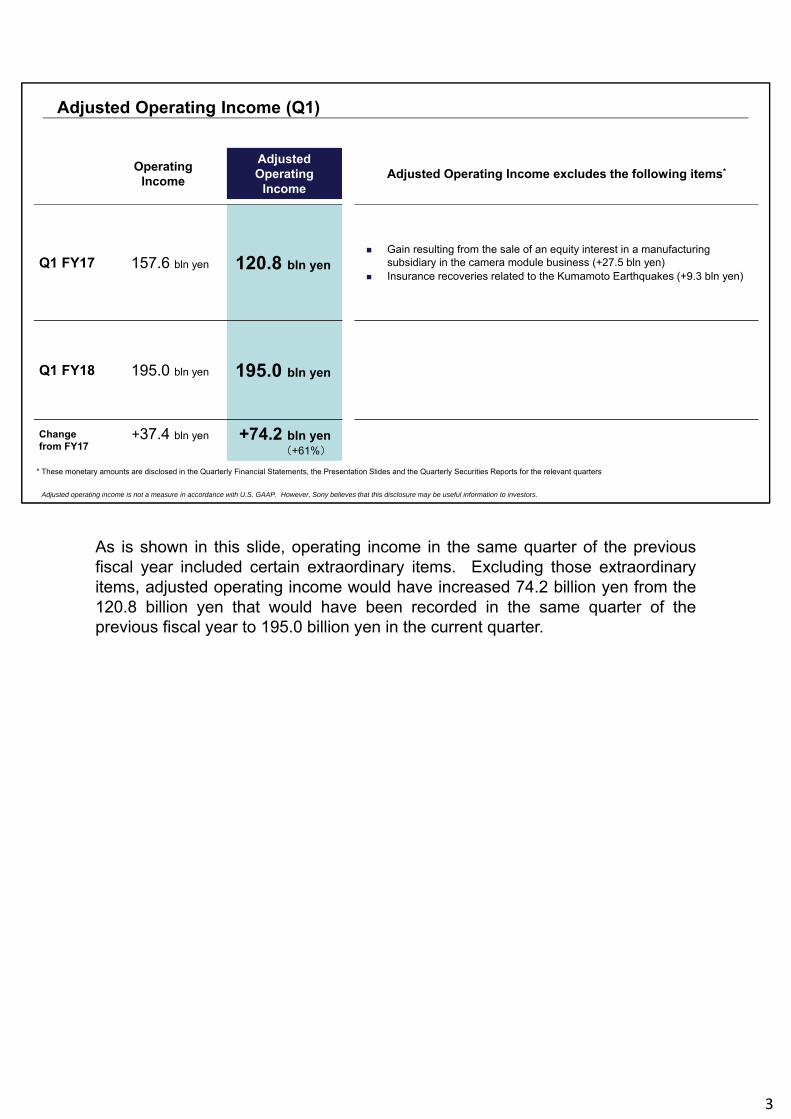
Q1 FY17 157.6 bln yen 120.8 bln yen Gain resulting from the sale of an equity interest in a manufacturing
subsidiary in the camera module business (+27.5 bln yen) Insurance recoveries related to the Kumamoto Earthquakes (+9.3 bln yen)
Q1 FY18 195.0 bln yen 195.0 bln yen
Changefrom FY17
+37.4 bln yen +74.2 bln yen(+61%)
Adjusted Operating Income (Q1)
* These monetary amounts are disclosed in the Quarterly Financial Statements, the Presentation Slides and the Quarterly Securities Reports for the relevant quarters
Adjusted operating income is not a measure in accordance with U.S. GAAP. However, Sony believes that this disclosure may be useful information to investors.
As is shown in this slide, operating income in the same quarter of the previousfiscal year included certain extraordinary items. Excluding those extraordinaryitems, adjusted operating income would have increased 74.2 billion yen from the120.8 billion yen that would have been recorded in the same quarter of theprevious fiscal year to 195.0 billion yen in the current quarter.
3
Income Before Income Taxes
Adjusted Income Before Income
TaxesAdjusted Income Before Income Taxes excludes the following items*
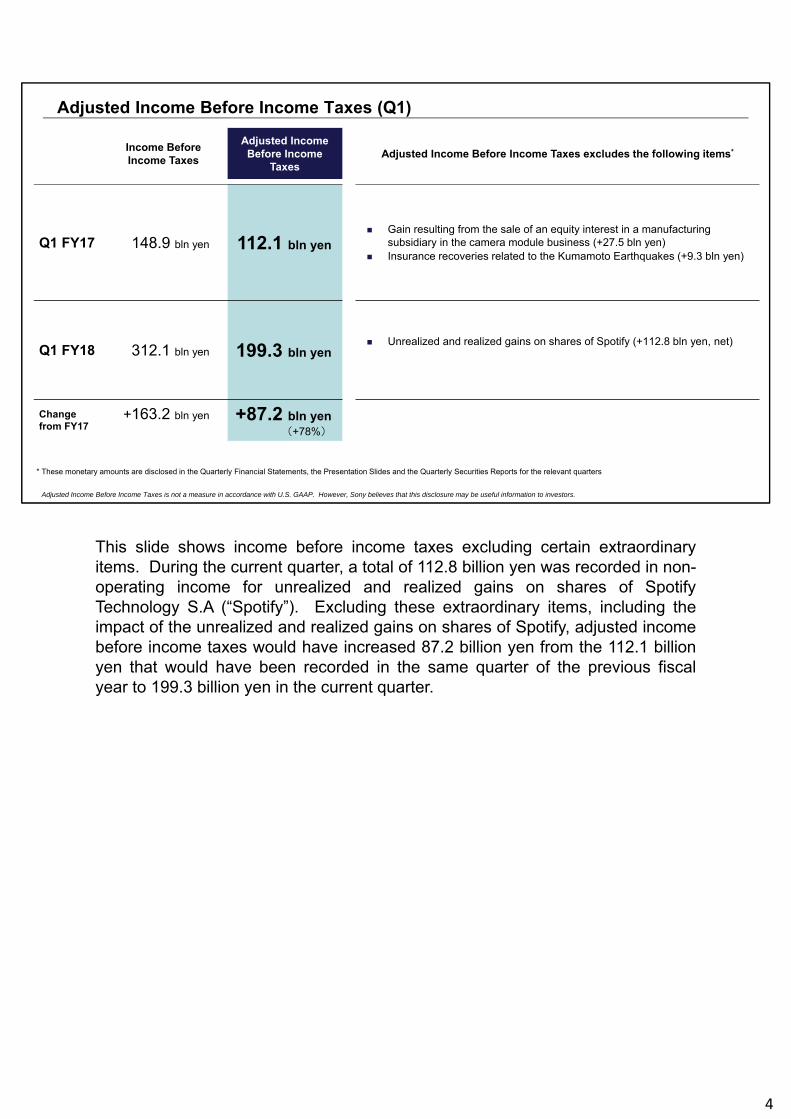
Q1 FY17 148.9 bln yen 112.1 bln yen Gain resulting from the sale of an equity interest in a manufacturing
subsidiary in the camera module business (+27.5 bln yen) Insurance recoveries related to the Kumamoto Earthquakes (+9.3 bln yen)
Q1 FY18 312.1 bln yen 199.3 bln yen Unrealized and realized gains on shares of Spotify (+112.8 bln yen, net)
Changefrom FY17
+163.2 bln yen +87.2 bln yen(+78%)
Adjusted Income Before Income Taxes (Q1)
* These monetary amounts are disclosed in the Quarterly Financial Statements, the Presentation Slides and the Quarterly Securities Reports for the relevant quarters
Adjusted Income Before Income Taxes is not a measure in accordance with U.S. GAAP. However, Sony believes that this disclosure may be useful information to investors.
This slide shows income before income taxes excluding certain extraordinaryitems. During the current quarter, a total of 112.8 billion yen was recorded in non-operating income for unrealized and realized gains on shares of SpotifyTechnology S.A (“Spotify”). Excluding these extraordinary items, including theimpact of the unrealized and realized gains on shares of Spotify, adjusted incomebefore income taxes would have increased 87.2 billion yen from the 112.1 billionyen that would have been recorded in the same quarter of the previous fiscalyear to 199.3 billion yen in the current quarter.
4

Q1 FY2018 Consolidated Results
Q1 FY17 Q1 FY18 ChangeQ1 FY18
USD Amount*1
Sales & operating revenue 1,858.1 1,953.6 +95.5 bln yen
(+5%)$17,907
Operating income 157.6 195.0 +37.4 bln yen
(+24%)1,787
Income before income taxes 148.9 312.1 +163.2 bln yen
(+110%)2,861
Net income attributable to Sony Corporation’s stockholders
80.9 226.4 +145.6 bln yen
(+180%)2,076
Net income attributable to Sony Corporation’sstockholders per share of common stock (diluted) 62.70 yen 174.80 yen +112.10 yen 1.60 USD
Restructuring charges*2 2.4 1.3 -46% 12
Additions to long-lived assets*3 67.4 63.0 -7% 577
Depreciation and amortization*4 83.3 86.2 +4% 790
Research and development expenses 101.8 107.5 +6% 985
Average rate
1 US dollar 111.1 yen 109.1 yen
1 Euro 122.1 yen 130.1 yen
(Bln Yen, Mln US dollars)
*1 US dollar amounts have been translated from yen, for convenience only, using the average rate listed on this slide*2 Restructuring charges are included in operating income as operating expenses (applies to all following pages)*3 Does not include the increase in intangible assets resulting from acquisitions (applies to all following pages) *4 Includes amortization expenses for intangible assets and for deferred insurance acquisition costs (applies to all following pages)
This is not shown in this slide, but if the impact on income taxes of theseextraordinary items was approximated using the effective tax rates of eachquarter, then excluding these extraordinary items, adjusted net income* wouldhave increased 83.3 billion yen from the 57.5 billion yen that would have beenrecorded in the same quarter of the previous fiscal year to 140.8 billion yen in thecurrent quarter.
* Adjusted net income is not a measure in accordance with U.S. GAAP. However, Sony believesthat this disclosure may be useful information to investors.
5

Q1 FY2018 Results by Segment
Q1 FY17 Q1 FY18 Change FX Impact
Game & Network Services (G&NS)Sales 348.1 472.1 +124.0 +6.0
Operating income 17.7 83.5 +65.7 +4.5
MusicSales 168.6 181.5 +12.9 -1.8
Operating income 25.0 32.1 +7.1
PicturesSales 205.8 175.1 -30.7 -3.3
Operating income -9.5 -7.6 +1.9
Home Entertainment &Sound (HE&S)
Sales 256.9 272.1 +15.2 +0.8
Operating income 22.6 17.4 -5.2 +1.2
Imaging Products &Solutions (IP&S)
Sales 155.6 164.2 +8.6 +2.4
Operating income 23.2 26.1 +2.9 +1.6
Mobile Communications(MC)
Sales 181.2 132.5 -48.7 -0.2
Operating income 3.6 -10.8 -14.4 +1.8
SemiconductorsSales 204.3 202.2 -2.0 -2.9
Operating income 55.4 29.1 -26.3 -2.3
Financial ServicesRevenue 303.2 335.2 +32.0
Operating income 46.2 40.6 -5.6
All OtherSales 109.2 82.9 -26.3
Operating income -8.2 0.3 +8.5
Corporate and eliminationSales -74.7 -64.2 +10.5
Operating income -18.5 -15.7 +2.8
Consolidated totalSales 1,858.1 1,953.6 +95.5
Operating income 157.6 195.0 +37.4
· Sales and Revenue in each business segment represents sales and revenue recorded before intersegment transactions are eliminated. Operating income in each business segment represents operating income reported before intersegment transactions are eliminated and excludes unallocated corporate expenses (applies to all following pages)
· Both Sales and Revenue include operating revenue and intersegment sales (applies to all following pages) · For further details about the impact of foreign exchange rate fluctuations on sales and operating income (loss), see Notes on page 20 (applies to all following pages)
(Bln Yen)
This slide shows the results by segment for Q1.
6

FY2018 Consolidated Results Forecast
FY17FY18
April FCTFY18
July FCTChange from April FCT
Sales & operating revenue 8,544.0 8,300 8,600 +300 bln yen
(+4%)
Operating income 734.9 670 670 -
Income before income taxes 699.0 735 760 +25 bln yen
(+3%)
Net income attributable to Sony Corporation’s stockholders
490.8 480 500 +20 bln yen
(+4%)
Restructuring charges 22.4 22 22 -
Additions to long-lived assets 332.1 360 360 -
Depreciation and amortization 361.4 360 360 -
Research and development expenses 458.5 470 470 -
Average rate Actual AssumptionAssumption
(Q2-Q4 FY18)
1 US dollar 110.9 yenApprox.105 yen
Approx. 110 yen
1 Euro 129.7 yenApprox. 125 yen
Approx.127 yen
(Bln Yen)
Dividend per Share(Planned)
Interim 15 yen
Year-end Undecided
Next is the consolidated results forecast for FY18. The consolidated salesforecast has increased 300 billion yen to 8 trillion 600 billion yen as a result ofupward revisions, primarily in the Game & Network Services segment. There isno change to the consolidated operating income forecast from April. Primarilybecause the amount of unrealized and realized gains on shares of Spotify that Imentioned earlier exceeded the amount in our April forecast, we have upwardlyrevised our forecast for income before income taxes to 760 billion yen and ourforecast for net income to 500 billion yen. We have changed the assumedforeign exchange rates for the nine months ending March 31, 2019 to 110 yen tothe U.S. dollar and 127 yen to the Euro. We expect to issue an interim dividendof 15 yen per share.
7

FY2018 Results Forecast by Segment
FY17FY18
April FCT
FY18July FCT
Change from April FCT
Game & Network Services (G&NS)
Sales 1,943.8 1,900 2,180 +280Operating income 177.5 190 250 +60
MusicSales 800.0 750 760 +10Operating income 127.8 112 115 +3
PicturesSales 1,011.1 960 990 +30Operating income 41.1 42 44 +2
Home Entertainment &Sound (HE&S)
Sales 1,222.7 1,150 1,150 -Operating income 85.8 86 86 -
Imaging Products &Solutions (IP&S)
Sales 655.9 660 670 +10Operating income 74.9 75 78 +3
Mobile Communications(MC)
Sales 723.7 640 610 -30Operating income -27.6 -15 -30 -15
SemiconductorsSales 850.0 870 890 +20Operating income 164.0 100 120 +20
Financial ServicesRevenue 1,228.4 1,270 1,270 -Operating income 178.9 170 170 -
All Other,Corporate and elimination Operating income -87.6 -90 -163 -73
Consolidated totalSales 8,544.0 8,300 8,600 +300Operating income 734.9 670 670 -
(Bln Yen)
The fiscal year forecasts for each segment are shown on this slide. As you can see, we have changed the forecasts for several segments, and I will explain each when I discuss the segment results in a moment. We have incorporated a 73 billion yen contingency budget in All Other, Corporate and elimination. In addition to general risks, such as those related to the economy, the competitive environment and changes in foreign exchange rates, we believe there are risks related to our smartphone business, which I will explain later, and risks related to component procurement, especially multilayer ceramic capacitors which are used in a variety of electronics products. I will now turn to the situation in each of our business segments.
8
Game & Network Services Segment
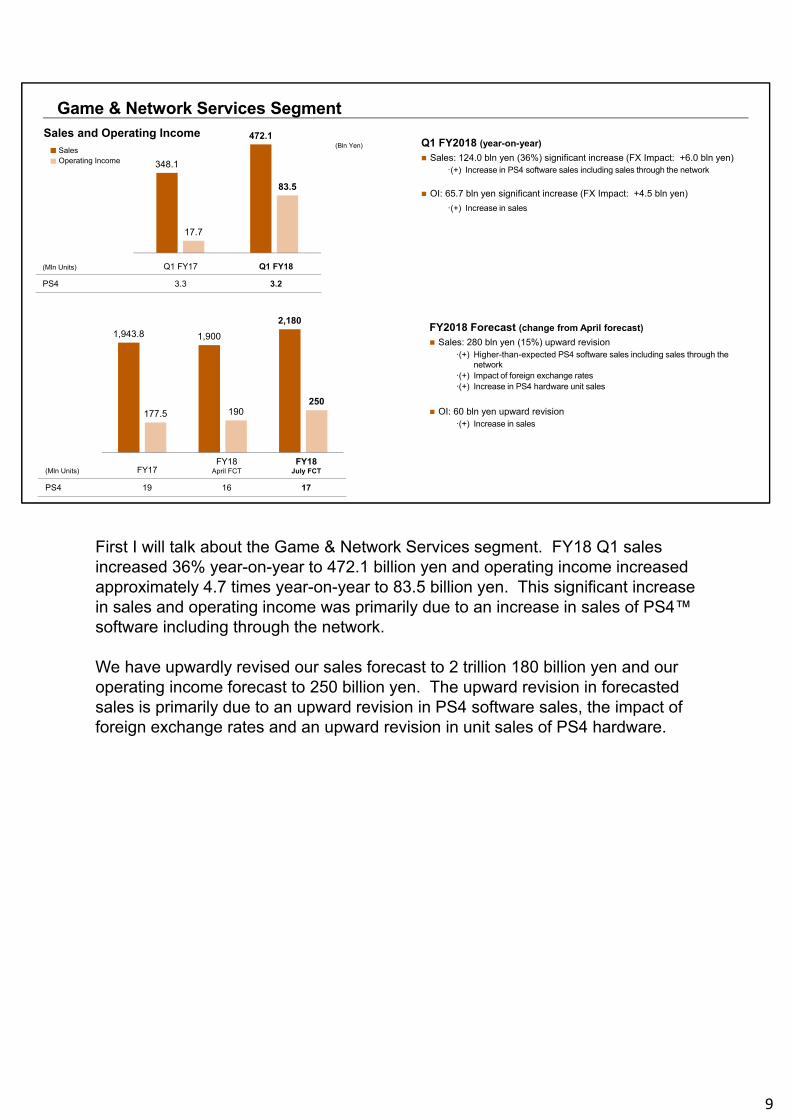
Q1 FY2018 (year-on-year)
Sales: 124.0 bln yen (36%) significant increase (FX Impact: +6.0 bln yen)·(+) Increase in PS4 software sales including sales through the network
OI: 65.7 bln yen significant increase (FX Impact: +4.5 bln yen)
·(+) Increase in sales
Sales and Operating Income
(Mln Units) FY17FY18
April FCT FY18
July FCT
PS4 19 16 17
348.1
472.1
17.7
83.5
(Mln Units) Q1 FY17 Q1 FY18
PS4 3.3 3.2
1,943.8 1,900
2,180
177.5 190250
FY2018 Forecast (change from April forecast)
Sales: 280 bln yen (15%) upward revision·(+) Higher-than-expected PS4 software sales including sales through the
network ·(+) Impact of foreign exchange rates·(+) Increase in PS4 hardware unit sales
OI: 60 bln yen upward revision·(+) Increase in sales
SalesOperating Income
(Bln Yen)
First I will talk about the Game & Network Services segment. FY18 Q1 sales increased 36% year-on-year to 472.1 billion yen and operating income increased approximately 4.7 times year-on-year to 83.5 billion yen. This significant increase in sales and operating income was primarily due to an increase in sales of PS4™ software including through the network.
We have upwardly revised our sales forecast to 2 trillion 180 billion yen and our operating income forecast to 250 billion yen. The upward revision in forecasted sales is primarily due to an upward revision in PS4 software sales, the impact of foreign exchange rates and an upward revision in unit sales of PS4 hardware.
9

God of War
©Sony Interactive Entertainment LLC. God of War is a trademark of Sony Interactive Entertainment LLC
We upwardly revised PS4 software sales to reflect the fact that our first-party title God of War and other third-party titles are significantly exceeding expectations, and the titles we announced at E3 are receiving strong feedback.
10

Game & Network Services Segment
Q1 FY2018 (year-on-year)
Sales: 124.0 bln yen (36%) significant increase (FX Impact: +6.0 bln yen)·(+) Increase in PS4 software sales including sales through the network
OI: 65.7 bln yen significant increase (FX Impact: +4.5 bln yen)
·(+) Increase in sales
Sales and Operating Income
(Mln Units) FY17FY18
April FCT FY18
July FCT
PS4 19 16 17
348.1
472.1
17.7
83.5
(Mln Units) Q1 FY17 Q1 FY18
PS4 3.3 3.2
1,943.8 1,900
2,180
177.5 190250
FY2018 Forecast (change from April forecast)
Sales: 280 bln yen (15%) upward revision·(+) Higher-than-expected PS4 software sales including sales through the
network ·(+) Impact of foreign exchange rates·(+) Increase in PS4 hardware unit sales
OI: 60 bln yen upward revision·(+) Increase in sales
SalesOperating Income
(Bln Yen)
We revised our PS4 hardware unit sales forecast to reflect recent strength in actual sales. Primarily due to the impact of the increase in sales, we upwardly revised our operating income forecast.
11

Music Segment
Q1 FY2018 (year-on-year)
Sales: 12.9 bln yen (8%) increase (FX Impact: -1.8 bln yen)
·(+) Increase in Visual Media and Platform sales due to the strong performance of Fate/Grand Order, a game application for mobile devices
·(+) Increase in Recorded Music sales due to an increase in digital streaming revenues
·(--) Decrease in Recorded Music sales due to the impact of the new accounting standard
OI: 7.1 bln yen increase
·(+) Increase in sales·(--) Increase in expenses incurred for EMI’s warrant and management equity
plans
FY2018 Forecast (change from April forecast)
Sales: 10 bln yen (1%) upward revision·(+) Impact of foreign exchange rates
OI: 3 bln yen upward revision·(+) Positive impact from cost reductions·(+) Positive impact of foreign exchange rates·(--) Expenses incurred for EMI’s warrant and management equity plans
Sales and Operating Income
800.0750 760
127.8112 115
168.6 181.5
25.0 32.1
Q1 FY17 Q1 FY18
FY17FY18
April FCT FY18
July FCT
Recorded Music Category Revenue
447.0
Streaming* Revenue(included above)
197.4
(Bln Yen)Sales
Operating Income
* Streaming includes digital audio, digital video and digital radio, and includes revenue from both subscription and ad-supported services.
Recorded Music Category Revenue
99.8 99.7
Streaming* Revenue(included above)
38.4 52.2
Next, I will talk about the Music segment. FY18 Q1 sales increased 8% year-on-year to 181.5 billion yen. Despite the negative impact of a change in accounting standards, sales increased primarily due to an increase in streaming revenue and the continued strong performance of mobile gaming applications, primarily Fate/Grand Order. Operating income increased 7.1 billion yen year-on-year to 32.1 billion yen. Due to an increase in one-time expenses, equity in net loss for EMI Music Publishing (“EMI”), which operates a music publishing business, was recorded in the current quarter compared to equity in net income in the same quarter of the previous fiscal year, but the impact of the increase in sales resulted in an increase in overall segment profitability.
We have upwardly revised our April forecast for sales and operating income to 760 billion yen and 115 billion yen respectively. We upwardly revised operating income primarily due to the expected benefit of cost improvements and the positive impact of foreign exchange rates, partially offset by the deterioration of equity in net income I just mentioned.
12

Today we announced that Nile Acquisition LLC, a consolidated subsidiary which owns approximately 40% of EMI, has become a wholly owned subsidiary. In addition to this, if we are able to close our previously announced transaction to acquire the remaining approximately 60% interest in EMI, EMI will become a wholly-owned subsidiary of Sony. That will make Sony one of the world’s largest music publishers, administering over 4 million songs. We aim to continue to capitalize on the growth of the music publishing business primarily resulting from the growth of streaming services.
13

Pictures Segment
Q1 FY2018 (year-on-year)The following analysis is on a U.S. dollar basis
Sales: 30.7 bln yen (15%) significant decrease
(U.S. dollar basis: -257 mil USD / -14%)·(--) Decrease in Television Productions sales due to lower licensing
revenues·(--) Decrease in Media Networks sales due to lower advertising revenues
as compared to the same quarter of the previous fiscal year, which included revenues for the Indian Premier League
OI: 1.9 bln yen improvement
·(+) Decrease in theatrical advertising costs·(+) Strong home entertainment performance of Jumanji: Welcome to the
Jungle·(--) Decrease in sales
FY2018 Forecast (change from April forecast)
Sales: 30 bln yen (3%) upward revision
·(+) Impact of foreign exchange rates
OI: 2 bln yen upward revision
·(+) Positive impact of foreign exchange rates
Sales and Operating Income
205.8175.1
-9.5 -7.6
Q1 FY17 Q1 FY18
FY17FY18
April FCT FY18
July FCT
1,011.1960 990
41.1 42 44
(Bln Yen)Sales
Operating Income
Next, I will talk about the Pictures segment. FY18 Q1 sales decreased 15% year-on-year to 175.1 billion yen. This decrease in sales was primarily due to lower licensing revenue from U.S. television series compared to the same quarter of the previous fiscal year and a decrease in advertising revenues in the Media Networks business compared to the same quarter of the previous fiscal year during which we had the broadcast rights for the Indian Premier League cricket competition. An operating loss of 7.6 billion yen was recorded. Despite the impact of the decrease in sales, loss decreased 1.9 billion yen compared to the same quarter of the previous fiscal year in which advertising costs were recorded for the July 2017 release of Spider-Man: Homecoming.
Due to the impact of foreign exchange rates, we have upwardly revised our FY18 forecast for sales to 990 billion yen and operating income to 44 billion yen.
14

Home Entertainment & Sound Segment
Q1 FY2018 (year-on-year)
Sales: 15.2 bln yen (6%) increase (FX impact: +0.8 bln yen)·(+) Increase in unit sales of televisions·(+) Increase in home audio and video sales resulting from strong sales of
headphones
OI: 5.2 bln yen decrease (FX Impact: +1.2 bln yen)·(--) Increase in indirect costs* at sales companies, research and development
expenses and marketing costs·(+) Increase in sales
FY2018 Forecast Sales / OI : Remain unchanged from April forecast
Sales and Operating Income
(Mln Units) FY17FY18
April FCT FY18
July FCT
TVs 12.4 11.5 11.5
1,222.71,150 1,150
85.8 86 86
256.9272.1
22.617.4
(Mln Units) Q1 FY17 Q1 FY18
TVs 2.5 2.6
(Bln Yen)Sales
Operating Income
*A change has been made to the calculation method used for allocating indirect expenses incurred by sales companies to the segments every quarter.For details, please refer to F-4 in “Q1 FY18 Financial Statements”
Next is the Home Entertainment & Sound segment. FY18 Q1 sales increased 6% year-on-year to 272.1 billion yen and operating income decreased 5.2 billion yen to 17.4 billion yen. The increase in sales was primarily due to an increase in unit sales of televisions, primarily in Europe, and an increase in sales of audio products, primarily headphones. Operating income decreased primarily due to an increase in the allocation for indirect expenses incurred by sales companies, partially offset by the impact of the increase in sales.
The FY18 forecast remains unchanged from April; we expect to record the same level of operating income as last fiscal year.
15

4K LCD TV BRAVIA®KJ-65X9000F (65V)
4K OLED TV BRAVIA® KJ-65A8F (65V) 4K HDR ProcessorX1 Extreme
During the quarter, we began selling 4 lines of new 4K BRAVIA® TVs, including OLED TVs. Thanks to Sony’s proprietary, high-performance image enhancement engine, these TVs render superb images which make you feel like you are really there by leveraging the unique characteristics of OLED or LCD. In addition, our OLED TVs continue to use the acoustic surface technology which creates sound by vibrating the screen. We aim to differentiate our products using these proprietary technologies and continue to bring high value-added products to our customers.
16

Imaging Products & Solutions Segment
Q1 FY2018 (year-on-year)
Sales: 8.6 bln yen (6%) increase (FX Impact: +2.4 bln yen)
·(+) Improvement in the product mix of Still and Video Cameras reflecting a shift to high value-added models
·(+) Impact of foreign exchange rates·(--) Decrease in unit sales
OI: 2.9 bln yen increase (FX Impact: +1.6 bln yen)·(+) Improvement in the product mix of Still and Video Cameras·(+) Positive impact of foreign exchange rates·(--) Decrease in unit sales·(--) Absence of insurance recoveries related to the Kumamoto Earthquakes
recorded in Q1 FY17 (2.6 bln yen)
FY2018 Forecast (change from April forecast)
Sales: 10 bln yen (2%) upward revision
·(+) Impact of foreign exchange rates
OI: 3 bln yen upward revision·(+) Positive impact of foreign exchange rates
Sales and Operating Income
(Mln Units)FY17 FY18
April FCTFY18
July FCT
Digital Cameras* 4.4 3.8 3.8
655.9 660 670
74.9 75 78
155.6 164.2
23.2 26.1
(Mln Units) Q1 FY17 Q1 FY18
Digital Cameras* 1.25 1.0
(Bln Yen)Sales
Operating Income
* Includes compact digital cameras and interchangeable single-lens cameras / Excludes interchangeable lenses
Next I will explain the Imaging Products & Solutions segment. FY18 Q1 sales increased 6% year-on-year to 164.2 billion yen and operating income increased 2.9 billion yen to 26.1 billion yen. The increase in sales and operating income was primarily due to an increase in sales of high value-added products, primarily interchangeable lens mirrorless cameras and lenses themselves.
The FY18 forecast was revised upward to 670 billion yen for sales and 78 billion yen for operating income primarily due to the revision in foreign exchange rate assumptions.
17

FE 400mm F2.8 GM OSS
Full lineup of 35mm full-frame mirrorless cameras and compatible E Mount interchangeable lenses
On June 28, we announced the world’s lightest, large aperture super-telephoto lens with a 400 mm focal length and maximum large aperture of F2.8, which is designed for the 35 mm format. Aside from the high-quality images that this G master lens can render, its light weight and maneuverability meets the high-level demands of professional photographers not only when shooting sports and the news, but also when capturing wildlife. Once we start selling this product, we will have 29 full-frame interchangeable E-mount lenses. We will continue to expand our lens lineup in order to meet the diverse needs of professionals, and we will work to solidify our position in the full-frame mirrorless camera market.
18

Mobile Communications Segment
Q1 FY2018 (year-on-year)
Sales: 48.7 bln yen (27%) significant decrease (FX Impact: -0.2 bln yen)·(--) Decrease in smartphone unit sales mainly in Europe and Japan
OI: 14.4 bln yen significant deterioration (FX Impact: +1.8 bln yen)
·(--) Decrease in sales·(+) Reductions in operating costs
FY2018 Forecast (change from April forecast)
Sales: 30 bln yen (5%) downward revision·(--) Decrease in smartphone unit sales mainly in Europe
OI: 15 bln yen downward revision·(--) Decrease in sales·(--) Negative impact of foreign exchange rates ·(+) Reductions in operating costs
Sales and Operating Income
(Mln Units) FY17FY18
April FCTFY18
July FCT
Smartphones 13.5 10 9
723.7640 610
-27.6 -15 -30
(Mln Units) Q1 FY17 Q1 FY18
Smartphones 3.4 2.0
181.2132.5
3.6
-10.8
3.7
-31.3Impairment Charge of Long-Lived Assets
(Bln Yen)Sales
Operating Income
Next I will talk about the Mobile Communications segment. FY18 Q1 sales decreased 27% year-on-year to 132.5 billion yen due to a decrease in unit sales of smartphones primarily in Europe and Japan. An operating loss of 10.8 billion yen was recorded in the current quarter, compared to a profit in the same quarter of the previous fiscal year, primarily due to the impact of the decrease in sales.
We have downwardly revised our sales forecast to 610 billion yen and our operating loss forecast to 30 billion yen. This downward revision is primarily due to the negative impact of foreign exchange rates and a reduction in expected unit sales of smartphones, primarily in the first half of the fiscal year, reflecting recent sales results. Since there is a risk that the competitive environment will become even more severe, we have begun to assess the impact on smartphone unit sales in the second half of the fiscal year and the countermeasures we will implement if that risk becomes a reality. As a result of this assessment, there is a risk that we will have to downwardly revise our forecast further for the current fiscal year and revise our mid-range plan.
19

Q1 FY17 Q1 FY18
Image Sensors Sales 148.8 161.5
Semiconductors Segment
Q1 FY2018 (year-on-year) Sales: Essentially flat (FX Impact: -2.9 bln yen)
·(--) Absence of insurance recoveries related to the Kumamoto Earthquakes recorded in Q1 FY17 (6.7 bln yen)
·(--) Decrease in sales of camera modules, a business which was downsized·(+) Increase in sales of image sensors for mobile products
OI: 26.3 bln yen significant decrease (FX Impact: -2.3 bln yen)·(--) Absence of the gain resulting from the sale of the entire equity interest in a
manufacturing subsidiary in the camera module business in Q1 FY17 (27.5 bln yen)
·(--) Absence of insurance recoveries related to the Kumamoto Earthquakes recorded in Q1 FY17 (6.7 bln yen)
·(--) Increase in depreciation and amortization expenses as well as in research and development expenses
·(+) Increase in sales of image sensors for mobile products
FY2018 Forecast (change from April forecast)
Sales: 20 bln yen (2%) upward revision·(+) Impact of foreign exchange rates
OI: 20 bln yen upward revision·(+) Positive impact of foreign exchange rates
Sales and Operating Income
FY17FY18
April FCTFY18
July FCT
Image Sensors Sales 649.4 690 720
Additions to long-lived assets for Semiconductors Segmentfor Image Sensors (included above)
128.1
106.6
160
130
160
130
850.0 870 890
164.0
100120
204.3 202.2
55.4
29.1
(Bln Yen)Sales
Operating Income
Next, I will talk about the Semiconductors segment. FY18 Q1 sales were essentially flat year-on-year at 202.2 billion yen. Although insurance recoveries related to the Kumamoto Earthquakes were recorded in the same quarter of the previous fiscal year, sales of image sensors primarily for mobile devices increased. Operating income decreased 26.3 billion yen year-on-year to 29.1 billion yen.
20

OperatingIncome
Adjusted Operating
IncomeAdjusted Operating Income excludes the following items*
Q1 FY17 55.4 bln yen 21.2 bln yen
Gain resulting from the sale of the entire equity interest in a manufacturing subsidiary in the camera module business (+27.5 bln yen)
Insurance recoveries related to the Kumamoto Earthquakes (+6.7 bln yen)
Q1 FY18 29.1 bln yen 29.1 bln yen
Change fromFY17 -26.3 bln yen +7.9 bln yen
Semiconductors Segment Adjusted Operating Income
Adjusted operating income is not a measure in accordance with U.S. GAAP. However, Sony believes that this disclosure may be useful information to investors.
* These monetary amounts are disclosed in the Quarterly Financial Statements, the Presentation Slides and the Quarterly Securities Reports for the relevant quarters
As is shown in this slide, several extraordinary items were contained in the same quarter of the previous fiscal year. Excluding these items, adjusted operating income would have increased 7.9 billion yen. This increase was primarily due to the increase in sales of image sensors for mobile devices.
21

Q1 FY17 Q1 FY18
Image Sensors Sales 148.8 161.5
Semiconductors Segment
Q1 FY2018 (year-on-year) Sales: Essentially flat (FX Impact: -2.9 bln yen)
·(--) Absence of insurance recoveries related to the Kumamoto Earthquakes recorded in Q1 FY17 (6.7 bln yen)
·(--) Decrease in sales of camera modules, a business which was downsized·(+) Increase in sales of image sensors for mobile products
OI: 26.3 bln yen significant decrease (FX Impact: -2.3 bln yen)·(--) Absence of the gain resulting from the sale of the entire equity interest in a
manufacturing subsidiary in the camera module business in Q1 FY17 (27.5 bln yen)
·(--) Absence of insurance recoveries related to the Kumamoto Earthquakes recorded in Q1 FY17 (6.7 bln yen)
·(--) Increase in depreciation and amortization expenses as well as in research and development expenses
·(+) Increase in sales of image sensors for mobile products
FY2018 Forecast (change from April forecast)
Sales: 20 bln yen (2%) upward revision·(+) Impact of foreign exchange rates
OI: 20 bln yen upward revision·(+) Positive impact of foreign exchange rates
Sales and Operating Income
FY17FY18
April FCTFY18
July FCT
Image Sensors Sales 649.4 690 720
Additions to long-lived assets for Semiconductors Segmentfor Image Sensors (included above)
128.1
106.6
160
130
160
130
850.0 870 890
164.0
100120
204.3 202.2
55.4
29.1
(Bln Yen)Sales
Operating Income
We have upwardly revised our FY18 sales forecast to 890 billion yen and operating income to 120 billion yen. This change is primarily due to the positive impact of foreign exchange rates.
22
Stacked CMOS Image Sensor for Smartphones
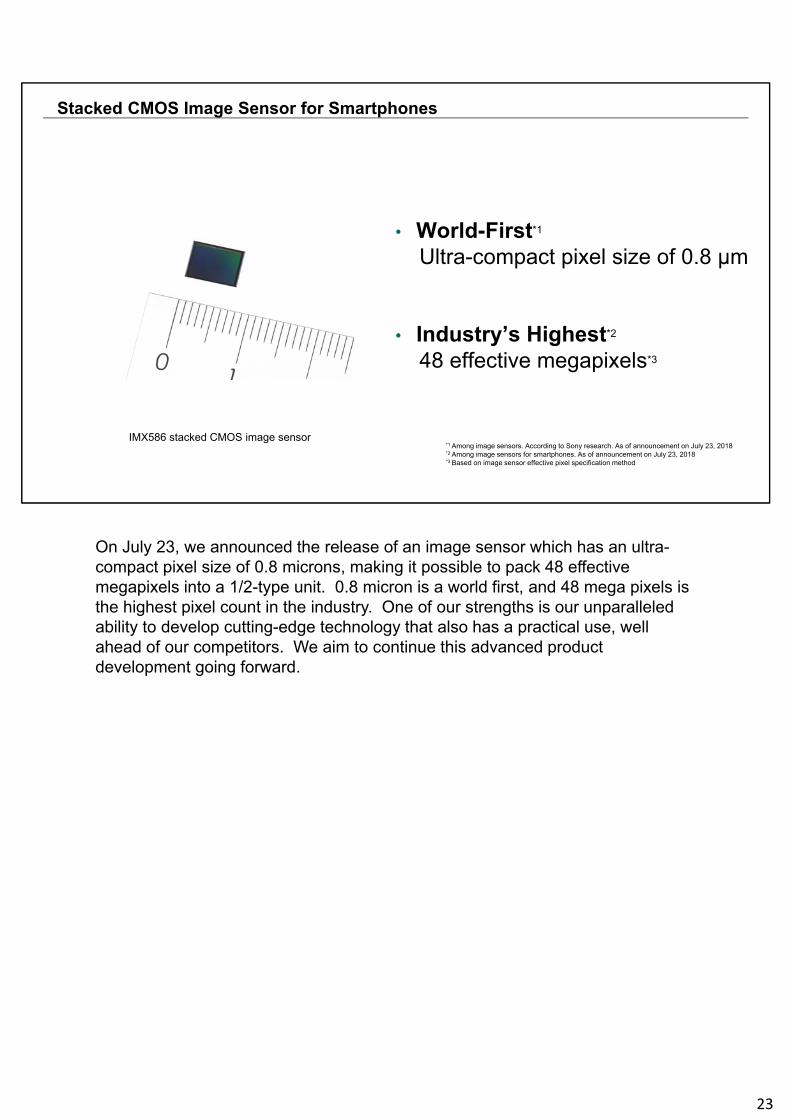
• World-First*1
Ultra-compact pixel size of 0.8 μm
• Industry’s Highest*2
48 effective megapixels*3
IMX586 stacked CMOS image sensor*1 Among image sensors. According to Sony research. As of announcement on July 23, 2018*2 Among image sensors for smartphones. As of announcement on July 23, 2018*3 Based on image sensor effective pixel specification method
On July 23, we announced the release of an image sensor which has an ultra-compact pixel size of 0.8 microns, making it possible to pack 48 effective megapixels into a 1/2-type unit. 0.8 micron is a world first, and 48 mega pixels is the highest pixel count in the industry. One of our strengths is our unparalleled ability to develop cutting-edge technology that also has a practical use, well ahead of our competitors. We aim to continue this advanced product development going forward.
23

Financial Services Segment
Q1 FY2018 (year-on-year)
Revenue: 32.0 bln yen (11%) significant increase· (+) Significant increase in revenue at Sony Life
(31.1 bln yen increase, revenue: 301.5 bln yen) ·(+) Higher insurance premium revenue reflecting an increase in
the policy amount in force
OI: 5.6 bln yen decrease· (--) Decrease in OI at Sony Life (2.7 bln yen decrease, OI: 36.4 bln yen)
・(--) Increase in operating expenses・(--) Recording of a loss on the valuation of securities investments in
the general account· (--) Foreign exchange loss incurred at Sony Bank on foreign currency-
denominated customer deposits compared to a gain in Q1 FY17
FY2018 Forecast
Revenue / OI : Remain unchanged from April forecast
Financial Services Revenue and Operating Income
1,228.4 1,270 1,270
178.9 170 170
Q1 FY17 Q1 FY18
FY17FY18
April FCTFY18
July FCT
303.2335.2
46.2 40.6
(Bln Yen)Financial Services Revenue
Operating Income
Next, I will explain the Financial Services segment. In FY18 Q1, Financial Services revenue increased 11% year-on-year to 335.2 billion yen, primarily due to an increase in the policy amount in force at Sony Life. Operating income decreased 5.6 billion yen to 40.6 billion yen. This decrease was primarily due to an increase in operating expenses and the recording of a valuation loss on investment securities in the general account at Sony Life, as well as a change from a foreign exchange gain on foreign-currency denominated customer deposits at Sony Bank in the same quarter of the previous fiscal year to a foreign exchange loss in the current quarter.
The FY18 forecast remains unchanged from April.
24

FY2018 Results Forecast by Segment
FY17FY18
April FCT
FY18July FCT
Change from April FCT
Game & Network Services (G&NS)
Sales 1,943.8 1,900 2,180 +280Operating income 177.5 190 250 +60
MusicSales 800.0 750 760 +10Operating income 127.8 112 115 +3
PicturesSales 1,011.1 960 990 +30Operating income 41.1 42 44 +2
Home Entertainment &Sound (HE&S)
Sales 1,222.7 1,150 1,150 -Operating income 85.8 86 86 -
Imaging Products &Solutions (IP&S)
Sales 655.9 660 670 +10Operating income 74.9 75 78 +3
Mobile Communications(MC)
Sales 723.7 640 610 -30Operating income -27.6 -15 -30 -15
SemiconductorsSales 850.0 870 890 +20Operating income 164.0 100 120 +20
Financial ServicesRevenue 1,228.4 1,270 1,270 -Operating income 178.9 170 170 -
All Other,Corporate and elimination Operating income -87.6 -90 -163 -73
Consolidated totalSales 8,544.0 8,300 8,600 +300Operating income 734.9 670 670 -
(Bln Yen)
Lastly, I will show the results on a segment basis again.
This concludes my remarks.
25

Cautionary StatementStatements made in this release with respect to Sony’s current plans, estimates, strategies and beliefs and other statements that are not historical facts are forward-looking statements
about the future performance of Sony. Forward-looking statements include, but are not limited to, those statements using words such as “believe,” “expect,” “plans,” “strategy,” “prospects,” “forecast,” “estimate,” “project,” “anticipate,” “aim,” “intend,” “seek,” “may,” “might,” “could” or “should,” and words of similar meaning in connection with a discussion of future operations, financial performance, events or conditions. From time to time, oral or written forward-looking statements may also be included in other materials released to the public. These statements are based on management’s assumptions, judgments and beliefs in light of the information currently available to it. Sony cautions investors that a number of important risks and uncertainties could cause actual results to differ materially from those discussed in the forward-looking statements, and therefore investors should not place undue reliance on them. Investors also should not rely on any obligation of Sony to update or revise any forward-looking statements, whether as a result of new information, future events or otherwise. Sony disclaims any such obligation. Risks and uncertainties that might affect Sony include, but are not limited to:
(i) Sony’s ability to maintain product quality and customer satisfaction with its products and services; (ii) Sony’s ability to continue to design and develop and win acceptance of, as well as achieve sufficient cost reductions for, its products and services, including image sensors,
game and network platforms, smartphones and televisions, which are offered in highly competitive markets characterized by severe price competition and continual new product and service introductions, rapid development in technology and subjective and changing customer preferences;
(iii) Sony’s ability to implement successful hardware, software, and content integration strategies, and to develop and implement successful sales and distribution strategies in light of new technologies and distribution platforms;
(iv) the effectiveness of Sony’s strategies and their execution, including but not limited to the success of Sony’s acquisitions, joint ventures, investments, capital expenditures, restructurings and other strategic initiatives;
(v) changes in laws, regulations and government policies in the markets in which Sony and its third-party suppliers, service providers and business partners operate, including those related to taxation, as well as growing consumer focus on corporate social responsibility;
(vi) Sony’s continued ability to identify the products, services and market trends with significant growth potential, to devote sufficient resources to research and development, to prioritize investments and capital expenditures correctly and to recoup its investments and capital expenditures, including those required for technology development and product capacity;
(vii) Sony’s reliance on external business partners, including for the procurement of parts, components, software and network services for its products or services, the manufacturing, marketing and distribution of its products, and its other business operations;
(viii) the global economic and political environment in which Sony operates and the economic and political conditions in Sony’s markets, particularly levels of consumer spending;(ix) Sony’s ability to meet operational and liquidity needs as a result of significant volatility and disruption in the global financial markets or a ratings downgrade;(x) Sony’s ability to forecast demands, manage timely procurement and control inventories; (xi) foreign exchange rates, particularly between the yen and the U.S. dollar, the euro and other currencies in which Sony makes significant sales and incurs production costs, or
in which Sony’s assets, liabilities and operating results are denominated; (xii) Sony’s ability to recruit, retain and maintain productive relations with highly skilled personnel;(xiii) Sony’s ability to prevent unauthorized use or theft of intellectual property rights, to obtain or renew licenses relating to intellectual property rights and to defend itself against
claims that its products or services infringe the intellectual property rights owned by others;(xiv) the impact of changes in interest rates and unfavorable conditions or developments (including market fluctuations or volatility) in the Japanese equity markets on the revenue
and operating income of the Financial Services segment;(xv) shifts in customer demand for financial services such as life insurance and Sony’s ability to conduct successful asset liability management in the Financial Services segment;(xvi) risks related to catastrophic disasters or similar events;(xvii) the ability of Sony, its third-party service providers or business partners to anticipate and manage cybersecurity risk, including the risk of unauthorized access to Sony’s
business information and the personally identifiable information of its employees and customers, potential business disruptions or financial losses; and(xviii) the outcome of pending and/or future legal and/or regulatory proceedings.
Risks and uncertainties also include the impact of any future events with material adverse impact. Important information regarding risks and uncertainties is also set forth in Sony’s most recent Form 20-F, which is on file with the U.S. Securities and Exchange Commission.
26