q1 financial presentation 2018 dof asa asa/ir/2018/dof_q1_2018.pdf · plsv. 8 years petrobras ;...
TRANSCRIPT
Q1 Financial Presentation 2018
DOF ASA
2DOF ASA – Q1 presentation 2018
Highlights Group
DOF ASA – Q1 presentation 2018 3
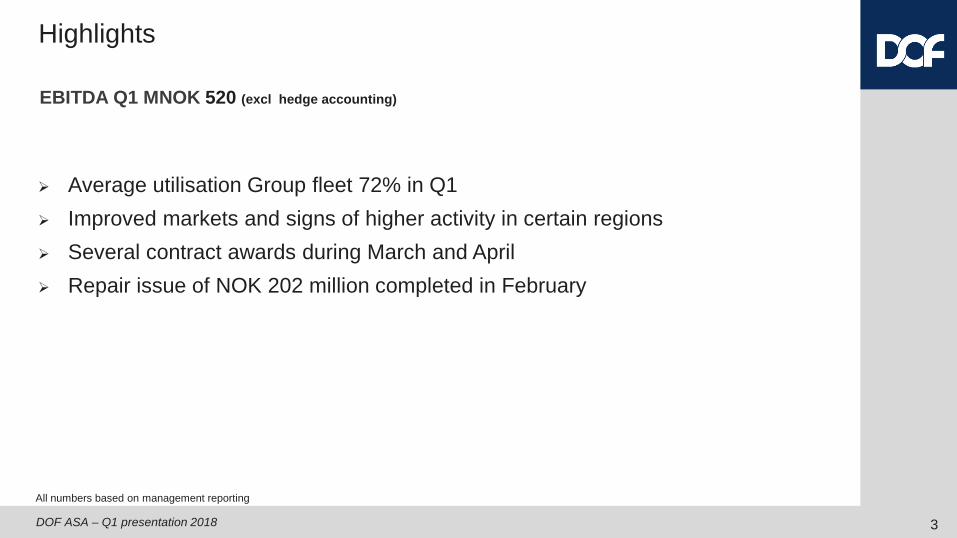
Average utilisation Group fleet 72% in Q1 Improved markets and signs of higher activity in certain regions Several contract awards during March and April Repair issue of NOK 202 million completed in February
All numbers based on management reporting
EBITDA Q1 MNOK 520 (excl hedge accounting)
Highlights
DOF ASA – Q1 presentation 2018
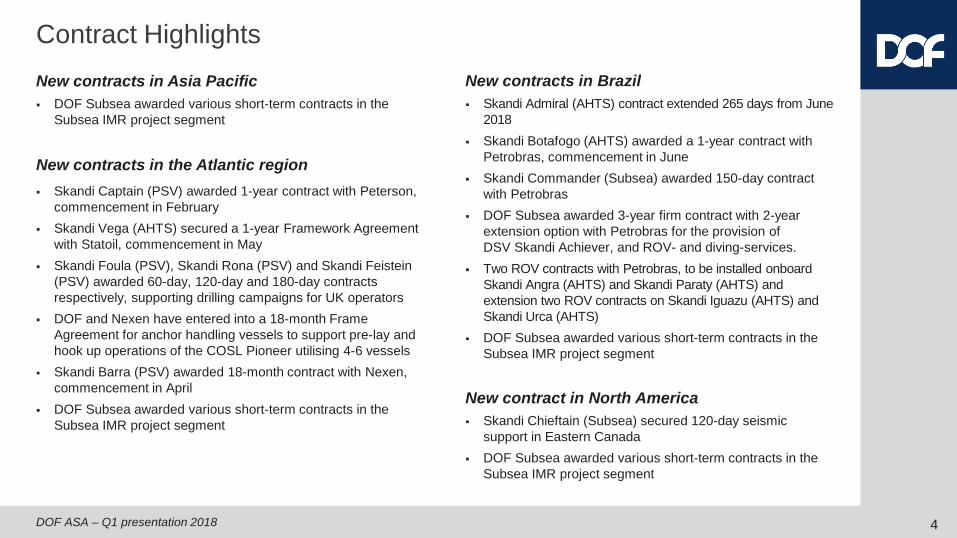
Contract Highlights
4
New contracts in Asia Pacific DOF Subsea awarded various short-term contracts in the
Subsea IMR project segment
New contracts in the Atlantic region Skandi Captain (PSV) awarded 1-year contract with Peterson,
commencement in February Skandi Vega (AHTS) secured a 1-year Framework Agreement
with Statoil, commencement in May Skandi Foula (PSV), Skandi Rona (PSV) and Skandi Feistein
(PSV) awarded 60-day, 120-day and 180-day contracts respectively, supporting drilling campaigns for UK operators
DOF and Nexen have entered into a 18-month Frame Agreement for anchor handling vessels to support pre-lay and hook up operations of the COSL Pioneer utilising 4-6 vessels
Skandi Barra (PSV) awarded 18-month contract with Nexen, commencement in April
DOF Subsea awarded various short-term contracts in the Subsea IMR project segment
New contracts in Brazil Skandi Admiral (AHTS) contract extended 265 days from June
2018 Skandi Botafogo (AHTS) awarded a 1-year contract with
Petrobras, commencement in June Skandi Commander (Subsea) awarded 150-day contract
with Petrobras DOF Subsea awarded 3-year firm contract with 2-year
extension option with Petrobras for the provision of DSV Skandi Achiever, and ROV- and diving-services.
Two ROV contracts with Petrobras, to be installed onboard Skandi Angra (AHTS) and Skandi Paraty (AHTS) and extension two ROV contracts on Skandi Iguazu (AHTS) and Skandi Urca (AHTS)
DOF Subsea awarded various short-term contracts in the Subsea IMR project segment
New contract in North America Skandi Chieftain (Subsea) secured 120-day seismic
support in Eastern Canada DOF Subsea awarded various short-term contracts in the
Subsea IMR project segment
DOF ASA – Q1 presentation 2018 5
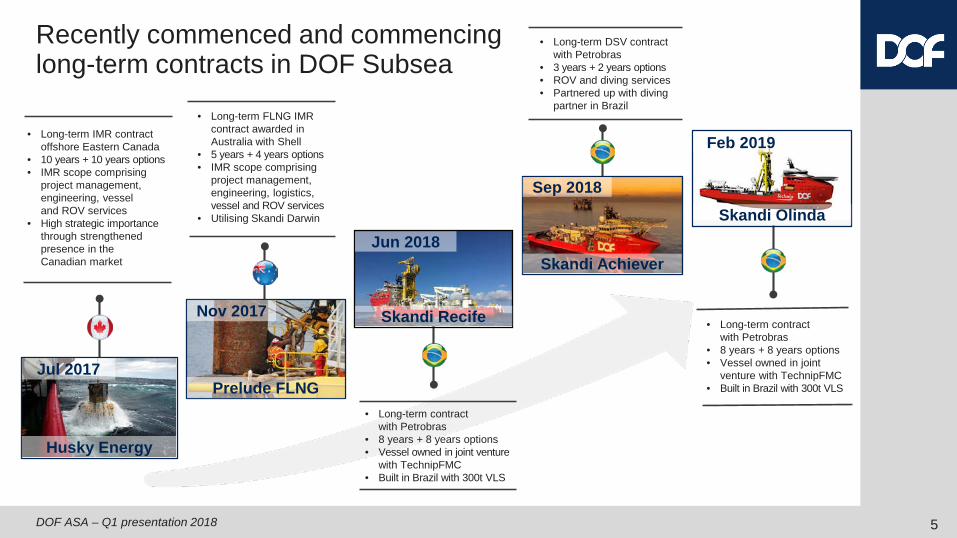
• Long-term FLNG IMR contract awarded in Australia with Shell
• 5 years + 4 years options• IMR scope comprising
project management, engineering, logistics, vessel and ROV services
• Utilising Skandi Darwin
Prelude FLNG
Nov 2017
• Long-term contract with Petrobras
• 8 years + 8 years options• Vessel owned in joint venture
with TechnipFMC• Built in Brazil with 300t VLS
• Long-term DSV contract with Petrobras
• 3 years + 2 years options• ROV and diving services• Partnered up with diving
partner in Brazil
Skandi Recife
Jun 2018Skandi Achiever
Sep 2018
• Long-term contract with Petrobras
• 8 years + 8 years options• Vessel owned in joint
venture with TechnipFMC• Built in Brazil with 300t VLS
Skandi Olinda
Feb 2019• Long-term IMR contract offshore Eastern Canada
• 10 years + 10 years options• IMR scope comprising
project management, engineering, vessel and ROV services
• High strategic importance through strengthened presence in the Canadian market
Husky Energy
Jul 2017
Recently commenced and commencing long-term contracts in DOF Subsea
DOF ASA – Q1 presentation 2018 6
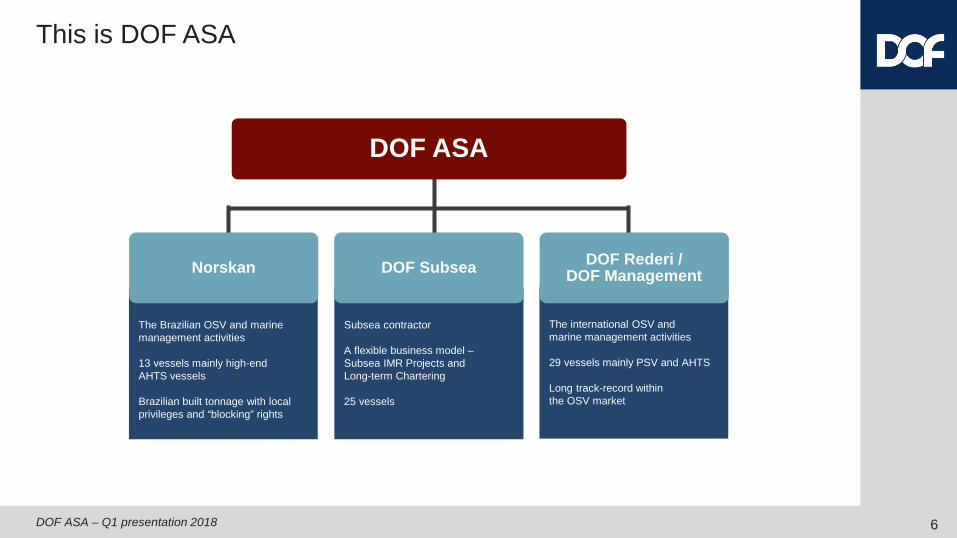
The international OSV and marine management activities
29 vessels mainly PSV and AHTS
Long track-record within the OSV market
Subsea contractor
A flexible business model –Subsea IMR Projects and Long-term Chartering
25 vessels
The Brazilian OSV and marine management activities
13 vessels mainly high-end AHTS vessels
Brazilian built tonnage with local privileges and “blocking” rights
DOF ASA
DOF SubseaNorskan DOF Rederi / DOF Management
This is DOF ASA
DOF ASA – Q1 presentation 2018
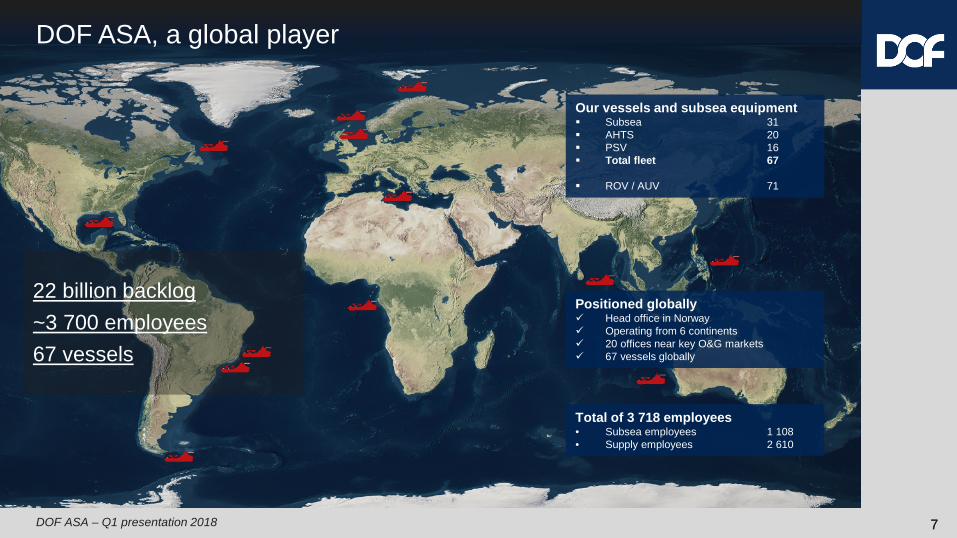
Total of 3 718 employees• Subsea employees 1 108• Supply employees 2 610
Positioned globally Head office in Norway Operating from 6 continents 20 offices near key O&G markets 67 vessels globally
Our vessels and subsea equipment Subsea 31 AHTS 20 PSV 16 Total fleet 67
ROV / AUV 71
DOF ASA, a global player
22 billion backlog~3 700 employees67 vessels
77
DOF ASA – Q1 presentation 2018
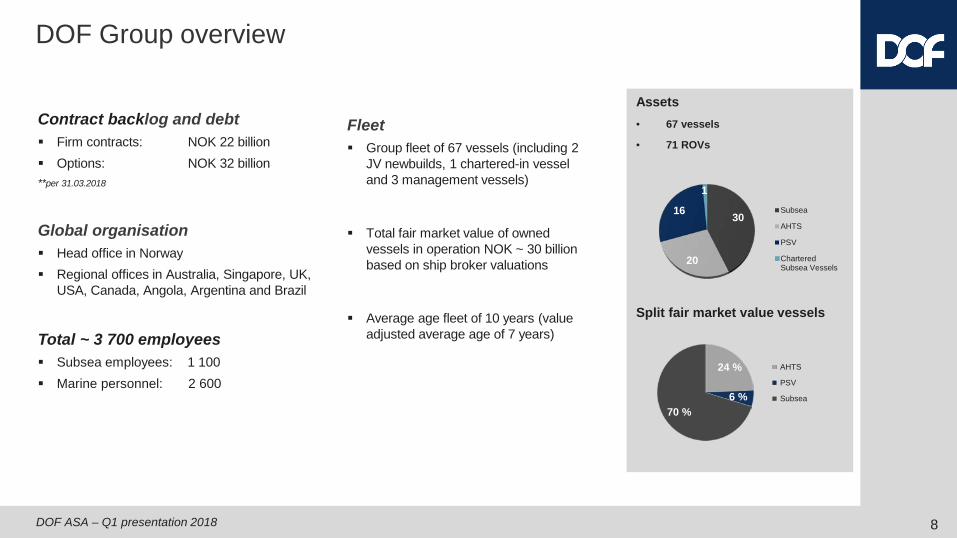
Assets• 67 vessels
• 71 ROVs
Split fair market value vessels
DOF Group overview
Fleet Group fleet of 67 vessels (including 2
JV newbuilds, 1 chartered-in vessel and 3 management vessels)
Total fair market value of owned vessels in operation NOK ~ 30 billion based on ship broker valuations
Average age fleet of 10 years (value adjusted average age of 7 years)
Contract backlog and debt Firm contracts: NOK 22 billion Options: NOK 32 billion**per 31.03.2018
Global organisation Head office in Norway Regional offices in Australia, Singapore, UK,
USA, Canada, Angola, Argentina and Brazil
Total ~ 3 700 employees Subsea employees: 1 100 Marine personnel: 2 600
30
20
16
1
Subsea
AHTS
PSV
CharteredSubsea Vessels
8
24 %
6 %70 %
AHTS
PSV
Subsea
DOF ASA – Q1 presentation 2018 9
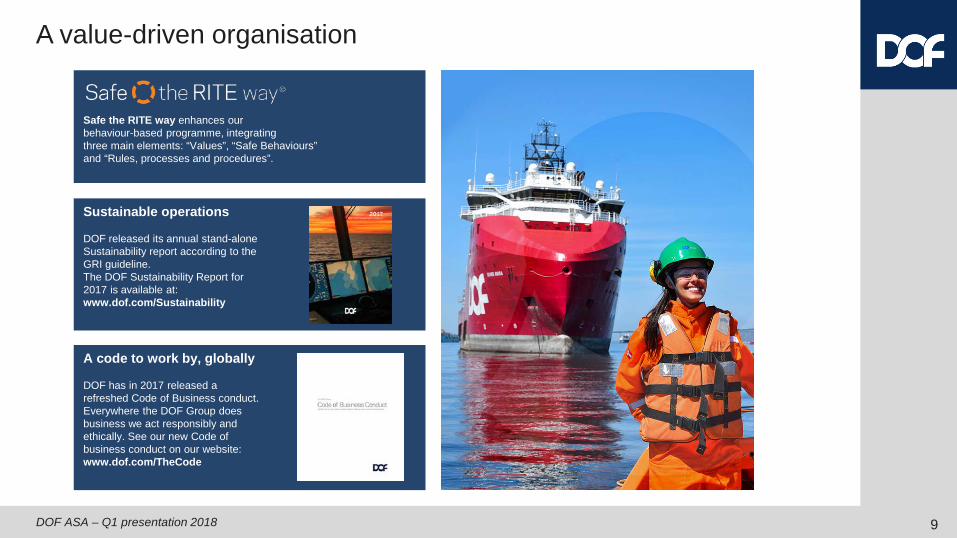
A value-driven organisation
Safe the RITE way enhances our behaviour-based programme, integrating three main elements: “Values”, “Safe Behaviours” and “Rules, processes and procedures”.
A code to work by, globally
DOF has in 2017 released a refreshed Code of Business conduct. Everywhere the DOF Group does business we act responsibly and ethically. See our new Code of business conduct on our website: www.dof.com/TheCode
Sustainable operations
DOF released its annual stand-alone Sustainability report according to the GRI guideline. The DOF Sustainability Report for 2017 is available at: www.dof.com/Sustainability
DOF ASA – Q1 presentation 2018
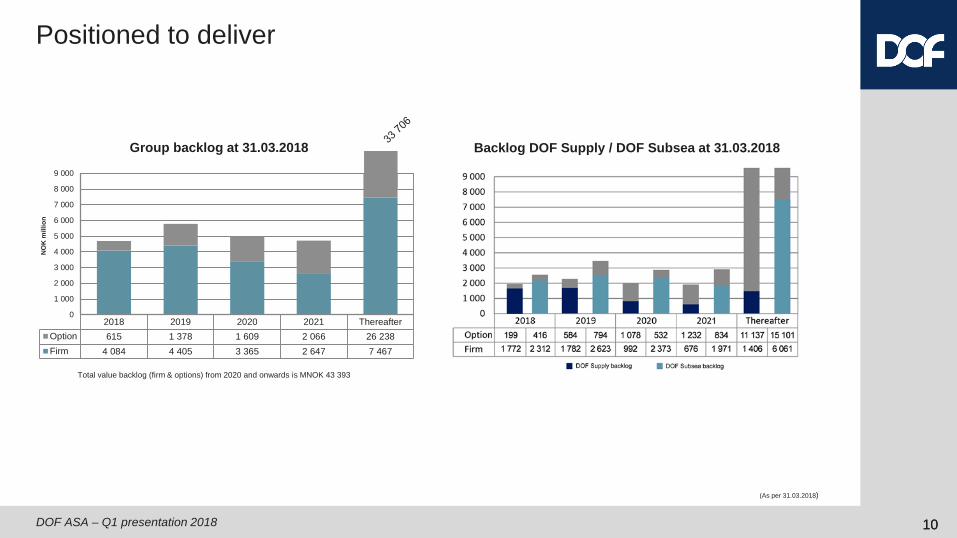
Positioned to deliver
Total value backlog (firm & options) from 2020 and onwards is MNOK 43 393
1010
(As per 31.03.2018)
Group backlog at 31.03.2018 Backlog DOF Supply / DOF Subsea at 31.03.2018
2018 2019 2020 2021 ThereafterOption 615 1 378 1 609 2 066 26 238Firm 4 084 4 405 3 365 2 647 7 467
0
1 000
2 000
3 000
4 000
5 000
6 000
7 000
8 000
9 000
NO
K m
illio
n
DOF ASA – Q1 presentation 2018
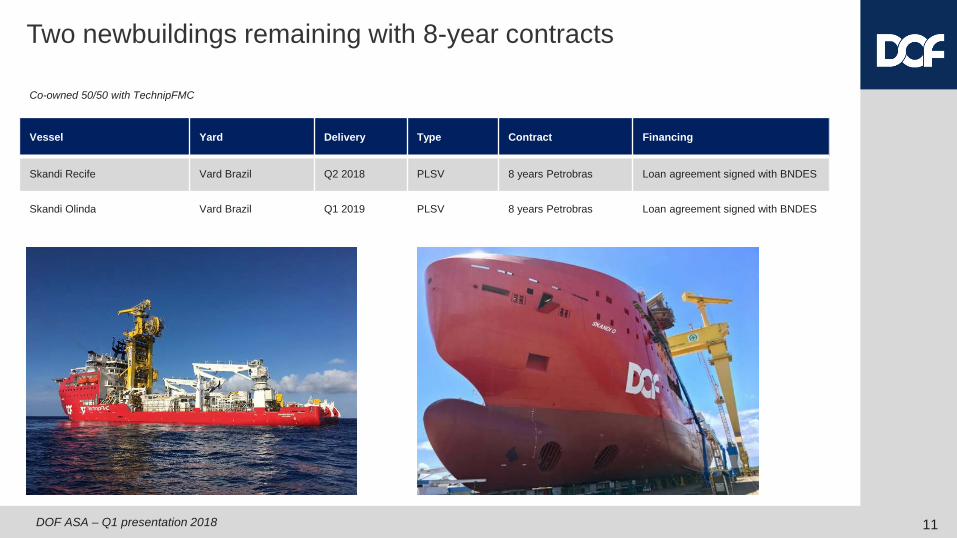
Vessel Yard Delivery Type Contract Financing
Skandi Recife Vard Brazil Q2 2018 PLSV 8 years Petrobras Loan agreement signed with BNDES
Skandi Olinda Vard Brazil Q1 2019 PLSV 8 years Petrobras Loan agreement signed with BNDES
Two newbuildings remaining with 8-year contracts
Co-owned 50/50 with TechnipFMC
11
12DOF ASA – Q1 presentation 2018
FinancialsManagement Reporting
DOF ASA – Q1 presentation 2018 13
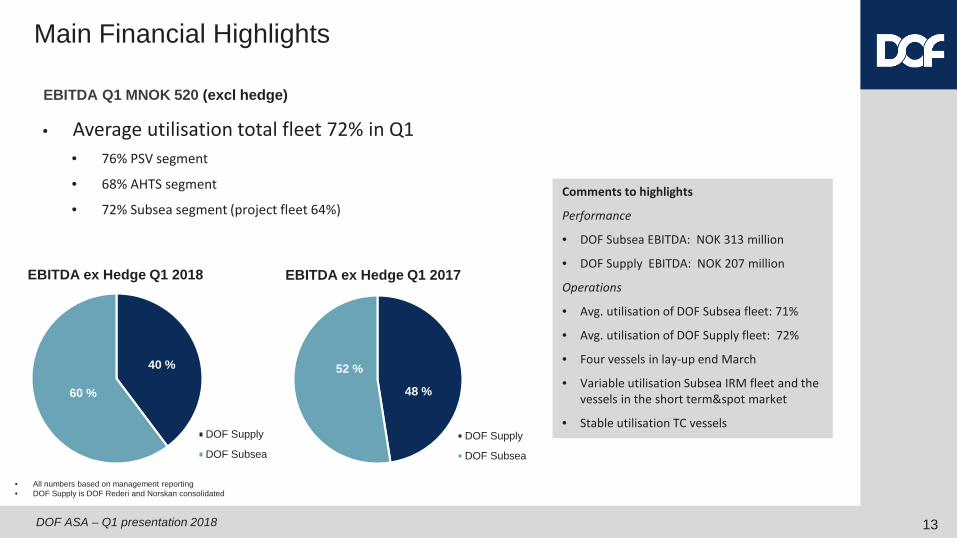
• Average utilisation total fleet 72% in Q1• 76% PSV segment
• 68% AHTS segment
• 72% Subsea segment (project fleet 64%)
• All numbers based on management reporting• DOF Supply is DOF Rederi and Norskan consolidated
EBITDA Q1 MNOK 520 (excl hedge)
Main Financial Highlights
Comments to highlights
Performance
• DOF Subsea EBITDA: NOK 313 million
• DOF Supply EBITDA: NOK 207 million
Operations
• Avg. utilisation of DOF Subsea fleet: 71%
• Avg. utilisation of DOF Supply fleet: 72%
• Four vessels in lay-up end March
• Variable utilisation Subsea IRM fleet and thevessels in the short term&spot market
• Stable utilisation TC vessels
40 %
60 %
EBITDA ex Hedge Q1 2018
DOF Supply
DOF Subsea
48 %
52 %
EBITDA ex Hedge Q1 2017
DOF Supply
DOF Subsea
DOF ASA – Q1 presentation 2018
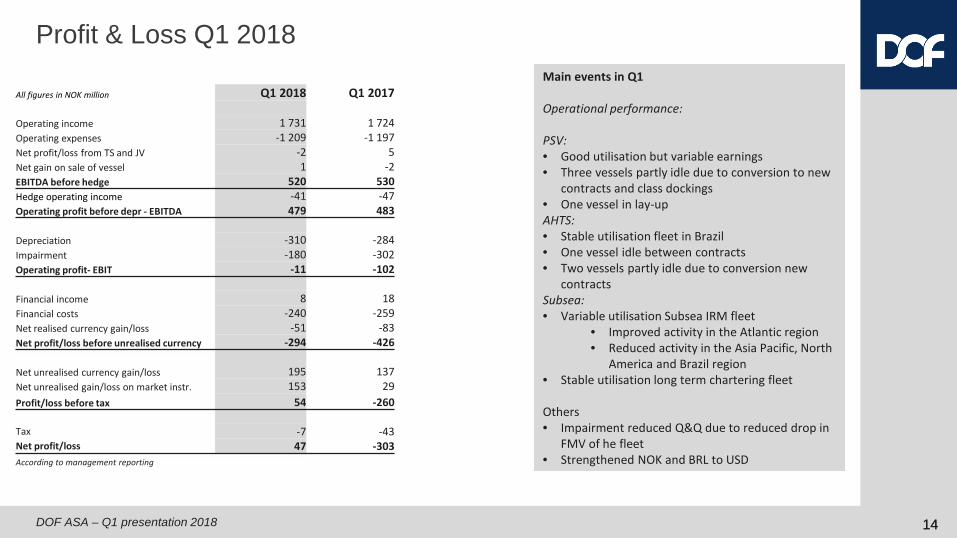
Profit & Loss Q1 2018Main events in Q1
Operational performance:
PSV:• Good utilisation but variable earnings• Three vessels partly idle due to conversion to new
contracts and class dockings• One vessel in lay-upAHTS:• Stable utilisation fleet in Brazil • One vessel idle between contracts• Two vessels partly idle due to conversion new
contractsSubsea:• Variable utilisation Subsea IRM fleet
• Improved activity in the Atlantic region• Reduced activity in the Asia Pacific, North
America and Brazil region• Stable utilisation long term chartering fleet
Others• Impairment reduced Q&Q due to reduced drop in
FMV of he fleet• Strengthened NOK and BRL to USD
1414
All figures in NOK million Q1 2018 Q1 2017
Operating income 1 731 1 724 Operating expenses -1 209 -1 197 Net profit/loss from TS and JV -2 5 Net gain on sale of vessel 1 -2 EBITDA before hedge 520 530 Hedge operating income -41 -47 Operating profit before depr - EBITDA 479 483
Depreciation -310 -284 Impairment -180 -302 Operating profit- EBIT -11 -102
Financial income 8 18 Financial costs -240 -259 Net realised currency gain/loss -51 -83 Net profit/loss before unrealised currency -294 -426
Net unrealised currency gain/loss 195 137 Net unrealised gain/loss on market instr. 153 29 Profit/loss before tax 54 -260
Tax -7 -43 Net profit/loss 47 -303 According to management reporting
DOF ASA – Q1 presentation 2018
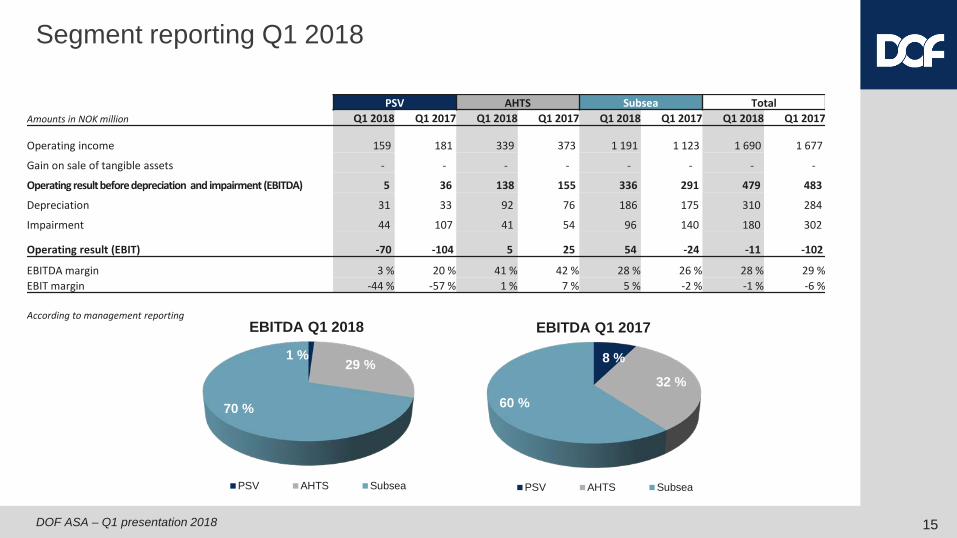
Segment reporting Q1 2018
PSV AHTS Subsea TotalAmounts in NOK million Q1 2018 Q1 2017 Q1 2018 Q1 2017 Q1 2018 Q1 2017 Q1 2018 Q1 2017
Operating income 159 181 339 373 1 191 1 123 1 690 1 677
Gain on sale of tangible assets - - - - - - - -
Operating result before depreciation and impairment (EBITDA) 5 36 138 155 336 291 479 483
Depreciation 31 33 92 76 186 175 310 284
Impairment 44 107 41 54 96 140 180 302
Operating result (EBIT) -70 -104 5 25 54 -24 -11 -102
EBITDA margin 3 % 20 % 41 % 42 % 28 % 26 % 28 % 29 %EBIT margin -44 % -57 % 1 % 7 % 5 % -2 % -1 % -6 %
According to management reporting
15
1 %29 %
70 %
EBITDA Q1 2018
PSV AHTS Subsea
8 %
32 %60 %
EBITDA Q1 2017
PSV AHTS Subsea
DOF ASA – Q1 presentation 2018
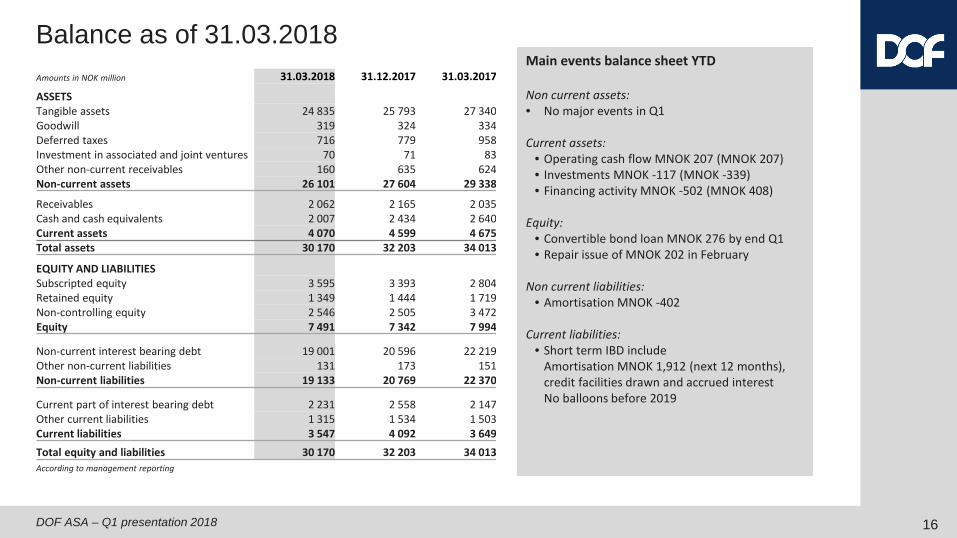
Balance as of 31.03.2018Main events balance sheet YTD
Non current assets:• No major events in Q1
Current assets:• Operating cash flow MNOK 207 (MNOK 207)• Investments MNOK -117 (MNOK -339)• Financing activity MNOK -502 (MNOK 408)
Equity:• Convertible bond loan MNOK 276 by end Q1• Repair issue of MNOK 202 in February
Non current liabilities:• Amortisation MNOK -402
Current liabilities:• Short term IBD include
Amortisation MNOK 1,912 (next 12 months), credit facilities drawn and accrued interestNo balloons before 2019
16
Amounts in NOK million 31.03.2018 31.12.2017 31.03.2017
ASSETSTangible assets 24 835 25 793 27 340Goodwill 319 324 334Deferred taxes 716 779 958Investment in associated and joint ventures 70 71 83Other non-current receivables 160 635 624Non-current assets 26 101 27 604 29 338
Receivables 2 062 2 165 2 035Cash and cash equivalents 2 007 2 434 2 640Current assets 4 070 4 599 4 675Total assets 30 170 32 203 34 013
EQUITY AND LIABILITIESSubscripted equity 3 595 3 393 2 804Retained equity 1 349 1 444 1 719Non-controlling equity 2 546 2 505 3 472Equity 7 491 7 342 7 994
Non-current interest bearing debt 19 001 20 596 22 219Other non-current liabilities 131 173 151Non-current liabilities 19 133 20 769 22 370
Current part of interest bearing debt 2 231 2 558 2 147Other current liabilities 1 315 1 534 1 503Current liabilities 3 547 4 092 3 649Total equity and liabilities 30 170 32 203 34 013According to management reporting
DOF ASA – Q1 presentation 2018 17
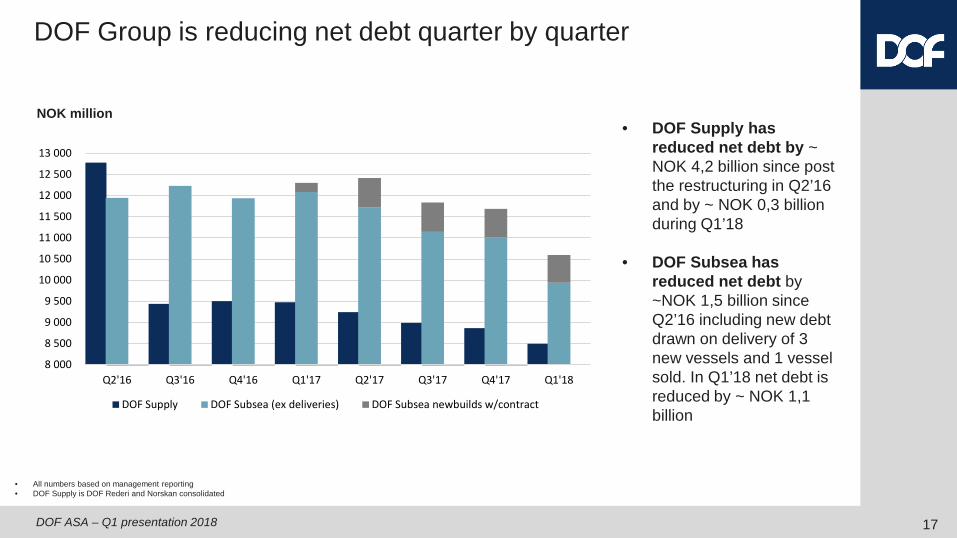
• All numbers based on management reporting• DOF Supply is DOF Rederi and Norskan consolidated
DOF Group is reducing net debt quarter by quarter
NOK million• DOF Supply has
reduced net debt by ~ NOK 4,2 billion since post the restructuring in Q2’16 and by ~ NOK 0,3 billion during Q1’18
• DOF Subsea has reduced net debt by ~NOK 1,5 billion sinceQ2’16 including new debtdrawn on delivery of 3 new vessels and 1 vesselsold. In Q1’18 net debt is reduced by ~ NOK 1,1 billion
8 000
8 500
9 000
9 500
10 000
10 500
11 000
11 500
12 000
12 500
13 000
Q2'16 Q3'16 Q4'16 Q1'17 Q2'17 Q3'17 Q4'17 Q1'18
DOF Supply DOF Subsea (ex deliveries) DOF Subsea newbuilds w/contract
DOF ASA – Q1 presentation 2018
No change in guidance for 2018 (MNOK 2 400 – MNOK 2 800)
Ebitda Q2 expected to be slightly better than Q1
Skandi Recife expected to be on-hire in June
Increased tendering activity
Mixed activity in the regions
Outlook
18
Thank youPresented by Mons Aase - CEOHilde Drønen - CFO
DOF ASA – Q1 presentation 2018
DISCLAIMER
This presentation by DOF ASA designed to provide a high level overview of aspects of the operations of the DOF ASA Group.The material set out in the presentation is current as at 9 May 2018.This presentation contains forward-looking statements relating to operations of the DOF ASA Group that are based on management’s owncurrent expectations, estimates and projections about matters relevant to DOF ASA‘s future financial performance. Words such as “likely”,“aims”, “looking forward”, “potential”, “anticipates”, “expects”, “predicts”, “plans”, “targets”, “believes” and “estimates” and similarexpressions are intended to identify forward-looking statements.References in the presentation to assumptions, estimates and outcomes and forward-looking statements about assumptions, estimatesand outcomes, which are based on internal business data and external sources, are uncertain given the nature of the industry, businessrisks, and other factors. Also, they may be affected by internal and external factors that may have a material effect on future businessperformance and results.No assurance or guarantee is, or should be taken to be, given in relation to the future business performance or results of the DOF ASAGroup or the likelihood that the assumptions, estimates or outcomes will be achieved.While management has taken every effort to ensure the accuracy of the material in the presentation, the presentation is provided forinformation only. DOF ASA , its officers and management exclude and disclaim any liability in respect of anything done in reliance on thepresentation.All forward-looking statements made in this presentation are based on information presently available to management and DOF ASAassumes no obligation to update any forward looking- statements. Nothing in this presentation constitutes investment advice and thispresentation shall not constitute an offer to sell or the solicitation of any offer to buy any securities or otherwise engage in any investmentactivity.You should make your own enquiries and take your own advice (including financial and legal advice) before making an investment in thecompany's shares or in making a decision to hold or sell your shares.
20