q1 2016 results conference call & webcast
TRANSCRIPT
1www.kinross.com
1
KINROSS GOLD CORPORATIONQ1 2016 Results Conference Call & Webcast
May 11
2016
2www.kinross.com
2
CAUTIONARY STATEMENT ON FORWARD-LOOKING INFORMATION
All statements, other than statements of historical fact, contained or incorporated by reference in or made in giving this presentation and responses to questions, including but not limited to any information as to the future performance of Kinross, constitute “forward looking statements” within the meaning of applicable securities laws, including the provisions of the Securities Act (Ontario) and the provisions for “safe harbour” under the United States Private Securities Litigation Reform Act of 1995 and are based on expectations, estimates and projections as of the date of this presentation. Forward-looking statements contained in this presentation include those statements on slides with, and statements made under, the headings “2016 Production & Cost Outlook”, “Attractive Growth Opportunities”, “Disciplined Capital Allocation”, “Kinross Value Proposition”, “Strong Balance Sheet”, and “Financial Discipline”, and include without limitation statements with respect to our guidance for production, production costs of sales, all-in sustaining cost and capital expenditures, continuous improvement and other cost savings opportunities, as well as references to other possible events include, without limitation, possible events; opportunities; statements with respect to possible events or opportunities; estimates and the realization of such estimates; future development, mining activities, production and growth, including but not limited to cost and timing; success of exploration or development of operations; the future price of gold and silver; currency fluctuations; expected capital requirements; government regulation; and environmental risks. The words “2016E”, “ahead”, “anticipate”, “assumption”, “budget”, “consideration”, “contemplate”, “contingent”, “encouraging”, “enhancing”, “estimate”, “expect”, “explore”, “feasibility”, “flexibility”, “focus”, “forecast”, “forward”, “future”, “guidance”, “initiative”, “indicate”, “intend”, “measures”, “objective”, “on track”, “opportunity”, “outlook”, “phased”, “plan”, “positioned”, “possible”, “potential”, “pre-feasibility”, “priority”, “project”, “proposition”, “risk”, “schedule”, “strategy”, “study”, “target”, “trend”, “upside” or “view”, or variations of or similar such words and phrases or statements that certain actions, events or results may, can, could, would, should, might, indicates, or will be taken, and similar expressions identify forward looking statements. Forward-looking statements are necessarily based upon a number of estimates and assumptions that, while considered reasonable by Kinross as of the date of such statements, are inherently subject to significant business, economic and competitive uncertainties and contingencies. Statements representing management’s financial and other outlook have been prepared solely for purposes of expressing their current views regarding the Company’s financial and other outlook and may not be appropriate for any other purpose. Many of these uncertainties and contingencies can affect, and could cause, Kinross’ actual results to differ materially from those expressed or implied in any forward looking statements made by, or on behalf of, Kinross. There can be no assurance that forward looking statements will prove to be accurate, as actual results and future events could differ materially from those anticipated in such statements. All of the forward looking statements made in this presentation are qualified by these cautionary statements, and those made in our filings with the securities regulators of Canada and the U.S., including but not limited to those cautionary statements made in the “Risk Factors” section of our most recently filed Annual Information Form, the “Risk Analysis” section of our FYE 2015 Management’s Discussion and Analysis, and the “Cautionary Statement on Forward-Looking Information” in our news release dated May 10, 2016, to which readers are referred and which are incorporated by reference in this news release, all of which qualify any and all forward‐looking statements made in this presentation. These factors are not intended to represent a complete list of the factors that could affect Kinross. Kinross disclaims any intention or obligation to update or revise any forward‐looking statements or to explain any material difference between subsequent actual events and such forward‐looking statements, except to the extent required by applicable law.
Other information
Where we say "we", "us", "our", the "Company", or "Kinross" in this presentation, we mean Kinross Gold Corporation and/or one or more or all of its subsidiaries, as may be applicable.
The technical information about the Company’s mineral properties contained in this presentation (other than exploration activities) has been prepared under the supervision of Mr. John Sims, an officer of the Company who is a “qualified person” within the meaning of National Instrument 43-101 (“NI 43-101”). The technical information about the Company’s exploration activities contained in this presentation has been prepared under the supervision of Mr. Sylvain Guerard, an officer of the Company who is a “qualified person” within the meaning of NI 43-101.

3www.kinross.com
3Q1 2016 RESULTS HIGHLIGHTS 3
4www.kinross.com
4
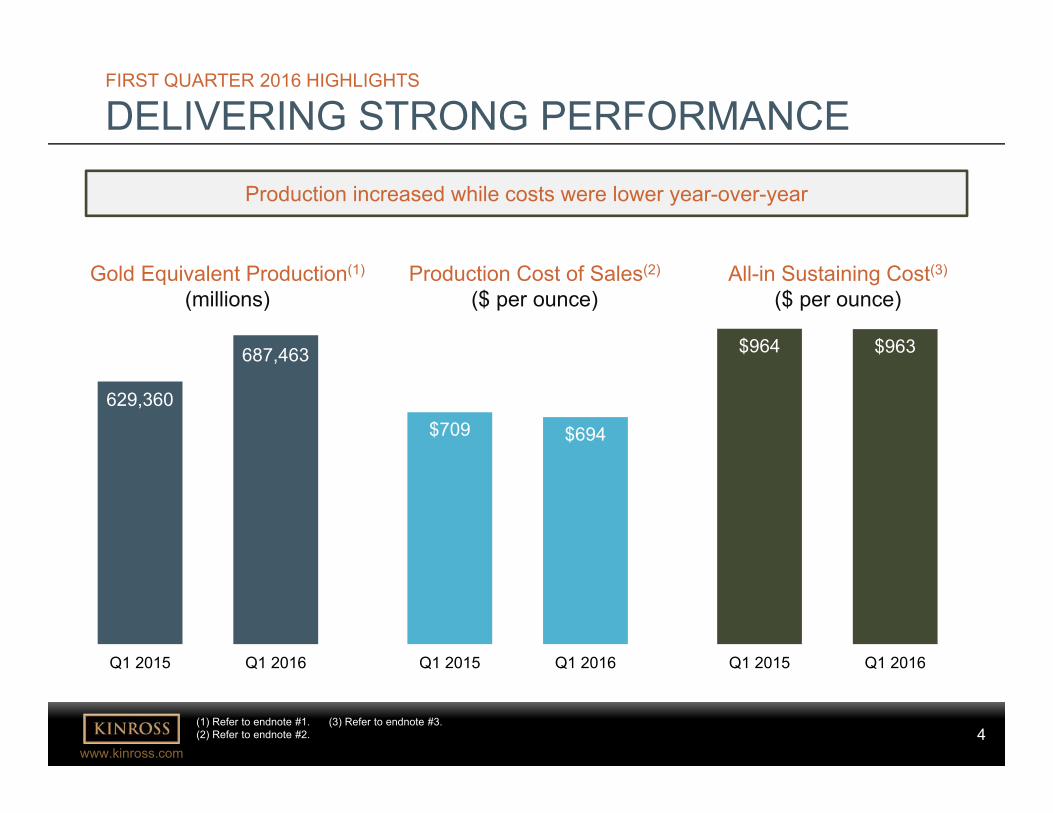
FIRST QUARTER 2016 HIGHLIGHTS
DELIVERING STRONG PERFORMANCE
Production increased while costs were lower year-over-year
Q1 2015 Q1 2016
629,360
687,463
$709 $694
Q1 2015 Q1 2016
$964 $963
Q1 2015 Q1 2016
Gold Equivalent Production(1)
(millions)Production Cost of Sales(2)
($ per ounce)All-in Sustaining Cost(3)
($ per ounce)
(1) Refer to endnote #1.(2) Refer to endnote #2.
(3) Refer to endnote #3.
5www.kinross.com
5
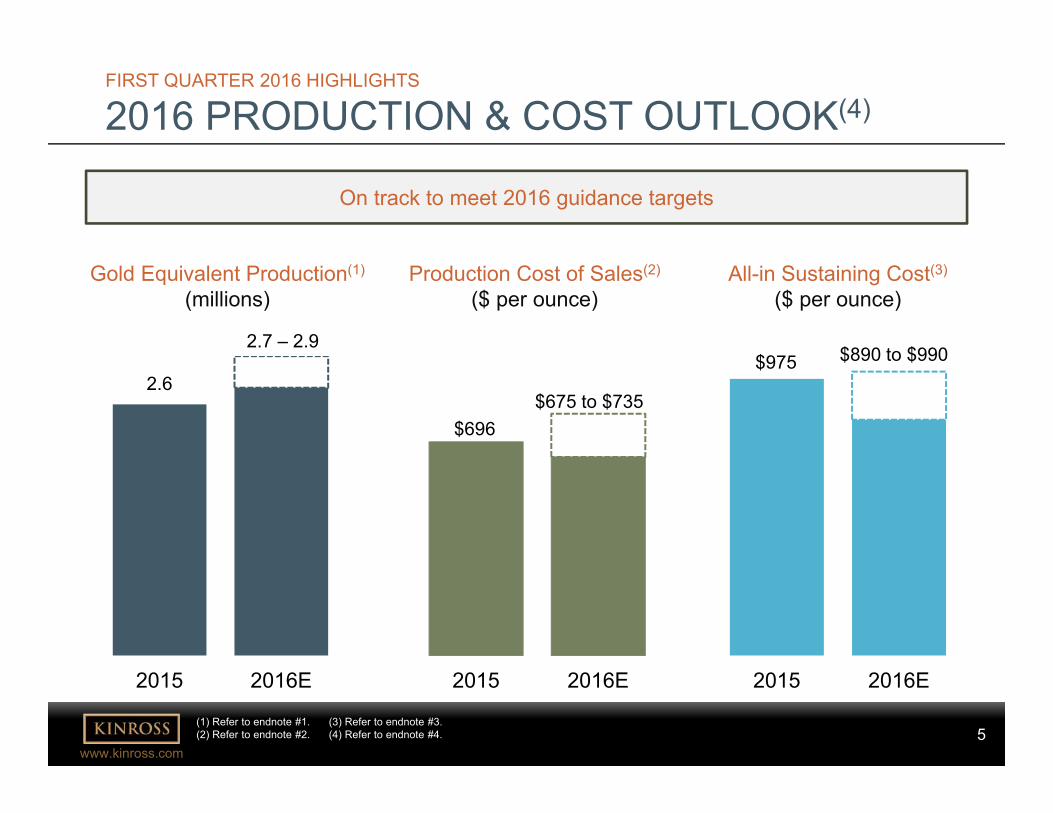
On track to meet 2016 guidance targets
FIRST QUARTER 2016 HIGHLIGHTS
2016 PRODUCTION & COST OUTLOOK(4)
2015 2016E
Gold Equivalent Production(1)
(millions)
2015 2016E
$696$675 to $735
Production Cost of Sales(2)
($ per ounce)All-in Sustaining Cost(3)
($ per ounce)
2015 2016E
$975 $890 to $9902.7 – 2.9
2.6
(1) Refer to endnote #1.(2) Refer to endnote #2.
(3) Refer to endnote #3. (4) Refer to endnote #4.
6www.kinross.com
6
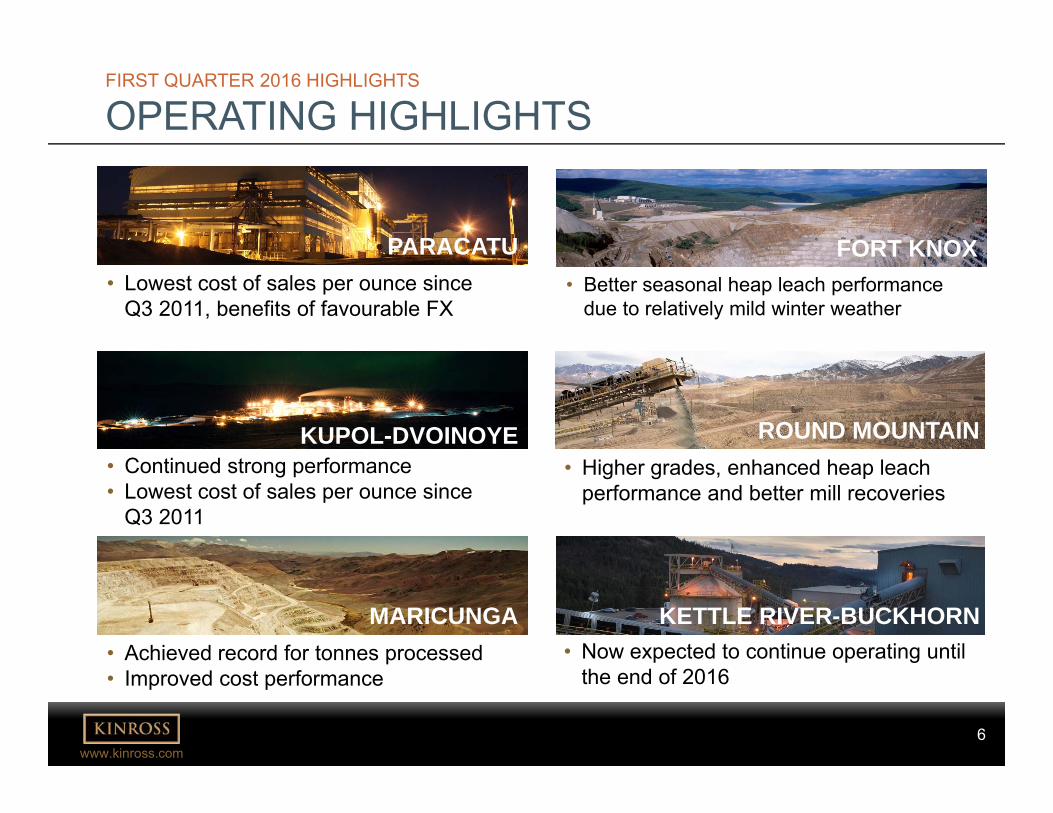
FIRST QUARTER 2016 HIGHLIGHTS
OPERATING HIGHLIGHTS
• Better seasonal heap leach performance due to relatively mild winter weather
FORT KNOX
• Continued strong performance• Lowest cost of sales per ounce since
Q3 2011
KUPOL-DVOINOYE
• Lowest cost of sales per ounce since Q3 2011, benefits of favourable FX
PARACATU
• Higher grades, enhanced heap leach performance and better mill recoveries
ROUND MOUNTAIN
• Now expected to continue operating until the end of 2016
KETTLE RIVER-BUCKHORN• Achieved record for tonnes processed• Improved cost performance
MARICUNGA
7www.kinross.com
7
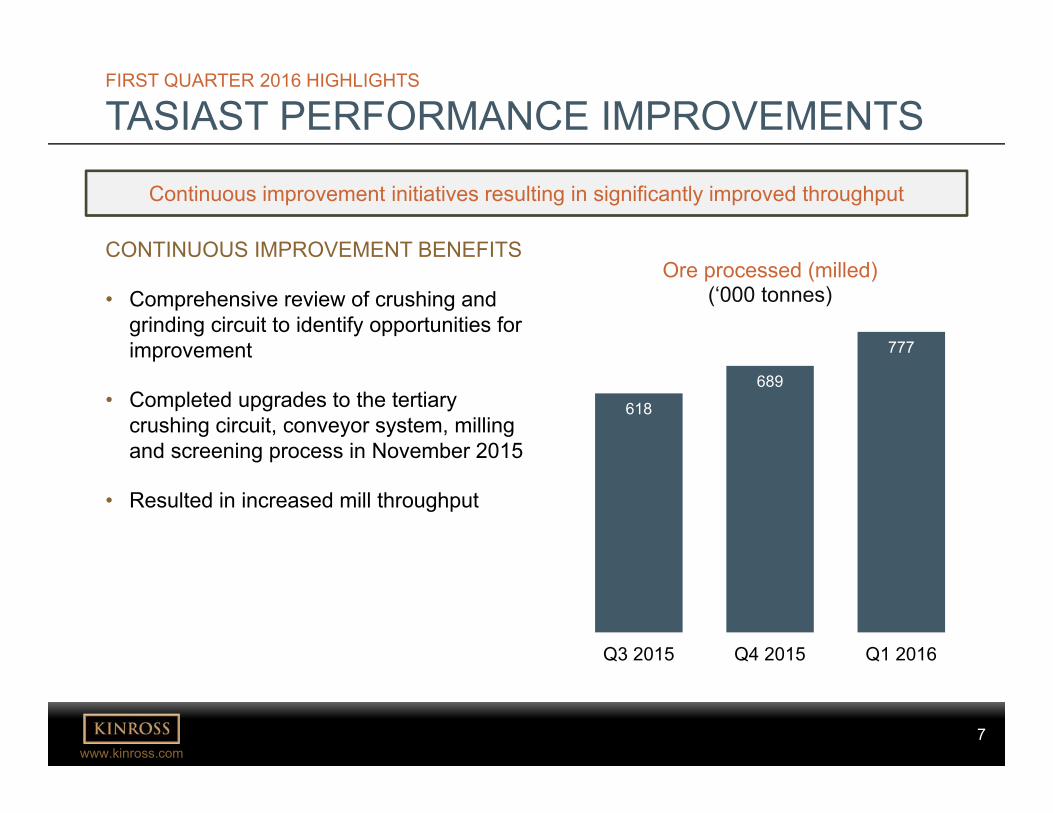
FIRST QUARTER 2016 HIGHLIGHTS
TASIAST PERFORMANCE IMPROVEMENTS
CONTINUOUS IMPROVEMENT BENEFITS
• Comprehensive review of crushing and grinding circuit to identify opportunities for improvement
• Completed upgrades to the tertiary crushing circuit, conveyor system, milling and screening process in November 2015
• Resulted in increased mill throughput
Continuous improvement initiatives resulting in significantly improved throughput
618
689
777
Q3 2015 Q4 2015 Q1 2016
Ore processed (milled)(‘000 tonnes)
8www.kinross.com
8
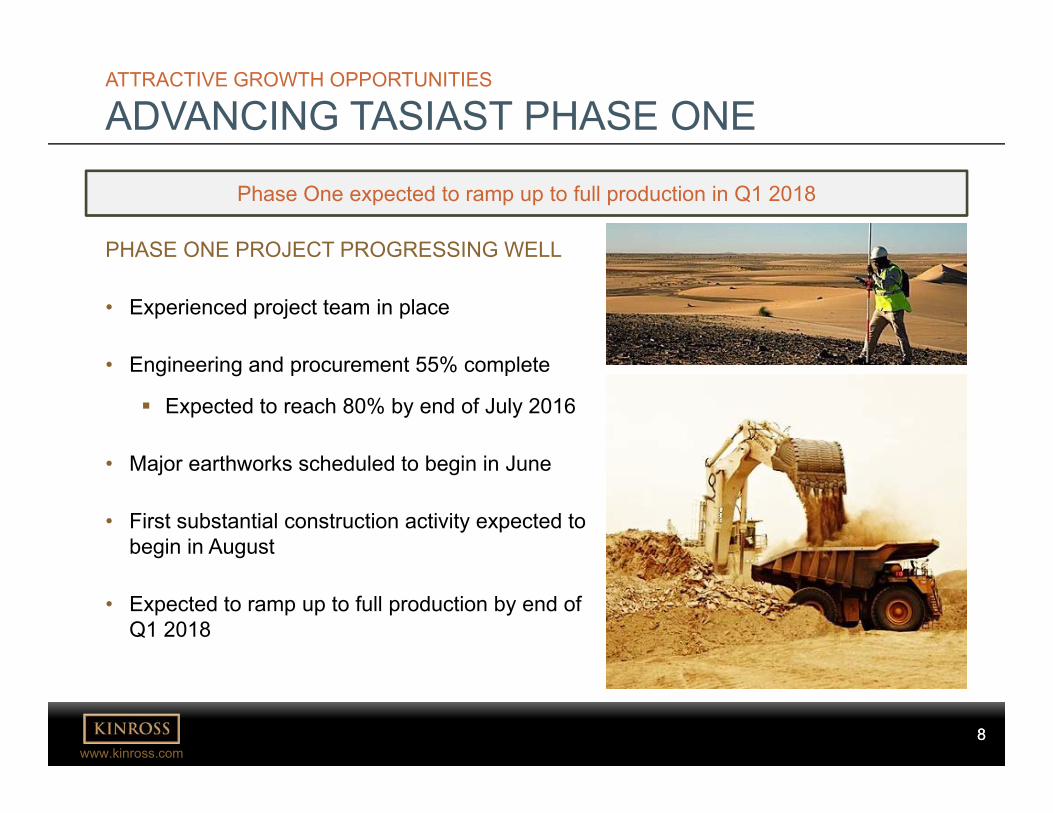
PHASE ONE PROJECT PROGRESSING WELL
• Experienced project team in place
• Engineering and procurement 55% complete
Expected to reach 80% by end of July 2016
• Major earthworks scheduled to begin in June
• First substantial construction activity expected to begin in August
• Expected to ramp up to full production by end of Q1 2018
ATTRACTIVE GROWTH OPPORTUNITIES
ADVANCING TASIAST PHASE ONE
Phase One expected to ramp up to full production in Q1 2018
8
9www.kinross.com
9
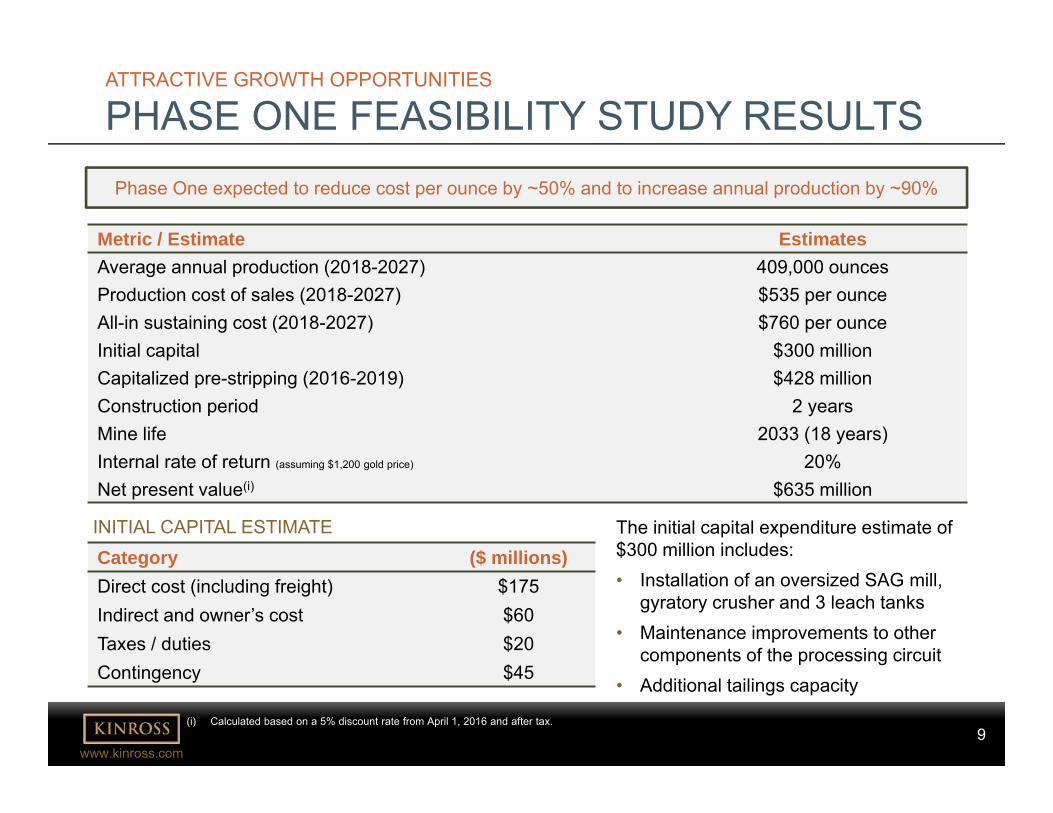
Phase One expected to reduce cost per ounce by ~50% and to increase annual production by ~90%
Metric / Estimate EstimatesAverage annual production (2018-2027) 409,000 ouncesProduction cost of sales (2018-2027) $535 per ounceAll-in sustaining cost (2018-2027) $760 per ounceInitial capital $300 millionCapitalized pre-stripping (2016-2019) $428 millionConstruction period 2 yearsMine life 2033 (18 years)Internal rate of return (assuming $1,200 gold price) 20%Net present value(i) $635 million
The initial capital expenditure estimate of $300 million includes:• Installation of an oversized SAG mill,
gyratory crusher and 3 leach tanks• Maintenance improvements to other
components of the processing circuit• Additional tailings capacity
Category ($ millions)Direct cost (including freight) $175Indirect and owner’s cost $60Taxes / duties $20Contingency $45
INITIAL CAPITAL ESTIMATE
ATTRACTIVE GROWTH OPPORTUNITIES
PHASE ONE FEASIBILITY STUDY RESULTS
(i) Calculated based on a 5% discount rate from April 1, 2016 and after tax.
10www.kinross.com
10
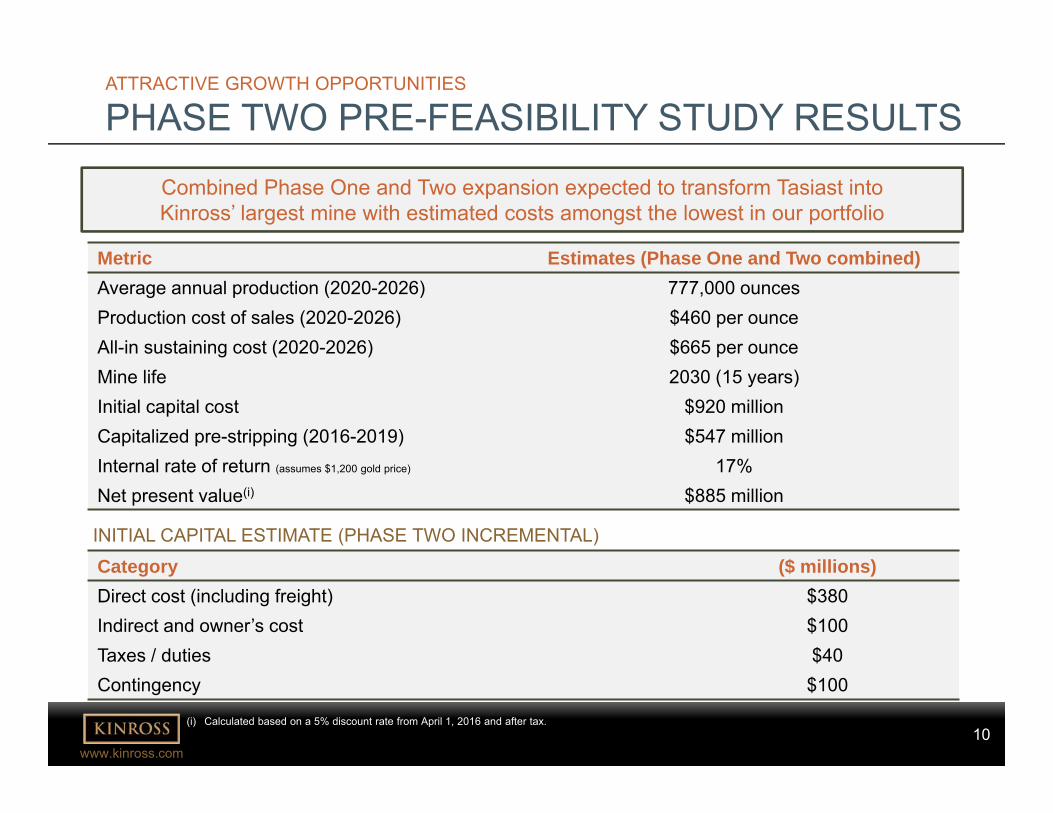
Combined Phase One and Two expansion expected to transform Tasiast into Kinross’ largest mine with estimated costs amongst the lowest in our portfolio
Metric Estimates (Phase One and Two combined)Average annual production (2020-2026) 777,000 ouncesProduction cost of sales (2020-2026) $460 per ounceAll-in sustaining cost (2020-2026) $665 per ounceMine life 2030 (15 years)Initial capital cost $920 millionCapitalized pre-stripping (2016-2019) $547 millionInternal rate of return (assumes $1,200 gold price) 17%Net present value(i) $885 million
ATTRACTIVE GROWTH OPPORTUNITIES
PHASE TWO PRE-FEASIBILITY STUDY RESULTS
Category ($ millions)Direct cost (including freight) $380Indirect and owner’s cost $100Taxes / duties $40Contingency $100
INITIAL CAPITAL ESTIMATE (PHASE TWO INCREMENTAL)
(i) Calculated based on a 5% discount rate from April 1, 2016 and after tax.
11www.kinross.com
11
ATTRACTIVE GROWTH OPPORTUNITIES
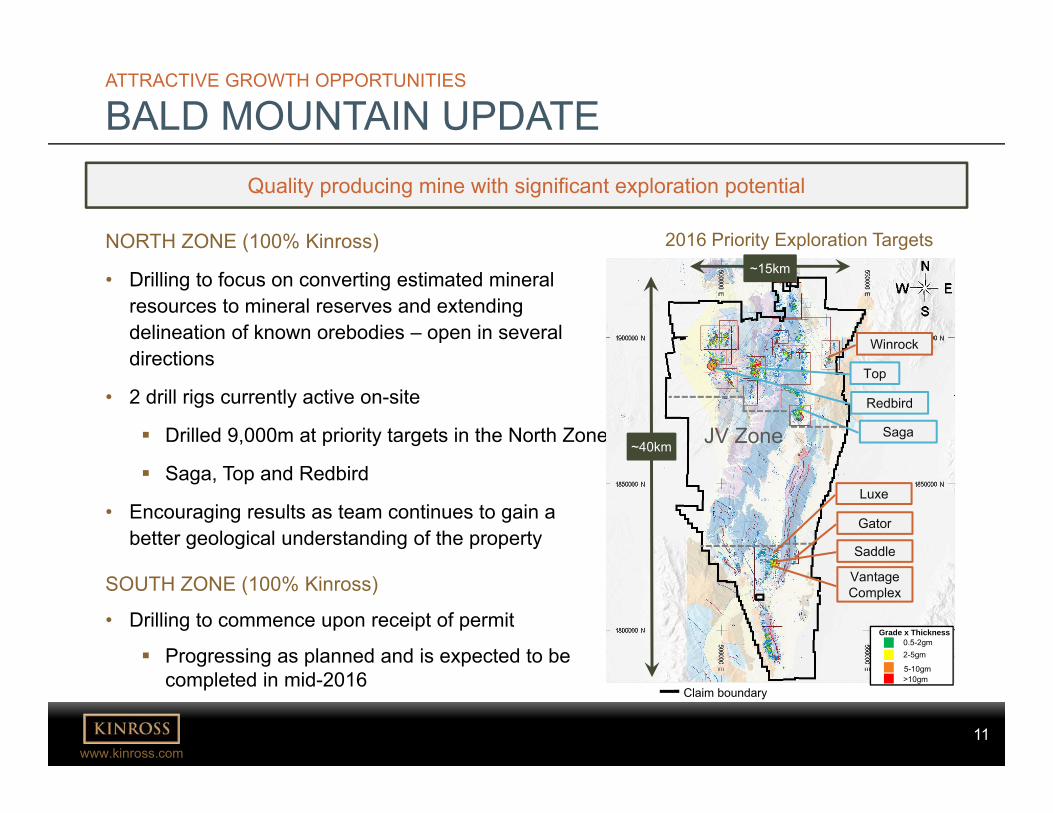
BALD MOUNTAIN UPDATEQuality producing mine with significant exploration potential
NORTH ZONE (100% Kinross)
• Drilling to focus on converting estimated mineral resources to mineral reserves and extending delineation of known orebodies – open in several directions
• 2 drill rigs currently active on-site
Drilled 9,000m at priority targets in the North Zone
Saga, Top and Redbird
• Encouraging results as team continues to gain a better geological understanding of the property
SOUTH ZONE (100% Kinross)
• Drilling to commence upon receipt of permit
Progressing as planned and is expected to be completed in mid-2016
Claim boundary
~15km
~40km
Winrock
Top
Redbird
Saga
Vantage Complex
JV Zone
>10gm
2-5gm0.5-2gm
Grade x Thickness
5-10gm
2016 Priority Exploration Targets
Gator
Saddle
Luxe
12www.kinross.com
12
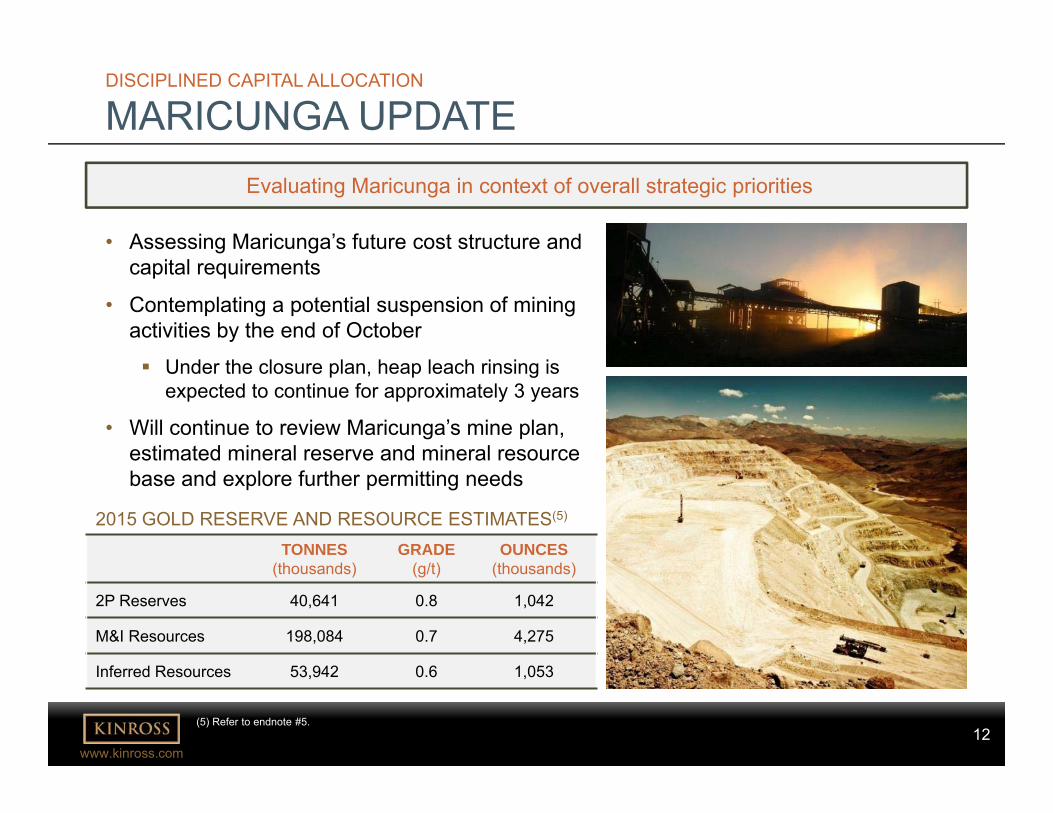
• Assessing Maricunga’s future cost structure and capital requirements
• Contemplating a potential suspension of mining activities by the end of October
Under the closure plan, heap leach rinsing is expected to continue for approximately 3 years
• Will continue to review Maricunga’s mine plan, estimated mineral reserve and mineral resource base and explore further permitting needs
DISCIPLINED CAPITAL ALLOCATION
MARICUNGA UPDATE
TONNES(thousands)
GRADE (g/t)
OUNCES(thousands)
2P Reserves 40,641 0.8 1,042
M&I Resources 198,084 0.7 4,275
Inferred Resources 53,942 0.6 1,053
2015 GOLD RESERVE AND RESOURCE ESTIMATES(5)
Evaluating Maricunga in context of overall strategic priorities
(5) Refer to endnote #5.
13www.kinross.com
13
KINROSS VALUE PROPOSITIONEXCELLENT OPERATIONAL TRACK RECORD
• Continuing to meet or outperform our operational targets
STRONG BALANCE SHEET
• $2.3B in liquidity with net debt to EBITDA ratio of 1.2x
ATTRACTIVE FUTURE GROWTH OPPORTUNITIES
• Proceeding with TASIAST PHASE ONE; expected to reach full production by the end of Q1 2018
• Completed pre-feasibility for TASIAST PHASE TWO; opportunity to further increase production and reduce costs
• Mineral reserve estimate conversion and exploration at BALD MOUNTAIN North and South Zones
COMPELLING RELATIVE VALUE
• Attractive value opportunity relative to peers, considering annual production, cost structure, track record and relatively low-risk growth opportunities
SHARE INFORMATION
K – Toronto Stock Exchange
KGC – New York Stock Exchange
14www.kinross.com
14FINANCIAL HIGHLIGHTS
14
15www.kinross.com
15
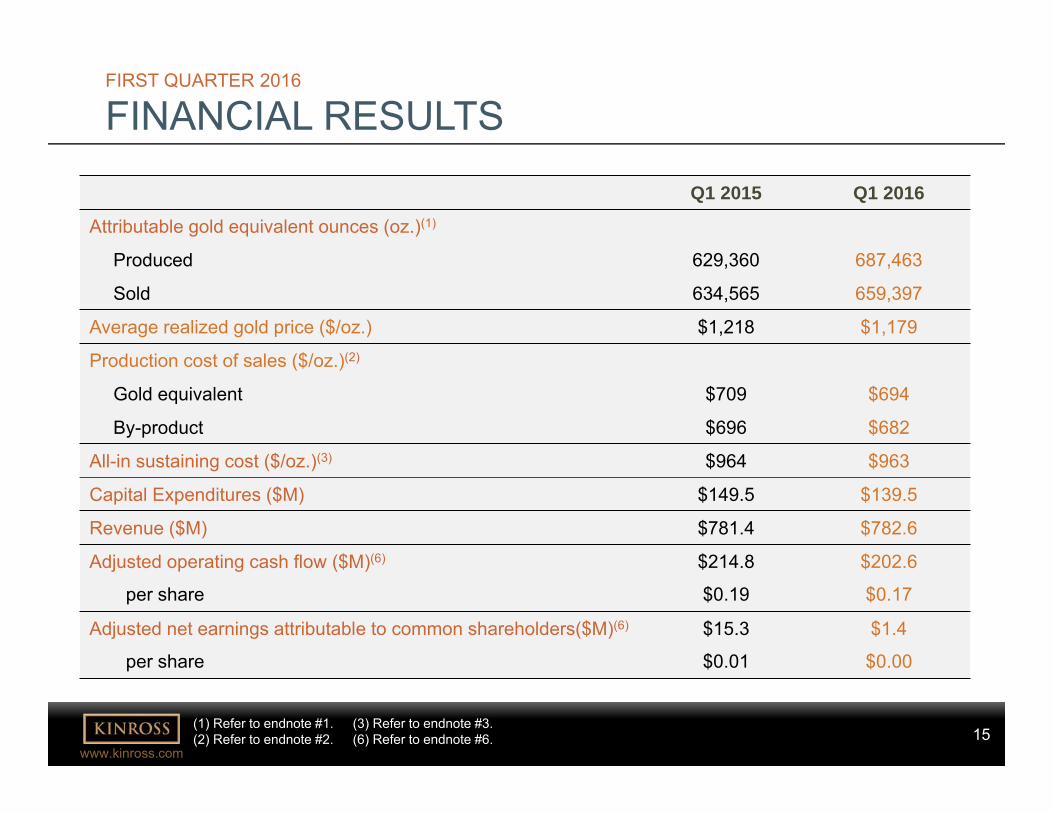
FIRST QUARTER 2016
FINANCIAL RESULTS
Q1 2015 Q1 2016
Attributable gold equivalent ounces (oz.)(1)
Produced 629,360 687,463
Sold 634,565 659,397
Average realized gold price ($/oz.) $1,218 $1,179
Production cost of sales ($/oz.)(2)
Gold equivalent $709 $694
By-product $696 $682
All-in sustaining cost ($/oz.)(3) $964 $963
Capital Expenditures ($M) $149.5 $139.5
Revenue ($M) $781.4 $782.6
Adjusted operating cash flow ($M)(6) $214.8 $202.6
per share $0.19 $0.17
Adjusted net earnings attributable to common shareholders($M)(6) $15.3 $1.4
per share $0.01 $0.00
(1) Refer to endnote #1.(2) Refer to endnote #2.
(3) Refer to endnote #3.(6) Refer to endnote #6.
16www.kinross.com
16
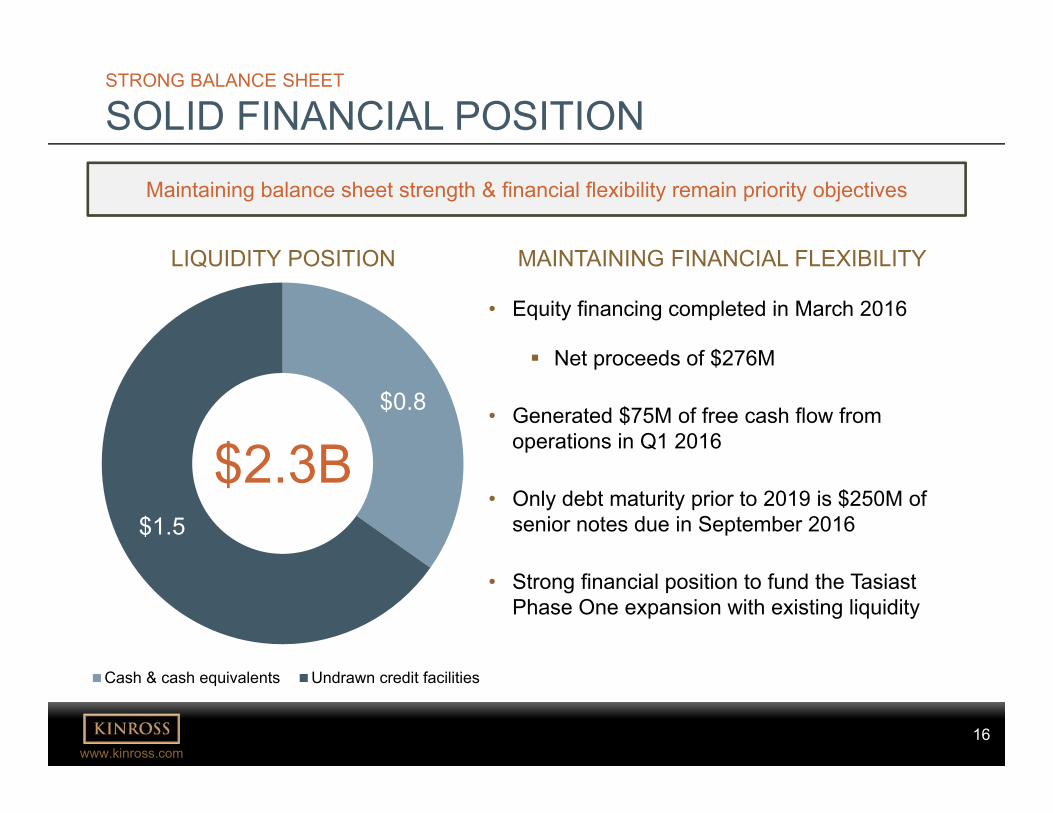
STRONG BALANCE SHEET
SOLID FINANCIAL POSITION
$0.8
$1.5
Cash & cash equivalents Undrawn credit facilities
LIQUIDITY POSITION
Maintaining balance sheet strength & financial flexibility remain priority objectives
MAINTAINING FINANCIAL FLEXIBILITY
• Equity financing completed in March 2016
Net proceeds of $276M
• Generated $75M of free cash flow from operations in Q1 2016
• Only debt maturity prior to 2019 is $250M of senior notes due in September 2016
• Strong financial position to fund the Tasiast Phase One expansion with existing liquidity
$2.3B
17www.kinross.com
17
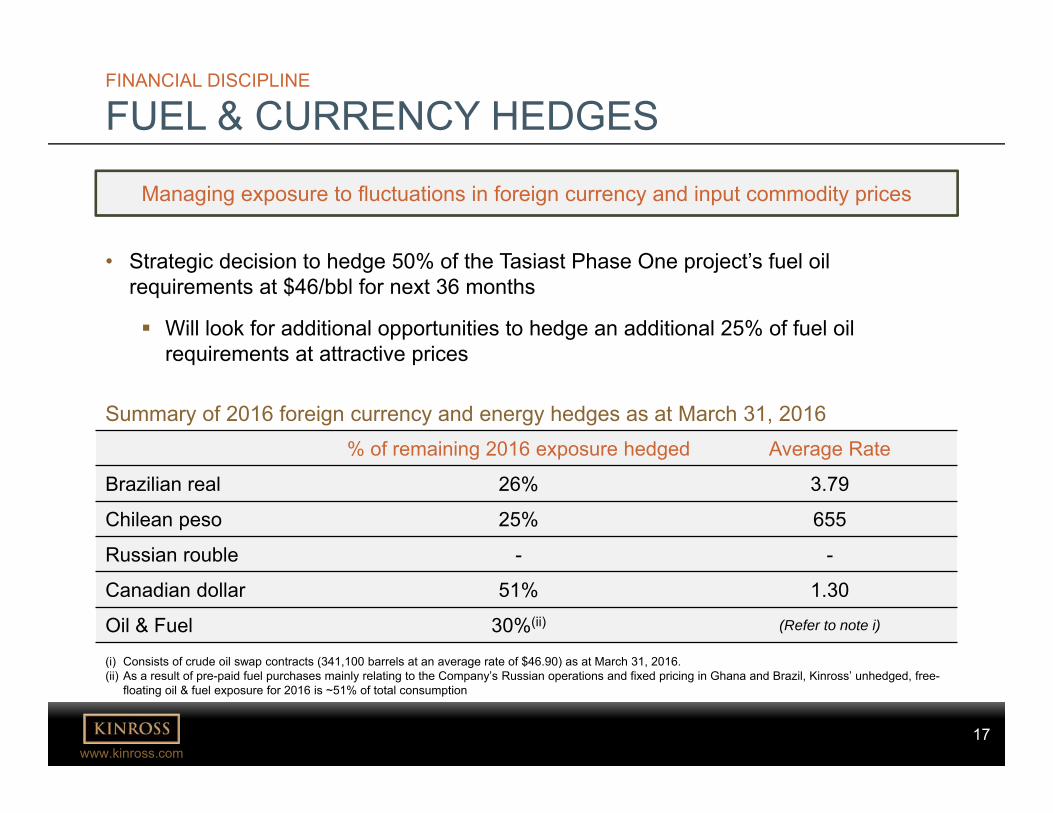
FINANCIAL DISCIPLINE
FUEL & CURRENCY HEDGES
Managing exposure to fluctuations in foreign currency and input commodity prices
% of remaining 2016 exposure hedged Average Rate
Brazilian real 26% 3.79
Chilean peso 25% 655
Russian rouble - -
Canadian dollar 51% 1.30
Oil & Fuel 30%(ii) (Refer to note i)
(i) Consists of crude oil swap contracts (341,100 barrels at an average rate of $46.90) as at March 31, 2016.(ii) As a result of pre-paid fuel purchases mainly relating to the Company’s Russian operations and fixed pricing in Ghana and Brazil, Kinross’ unhedged, free-
floating oil & fuel exposure for 2016 is ~51% of total consumption
Summary of 2016 foreign currency and energy hedges as at March 31, 2016
• Strategic decision to hedge 50% of the Tasiast Phase One project’s fuel oil requirements at $46/bbl for next 36 months
Will look for additional opportunities to hedge an additional 25% of fuel oil requirements at attractive prices
18www.kinross.com
18OPERATING HIGHLIGHTS
18
19www.kinross.com
19
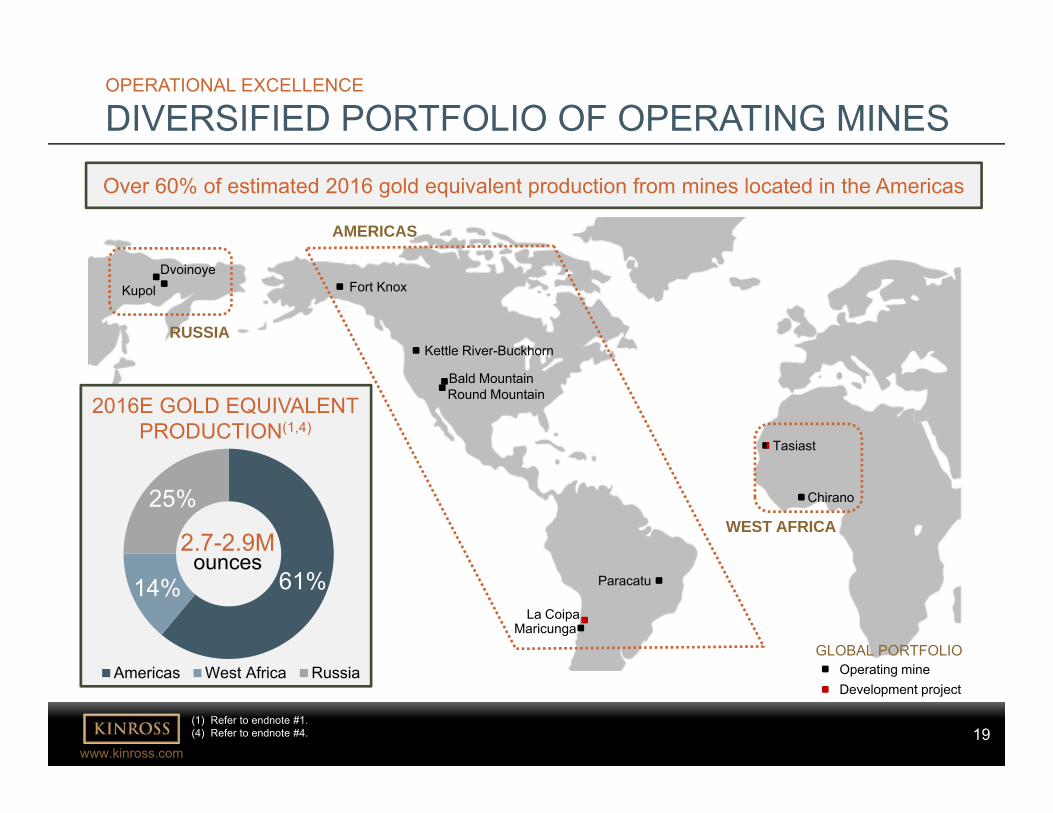
2016E GOLD EQUIVALENT PRODUCTION(1,4)
OPERATIONAL EXCELLENCE
DIVERSIFIED PORTFOLIO OF OPERATING MINES
GLOBAL PORTFOLIOOperating mineDevelopment project
Round Mountain
Kettle River-Buckhorn
Fort Knox
La Coipa
Paracatu
Maricunga
KupolDvoinoye
Chirano
Tasiast
AMERICASRUSSIA
WEST AFRICA
(3) Refer to endnote #3.
Over 60% of estimated 2016 gold equivalent production from mines located in the Americas
61%14%
25%
Americas West Africa Russia
2.7-2.9M ounces
(1) Refer to endnote #1.(4) Refer to endnote #4.
Bald Mountain
AMERICAS
RUSSIA
20www.kinross.com
20
OPERATIONAL EXCELLENCE
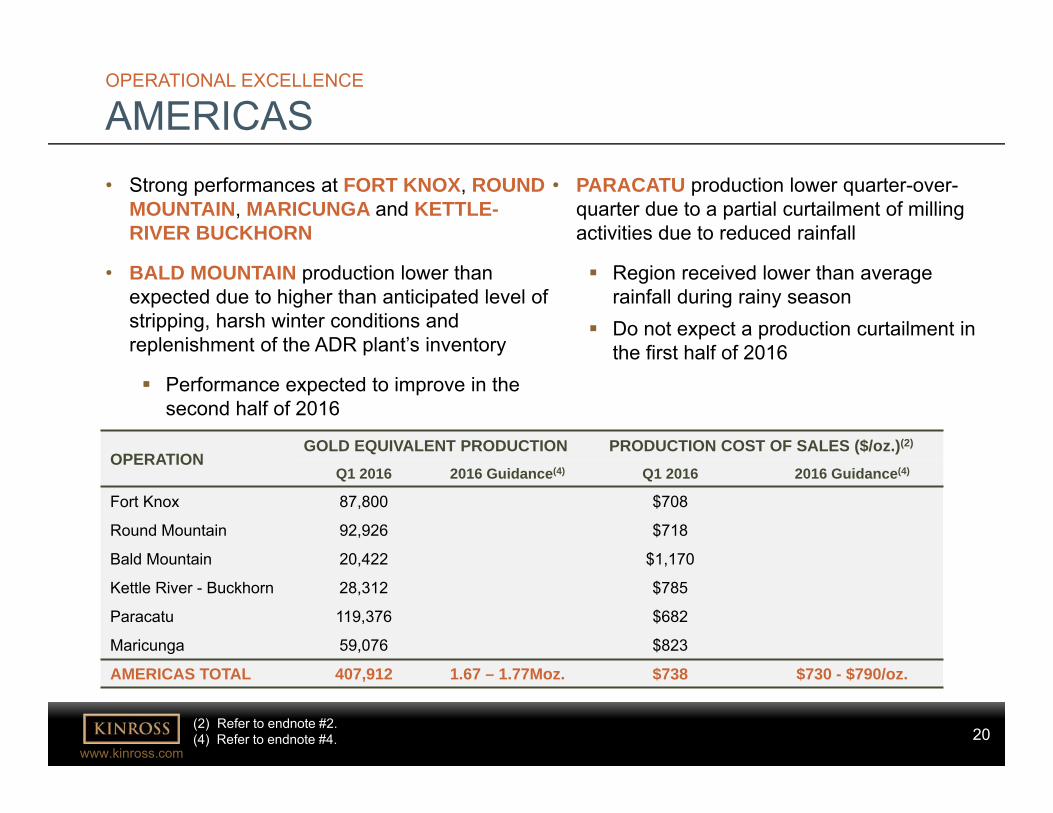
AMERICAS• PARACATU production lower quarter-over-
quarter due to a partial curtailment of milling activities due to reduced rainfall
Region received lower than average rainfall during rainy season
Do not expect a production curtailment in the first half of 2016
OPERATIONGOLD EQUIVALENT PRODUCTION PRODUCTION COST OF SALES ($/oz.)(2)
Q1 2016 2016 Guidance(4) Q1 2016 2016 Guidance(4)
Fort Knox 87,800 $708
Round Mountain 92,926 $718
Bald Mountain 20,422 $1,170
Kettle River - Buckhorn 28,312 $785
Paracatu 119,376 $682
Maricunga 59,076 $823
AMERICAS TOTAL 407,912 1.67 – 1.77Moz. $738 $730 - $790/oz.
(2) Refer to endnote #2.(4) Refer to endnote #4.
• Strong performances at FORT KNOX, ROUND MOUNTAIN, MARICUNGA and KETTLE-RIVER BUCKHORN
• BALD MOUNTAIN production lower than expected due to higher than anticipated level of stripping, harsh winter conditions and replenishment of the ADR plant’s inventory
Performance expected to improve in the second half of 2016
21www.kinross.com
21
OPERATIONAL EXCELLENCE
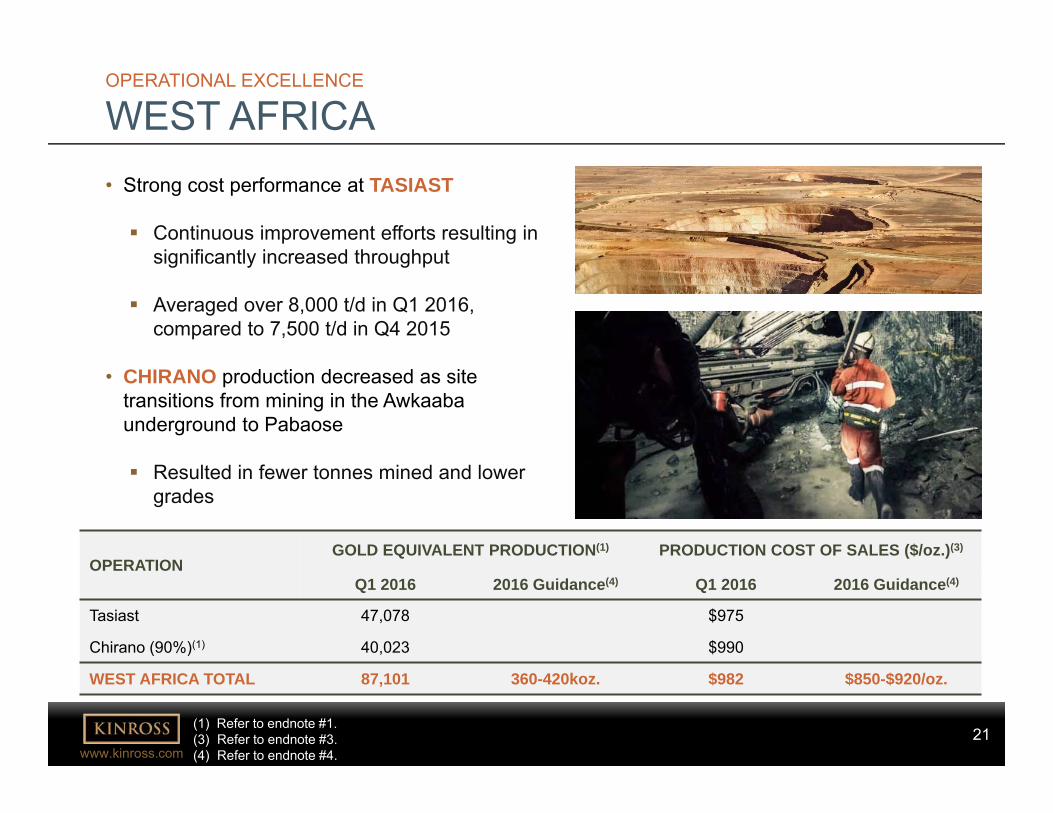
WEST AFRICA• Strong cost performance at TASIAST
Continuous improvement efforts resulting in significantly increased throughput
Averaged over 8,000 t/d in Q1 2016, compared to 7,500 t/d in Q4 2015
• CHIRANO production decreased as site transitions from mining in the Awkaabaunderground to Pabaose
Resulted in fewer tonnes mined and lower grades
OPERATIONGOLD EQUIVALENT PRODUCTION(1) PRODUCTION COST OF SALES ($/oz.)(3)
Q1 2016 2016 Guidance(4) Q1 2016 2016 Guidance(4)
Tasiast 47,078 $975
Chirano (90%)(1) 40,023 $990
WEST AFRICA TOTAL 87,101 360-420koz. $982 $850-$920/oz.
(1) Refer to endnote #1.(3) Refer to endnote #3.(4) Refer to endnote #4.
22www.kinross.com
22
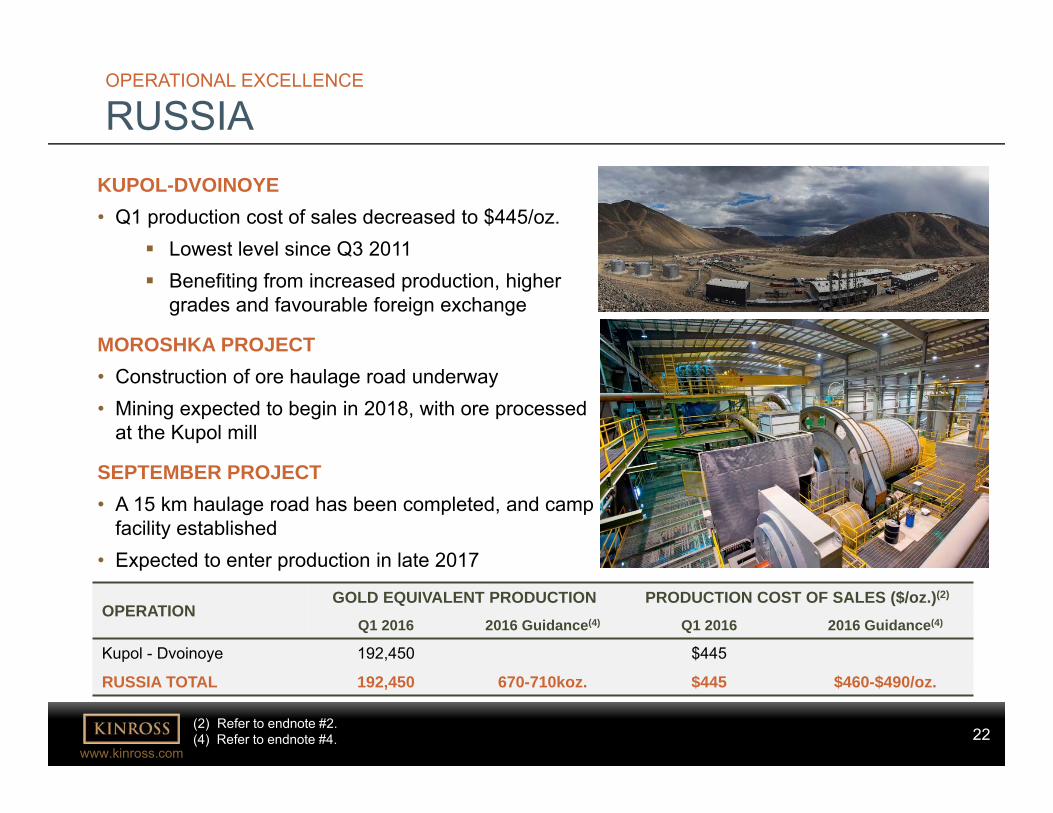
OPERATIONAL EXCELLENCE
RUSSIAKUPOL-DVOINOYE• Q1 production cost of sales decreased to $445/oz.
Lowest level since Q3 2011 Benefiting from increased production, higher
grades and favourable foreign exchange
MOROSHKA PROJECT• Construction of ore haulage road underway• Mining expected to begin in 2018, with ore processed
at the Kupol mill
SEPTEMBER PROJECT• A 15 km haulage road has been completed, and camp
facility established • Expected to enter production in late 2017
(2) Refer to endnote #2.(4) Refer to endnote #4.
OPERATIONGOLD EQUIVALENT PRODUCTION PRODUCTION COST OF SALES ($/oz.)(2)
Q1 2016 2016 Guidance(4) Q1 2016 2016 Guidance(4)
Kupol - Dvoinoye 192,450 $445
RUSSIA TOTAL 192,450 670-710koz. $445 $460-$490/oz.
23www.kinross.com
23
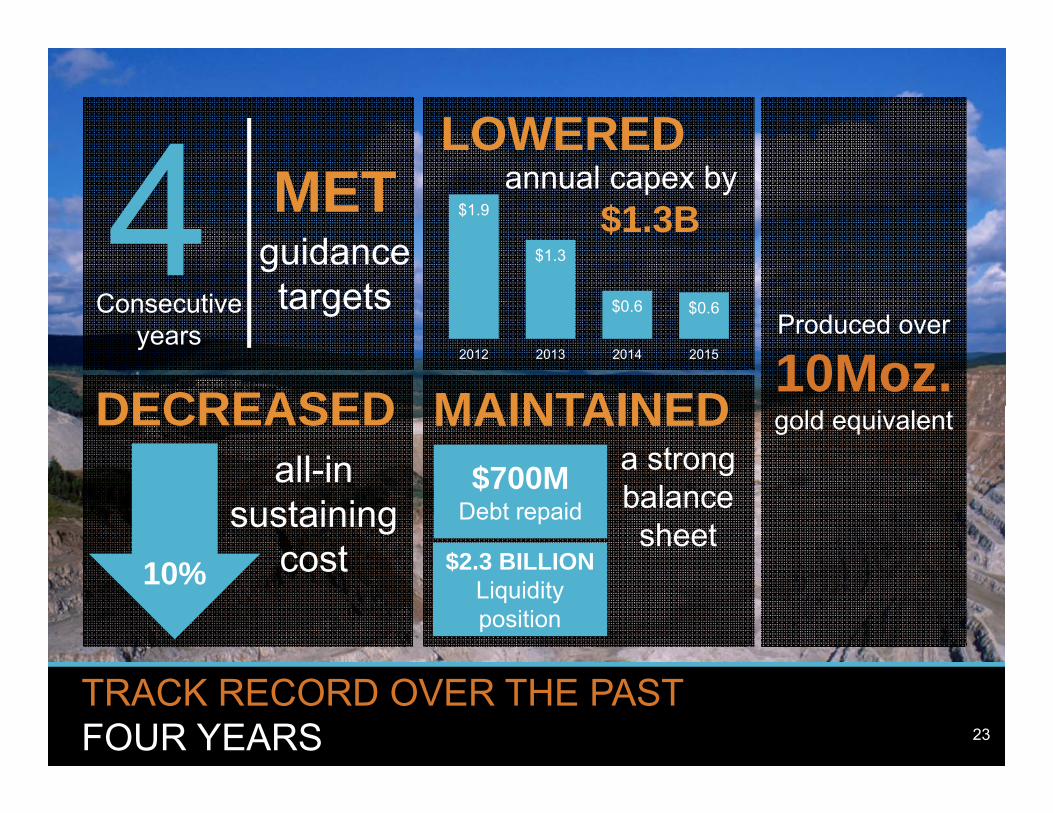
TRACK RECORD OVER THE PAST FOUR YEARS
Produced over
10Moz.gold equivalentMAINTAINED
$700MDebt repaid
$2.3 BILLION Liquidity position
a strong balance sheet
$1.9
$1.3
$0.6 $0.6
2012 2013 2014 2015
annual capex by $1.3B
LOWEREDMET
guidance targetsConsecutive
years
10%
all-in sustaining
cost
DECREASED
23
24www.kinross.com
24APPENDIX
25www.kinross.com
25
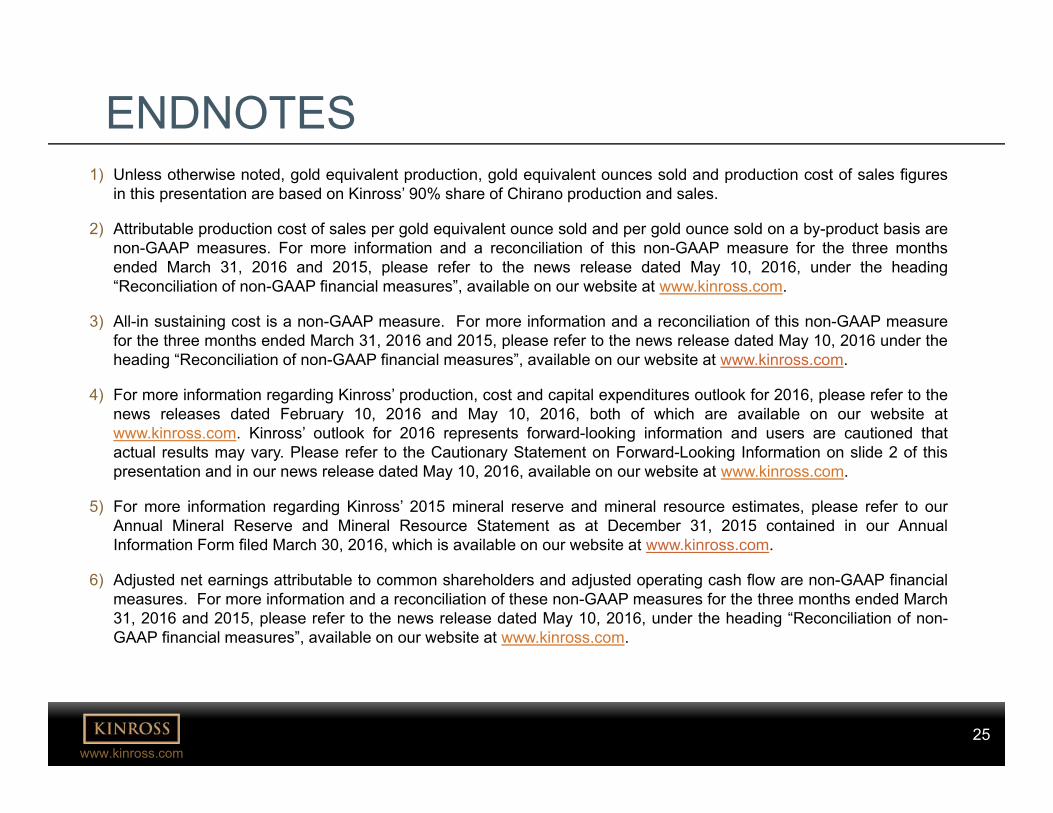
ENDNOTES1) Unless otherwise noted, gold equivalent production, gold equivalent ounces sold and production cost of sales figures
in this presentation are based on Kinross’ 90% share of Chirano production and sales.
2) Attributable production cost of sales per gold equivalent ounce sold and per gold ounce sold on a by-product basis arenon-GAAP measures. For more information and a reconciliation of this non-GAAP measure for the three monthsended March 31, 2016 and 2015, please refer to the news release dated May 10, 2016, under the heading“Reconciliation of non-GAAP financial measures”, available on our website at www.kinross.com.
3) All-in sustaining cost is a non-GAAP measure. For more information and a reconciliation of this non-GAAP measurefor the three months ended March 31, 2016 and 2015, please refer to the news release dated May 10, 2016 under theheading “Reconciliation of non-GAAP financial measures”, available on our website at www.kinross.com.
4) For more information regarding Kinross’ production, cost and capital expenditures outlook for 2016, please refer to thenews releases dated February 10, 2016 and May 10, 2016, both of which are available on our website atwww.kinross.com. Kinross’ outlook for 2016 represents forward-looking information and users are cautioned thatactual results may vary. Please refer to the Cautionary Statement on Forward-Looking Information on slide 2 of thispresentation and in our news release dated May 10, 2016, available on our website at www.kinross.com.
5) For more information regarding Kinross’ 2015 mineral reserve and mineral resource estimates, please refer to ourAnnual Mineral Reserve and Mineral Resource Statement as at December 31, 2015 contained in our AnnualInformation Form filed March 30, 2016, which is available on our website at www.kinross.com.
6) Adjusted net earnings attributable to common shareholders and adjusted operating cash flow are non-GAAP financialmeasures. For more information and a reconciliation of these non-GAAP measures for the three months ended March31, 2016 and 2015, please refer to the news release dated May 10, 2016, under the heading “Reconciliation of non-GAAP financial measures”, available on our website at www.kinross.com.
26www.kinross.com
26
KINROSS GOLD CORPORATION 25 York Street, 17th Floor │Toronto, ON │ M5J 2V5
www.kinross.com