q chapter 4 coastal and marine ecosystems - …m section tii_interim_report...q chapter 4 coastal...
TRANSCRIPT
CHAPTER 4
COASTAL & MARINE ECOSYSTEMS
CHAPTER 4
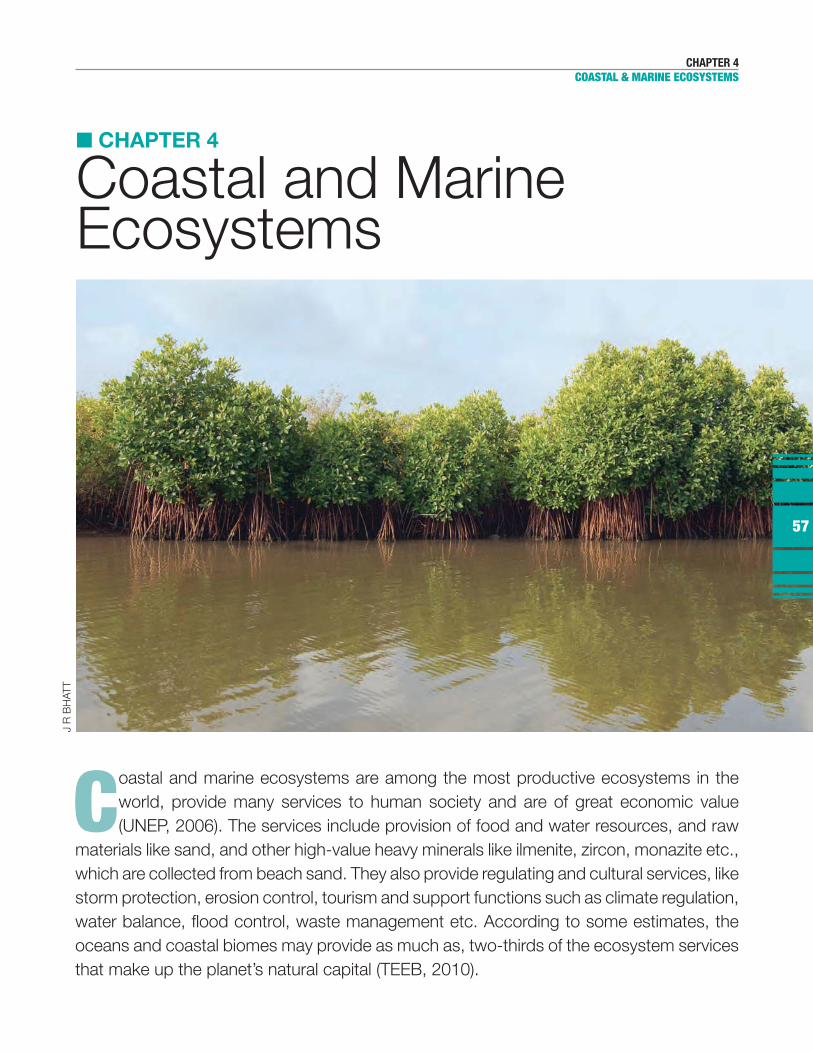
Coastal and MarineEcosystems
Coastal and marine ecosystems are among the most productive ecosystems in the world, provide many services to human society and are of great economic value (UNEP, 2006). The services include provision of food and water resources, and raw
materials like sand, and other high-value heavy minerals like ilmenite, zircon, monazite etc., which are collected from beach sand. They also provide regulating and cultural services, like storm protection, erosion control, tourism and support functions such as climate regulation,
oceans and coastal biomes may provide as much as, two-thirds of the ecosystem services that make up the planet’s natural capital (TEEB, 2010).
57
Indian coastal ecosystems comprising of mudflats, sandy beaches, estuaries, creeks, mangroves, coral reefs, marshes, lagoon, sea grass beds, and sandy and rocky beaches extend to 42,808 sq km. The Exclusive Economic Zone of India is 2.02 million sq km.
The number of species in the coastal and marine ecosystems is suggested to be more than 13,000. It is also known for high biological productivity, which provide a wide range of habitat for many aquatic flora and fauna. India has established 31 Coastal and Marine Protected Areas (CMPAs) and several species have been listed under Wildlife (Protection) Act 1972.
Major human-induced drivers of ecosystem degradation include habitat conversion to other forms of land use, overexploitation of resources and associated destructive harvesting practices, spread of invasive alien species, pollution from agricultural, domestic and industrial effluents, and climate change.
All the maritime states of India are implementing Marine Fishing Regulation Act for the last 15 to 25 years.
Marine fish production has increased from 0.5 million tonnes in 1950 to 3.8 million tonnes in 2013, contributing substantially to nutritional security, income and livelihood of a large population of the country.
Available information indicates that the oceans and coastal biomes contribute substantially to the ecosystem services that make up the country’s natural capital. India has opportunities to reap many economic benefits from living and non-living resources of coastal and marine areas including fisheries and biodiversity.
A TEEB approach at country level could provide much needed data on the economic value of these resources as well as on the full range of costs associated with extracting and using them. Managing the marine and coastal ecosystems requires an understanding of the socio-ecological systems and their inter-connections.
Recognising blue carbon ecosystem services, Marine Spatial Planning and suggestions on the effectiveness of current management measures are a few initiatives that would pave the way for enhancing delivery of ecosystem services.
In order to achieve this, there is a need to bridge the gaps in knowledge on coastal and marine ecosystem services and functions and support mainstreaming of biodiversity and ecosystem considerations into both national policy-making and broader societal perspectives.
THE ECONOMICS OF ECOSYSTEMS AND BIODIVERSITY
INDIA INITIATIVE
58
59
CHAPTER 4
COASTAL & MARINE ECOSYSTEMS
59
4.1 IntroductionCoastal and marine ecosystems are probably the least understood, most biologically diverse, and most undervalued of all ecosystems. From mangroves, coral reefs and seagrass beds to deep oceans, coastal and marine systems suffer from a lack of recognition of their economic value – including vital services such as providing food, livelihood and carbon capture for climate mitigation. Valuing these services would provide policy-makers with a strong rationale to improve coastal and marine ecosystem management and invest in conservation for its risk management value and economic
Building upon the foundations of the global TEEB studies, TII component for coastal and marine ecosystems
of preserved and enhanced ecosystem structures and their functions in the well-being of humans and nature. In order to achieve this, it will bridge the gaps in knowledge on coastal and marine ecosystem services and functions, and support mainstreaming of biodiversity and ecosystem considerations into both national policy-making and broader societal perspectives. Coastal and marine ecosystem valuation studies will be used to inform the decision making process
a better economic paradigm.
4.2 Status, trends and key management issuesSurrounded by the Indian Ocean, the Arabian Sea and the Bay of Bengal, India has a coastline of above 7,500 km, spanning nine maritime States and two Union Territories (UTs) in the mainland, and two island UTs. The Exclusive Economic Zone (EEZ) extends to 2.02 million sq km and the continental shelf area to 0.18 million sq km. The Indian coasts support about 30% of the total 1.2 billion human population. Indian coastal
creeks, mangroves, coral reefs, marshes, lagoons, seagrass beds, and sandy and rocky beaches extend to 42,808 sq km (Table 1). They are known for their high biological productivity,
and fauna.The number of species in the coastal and marine
ecosystems is estimated to be more than 13,000 (Venkataraman and Wafar, 2005; MoEF, 2009). However, this is an underestimate, considering the fact that the inventory is extensive in the case of commercially important resources, but incomplete for minor phyla and microbes. The species richness of well-surveyed groups include: marine algae – 844 species; sponges – 451 species; hard corals – 218species; polychaetes – 250 species; crustaceans – 2,934(+) species; Copepoda – 1,925; Cirripeds – 104; Amphipoda – 139; Brachyura – 705; Prawns – 243; Stomatopoda – 121; Cladocera – 3; Ostracoda – 120; Anomura – 162; lobsters –
– 1,546; reptiles – 35; mammals – 26.
small-scale category and totally dependent on the sector for livelihoods.
has witnessed a highly satisfactory growth trajectory since the launching of the First Five-Year Plan (FYP) in 1950-51. Fish production has increased from 0.72 million tonnes (mt) in 1950-51 to reach 8.288 mt in 2010-11, comprising 3.220
(including aquaculture). With an average growth of about 6%
been one of the best amongst all food production sectors in the country. Its contributions to foreign exchange earnings have also been substantial. During 2010-11, export of marine products reached 813,091 tonnes valued at `129 billion and US$ 2,856.92 million.
has been proposed by the Government to be achieved at the end of the 12th FYP period (2017). The growth rate perhaps stems from the excellent performance of the sector in the past FYPs.
many management measures are implemented such as
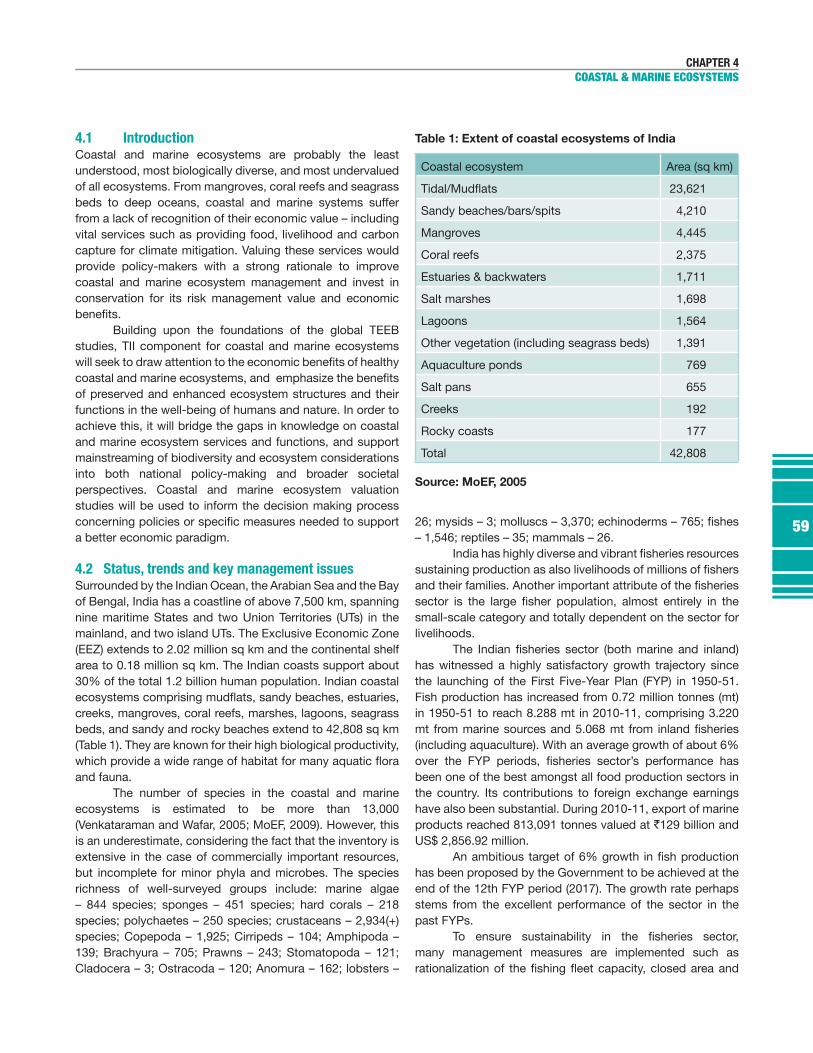
Table 1: Extent of coastal ecosystems of India
Coastal ecosystem Area (sq km)
23,621
Sandy beaches/bars/spits 4,210
Mangroves 4,445
Coral reefs 2,375
Estuaries & backwaters 1,711
Salt marshes 1,698
Lagoons 1,564
Other vegetation (including seagrass beds) 1,391
Aquaculture ponds 769
Salt pans 655
Creeks 192
Rocky coasts 177
Total 42,808
Source: MoEF, 2005
60
THE ECONOMICS OF ECOSYSTEMS AND BIODIVERSITY
INDIA INITIATIVE
such as trawls. The 2004 Comprehensive Marine Fisheries Policy also brings in greater cooperation between different Ministries/Departments at the Central Government level as also with the State/UT administrations to harmonize actions,
and facilitate sustainable and responsible management of
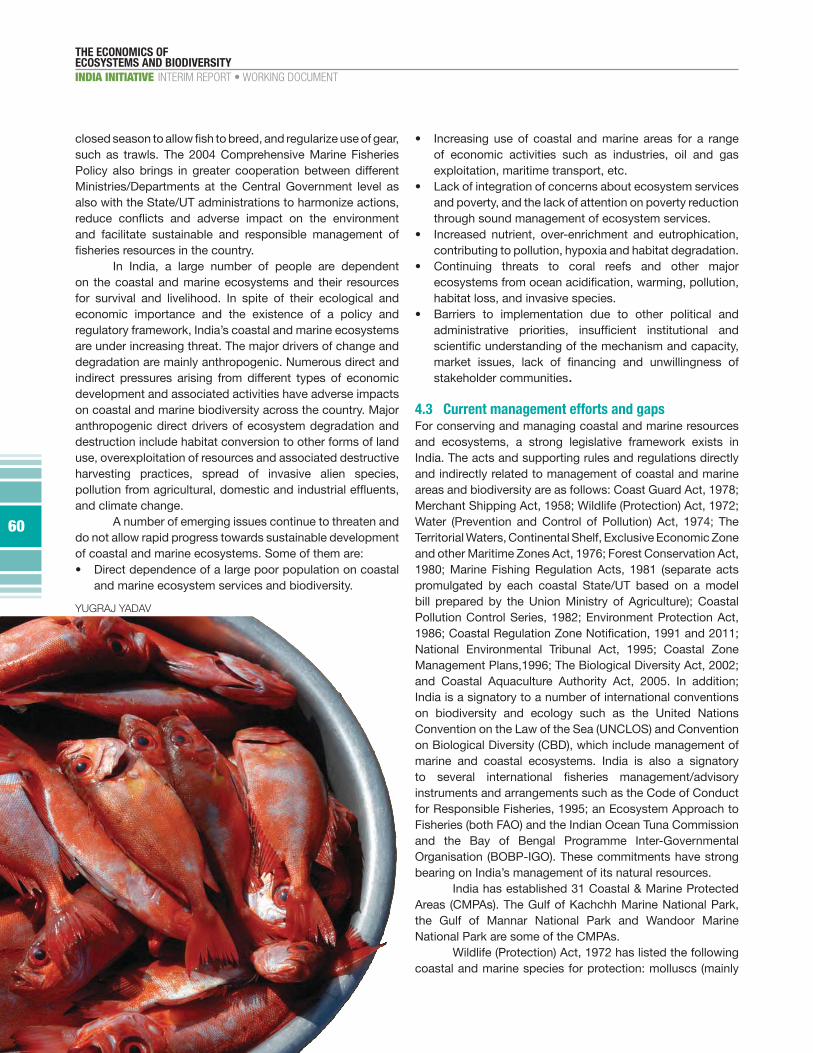
In India, a large number of people are dependent on the coastal and marine ecosystems and their resources for survival and livelihood. In spite of their ecological and economic importance and the existence of a policy and
are under increasing threat. The major drivers of change and degradation are mainly anthropogenic. Numerous direct and indirect pressures arising from different types of economic development and associated activities have adverse impacts on coastal and marine biodiversity across the country. Major anthropogenic direct drivers of ecosystem degradation and destruction include habitat conversion to other forms of land use, overexploitation of resources and associated destructive harvesting practices, spread of invasive alien species,
and climate change.A number of emerging issues continue to threaten and
do not allow rapid progress towards sustainable development of coastal and marine ecosystems. Some of them are:
and marine ecosystem services and biodiversity.
of economic activities such as industries, oil and gasexploitation, maritime transport, etc.
and poverty, and the lack of attention on poverty reduction through sound management of ecosystem services.
contributing to pollution, hypoxia and habitat degradation.
habitat loss, and invasive species.
stakeholder communities.
4.3 Current management efforts and gapsFor conserving and managing coastal and marine resources and ecosystems, a strong legislative framework exists in India. The acts and supporting rules and regulations directly and indirectly related to management of coastal and marine areas and biodiversity are as follows: Coast Guard Act, 1978; Merchant Shipping Act, 1958; Wildlife (Protection) Act, 1972; Water (Prevention and Control of Pollution) Act, 1974; The Territorial Waters, Continental Shelf, Exclusive Economic Zone and other Maritime Zones Act, 1976; Forest Conservation Act, 1980; Marine Fishing Regulation Acts, 1981 (separate acts promulgated by each coastal State/UT based on a model bill prepared by the Union Ministry of Agriculture); Coastal Pollution Control Series, 1982; Environment Protection Act,
National Environmental Tribunal Act, 1995; Coastal Zone Management Plans,1996; The Biological Diversity Act, 2002; and Coastal Aquaculture Authority Act, 2005. In addition; India is a signatory to a number of international conventions on biodiversity and ecology such as the United Nations Convention on the Law of the Sea (UNCLOS) and Convention on Biological Diversity (CBD), which include management of marine and coastal ecosystems. India is also a signatory
instruments and arrangements such as the Code of Conduct for Responsible Fisheries, 1995; an Ecosystem Approach to Fisheries (both FAO) and the Indian Ocean Tuna Commission and the Bay of Bengal Programme Inter-Governmental Organisation (BOBP-IGO). These commitments have strong
India has established 31 Coastal & Marine Protected Areas (CMPAs). The Gulf of Kachchh Marine National Park, the Gulf of Mannar National Park and Wandoor Marine National Park are some of the CMPAs.
Wildlife (Protection) Act, 1972 has listed the following coastal and marine species for protection: molluscs (mainly
61
CHAPTER 4
COASTAL & MARINE ECOSYSTEMS
gastropods): 24 species; whale shark (one species); other
seahorse (all species); seacucumber (all species); sponges and sea fans (all species); corals (all species); turtles (all 5 species); marine mammals (all 26 species).
measures for their successful implementation. (Table 2)In spite of these efforts, several gaps exist in the
management of coastal and marine areas. There is lack of understanding on the effective functioning of the measures
are no strong evidences to support recovery of biodiversity to improve livelihood of coastal communities. Policies on environmental protection are now gaining momentum, but poorly integrated. The important interactions between marine, coastal and other terrestrial systems need to be integrated to understand the ecosystem services. In examining the incidence of poverty among people who are dependent on coastal and marine ecosystem services, the existing national policies have to be disaggregated to address micro-level issues. Decisions on management follow a top-down
decisions at the village level is weak. There are few examples of mechanisms to enhance ecosystem services and alleviate
linked to the stocks of ecosystems, processes and rates of change, complex causality, behavioural responses, economic responses and social impacts of change. Governance of
powerful commercial interests, which are not considered.
4.4 Relevance of an ecosystem services economics approach
from living and non-living resources of coastal and marine
manage the resources and improve capacities to enforce management, requires economic valuation information. In order to fully leverage ecological and economic knowledge of coastal and marine ecosystems and their services, there is a need to generate and provide access to more and better data regarding key ecosystem services including biological, economic and societal measures. A TEEB approach at the country level could provide much needed data on the
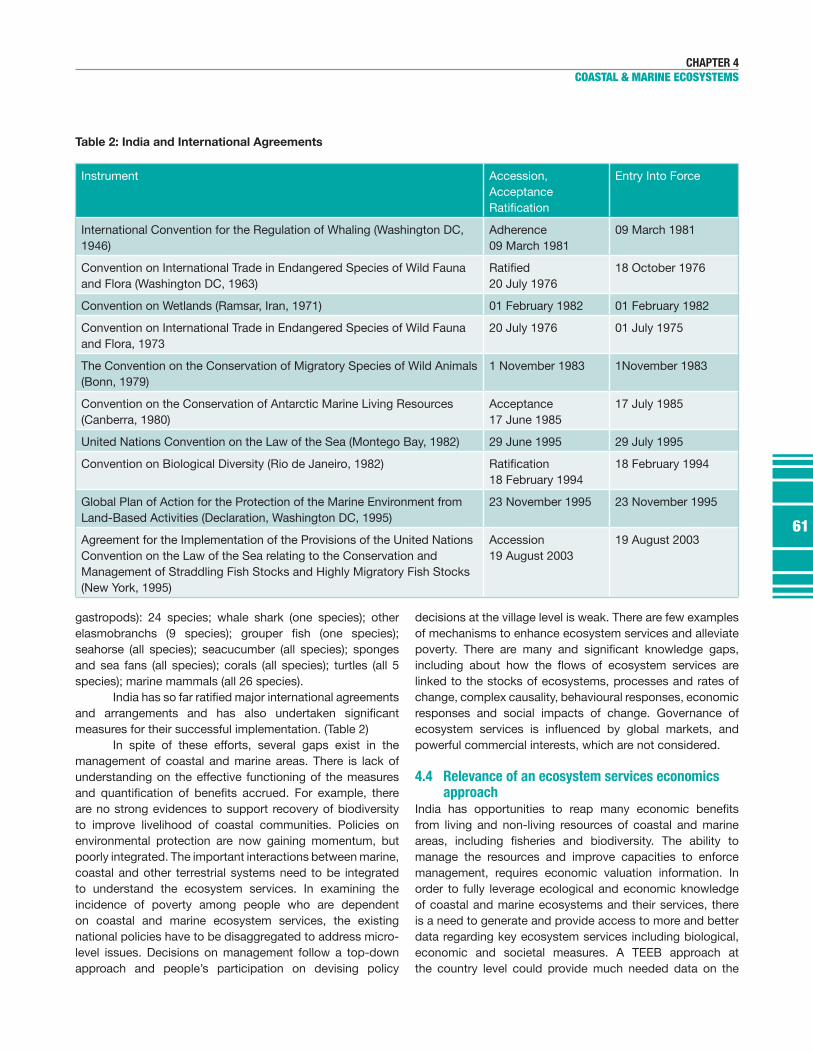
Instrument Accession, Acceptance
Entry Into Force
International Convention for the Regulation of Whaling (Washington DC, 1946)
Adherence 09 March 1981
09 March 1981
Convention on International Trade in Endangered Species of Wild Fauna and Flora (Washington DC, 1963) 20 July 1976
18 October 1976
Convention on Wetlands (Ramsar, Iran, 1971) 01 February 1982 01 February 1982
Convention on International Trade in Endangered Species of Wild Fauna and Flora, 1973
20 July 1976 01 July 1975
The Convention on the Conservation of Migratory Species of Wild Animals (Bonn, 1979)
1 November 1983 1November 1983
Convention on the Conservation of Antarctic Marine Living Resources (Canberra, 1980)
Acceptance 17 June 1985
17 July 1985
United Nations Convention on the Law of the Sea (Montego Bay, 1982) 29 June 1995 29 July 1995
Convention on Biological Diversity (Rio de Janeiro, 1982) 18 February 1994
18 February 1994
Global Plan of Action for the Protection of the Marine Environment from Land-Based Activities (Declaration, Washington DC, 1995)
23 November 1995 23 November 1995
Agreement for the Implementation of the Provisions of the United Nations Convention on the Law of the Sea relating to the Conservation and Management of Straddling Fish Stocks and Highly Migratory Fish Stocks (New York, 1995)
Accession 19 August 2003
19 August 2003
Table 2: India and International Agreements
62
THE ECONOMICS OF ECOSYSTEMS AND BIODIVERSITY
INDIA INITIATIVE
economic value of these resources as well as on the full range of costs associated with extracting and using them. Thus, the economic valuation of coastal and marine ecosystem services and biodiversity could:
and marine ecosystems and resources;
challenges that arise from changing coastal and marineenvironments; and
management plan for coastal resources by taking intoaccount the opinion of primary village level stakeholders.
One of the concepts that has emerged globally in recent years is to develop the green economy. In its report, IOC (2011) has listed several key dimensions as the contribution of coastal and marine sectors to the green economy (for example, protection and restoration of coastal and marine ecosystems and biodiversity, including beyond national jurisdiction; development of blue carbon markets;
toward equitable, non-subsidised and sustainable practices; adaptation to sea level rise and climate change; integrated coastal zone management; increasing sustainable use of bio-resources, including biotechnology and bioprospecting, etc). In a developing country like India, if economic development is to contribute to sustainable well-being of the people, it is important to balance market and non-market values, living and non-living resources, and uses now and in the future. Such an approach does not rule out industrial uses of coastal and marine areas. It recognises the pressures that such activities exert on ecosystems and natural capital and
opportunities to extract more value and revenue from coastal and marine ecosystems without diminishing natural capital. Such information is necessary to ensure that trade-offs made
Moving towards these goals requires a better understanding of the economic value of coastal and marine ecosystems and biodiversity, as well as contributions of these ecosystem services to societal, cultural and ecological well-
relevant questions and adopting best strategies, it is possible to achieve the goals of economic valuation.Transition to greener economy: What economic information
related to coastal and marine ecosystems is needed? What are the best strategies?
Fisheries:extractive and non-extractive values of commercially important and their associated species? Can a better
stock-in-the-sea lead to better management strategies
conservationists?Marine Spatial Planning (MSP): Coastal and marine
management that considers single sectors treats commercial and non-commercial uses as competing with one another. Through MSP, various management
trade-offs such as those between industrial developments and ecosystem services can be made in order to balance many potential uses of the ecosystem. A TEEB approach
of changes in the coastal and marine ecosystem services would be useful for MSP.
Marine Protected Areas (MPAs): What are the biological, social and economic dimensions? What is the potential for green accounting that considers the contribution of MPAs to long-term ecosystem recovery, human well-being and poverty alleviation?
Blue carbon ecosystem services: Placing an economic value on the carbon stored within coastal habitats such as mangroves, coral reefs, seagrass meadows and salt marshes allows comparison of the value of development against the value of carbon stored within these systems. This also helps making investments in preserving these systems in order to offset carbon emissions. Valuing carbon in coastal ecosystems can help policy makers identify the areas where the need to protect blue carbon is high and prioritise their protection.
Integrated management of mangroves and coral reefs: Mangroves and coral reefs can provide many goods and services to coastal communities, if properly managed. Management plans that could harness the full value of mangrove and coral reef ecosystem services need to be developed for integrating these values into national planning. While some initiatives have been made to value mangrove and coral reef services in India, analysis on the roles of rights, incentives and governance and
are lacking. A TEEB approach can contribute to this area by synthesizing the available information and developing guidance on these critical elements of mangroves and coral reef management.
4.5 State of art on value of ecosystem services of coastal and marine ecosystems
In India, there have been only few attempts to estimate the value of coastal and marine resources. However, there is now a growing literature of micro-studies that look at either
A few studies in India that are linked to coastal and marine ecosystems have been presented by Vivekanandan and Mukhopadhyay (2012).
Anoop and Suryaprakash (2008) have used a
63
CHAPTER 4
COASTAL & MARINE ECOSYSTEMS
contingent choice technique to estimate the option value of Ashtamudi estuary (US$ 64,667). Using a discount rate of 4%, the present value has been assessed to be US$ 1.5 million. Dixit et al. (2012) found the value of ecosystem services emanating from coral reefs of Gulf of Kachchh to be US$ 3.7 million (2007 price) and US$ 132,500 per sq km.
It is important to note that valuation needs an interdisciplinary approach and the need for bio-economic modelling cannot be overstated when we are dealing with issues of valuation. Empirical examples in India are rare. One such attempt was by Bhat and Bhatta (2006) who estimated
valuation. They argued that increase in mechanisation and access to technology has made it possible for large-scale
and better management of resources. At a micro-level using the direct market values, Hussain
and Badola (2010) provided estimates of livelihood support from mangroves in the Bhitarkanika conservation area on the Odisha coast. They considered only two items of provisioning
valuation. They also considered timber and non-timber extraction from mangroves. An average household derived about US$ 107 per annum worth of livelihood support per year. In comparison to the average family income in this area of US$ 603 per annum, the dependence on ecosystem
Chopra et al. (2010) examined the ecological loss due to biodiversity decline in the Sundarbans driven by over-extraction of shrimp larvae. The biodiversity decline is perpetuated by aquaculture farms, which acquire seedlings from the wild, and thereby deny the natural ecosystem of the shrimp larvae. This decline in shrimp in the natural ecosystem
feed on shrimps.While direct market methods are often used to estimate
provisioning services, Jyotish and Iyengar (2007) considered the regulating service provided by the coastal zones by way of soil salinity prevention to agricultural farms in Gujarat. They examined the differences in agricultural productivity in two areas – one where there is salinity ingress and another where
64
THE ECONOMICS OF ECOSYSTEMS AND BIODIVERSITY
INDIA INITIATIVE
there is no ingress, and found that the per acre cost of salinity ingress ranges between ` 72,221 to ` 98,145 (depending on the discount rate). Their study did not undertake valuation of ecosystem services, but their estimates are an indicator of the value of the regulatory services that nature provides by preventing salinity ingress.
Apart from application of direct market techniques, there have been some studies that use non-market valuation techniques. A study based in Kendrapada, Odisha on the storm-protection services of mangroves during the Super Cyclone of 1999 suggests that mangroves reduced loss of human life, house damage, livestock damage, etc. Their cost-
to reconvert land surface which earlier had been under mangrove cover (Das and Vincent, 2009). If house damage
per hectare of forests (Das, 2009). Further, 94% of the human death toll in Kendrapada district due to a super cyclone could have been avoided if the mangroves were conserved as they existed in the 1940s (Das, 2007). It has also been shown that mangroves provide storm protection from cyclonic wind in addition to protection from storm surges (Das and Crepin, 2013), which establishes that ecosystem services of
coastal resources could be much wider than what has been discovered so far.
The travel cost method has been applied in India to coastal and marine areas. For example, to estimate the recreation value of the Indian Sundarbans, which is a UNESCO World Heritage and also a Ramsar site, Guha and Ghosh (2007) used a zonal travel cost method to estimate the annual recreational value to Indian citizens of the Indian segment of the Sundarbans and found that it amounts to approximately US$ 377,000 (in the year 2006). Their study suggested that by hiking the entry fees to Sundarbans park, the authorities could raise revenues amounting to US$ 0.12 million per year. This would be useful for improving park maintenance.
In a study based in Gujarat, Hirway and Goswami
mangroves. They found that the direct use value (2003 prices) of mangroves was `1,603 million, and the indirect use value was `2,858 million per year. The total use value (direct and indirect) of mangroves was estimated at `7,731.3 million per year (2003 prices).
In recognition of the critical role that coastal and marine ecosystems play in human well-being, Marine
CR
ED
IT
65
CHAPTER 4
COASTAL & MARINE ECOSYSTEMS
oceans. In India, while considerable conservation efforts have been made to protect terrestrial areas (especially forests), marine protection is yet to see similar focus. The Coastal Zone Regulation Act provides a degree of protection, but its implementation is not uniform across different States. There is an urgent need to address coastal and marine ecosystem management issues that are beyond the Coastal Zone Management bill, which received a mixed response from the public and different stakeholders. The discussion with stakeholders needs to be based on independent evaluation of the ecosystem services.
Managing marine and coastal ecosystems requires an understanding of the socio-ecological systems and their inter-connections. We need suitable mechanisms to incorporate our knowledge on thresholds and regime shifts into our policies. Management strategies must complement
social concerns of distribution, equity and justice.The valuation literature in marine and coastal
this is the comparative lack of relevant natural science and socio-economic data. This is true not only for India, but
extrapolate values from other parts of the world but these need to be done with care as it could lead to inaccuracies (see Beaumont et al., 2006). Some of the values that have been
of methodology. Scaling up from micro-studies to macro-region has limitations. They do not account for regional
stocks are straddling and highly migrating and move across several administrative boundaries and international borders, therefore raising accounting problems.
Valuation of natural resources is expected to help better management of sustainable use and social allocation. Under-valuation can cause excessive extraction whereas over-valuation would result in under-utilisation. Given the
methodological limitations, there are restrictions on doing valuation satisfactorily, as many of the non-market valuation techniques are not proven. Within the domain of valuation techniques, revealed preference methods are considered more reliable and robust and nearest to market valuation. Stated preference methods remain controversial despite the large body of literature that has now been accumulated.
problems. Over-extraction of resource today may be
for balancing the needs of the current generation against that of the future.
For valuation, it is “marginal” values that are required rather than aggregated values. As “marginal” values are surrounded by uncertainties of threshold effects, judging “marginal” effect is not straightforward. A likely complication of collecting “marginal” values would be due to non-linearity between critical habitat variables and changes in ecosystem services. For instance, fringe mangroves may cause small
such non-linear functions of marginal losses are hard to collect. Another challenge is to identify sources of double
counting. Nutrient recycling, for example, will support a series of outcomes such as clean water, better support to life systems, higher productivity, etc. It should be kept in mind that economic values relate to end products, and not to nutrient recycling per se. It is important that the full range of complementary and competitive services are distinguished before initiating valuation.
Given the need for understanding the value of ecosystems and the wide differences in the available estimates, this is an area that will continue to engage researchers. Economic valuation will remain a challenging enterprise as it will have to negotiate with ecological non-linearity, uncertainties, existence of ecological thresholds, and conceptualization of resilience in the social context. Even if well executed micro-studies are available, there would remain the issue of scaling up values of ecosystem services.
4.6 TII for coastal and marine ecosystems: An approach
TII for coastal and marine ecosystems aims at demonstrating pathways for mainstreaming the diverse range of ecosystem service values in developmental planning and decision making. Towards this objective, TII intends to build evidence base from assessments, in the form of pilot projects, centered on key challenges associated with management of coastal and marine ecosystems. A summary of these projects is given in Table 3.
A sectoral synthesis will be developed, building
recommendations for improving integration of coastal and marine ecosystem values within the current programmes of the Ministry of Environment, Forests and Climate Change (MoEFCC). The following thematic areas are the focus of sectoral synthesis:
and ecosystem services.
66
THE ECONOMICS OF ECOSYSTEMS AND BIODIVERSITY
INDIA INITIATIVE
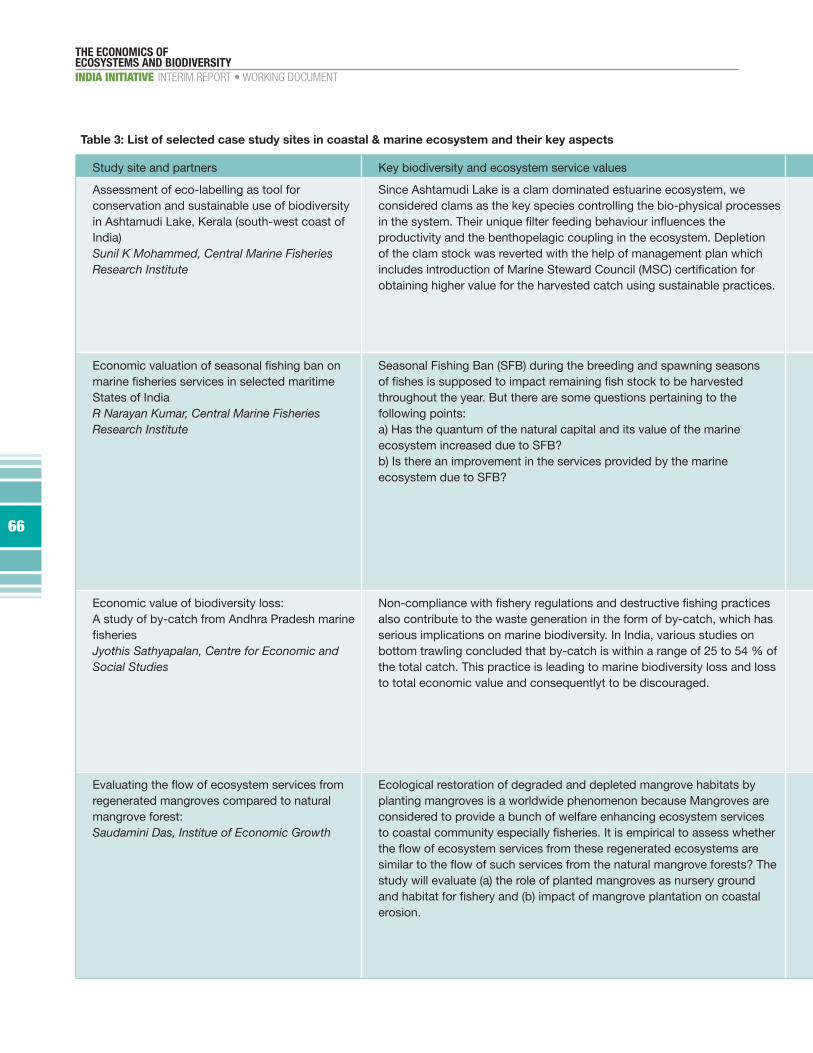
Table 3: List of selected case study sites in coastal & marine ecosystem and their key aspects
Study site and partners Key biodiversity and ecosystem service values
Assessment of eco-labelling as tool for conservation and sustainable use of biodiversity in Ashtamudi Lake, Kerala (south-west coast of India) Sunil K Mohammed, Central Marine Fisheries Research Institute
Since Ashtamudi Lake is a clam dominated estuarine ecosystem, we considered clams as the key species controlling the bio-physical processes
productivity and the benthopelagic coupling in the ecosystem. Depletion of the clam stock was reverted with the help of management plan which
obtaining higher value for the harvested catch using sustainable practices.
States of India R Narayan Kumar, Central Marine Fisheries Research Institute
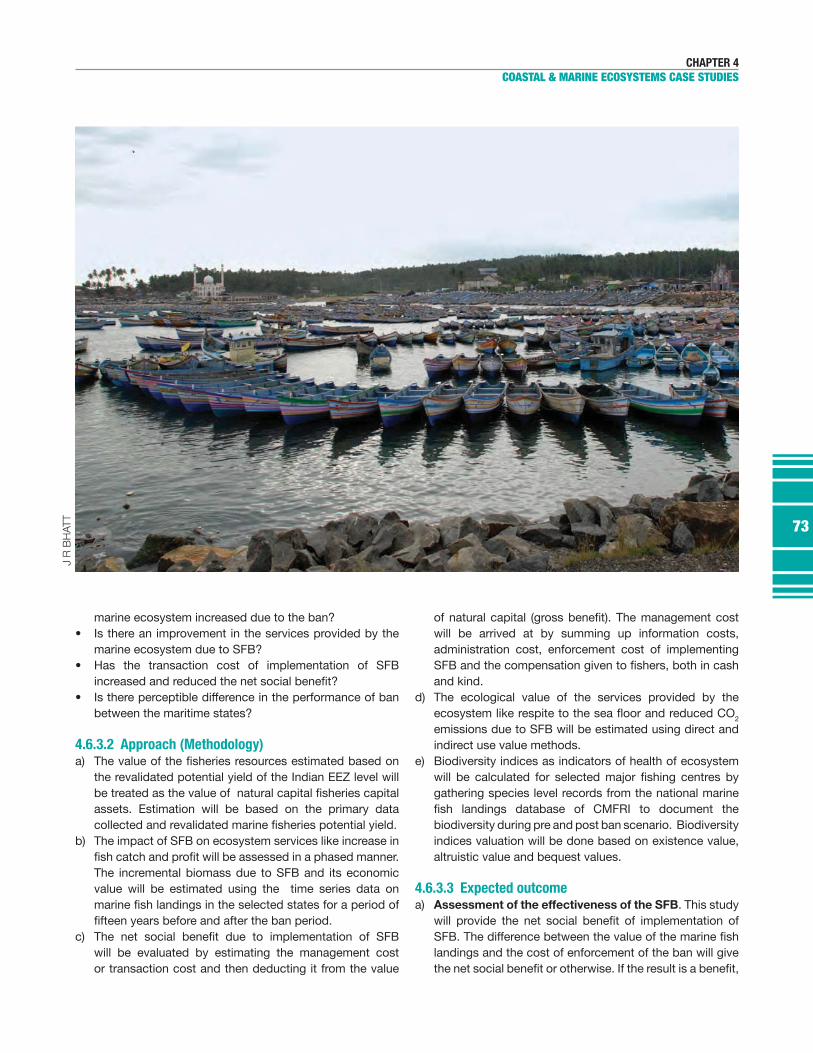
Seasonal Fishing Ban (SFB) during the breeding and spawning seasons
throughout the year. But there are some questions pertaining to the following points: a) Has the quantum of the natural capital and its value of the marineecosystem increased due to SFB? b) Is there an improvement in the services provided by the marineecosystem due to SFB?
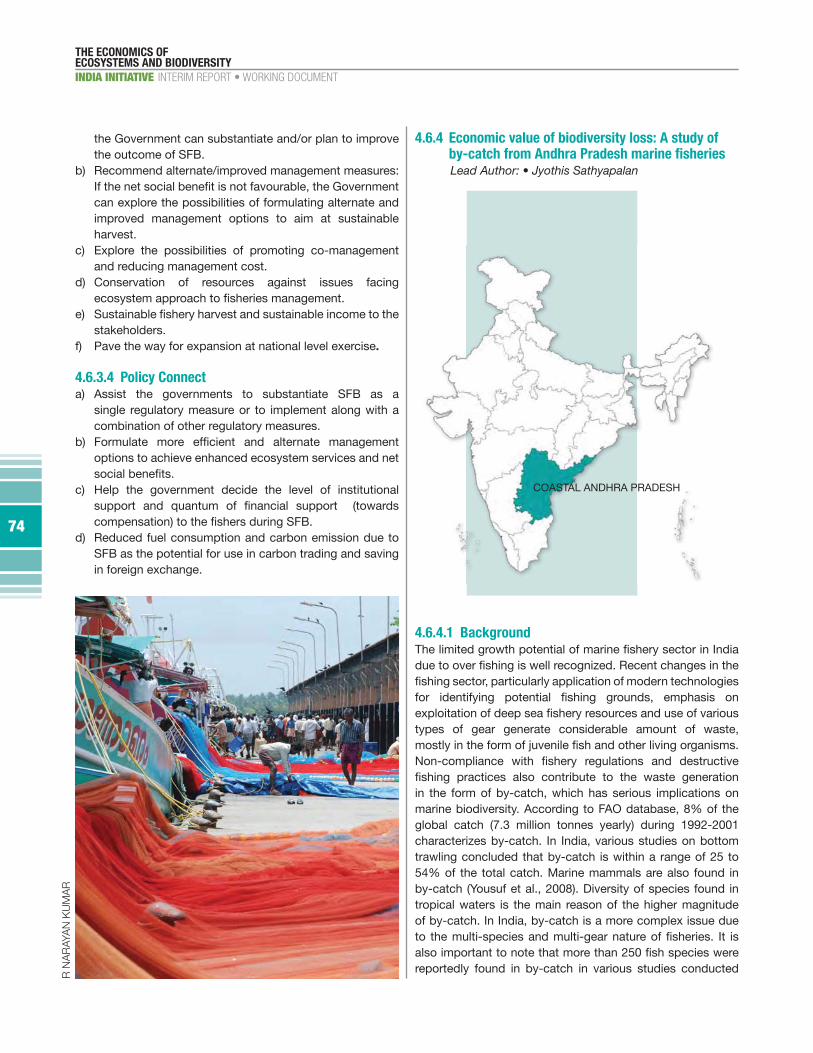
Economic value of biodiversity loss: A study of by-catch from Andhra Pradesh marine
Jyothis Sathyapalan, Centre for Economic and Social Studies
also contribute to the waste generation in the form of by-catch, which has serious implications on marine biodiversity. In India, various studies on bottom trawling concluded that by-catch is within a range of 25 to 54 % of the total catch. This practice is leading to marine biodiversity loss and loss to total economic value and consequentlyt to be discouraged.
regenerated mangroves compared to natural mangrove forest: Saudamini Das, Institue of Economic Growth
Ecological restoration of degraded and depleted mangrove habitats by planting mangroves is a worldwide phenomenon because Mangroves are considered to provide a bunch of welfare enhancing ecosystem services
study will evaluate (a) the role of planted mangroves as nursery ground
erosion.
67
CHAPTER 4
COASTAL & MARINE ECOSYSTEMS
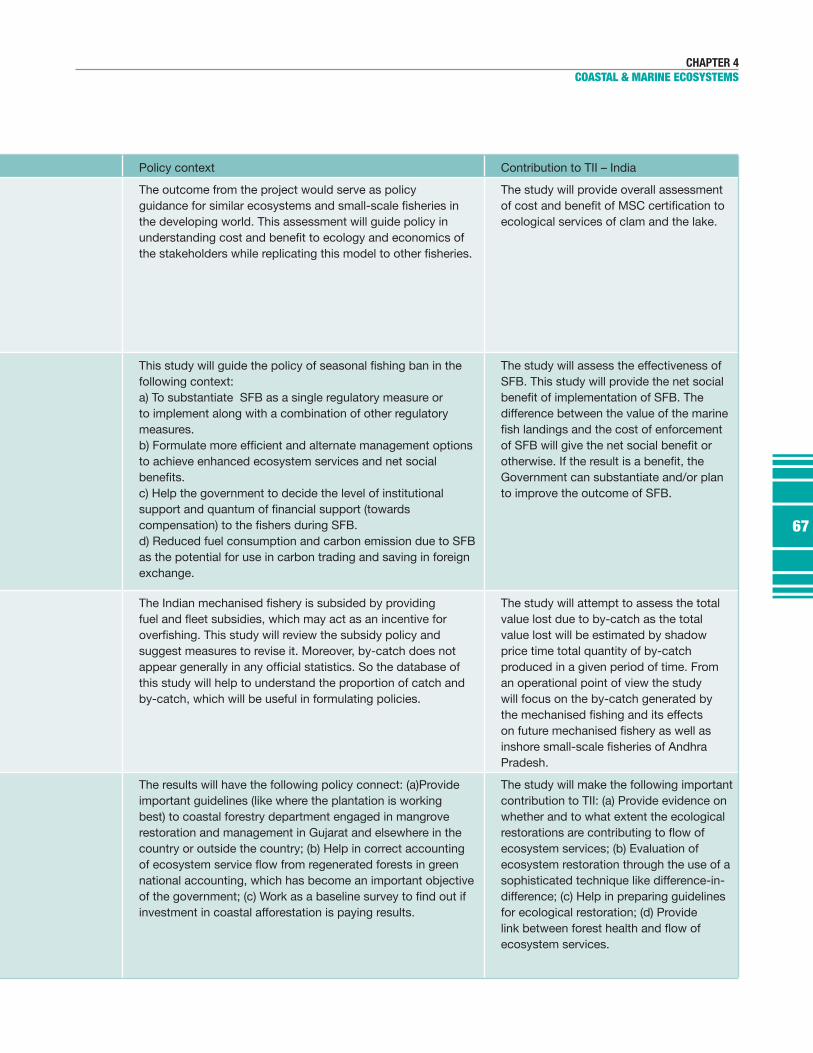
Policy context Contribution to TII – India
The outcome from the project would serve as policy
the developing world. This assessment will guide policy in
The study will provide overall assessment
ecological services of clam and the lake.
following context: a) To substantiate SFB as a single regulatory measure orto implement along with a combination of other regulatory measures.
to achieve enhanced ecosystem services and net social
c) Help the government to decide the level of institutional
d) Reduced fuel consumption and carbon emission due to SFBas the potential for use in carbon trading and saving in foreign exchange.
The study will assess the effectiveness of SFB. This study will provide the net social
difference between the value of the marine
Government can substantiate and/or plan to improve the outcome of SFB.
suggest measures to revise it. Moreover, by-catch does not
this study will help to understand the proportion of catch and by-catch, which will be useful in formulating policies.
The study will attempt to assess the total value lost due to by-catch as the total value lost will be estimated by shadow price time total quantity of by-catch produced in a given period of time. From an operational point of view the study will focus on the by-catch generated by
Pradesh.
The results will have the following policy connect: (a)Provide important guidelines (like where the plantation is working best) to coastal forestry department engaged in mangrove restoration and management in Gujarat and elsewhere in the country or outside the country; (b) Help in correct accounting
national accounting, which has become an important objective
investment in coastal afforestation is paying results.
The study will make the following important contribution to TII: (a) Provide evidence on whether and to what extent the ecological
ecosystem services; (b) Evaluation of ecosystem restoration through the use of a sophisticated technique like difference-in-difference; (c) Help in preparing guidelines for ecological restoration; (d) Provide
ecosystem services.
68
THE ECONOMICS OF ECOSYSTEMS AND BIODIVERSITY
INDIA INITIATIVE
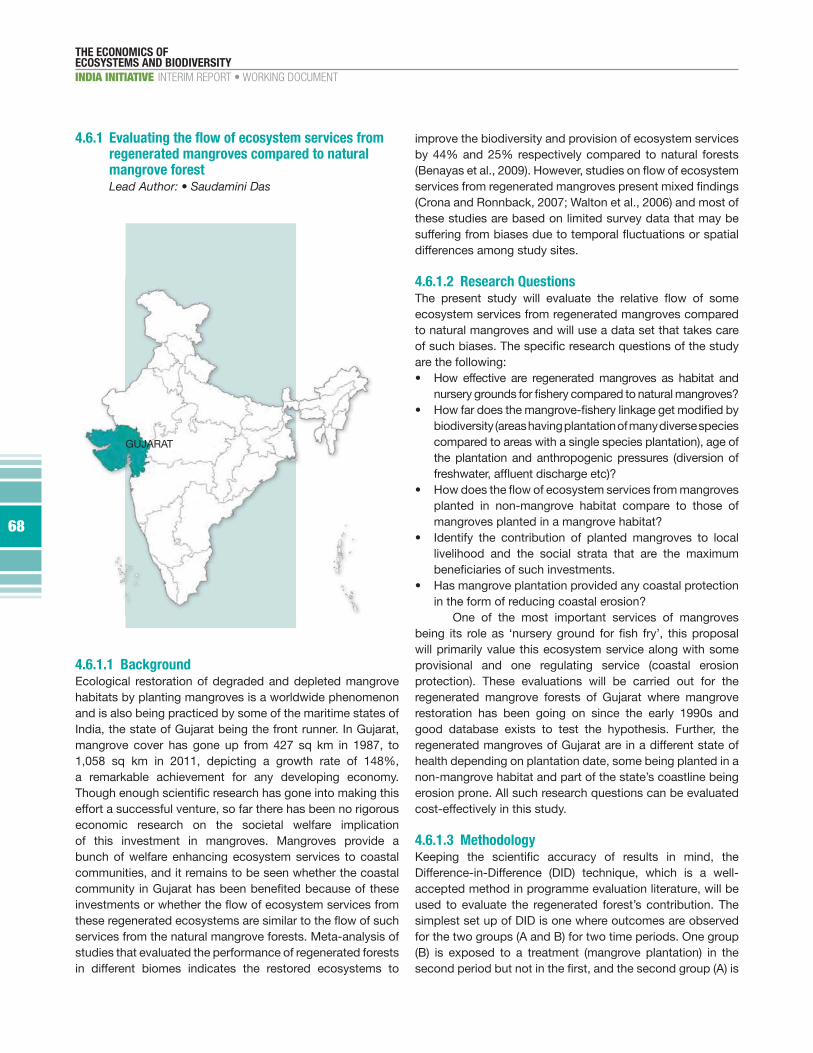
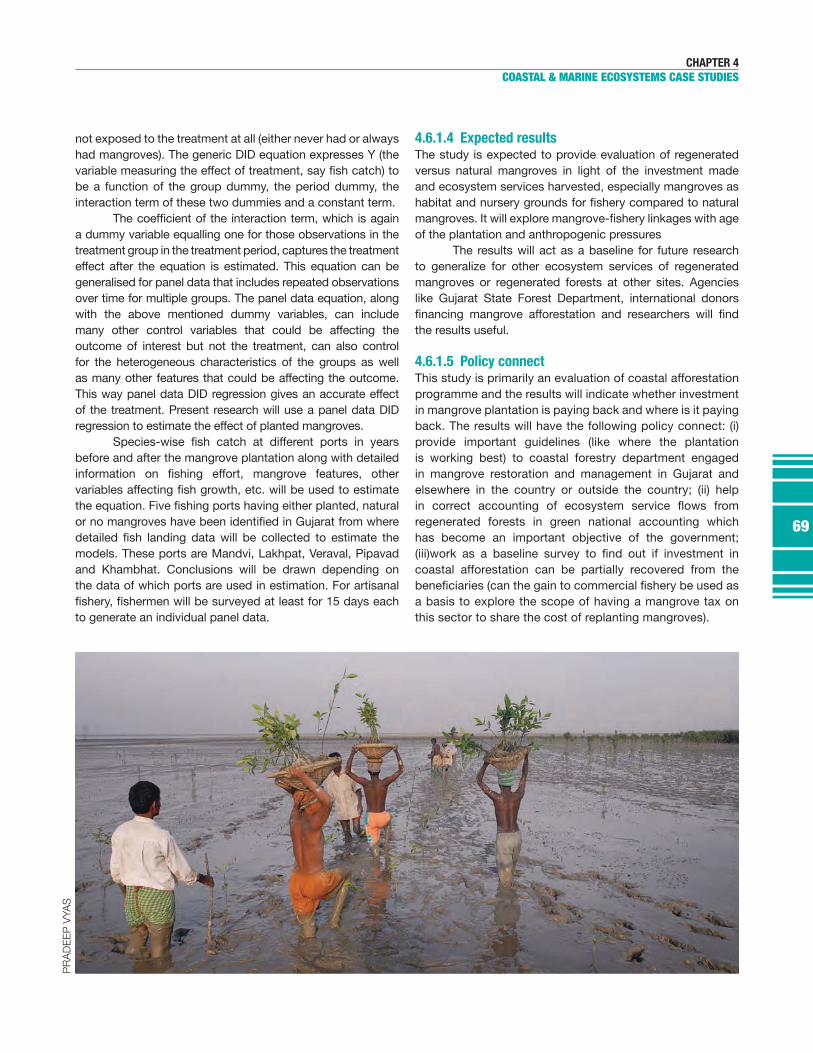
4.6.1 Evaluating the flow of ecosystem services from regenerated mangroves compared to natural mangrove forest
4.6.1.1 BackgroundEcological restoration of degraded and depleted mangrove habitats by planting mangroves is a worldwide phenomenon and is also being practiced by some of the maritime states of India, the state of Gujarat being the front runner. In Gujarat, mangrove cover has gone up from 427 sq km in 1987, to 1,058 sq km in 2011, depicting a growth rate of 148%, a remarkable achievement for any developing economy.
effort a successful venture, so far there has been no rigorous economic research on the societal welfare implication of this investment in mangroves. Mangroves provide a bunch of welfare enhancing ecosystem services to coastal communities, and it remains to be seen whether the coastal
services from the natural mangrove forests. Meta-analysis of studies that evaluated the performance of regenerated forests in different biomes indicates the restored ecosystems to
improve the biodiversity and provision of ecosystem services by 44% and 25% respectively compared to natural forests ( ecosystem services(Crona and Ronnback, 2007; Walton et al., 2006) and most of these studies are based on limited survey data that may be
differences among study sites.
4.6.1.2 Research Questions
ecosystem services from regenerated mangroves compared to natural mangroves and will use a data set that takes care of such biases. are the following:
biodiversity (areas having plantation of many diverse speciescompared to areas with a single species plantation), age ofthe plantation and anthropogenic pressures (diversion of
planted in non-mangrove habitat compare to those ofmangroves planted in a mangrove habitat?
livelihood and the social strata that are the maximum
in the form of reducing coastal erosion?One of the most important services of mangroves
will primarily value this ecosystem service along with some provisional and one regulating service (coastal erosion protection). These evaluations will be carried out for the regenerated mangrove forests of Gujarat where mangrove restoration has been going on since the early 1990s and good database exists to test the hypothesis. Further, the regenerated mangroves of Gujarat are in a different state of health depending on plantation date, some being planted in a
erosion prone. All such research questions can be evaluated cost-effectively in this study.
4.6.1.3 Methodology
Difference-in-Difference (DID) technique, which is a well-accepted method in programme evaluation literature, will be
simplest set up of DID is one where outcomes are observed for the two groups (A and B) for two time periods. One group (B) is exposed to a treatment (mangrove plantation) in the
GUJARAT
69
CHAPTER 4
COASTAL & MARINE ECOSYSTEMS CASE STUDIES
not exposed to the treatment at all (either never had or always had mangroves). The generic DID equation expresses Y (the
be a function of the group dummy, the period dummy, the interaction term of these two dummies and a constant term.
a dummy variable equalling one for those observations in the treatment group in the treatment period, captures the treatment effect after the equation is estimated. This equation can be generalised for panel data that includes repeated observations over time for multiple groups. The panel data equation, along with the above mentioned dummy variables, can include many other control variables that could be affecting the outcome of interest but not the treatment, can also control for the heterogeneous characteristics of the groups as well as many other features that could be affecting the outcome. This way panel data DID regression gives an accurate effect of the treatment. Present research will use a panel data DID regression to estimate the effect of planted mangroves.
before and after the mangrove plantation along with detailed
models. These ports are Mandvi, Lakhpat, Veraval, Pipavad and Khambhat. Conclusions will be drawn depending on the data of which ports are used in estimation. For artisanal
to generate an individual panel data.
4.6.1.4 Expected resultsThe study is expected to provide evaluation of regenerated versus natural mangroves in light of the investment made and ecosystem services harvested, especially mangroves as
of the plantation and anthropogenic pressures The results will act as a baseline for future research
to generalize for other ecosystem services of regenerated mangroves or regenerated forests at other sites. Agencies like Gujarat State Forest Department, international donors
the results useful.
4.6.1.5 Policy connectThis study is primarily an evaluation of coastal afforestation programme and the results will indicate whether investment in mangrove plantation is paying back and where is it paying back. The results will have the following policy connect: (i)provide important guidelines (like where the plantation is working best) to coastal forestry department engaged in mangrove restoration and management in Gujarat and elsewhere in the country or outside the country; (ii) help
regenerated forests in green national accounting which has become an important objective of the government;
coastal afforestation can be partially recovered from the
a basis to explore the scope of having a mangrove tax on this sector to share the cost of replanting mangroves).
70
THE ECONOMICS OF ECOSYSTEMS AND BIODIVERSITY
INDIA INITIATIVE
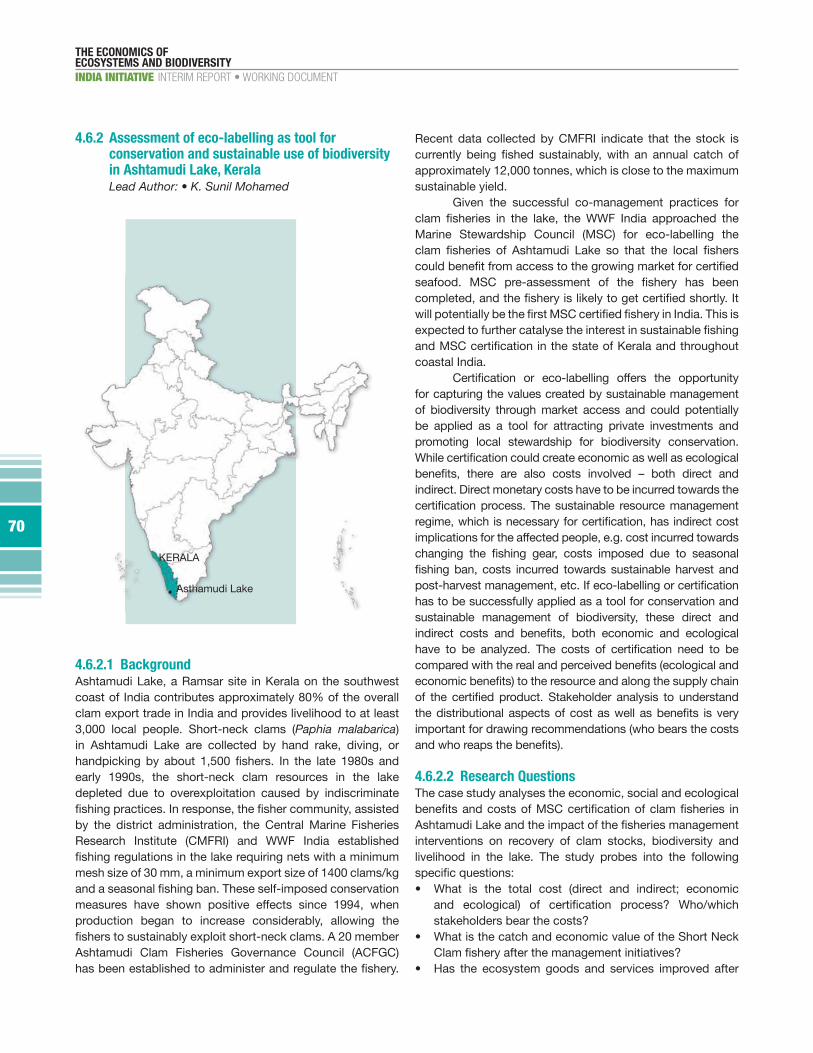
4.6.2 Assessment of eco-labelling as tool for conservation and sustainable use of biodiversity in Ashtamudi Lake, Kerala
4.6.2.1 BackgroundAshtamudi Lake, a Ramsar site in Kerala on the southwest coast of India contributes approximately 80% of the overall clam export trade in India and provides livelihood to at least 3,000 local people. Short-neck clams (Paphia malabarica) in Ashtamudi Lake are collected by hand rake, diving, or
early 1990s, the short-neck clam resources in the lake depleted due to overexploitation caused by indiscriminate
by the district administration, the Central Marine Fisheries Research Institute (CMFRI) and WWF India established
mesh size of 30 mm, a minimum export size of 1400 clams/kg
measures have shown positive effects since 1994, when production began to increase considerably, allowing the
Ashtamudi Clam Fisheries Governance Council (ACFGC)
Recent data collected by CMFRI indicate that the stock is
approximately 12,000 tonnes, which is close to the maximum sustainable yield.
Given the successful co-management practices for
Marine Stewardship Council (MSC) for eco-labelling the
coastal India.
for capturing the values created by sustainable management of biodiversity through market access and could potentially be applied as a tool for attracting private investments and promoting local stewardship for biodiversity conservation.
indirect. Direct monetary costs have to be incurred towards the
implications for the affected people, e.g. cost incurred towards
has to be successfully applied as a tool for conservation and sustainable management of biodiversity, these direct and
important for drawing recommendations (who bears the costs
4.6.2.2 Research QuestionsThe case study analyses the economic, social and ecological
interventions on recovery of clam stocks, biodiversity and livelihood in the lake. The study probes into the following
stakeholders bear the costs?
Asthamudi Lake
KERALA
71
CHAPTER 4
COASTAL & MARINE ECOSYSTEMS CASE STUDIES
the management initiative? Who has lost out?
ecosystem and economic value of the Lake as a whole?
4.6.2.3 Study approachThe study attempts a pre and post management intervention comparison on the following aspects:
Ashtamudi Lake.
by clams in the Lake.
fauna in the Lake.
Lake.
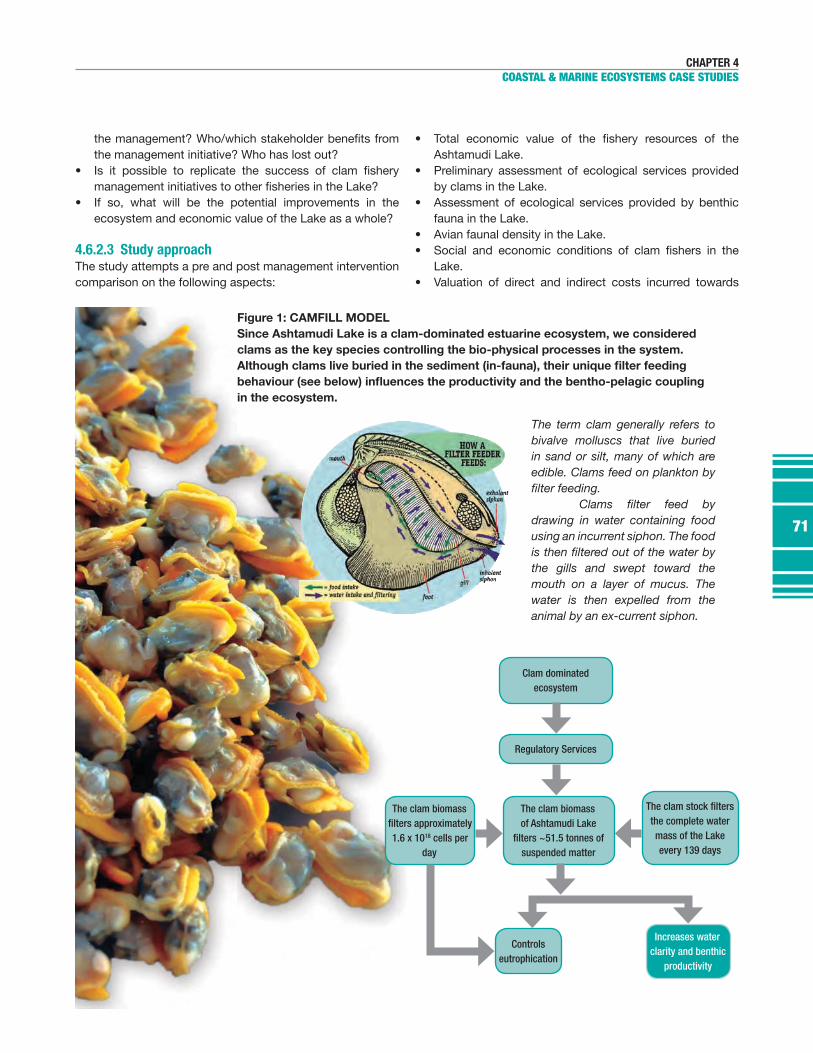
The term clam generally refers to bivalve molluscs that live buried in sand or silt, many of which are
drawing in water containing food
the gills and swept toward the
water is then expelled from the
Clam dominated ecosystem
Regulatory Services
Controls eutrophication
Increases water clarity and benthic
productivity
The clam biomass of Ashtamudi Lake
filters ~51.5 tonnes of suspended matter
The clam biomass filters approximately 1.6 x 10¹⁸ cells per
day
The clam stock filters the complete water mass of the Lake every 139 days
Figure 1: CAMFILL MODEL Since Ashtamudi Lake is a clam-dominated estuarine ecosystem, we considered clams as the key species controlling the bio-physical processes in the system.
in the ecosystem.
72
THE ECONOMICS OF ECOSYSTEMS AND BIODIVERSITY
INDIA INITIATIVE
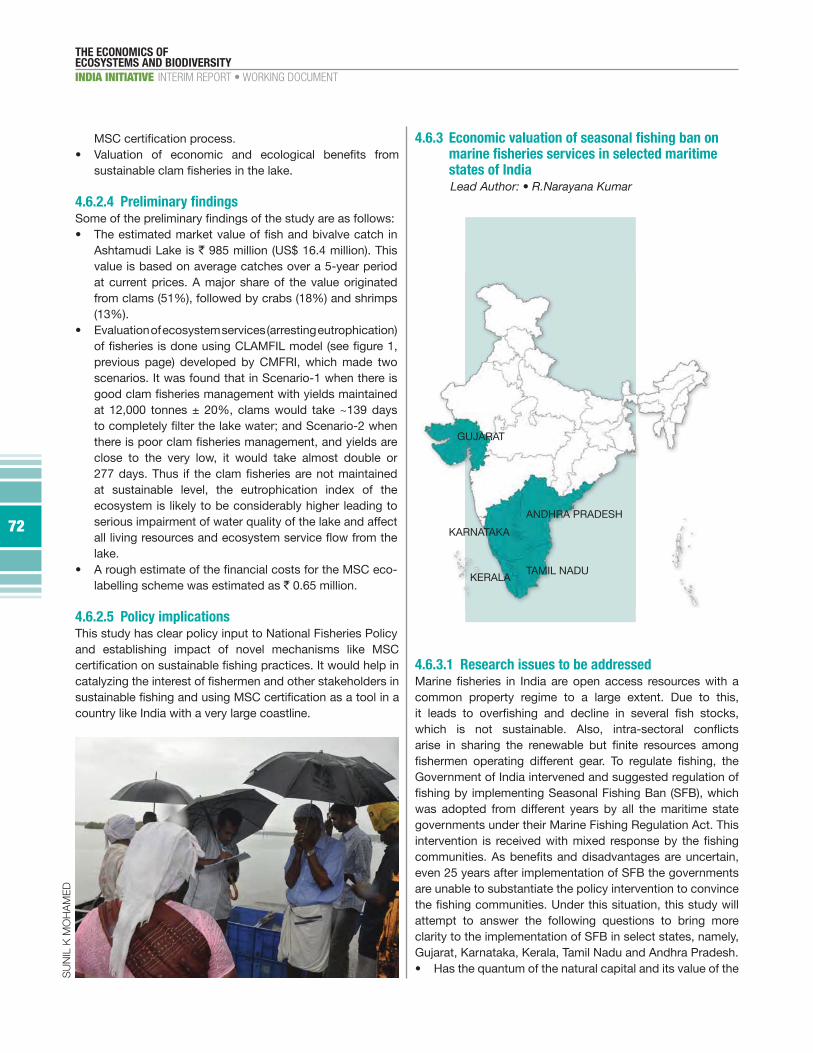
4.6.3 Economic valuation of seasonal fishing ban on marine fisheries services in selected maritime states of India
4.6.3.1 Research issues to be addressed
common property regime to a large extent. Due to this,
Government of India intervened and suggested regulation of
was adopted from different years by all the maritime state governments under their Marine Fishing Regulation Act. This
even 25 years after implementation of SFB the governments are unable to substantiate the policy intervention to convince
attempt to answer the following questions to bring more clarity to the implementation of SFB in select states, namely, Gujarat, Karnataka, Kerala, Tamil Nadu and Andhra Pradesh.
4.6.2.4 Preliminary findings
Ashtamudi Lake is ` 985 million (US$ 16.4 million). This value is based on average catches over a 5-year period at current prices. A major share of the value originated from clams (51%), followed by crabs (18%) and shrimps (13%).
previous page) developed by CMFRI, which made two scenarios. It was found that in Scenario-1 when there is
at 12,000 tonnes ± 20%, clams would take ~139 days
close to the very low, it would take almost double or
at sustainable level, the eutrophication index of the ecosystem is likely to be considerably higher leading to serious impairment of water quality of the lake and affect
lake.
labelling scheme was estimated as ` 0.65 million.
4.6.2.5 Policy implicationsThis study has clear policy input to National Fisheries Policy and establishing impact of novel mechanisms like MSC
country like India with a very large coastline.
GUJARAT
ANDHRA PRADESH
KARNATAKA
TAMIL NADUKERALA
73
CHAPTER 4
COASTAL & MARINE ECOSYSTEMS CASE STUDIES
marine ecosystem increased due to the ban?
marine ecosystem due to SFB?
between the maritime states?
4.6.3.2 Approach (Methodology)
the revalidated potential yield of the Indian EEZ level will
assets. Estimation will be based on the primary data
b) The impact of SFB on ecosystem services like increase in
The incremental biomass due to SFB and its economicvalue will be estimated using the time series data on
will be evaluated by estimating the management costor transaction cost and then deducting it from the value
will be arrived at by summing up information costs, administration cost, enforcement cost of implementing
and kind.d) The ecological value of the services provided by the
2 emissions due to SFB will be estimated using direct and indirect use value methods.
e) Biodiversity indices as indicators of health of ecosystem
gathering species level records from the national marine
biodiversity during pre and post ban scenario. Biodiversity indices valuation will be done based on existence value,altruistic value and bequest values.
4.6.3.3 Expected outcomea) Assessment of the effectiveness of the SFB. This study
landings and the cost of enforcement of the ban will give
74
THE ECONOMICS OF ECOSYSTEMS AND BIODIVERSITY
INDIA INITIATIVE
74
4.6.4 Economic value of biodiversity loss: A study of by-catch from Andhra Pradesh marine fisheries
4.6.4.1 Background
types of gear generate considerable amount of waste,
in the form of by-catch, which has serious implications on marine biodiversity. According to FAO database, 8% of the global catch (7.3 million tonnes yearly) during 1992-2001 characterizes by-catch. In India, various studies on bottom trawling concluded that by-catch is within a range of 25 to 54% of the total catch. Marine mammals are also found in by-catch (Yousuf et al., 2008). Diversity of species found in tropical waters is the main reason of the higher magnitude of by-catch. In India, by-catch is a more complex issue due
reportedly found in by-catch in various studies conducted
COASTAL ANDHRA PRADESH
the Government can substantiate and/or plan to improve the outcome of SFB.
b) Recommend alternate/improved management measures:
can explore the possibilities of formulating alternate andimproved management options to aim at sustainableharvest.
c) Explore the possibilities of promoting co-managementand reducing management cost.
d) Conservation of resources against issues facing
stakeholders.f) Pave the way for expansion at national level exercise.
4.6.3.4 Policy Connect a) Assist the governments to substantiate SFB as a
single regulatory measure or to implement along with a combination of other regulatory measures.
options to achieve enhanced ecosystem services and net
c) Help the government decide the level of institutional
d) Reduced fuel consumption and carbon emission due toSFB as the potential for use in carbon trading and savingin foreign exchange.
75
CHAPTER 4
COASTAL & MARINE ECOSYSTEMS CASE STUDIES
75
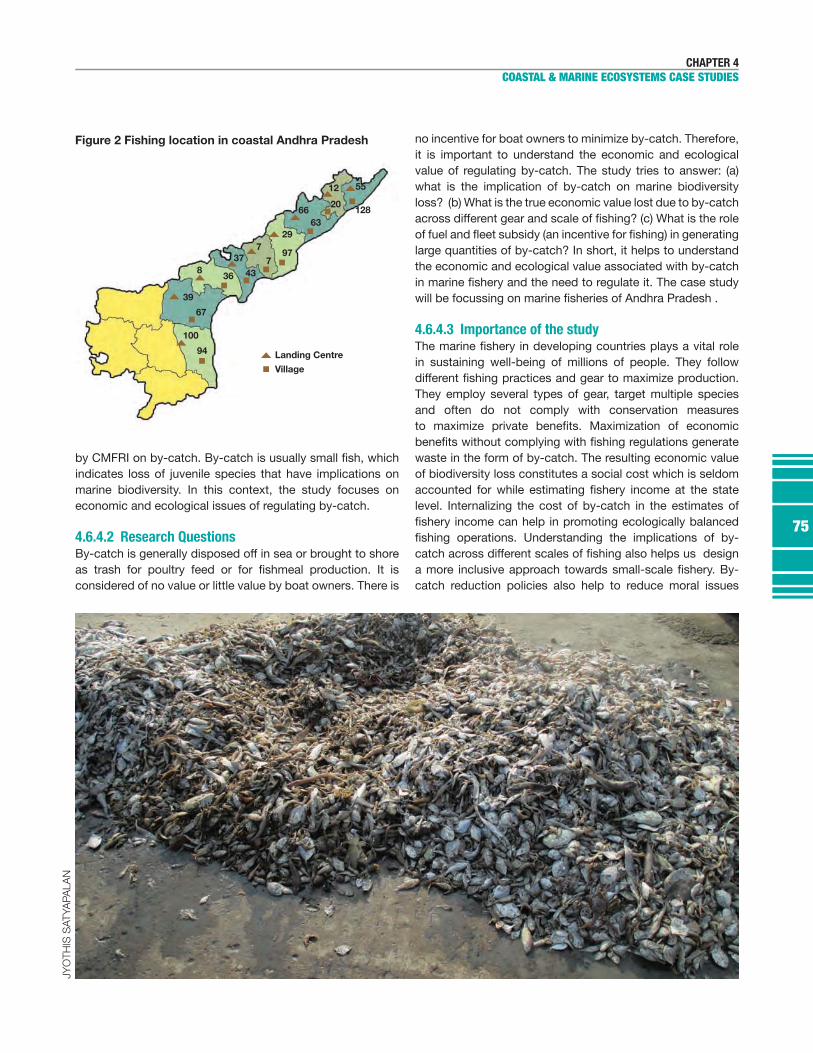
indicates loss of juvenile species that have implications on marine biodiversity. In this context, the study focuses on economic and ecological issues of regulating by-catch.
4.6.4.2 Research QuestionsBy-catch is generally disposed off in sea or brought to shore
considered of no value or little value by boat owners. There is
no incentive for boat owners to minimize by-catch. Therefore, it is important to understand the economic and ecological value of regulating by-catch. The study tries to answer: (a) what is the implication of by-catch on marine biodiversity loss? (b) What is the true economic value lost due to by-catch
large quantities of by-catch? In short, it helps to understand the economic and ecological value associated with by-catch
4.6.4.3 Importance of the study
in sustaining well-being of millions of people. They follow
They employ several types of gear, target multiple species and often do not comply with conservation measures
waste in the form of by-catch. The resulting economic value of biodiversity loss constitutes a social cost which is seldom
level. Internalizing the cost of by-catch in the estimates of
catch reduction policies also help to reduce moral issues
100
94
67
39
836 43
37 7
729
97
6663
12
20
55
128
Landing Centre
Village
Figure 2 Fishing location in coastal Andhra Pradesh
76
THE ECONOMICS OF ECOSYSTEMS AND BIODIVERSITY
INDIA INITIATIVE
76
large counter parts. Therefore, this study is important from the perspective of income accounting, formulating marine policies based on incentive mechanisms, and for adopting an
4.6.4.4 Methodology
multiple outcomes. It produces food, creates employment, and affects ecosystem and biodiversity and well-being of aquatic life. Biodiversity loss can arise if the joint outputs are generated in a wrong proportion that exhibits the characteristics of externalities because it is a welfare reducing output for which limited or no market exists. The negative joint outputs of the
1997). Therefore, forgone income associated with by-catch constitutes an important measure of value lost.
catch constitute part of the value lost. This is resulting
which they may form the key target species. Empirically, this can be worked out based on the number of juveniles that would have survived to harvestable age, and the proportion that would have been caught in other (e.g. inshore small-
is a summation of current and future value lost through by-catch. The total value lost due to by-catch can be estimated as the total quantity of by-catch multiplied by the shadow
of estimating the value lost. Then the total value lost will be estimated by shadow price time total quantity of by-catch produced in a given period of time. From an operational point of view the study will focus on the by-catch generated by
Pradesh. This study uses sample data collected during June
sampling, we conducted 4 sample surveys during this period in monsoon, winter, summer and ban periods. Total number
57 landing centres and 4 harbours, which provides species-
data on gear, crafts and fuel consumption. Additional data on species composition of by-catch will be collected this year to understand the species diversity in detail. Following the methodology developed by CMFRI (Srinath et al., 2005), we provide a global estimate for catch and by-catch for Andhra Pradesh using the above said data basis. Moreover, this study also provides a model to evaluate the trade-offs (shadow prices) involved in the selection of alternative policy
by-catch of all species and (b) maximizing total catch by developing an optimization model.
4.6.4.5 Expected outcomeIn India, most of the research on by-catch focuses on biological and technological aspects (Sujatha, 1996; Zacharia et al., 2006; Boopendranath, 2007 and 2009; Boopendranath et al., 2008; Gibinkumar et al., 2012; Yousuf et al., 2008; Kizhakudan et al., 2013) An important observation of these studies is that by-catch is a more complex issue in India
There are less studies focusing on economic valuation of biodiversity loss due to by-catch. This study will add value to the literature on by-catch focusing on economic valuation. As far as policy is concerned, measures to reduce by-catch generally focused on technical solutions. These include measures such as regulating mesh sizes and by-catch reduction devises attached to the gear. However, it is realised that policy measures should also focus on the economic
study will review the subsidy policy and suggest measures to revise it. Moreover, by-catch does not appear generally in
to understand the proportion of catch and by-catch, which will be useful in formulating policies.
Introduction of any polices create many losers and gainers. Since we focus on by-catch across different gear and scale
there by higher contribution to value lost. They might be the losers while revising policies to internalise these values. On
contribute towards revising Indian marine policy, which is under review.