pulmonary embolism: diagnostic algorithms - registro ep polmonare/01_favretto... · pulmonary...
TRANSCRIPT
799
Introduction
In 2005, the diagnosis of acute pul-monary embolism (PE) still remains a com-mon, major, vexing and elusive clinicalproblem. The ideal diagnostic test shouldbe accurate, safe, readily available, easy tointerpret and cost-effective. Unfortunately,none of the available tests meets all thesecriteria. This holds true for pulmonary an-giography as well, that has been generallyconsidered the “gold standard” in the diag-nostic work-up of PE.
Clinical suspicion of pulmonaryembolism
In 90% of cases the “clinical suspicionof PE” is raised by clinical signs and symp-toms, especially if patients present withclinical evidence of deep venous thrombo-sis or at risk for venous thromboembolism.Only in 10% of cases, PE is suspected be-cause of incidental electrocardiographic orarterial blood gas analysis or radiologicalfindings (chest X-ray or helical computedtomography).
Approximately 25-30% of patients withclinically suspected PE really have PE1.
In the context of a recent trial2 whichenrolled 756 consecutive patients with clin-ically suspected PE collected from theemergency departments of three teachinghospitals, the prevalence of PE was 26%.
The clinical signs and symptoms aloneof PE are non-specific; as a consequencethe clinical diagnosis of PE is very often in-accurate. In order to improve clinical accu-racy, it is therefore necessary to use addi-tional tests which include imaging tech-niques.
First-level tests (first-line diagnostictests), available in all hospitals, readily andeasily performed, are the following: elec-trocardiography, arterial blood gas analysis,and chest X-ray. Unfortunately the diagnos-tic value of each test is poor (Table I)3,4.
Clinical probability or pre-testprobability
The combination of all these variables(risk factors for venous thromboem-bolism or documented deep venousthrombosis, signs or symptoms sugges-tive of PE, results of first-level tests) al-lows a fairly accurate stratification of pa-tients with “clinical suspicion of PE” in
Key words:Diagnostic algorithms;Diagnostic strategy;Pulmonary embolism.
© 2005 CEPI Srl
Address:
Dr. Giuseppe Favretto
U.O. di CardiologiaRiabilitativa e PreventivaOspedale Riabilitativodi Alta SpecializzazioneVia Padre Bello, 331045 Motta di Livenza (TV)E-mail:[email protected]
Pulmonary embolism: diagnostic algorithmsGiuseppe Favretto, Paolo Stritoni*
Division of Cardiac Rehabilitation, Rehabilitation Hospital, Motta di Livenza (TV), *Division of Cardiology,General Hospital, Treviso, Italy
In 90% of cases the clinical suspicion of pulmonary embolism (PE) is raised by clinical signs andsymptoms, while in only 10% of cases PE is suspected on the basis of electrocardiographic, arterialblood gas analysis or radiological findings.
The combination of clinical signs and symptoms and the results of first-level diagnostic tests (elec-trocardiography, gas analysis and chest X-ray) allows a fairly accurate classification of patients with“clinical suspicion of PE” into three categories of clinical (or pre-test) probability: low, intermediateand high.
The clinical diagnosis of PE is very often inaccurate making the use of additional tests, includingimaging techniques, mandatory.
The choice and the combination (= diagnostic algorithms) of second- and third-level diagnostictests (D-dimer, venous ultrasound, echocardiography, lung scintigraphy, helical computed tomogra-phy and pulmonary angiography) depend primarily on the clinical conditions of patients and theirpre-test probability.
We propose two diagnostic algorithms: 1) a diagnostic algorithm for patients with clinically sus-pected PE and critical clinical conditions (unstable patients), 2) a diagnostic algorithm for patientswith clinically suspected PE and non-critical clinical conditions (hemodynamically stable patients).
(Ital Heart J 2005; 6 (10): 799-804)
three categories of clinical or pre-test probability:low, intermediate and high clinical probability or pre-test probability of PE.
Clinical probability may be estimated empiricallyor by a prediction score. The main advantage of a pre-diction score is to allow a standardized evaluation. Themost prospectively valid scores are the simple clinicalmodels devised by Wells et al.5 and the score of theGeneva Group6; the score system, of the PISAPEDstudy4 has not been validated externally. A recent studywhich compared the performance of these three modelsin 215 consecutive patients with PE showed a very im-portant difference in defining precisely the pre-testprobability of PE7.
It has not been demonstrated yet that grading clini-cal probability by scoring systems represents a moreaccurate method than the empirical assessment under-taken by an experienced physician8.
In all patients with possible PE, clinical probabilityshould be assessed and documented9. However, thepositive predictive value of high clinical probability isapproximately 70-75% whereas the negative predictivevalue of low clinical probability is approximately 85-90%. Therefore, it is necessary to use second- andthird-level diagnostic tests.
Second-level diagnostic tests, available in all hospi-tals, are the following: laboratory assays (D-dimer, tro-ponin, brain natriuretic peptide), venous ultrasound,and echocardiography.
Third-level imaging tests, not available in all hos-pitals, are the following: lung scintigraphy, helical(spiral) computed tomography, magnetic resonanceangiography, and pulmonary angiography.
Diagnostic strategy
The choice and the combination of diagnostic tests(diagnostic algorithms, diagnostic work-up) dependson:
1) clinical conditions of patients with clinically sus-pected PE (critical or non-critical, presence or absenceof prior cardiopulmonary disease);2) clinical or pre-test probability (low, intermediate orhigh; rule out/rule in strategy);3) suspected PE in outpatients or in hospitalized pa-tients;4) predictive accuracy of diagnostic tests as obtained byclinical evaluation (“virtual accuracy”);5) local availability of diagnostic tests;6) local predictive accuracy of diagnostic tests (“realaccuracy”) as obtained by experienced professionalsand equipments;7) cost-effectiveness analysis of diagnostic strategiesand risk-benefit ratio.
Diagnostic algorithms
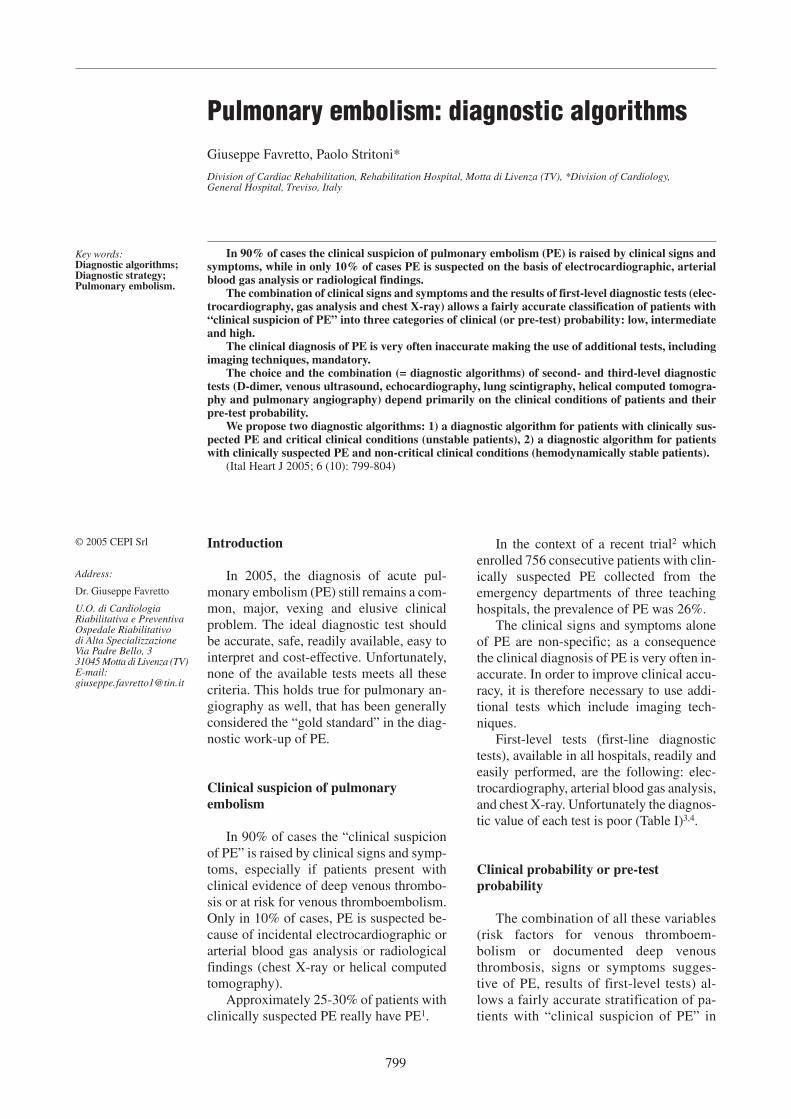
Diagnostic algorithm for patients with clinicallysuspected pulmonary embolism and critical clinicalconditions (unstable patients) (Fig. 1). The definitionof critical clinical conditions is as follows10:• patients with hemodynamic instability (cardiac arrest,shock, hypotension);• patients without hemodynamic instability but with atleast one of the following: a) important, persistent andworsening dyspnea; and b) recent syncope.
No absolute as well as validated algorithm is avail-able for unstable patients with clinically suspected PE;diagnosis is influenced by the necessity to take urgenttherapeutic measures.
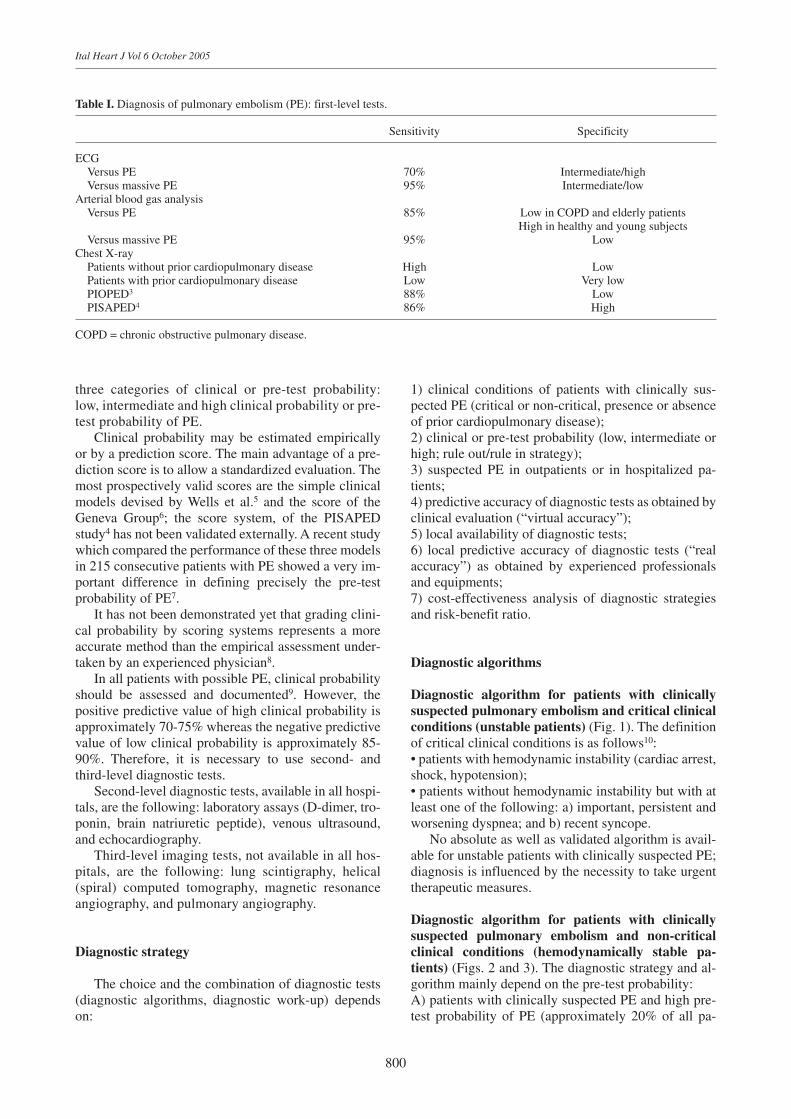
Diagnostic algorithm for patients with clinicallysuspected pulmonary embolism and non-criticalclinical conditions (hemodynamically stable pa-tients) (Figs. 2 and 3). The diagnostic strategy and al-gorithm mainly depend on the pre-test probability: A) patients with clinically suspected PE and high pre-test probability of PE (approximately 20% of all pa-
800
Ital Heart J Vol 6 October 2005
Table I. Diagnosis of pulmonary embolism (PE): first-level tests.
Sensitivity Specificity
ECGVersus PE 70% Intermediate/highVersus massive PE 95% Intermediate/low
Arterial blood gas analysisVersus PE 85% Low in COPD and elderly patients
High in healthy and young subjectsVersus massive PE 95% Low
Chest X-rayPatients without prior cardiopulmonary disease High LowPatients with prior cardiopulmonary disease Low Very lowPIOPED3 88% LowPISAPED4 86% High
COPD = chronic obstructive pulmonary disease.
tients with clinically suspected PE) have documentedPE in 70% of cases (positive predictive value of highpre-test probability: 70%).
For those patients with high pre-test probability thefollowing diagnostic tests are advised: lung scintigra-
phy, helical computed tomography, and echocardiogra-phy.
Patients with high pre-test probability, if necessary,may undergo pulmonary angiography for diagnosis ofPE11.
G Favretto, P Stritoni - Pulmonary embolism: diagnostic algorithms
801
Figure 1. Proposed diagnostic algorithm for suspected pulmonary embolism (PE) in the presence of critical clinical conditions. CT = computed to-mography.
Figure 2. Proposed diagnostic algorithm for suspected pulmonary embolism (PE) in clinically stable patients in hospitals with all diagnostic tests avail-able. CT = computed tomography; LS = lung scan; PA = pulmonary angiography; US = ultrasound.
802
Ital Heart J Vol 6 October 2005
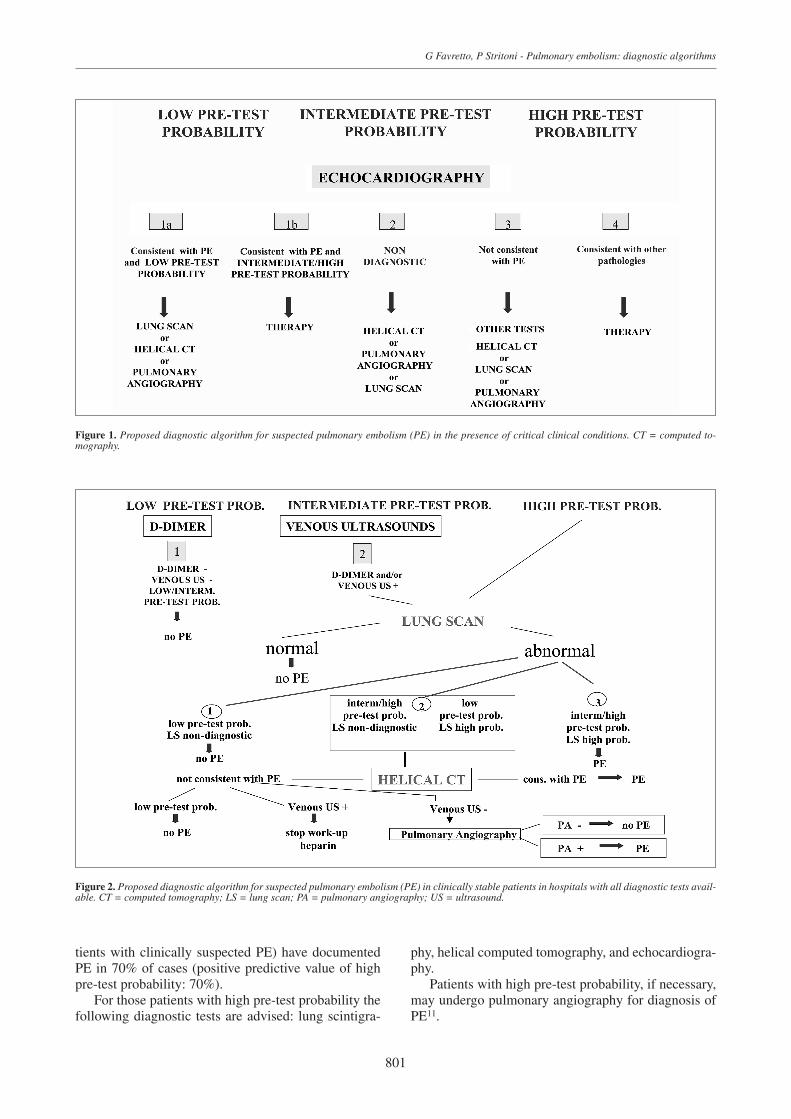
Figure 3. Proposed diagnostic algorithm for suspected pulmonary embolism (PE) in clinically stable patients in hospitals without Nuclear Medicine.CT = computed tomography; PA = pulmonary angiography; US = ultrasound.
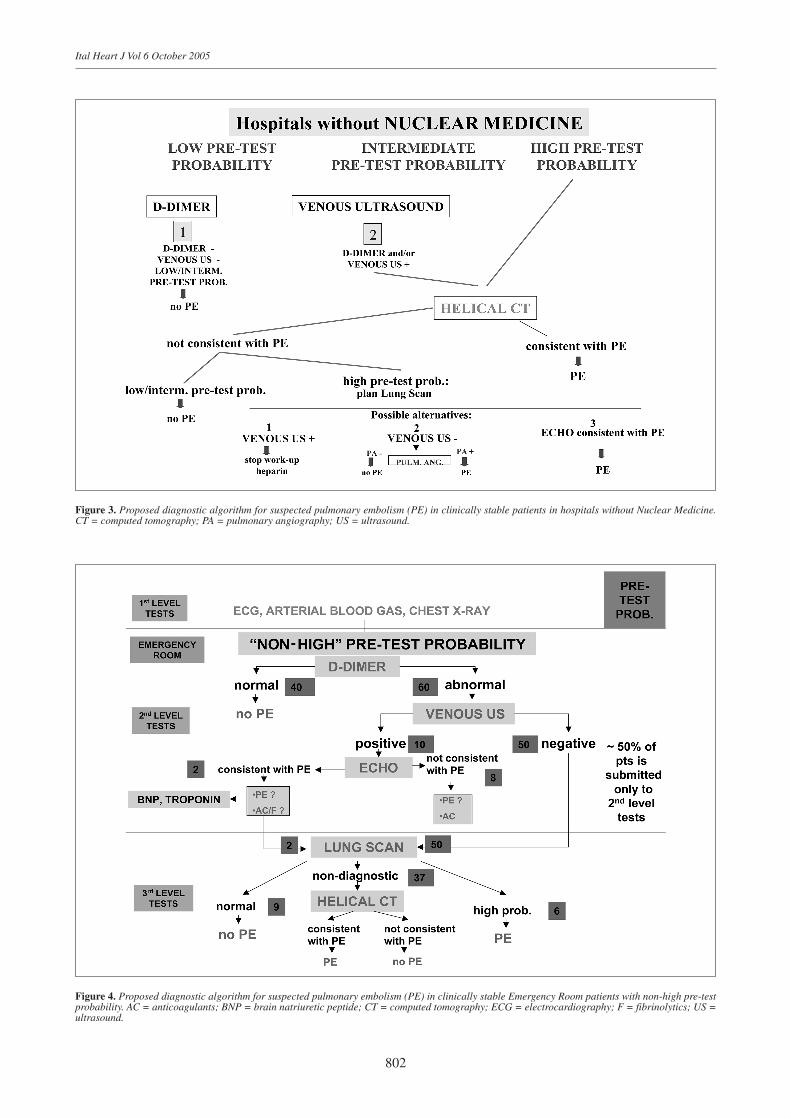
Figure 4. Proposed diagnostic algorithm for suspected pulmonary embolism (PE) in clinically stable Emergency Room patients with non-high pre-testprobability. AC = anticoagulants; BNP = brain natriuretic peptide; CT = computed tomography; ECG = electrocardiography; F = fibrinolytics; US =ultrasound.
G Favretto, P Stritoni - Pulmonary embolism: diagnostic algorithms
803
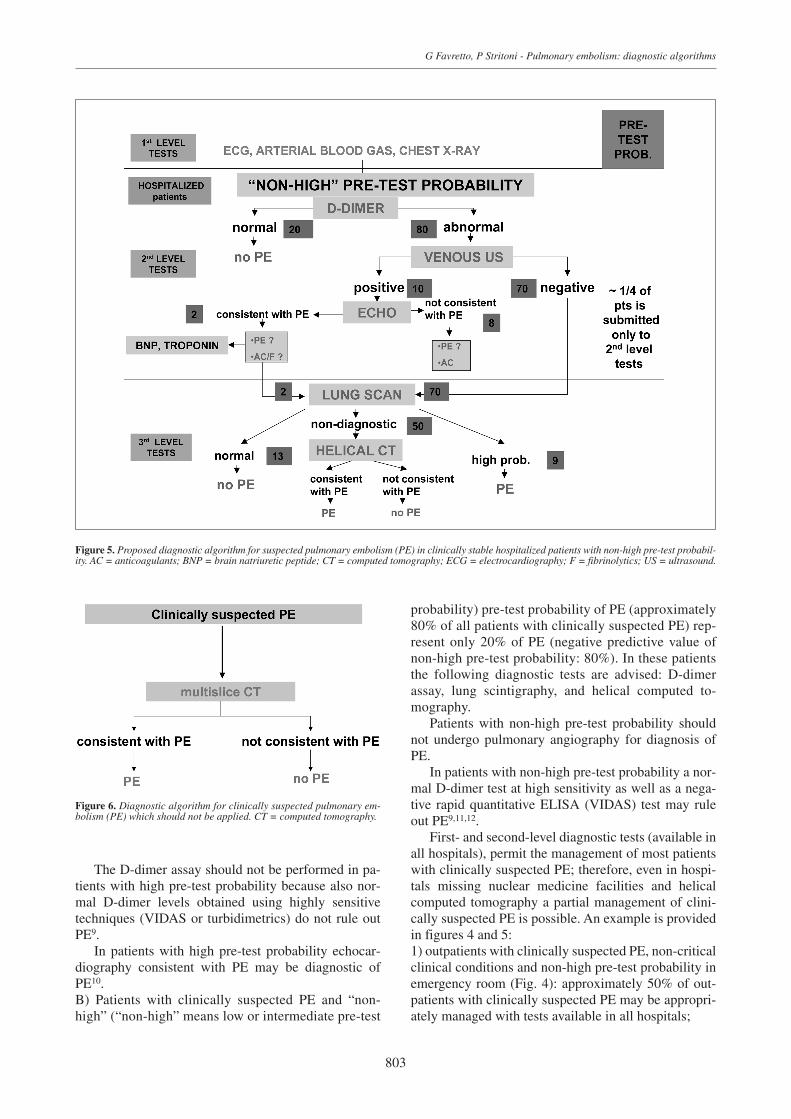
Figure 5. Proposed diagnostic algorithm for suspected pulmonary embolism (PE) in clinically stable hospitalized patients with non-high pre-test probabil-ity. AC = anticoagulants; BNP = brain natriuretic peptide; CT = computed tomography; ECG = electrocardiography; F = fibrinolytics; US = ultrasound.
The D-dimer assay should not be performed in pa-tients with high pre-test probability because also nor-mal D-dimer levels obtained using highly sensitivetechniques (VIDAS or turbidimetrics) do not rule outPE9.
In patients with high pre-test probability echocar-diography consistent with PE may be diagnostic ofPE10. B) Patients with clinically suspected PE and “non-high” (“non-high” means low or intermediate pre-test
probability) pre-test probability of PE (approximately80% of all patients with clinically suspected PE) rep-resent only 20% of PE (negative predictive value ofnon-high pre-test probability: 80%). In these patientsthe following diagnostic tests are advised: D-dimerassay, lung scintigraphy, and helical computed to-mography.
Patients with non-high pre-test probability shouldnot undergo pulmonary angiography for diagnosis ofPE.
In patients with non-high pre-test probability a nor-mal D-dimer test at high sensitivity as well as a nega-tive rapid quantitative ELISA (VIDAS) test may ruleout PE9,11,12.
First- and second-level diagnostic tests (available inall hospitals), permit the management of most patientswith clinically suspected PE; therefore, even in hospi-tals missing nuclear medicine facilities and helicalcomputed tomography a partial management of clini-cally suspected PE is possible. An example is providedin figures 4 and 5:1) outpatients with clinically suspected PE, non-criticalclinical conditions and non-high pre-test probability inemergency room (Fig. 4): approximately 50% of out-patients with clinically suspected PE may be appropri-ately managed with tests available in all hospitals;
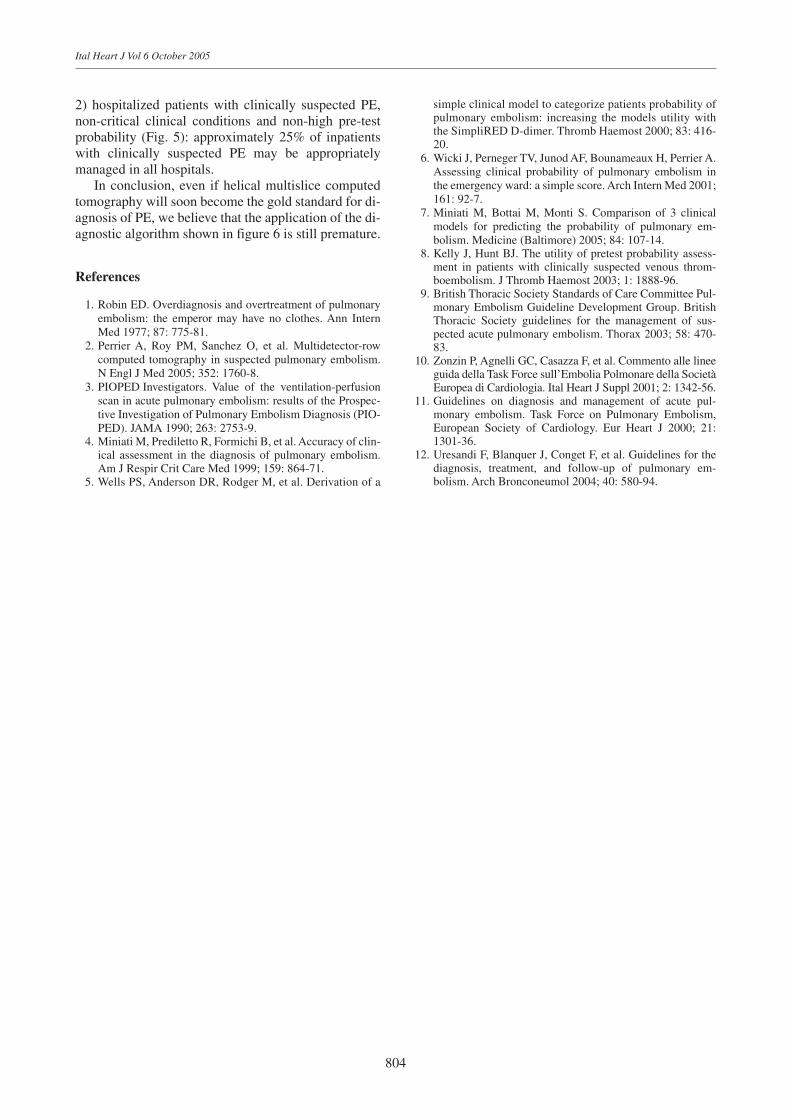
Figure 6. Diagnostic algorithm for clinically suspected pulmonary em-bolism (PE) which should not be applied. CT = computed tomography.
2) hospitalized patients with clinically suspected PE,non-critical clinical conditions and non-high pre-testprobability (Fig. 5): approximately 25% of inpatientswith clinically suspected PE may be appropriatelymanaged in all hospitals.
In conclusion, even if helical multislice computedtomography will soon become the gold standard for di-agnosis of PE, we believe that the application of the di-agnostic algorithm shown in figure 6 is still premature.
References
1. Robin ED. Overdiagnosis and overtreatment of pulmonaryembolism: the emperor may have no clothes. Ann InternMed 1977; 87: 775-81.
2. Perrier A, Roy PM, Sanchez O, et al. Multidetector-rowcomputed tomography in suspected pulmonary embolism.N Engl J Med 2005; 352: 1760-8.
3. PIOPED Investigators. Value of the ventilation-perfusionscan in acute pulmonary embolism: results of the Prospec-tive Investigation of Pulmonary Embolism Diagnosis (PIO-PED). JAMA 1990; 263: 2753-9.
4. Miniati M, Prediletto R, Formichi B, et al. Accuracy of clin-ical assessment in the diagnosis of pulmonary embolism.Am J Respir Crit Care Med 1999; 159: 864-71.
5. Wells PS, Anderson DR, Rodger M, et al. Derivation of a
804
Ital Heart J Vol 6 October 2005
simple clinical model to categorize patients probability ofpulmonary embolism: increasing the models utility withthe SimpliRED D-dimer. Thromb Haemost 2000; 83: 416-20.
6. Wicki J, Perneger TV, Junod AF, Bounameaux H, Perrier A.Assessing clinical probability of pulmonary embolism inthe emergency ward: a simple score. Arch Intern Med 2001;161: 92-7.
7. Miniati M, Bottai M, Monti S. Comparison of 3 clinicalmodels for predicting the probability of pulmonary em-bolism. Medicine (Baltimore) 2005; 84: 107-14.
8. Kelly J, Hunt BJ. The utility of pretest probability assess-ment in patients with clinically suspected venous throm-boembolism. J Thromb Haemost 2003; 1: 1888-96.
9. British Thoracic Society Standards of Care Committee Pul-monary Embolism Guideline Development Group. BritishThoracic Society guidelines for the management of sus-pected acute pulmonary embolism. Thorax 2003; 58: 470-83.
10. Zonzin P, Agnelli GC, Casazza F, et al. Commento alle lineeguida della Task Force sull’Embolia Polmonare della SocietàEuropea di Cardiologia. Ital Heart J Suppl 2001; 2: 1342-56.
11. Guidelines on diagnosis and management of acute pul-monary embolism. Task Force on Pulmonary Embolism,European Society of Cardiology. Eur Heart J 2000; 21:1301-36.
12. Uresandi F, Blanquer J, Conget F, et al. Guidelines for thediagnosis, treatment, and follow-up of pulmonary em-bolism. Arch Bronconeumol 2004; 40: 580-94.