public-private partnerships neil mcmonagle march 2011
TRANSCRIPT

Public-Private Partnerships
Neil McMonagle
March 2011
America's Infrastructure Report Card
A need for significant infrastructure investment…
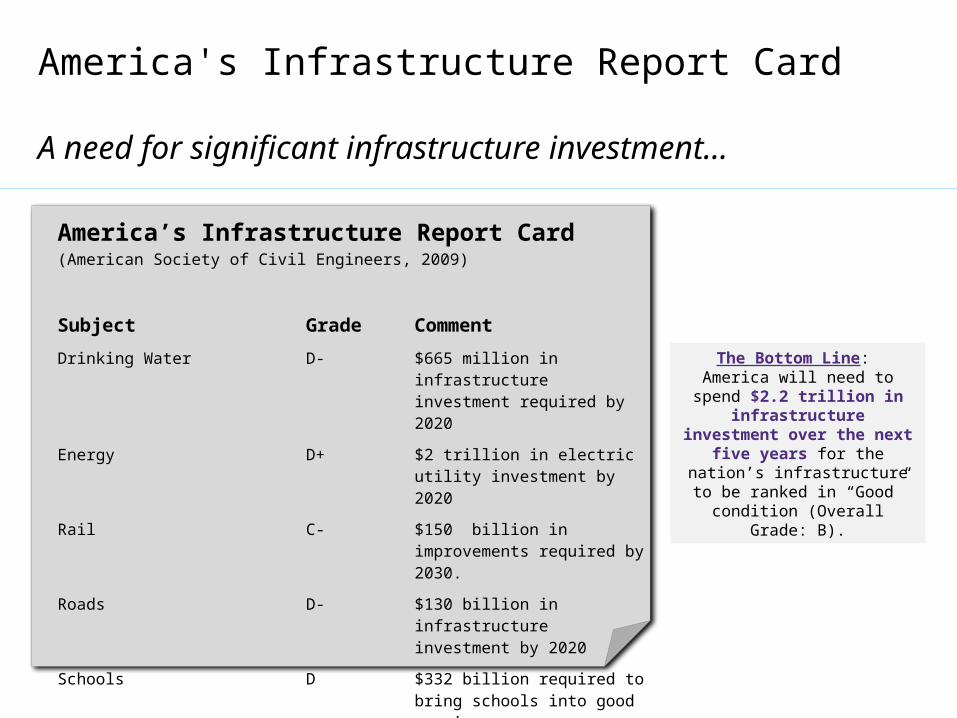
America’s Infrastructure Report Card(American Society of Civil Engineers, 2009)
Subject Grade Comment
Drinking Water D- $665 million in infrastructure investment required by 2020
Energy D+ $2 trillion in electric utility investment by 2020
Rail C- $150 billion in improvements required by 2030.
Roads D- $130 billion in infrastructure investment by 2020
Schools D $332 billion required to bring schools into good repair
Wastewater D- $335 million in infrastructure investment required by 2020
Overall Grade D
The Bottom Line: America will need to spend $2.2 trillion in
infrastructure investment over the next five years for the nation’s infrastructure to be ranked in “Good” condition
(Overall Grade: B).
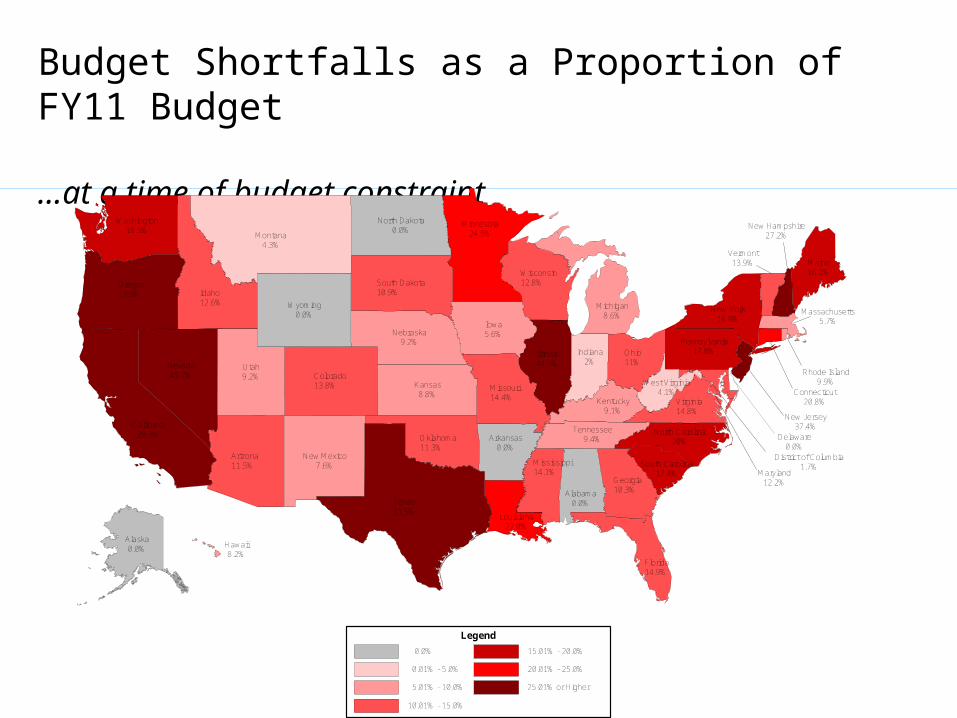
Budget Shortfalls as a Proportion of FY11 Budget
…at a time of budget constraint
Alabama0.0%
Arizona11.5%
Arkansas0.0%
California29.3%
Colorado13.8%
Florida14.9%
Georgia10.3%
Idaho12.6%
Illinois44.9%
Indiana2%
Iowa5.6%
Kansas8.8%
Kentucky9.1%
Louisiana22.0%
Montana4.3%
Maine16.1%
Michigan8.6%
Minnesota24.5%
Missouri14.4%
Mississippi14.1%
Nebraska9.2%
Nevada45.2%
New Mexico7.6%
New York16.9%
North Carolina20%
North Dakota0.0%
Ohio11%
Oklahoma11.3%
Oregon25%
Pennsylvania17.8%
South Carolina17.4%
South Dakota10.9%
Tennessee9.4%
Texas31.5%
Utah9.2%
Virginia14.8%
Wisconsin12.8%
Wyoming0.0%
Washington18.5%
West Virginia4.1%
New Hampshire27.2%
Vermont13.9%
Maryland12.2%
Delaware0.0%
District of Columbia1.7%
New Jersey37.4%
Connecticut20.8%
Rhode Island9.9%
Massachusetts5.7%
Alaska0.0% Hawaii
8.2%
Legend
0.0%
0.01% - 5.0%
5.01% - 10.0%
10.01% - 15.0%
15.01% - 20.0%
20.01% - 25.0%
25.01% or Higher
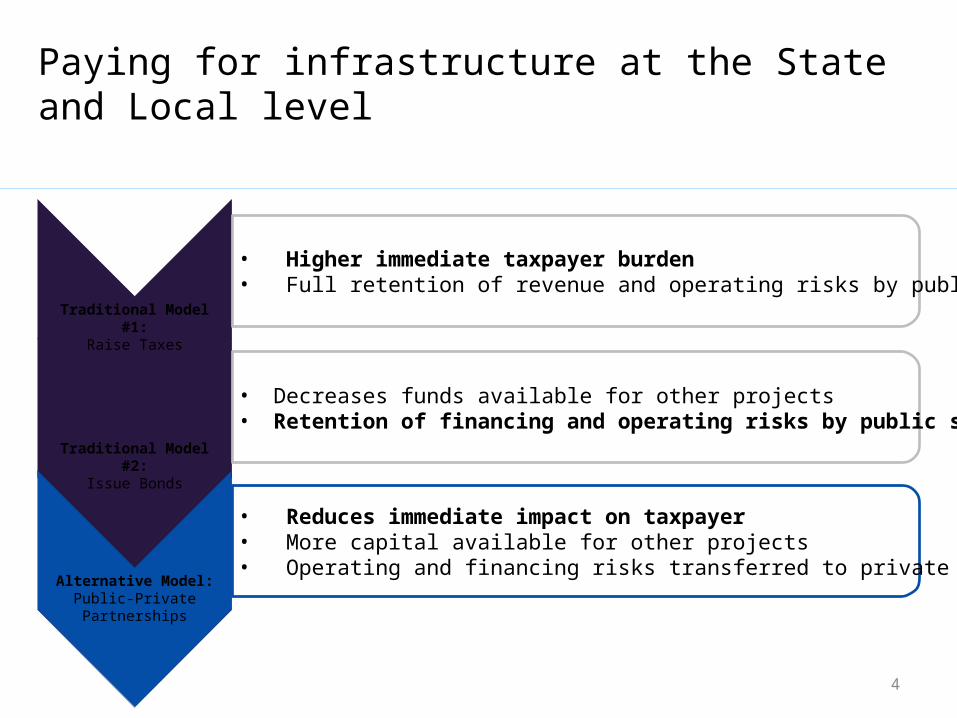
Paying for infrastructure at the State and Local level
Traditional Model #1:Raise Taxes
• Higher immediate taxpayer burden• Full retention of revenue and operating risks by public sector
Traditional Model #2:Issue Bonds
• Decreases funds available for other projects• Retention of financing and operating risks by public sector
Alternative Model:Public-Private Partnerships
• Reduces immediate impact on taxpayer• More capital available for other projects• Operating and financing risks transferred to private party
4
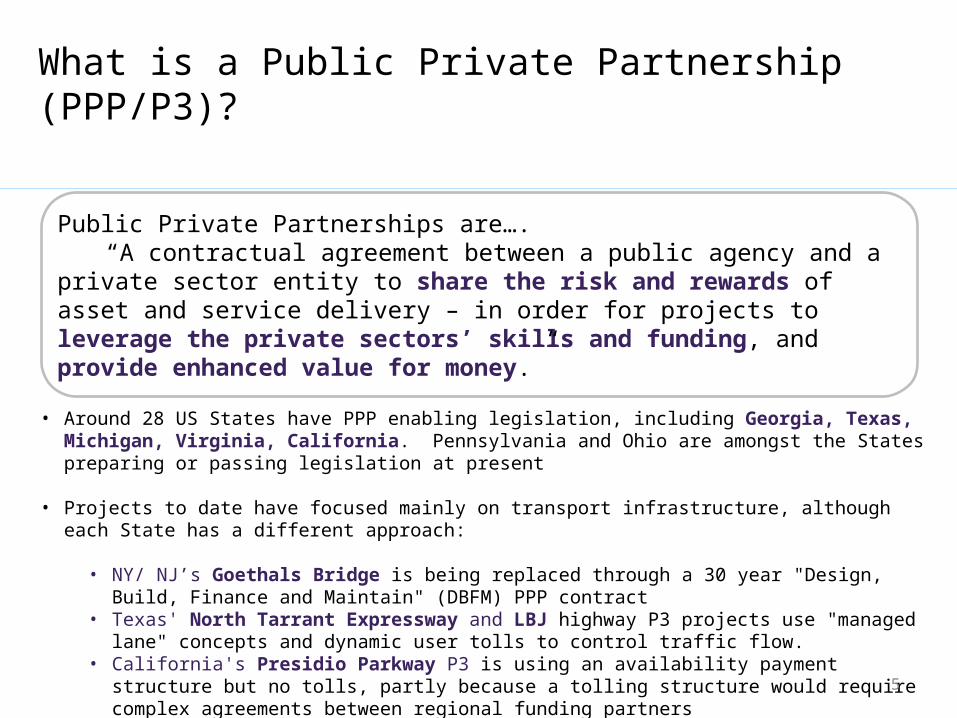
What is a Public Private Partnership (PPP/P3)?
Public Private Partnerships are….“A contractual agreement between a public agency and a private
sector entity to share the risk and rewards of asset and service delivery – in order for projects to leverage the private sectors’ skills and funding, and provide enhanced value for money.”
• Around 28 US States have PPP enabling legislation, including Georgia, Texas, Michigan, Virginia, California. Pennsylvania and Ohio are amongst the States preparing or passing legislation at present
• Projects to date have focused mainly on transport infrastructure, although each State has a different approach:
• NY/ NJ’s Goethals Bridge is being replaced through a 30 year "Design, Build, Finance and Maintain" (DBFM) PPP contract
• Texas' North Tarrant Expressway and LBJ highway P3 projects use "managed lane" concepts and dynamic user tolls to control traffic flow.
• California's Presidio Parkway P3 is using an availability payment structure but no tolls, partly because a tolling structure would require complex agreements between regional funding partners
5
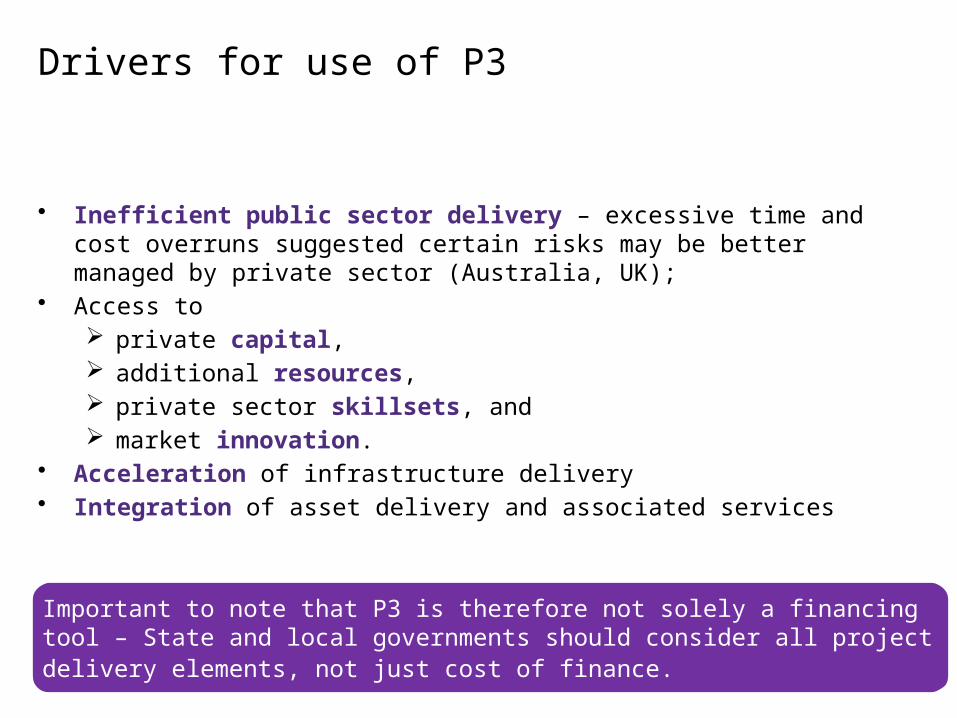
Drivers for use of P3
• Inefficient public sector delivery – excessive time and cost overruns suggested certain risks may be better managed by private sector (Australia, UK);
• Access to private capital, additional resources, private sector skillsets, and market innovation.
• Acceleration of infrastructure delivery• Integration of asset delivery and associated services
Important to note that P3 is therefore not solely a financing tool – State and local governments should consider all project delivery elements, not just cost of finance.
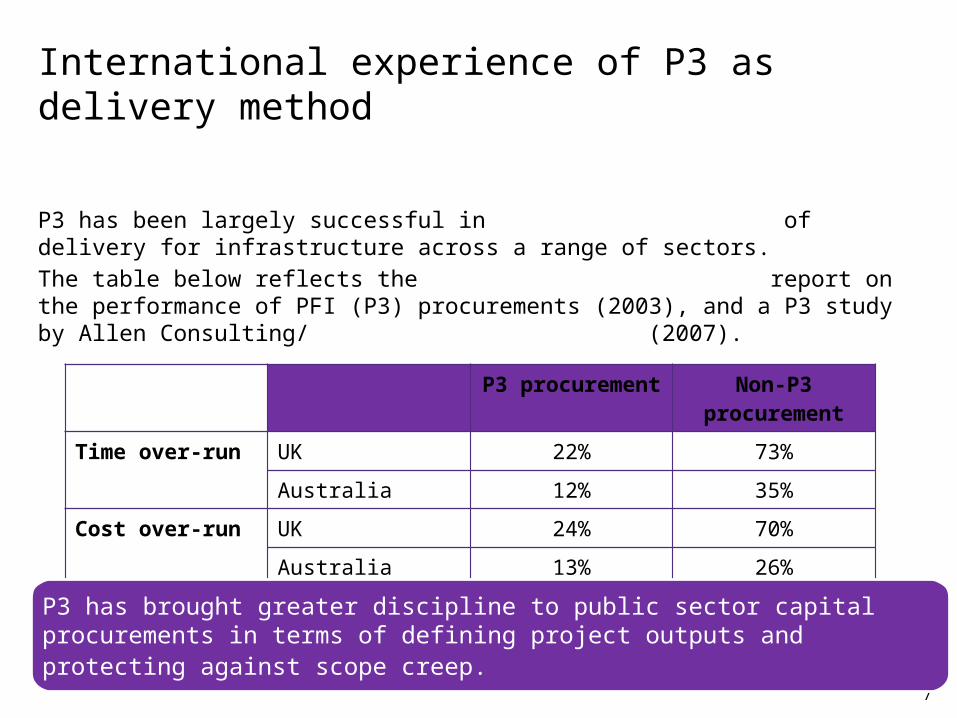
International experience of P3 as delivery method
P3 has been largely successful in improving efficiency of delivery for infrastructure across a range of sectors.
The table below reflects the UK National Audit Office report on the performance of PFI (P3) procurements (2003), and a P3 study by Allen Consulting/ University of Melbourne (2007).
7
P3 procurement Non-P3 procurement
Time over-run UK 22% 73%
Australia 12% 35%
Cost over-run UK 24% 70%
Australia 13% 26%
P3 has brought greater discipline to public sector capital procurements in terms of defining project outputs and protecting against scope creep.
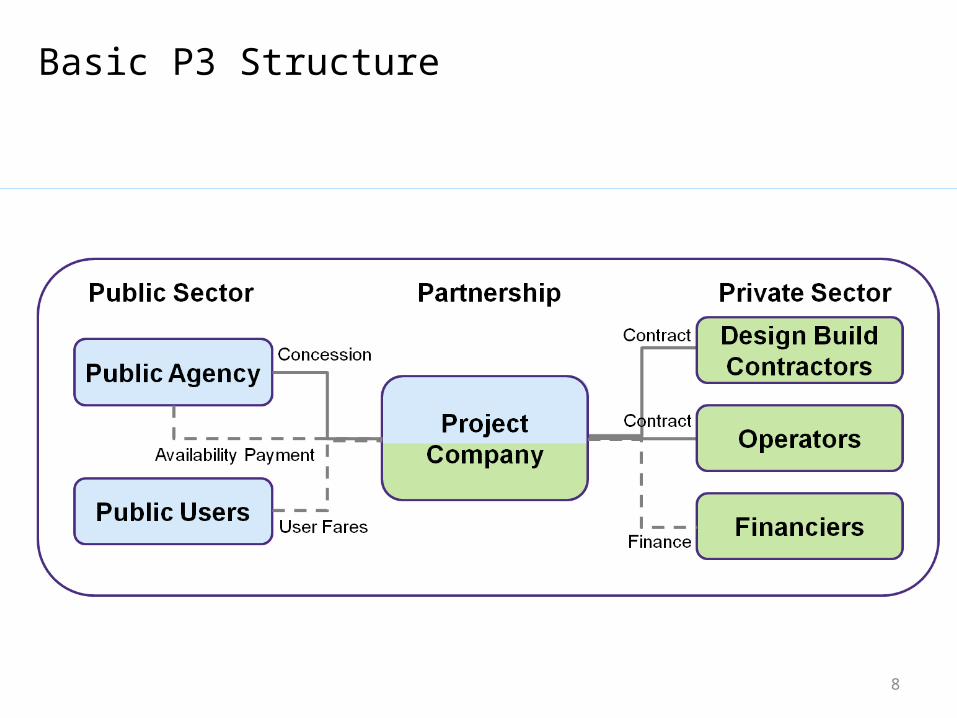
Basic P3 Structure
8
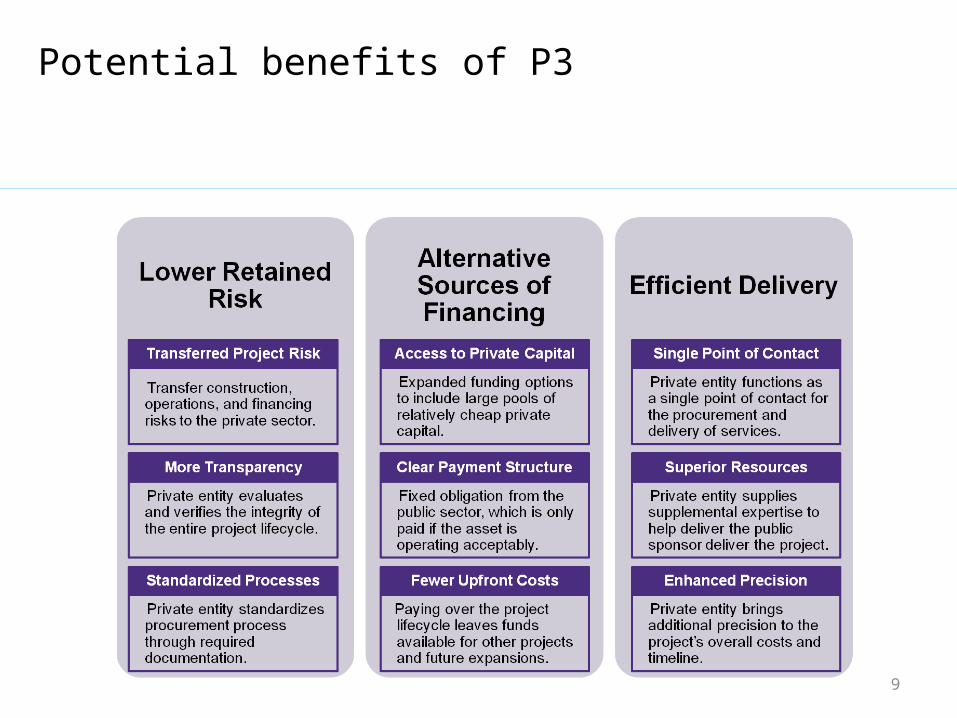
Potential benefits of P3
9
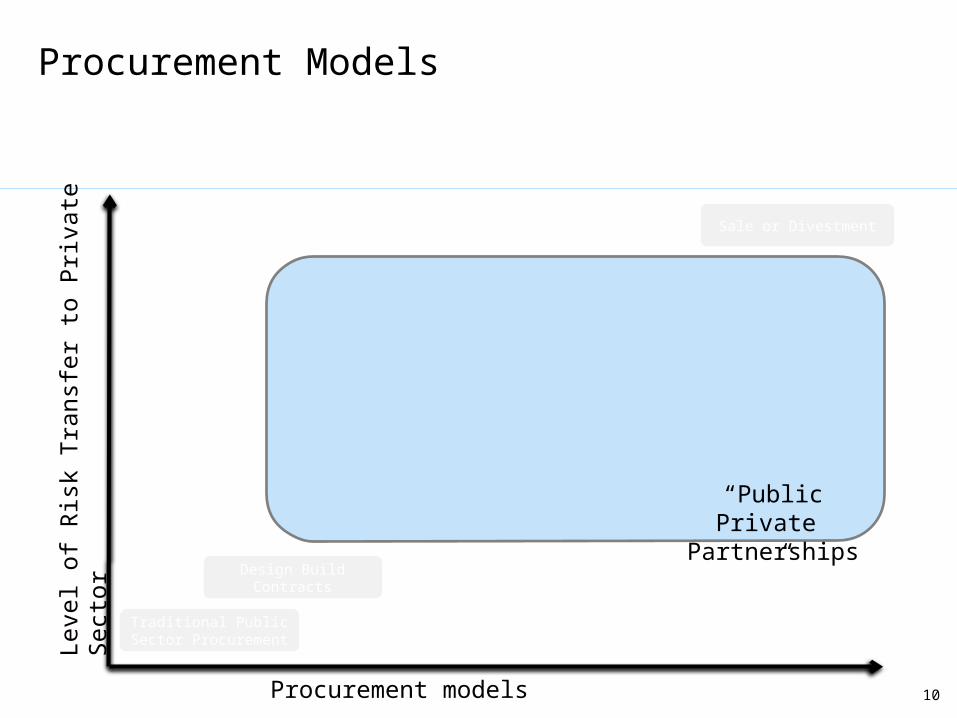
Procurement Models
Procurement models
Leve
l of
Ris
k T
rans
fer
to P
rivat
e S
ecto
r
Traditional Public Sector Procurement
Design Build Contracts
Contractual Joint Venture Agreements
Design, Build Finance and Maintain Contracts
Design, Build Finance, Maintain and Operate
Contracts
Concessions (inc revenue risk)
Sale or Divestment
“Public Private Partnerships”
10
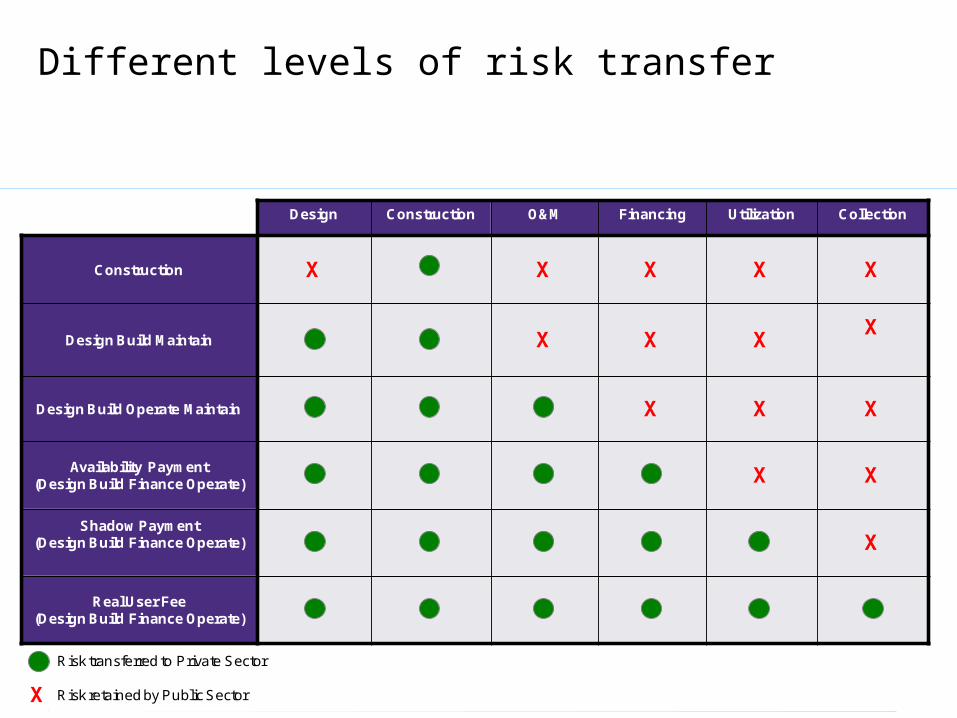
Different levels of risk transfer
Design Construction O&M Financing Utilization Collection
Construction X X X X X
Design Build Maintain X X XX
Design Build Operate Maintain X X X
Availability Payment (Design Build Finance Operate) X X
Shadow Payment (Design Build Finance Operate) X
Real User Fee (Design Build Finance Operate)
Risk transferred to Private Sector
X Risk retained by Public Sector
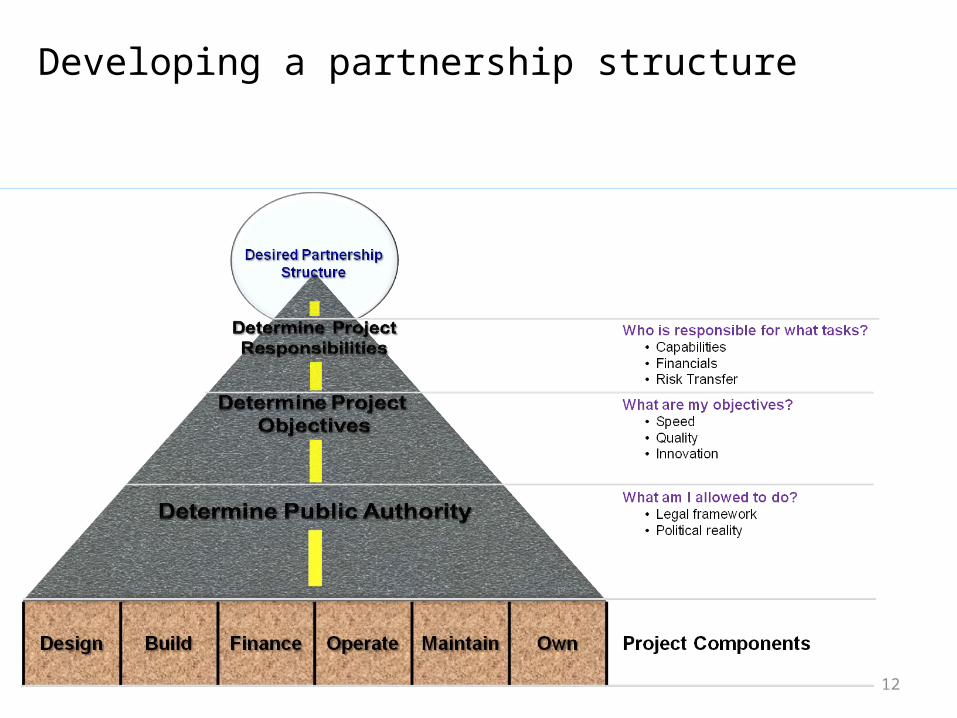
Developing a partnership structure
12
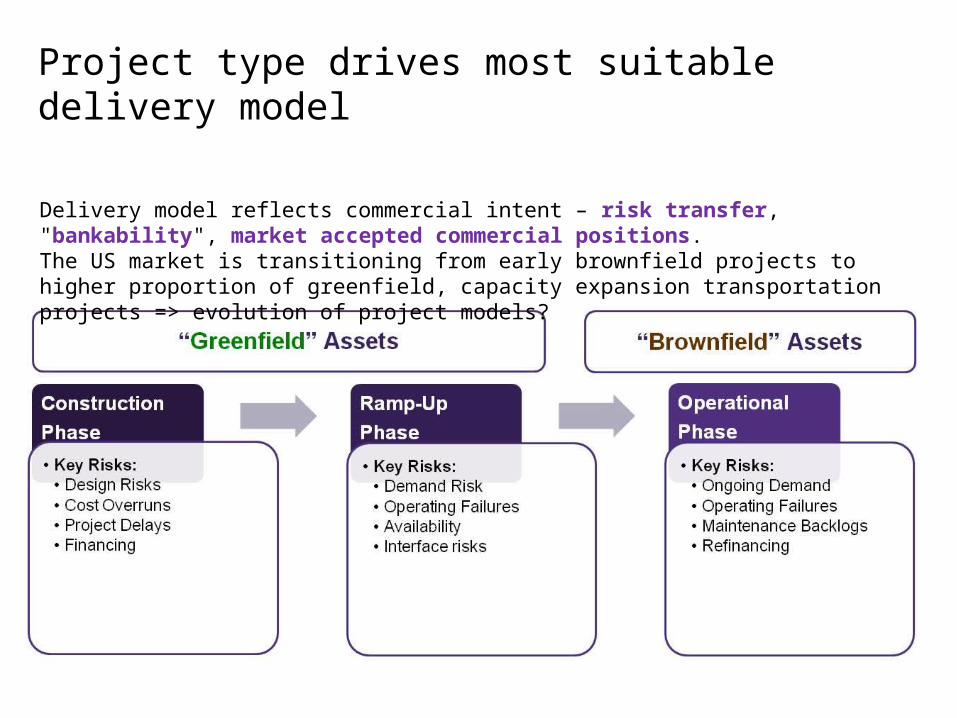
Project type drives most suitable delivery model
Delivery model reflects commercial intent – risk transfer, "bankability", market accepted commercial positions.The US market is transitioning from early brownfield projects to higher proportion of greenfield, capacity expansion transportation projects => evolution of project models?
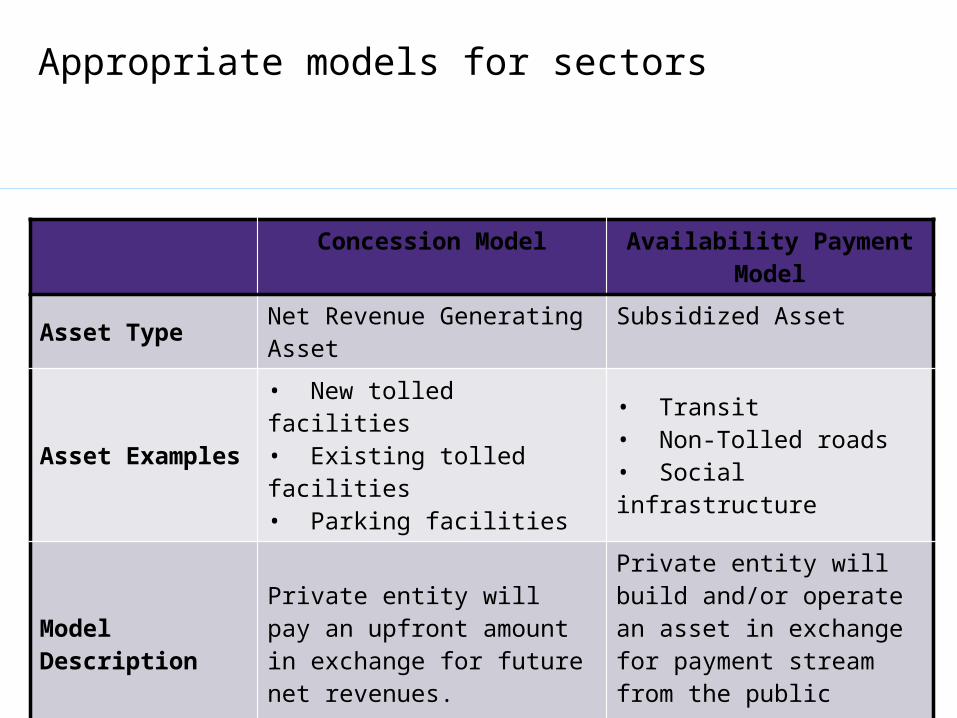
Appropriate models for sectors
14
Concession Model Availability Payment Model
Asset Type Net Revenue Generating Asset Subsidized Asset
Asset Examples• New tolled facilities • Existing tolled facilities• Parking facilities
• Transit• Non-Tolled roads• Social infrastructure
Model DescriptionPrivate entity will pay an upfront amount in exchange for future net revenues.
Private entity will build and/or operate an asset in exchange for payment stream from the public sector.
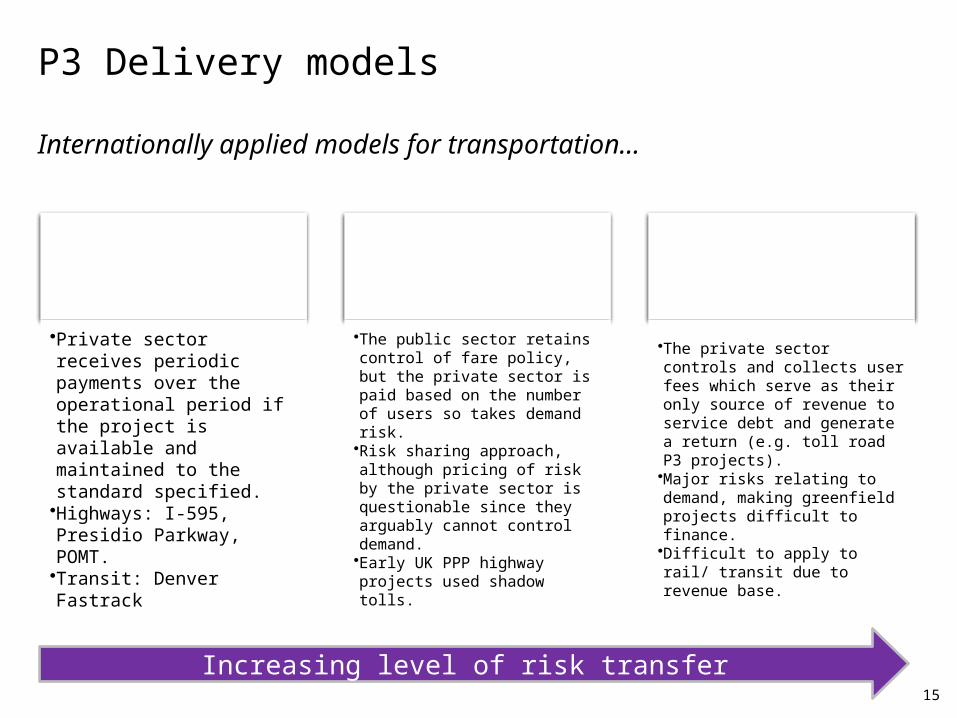
P3 Delivery models
Internationally applied models for transportation…
15
Availability Payment P3
models
•Private sector receives periodic payments over the operational period if the project is available and maintained to the standard specified.•Highways: I-595, Presidio Parkway, POMT.•Transit: Denver Fastrack
Shadow Payment P3 models
•The public sector retains control of fare policy, but the private sector is paid based on the number of users so takes demand risk. •Risk sharing approach, although pricing of risk by the private sector is questionable since they arguably cannot control demand.•Early UK PPP highway projects used shadow tolls.
Full Concession P3 models
•The private sector controls and collects user fees which serve as their only source of revenue to service debt and generate a return (e.g. toll road P3 projects).•Major risks relating to demand, making greenfield projects difficult to finance.•Difficult to apply to rail/ transit due to revenue base.
Increasing level of risk transfer
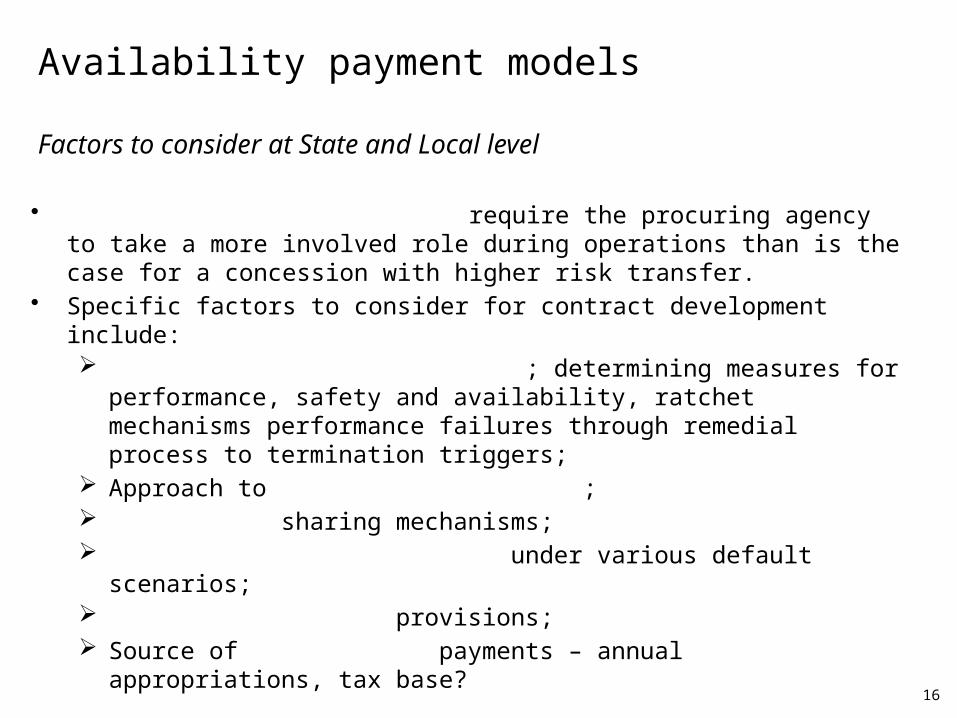
Availability payment models
Factors to consider at State and Local level
• Availability payment models require the procuring agency to take a more involved role during operations than is the case for a concession with higher risk transfer.
• Specific factors to consider for contract development include: Payment mechanism calibration; determining measures for performance,
safety and availability, ratchet mechanisms performance failures through remedial process to termination triggers;
Approach to performance reporting; Refinancing sharing mechanisms; Compensation on termination under various default scenarios; Contract monitoring provisions; Source of availability payments – annual appropriations, tax base?
16
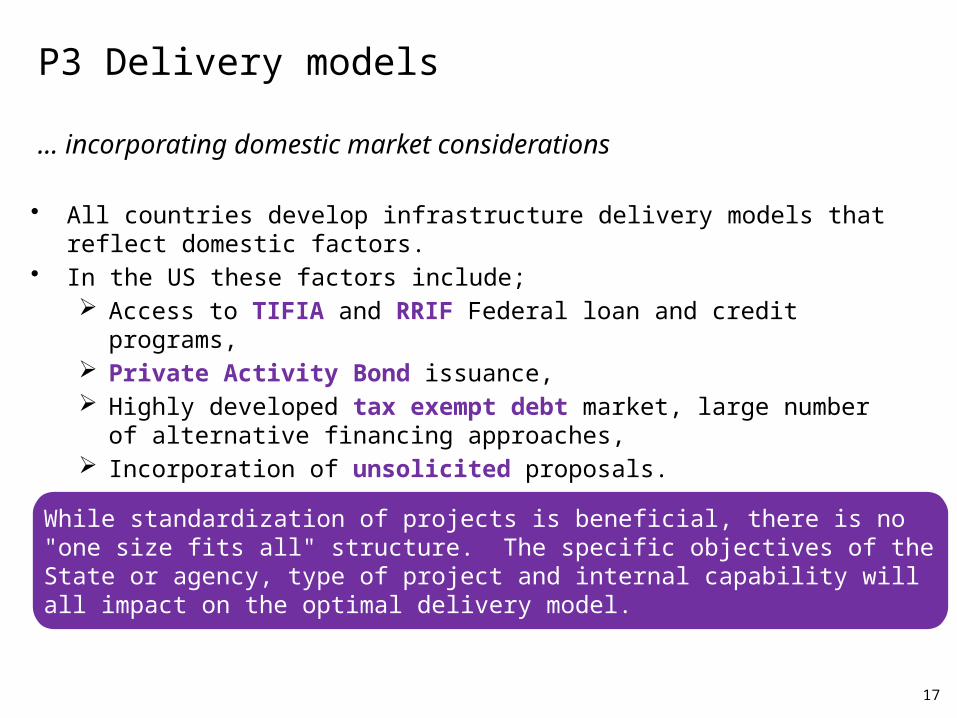
P3 Delivery models
… incorporating domestic market considerations
• All countries develop infrastructure delivery models that reflect domestic factors.• In the US these factors include;
Access to TIFIA and RRIF Federal loan and credit programs, Private Activity Bond issuance, Highly developed tax exempt debt market, large number of alternative
financing approaches, Incorporation of unsolicited proposals.
17
While standardization of projects is beneficial, there is no "one size fits all" structure. The specific objectives of the State or agency, type of project and internal capability will all impact on the optimal delivery model.
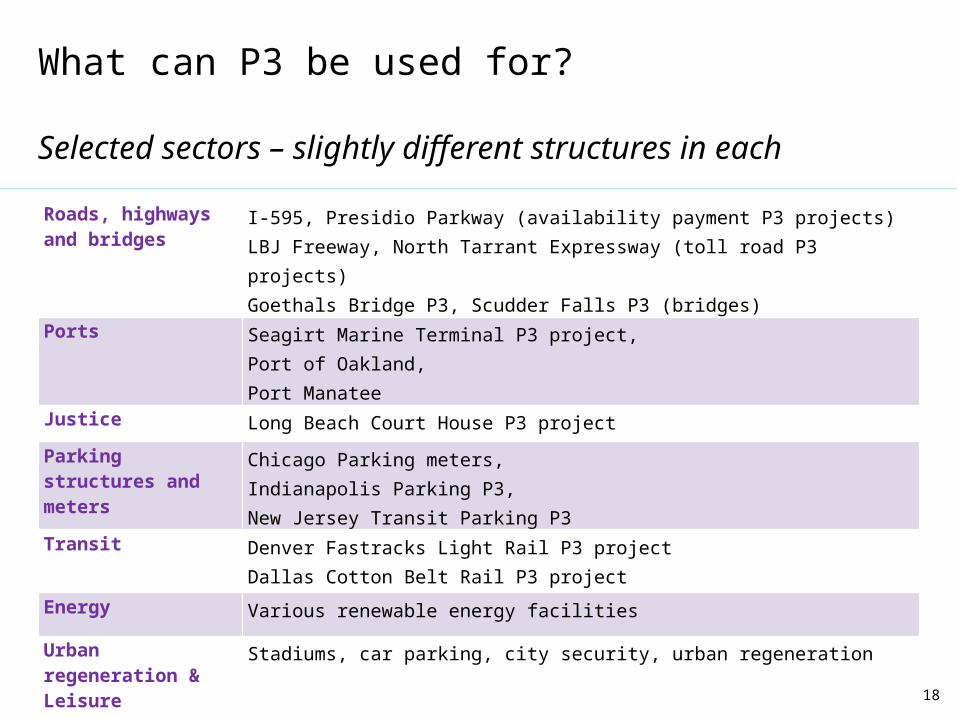
What can P3 be used for?
Selected sectors – slightly different structures in each
18
Roads, highways and bridges
I-595, Presidio Parkway (availability payment P3 projects)LBJ Freeway, North Tarrant Expressway (toll road P3 projects)Goethals Bridge P3, Scudder Falls P3 (bridges)
Ports Seagirt Marine Terminal P3 project, Port of Oakland,Port Manatee
Justice Long Beach Court House P3 project
Parking structures and meters
Chicago Parking meters, Indianapolis Parking P3, New Jersey Transit Parking P3
Transit Denver Fastracks Light Rail P3 projectDallas Cotton Belt Rail P3 project
Energy Various renewable energy facilities
Urban regeneration & Leisure
Stadiums, car parking, city security, urban regeneration
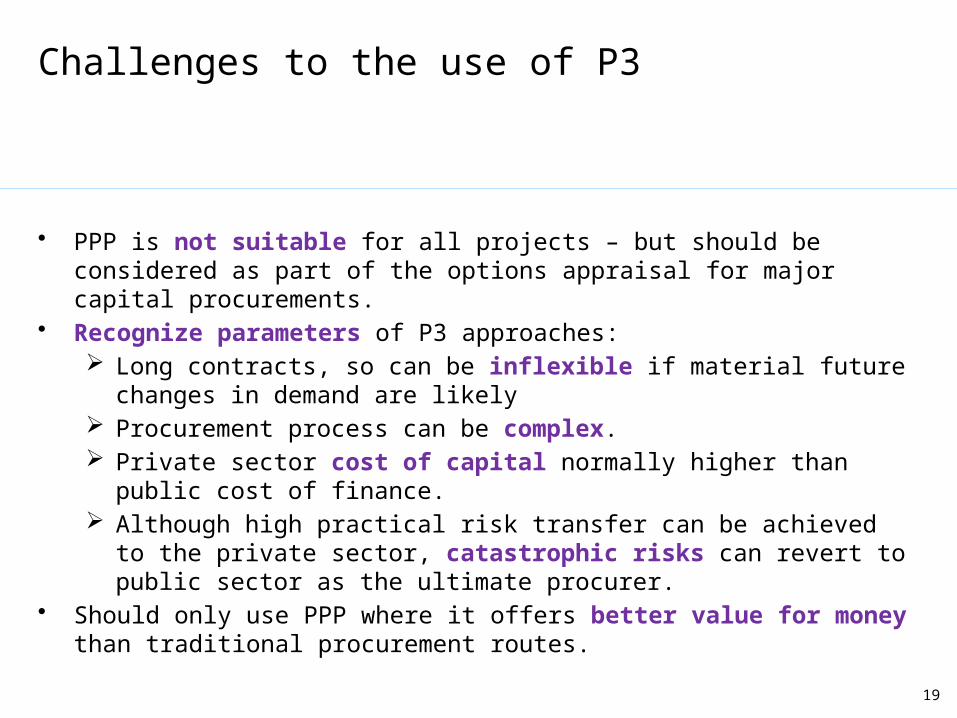
Challenges to the use of P3
• PPP is not suitable for all projects – but should be considered as part of the options appraisal for major capital procurements.
• Recognize parameters of P3 approaches: Long contracts, so can be inflexible if material future changes in demand
are likely Procurement process can be complex. Private sector cost of capital normally higher than public cost of finance. Although high practical risk transfer can be achieved to the private sector,
catastrophic risks can revert to public sector as the ultimate procurer.• Should only use PPP where it offers better value for money than traditional
procurement routes.
19
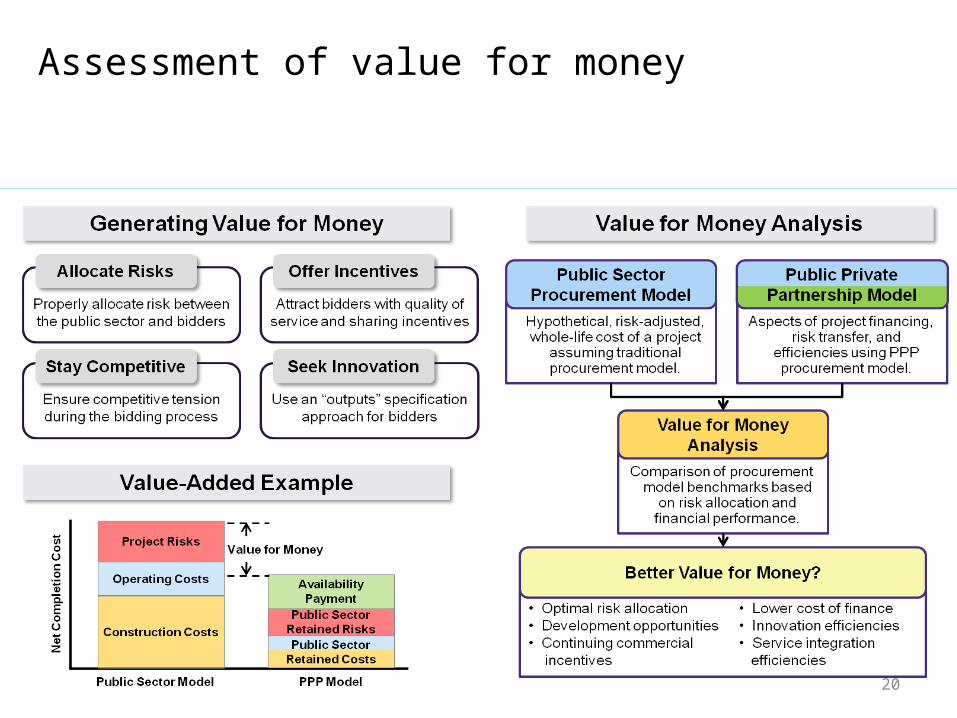
Assessment of value for money
20
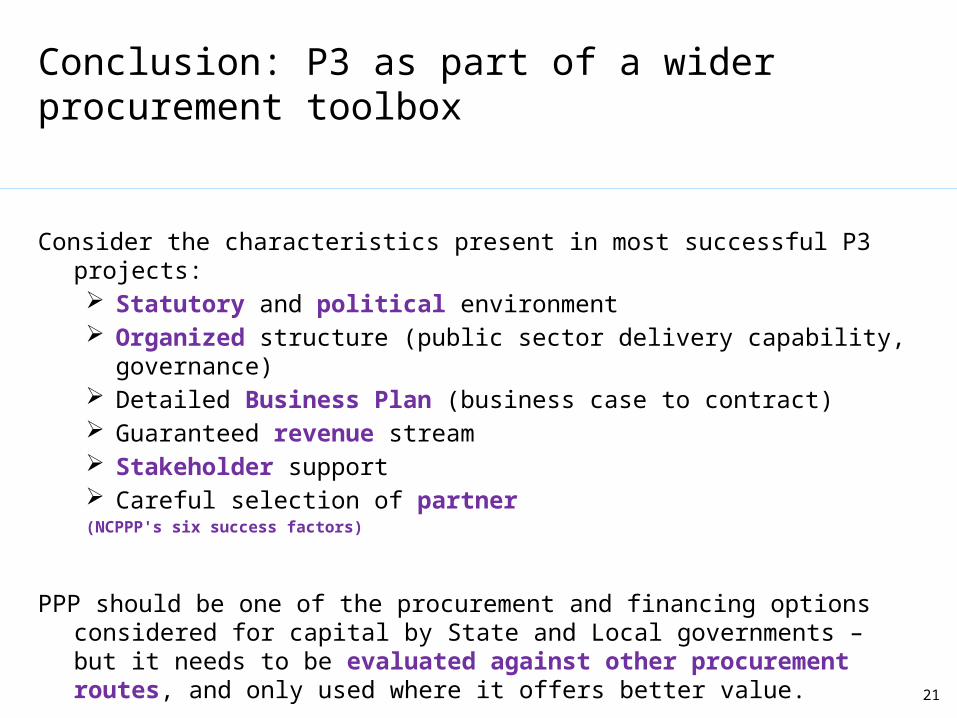
Conclusion: P3 as part of a wider procurement toolbox
Consider the characteristics present in most successful P3 projects: Statutory and political environment Organized structure (public sector delivery capability, governance) Detailed Business Plan (business case to contract) Guaranteed revenue stream Stakeholder support Careful selection of partner(NCPPP's six success factors)
PPP should be one of the procurement and financing options considered for capital by State and Local governments – but it needs to be evaluated against other procurement routes, and only used where it offers better value.
21