public preferences for redistribution and policy …€¦ · public preferences for redistribution...
TRANSCRIPT
1
Public Preferences for Redistribution and Policy
Outcomes:
A Comparative Study
Chen Sharony, Shlomo Mizrahi, Miki Malul
2
Summary
What are the factors affecting the gap between preference for income redistribution
and policy? There is a mismatch between public preferences and policy in this field in
certain countries. That is, in some countries the public displays a high demand for
redistribution, but the government's social spending is low or vice versa. Ours is a
comparative study which uses panel data from 24 OECD countries, from different
years (1990-2012). Public preferences were measured by value surveys (ESS, WVS,
ISSP) and policy is measured by social expenditure and the GINI index. The proposed
sources for the gap between public preferences and policy are: social capital, ethnic
heterogeneity, perceived government effectiveness and corruption. Results show that
most countries have a small gap between public preferences and policy. A few
countries studied (like Greece, Israel and Portugal) show a negative gap, where social
spending is lower than the public preference. Other countries (like Sweden, Denmark
and Luxemburg) show a positive gap, where public spending is higher than the public
preference. Government effectiveness and corruption were found to be the main
factors affecting the gap, but in some regressions social capital also has an effect on it.
The influence of government effectiveness on the gap may mean that the public does
not demand redistribution because faith in the government's ability to perform is
lacking. Another interesting finding is that a "positive gap" was found in countries
considered to have high government effectiveness and low corruption. This could
mean that people believe there is too much redistribution in the country.
1. Introduction
The study deals with public preferences concerning redistribution policy, and their
effect on actual policy. Redistribution is defined in the literature as a reduction of
inequalities in the distribution of wealth through government taxes and transfers
(Durante & Putterman, 2009). There is a mismatch between public preferences and
policy in this field in certain countries. That is, in some countries the public displays a
high demand for redistribution policy, but the government's social spending is low or
vice versa.
This is a comparative study which examines the interaction between public
preferences and policy in two dimensions: 1. Intentions-- Is the policy, as reflected in
social spending measures, consonant with public preferences in the country? 2.
3
Outcomes – Are policy outcomes, as reflected in income inequality measures,
consonant with public preferences in the country?
The second stage of the study attempts to assess the factors that shape the gap
between these two dimensions. The proposed sources for the gap are: low social
capital, high ethnic heterogeneity, a low level of perceived government effectiveness
and a high level of perceived corruption.
The study's main contribution moves toward a definition of the gap, using a
measurable variable and clarifying the factors affecting it. The factors we propose
were found in previous research to affect economic functioning or quality of
government. Understanding the factors affecting the gap using international data for
comparison, can lead to the construction of a policy which may reduce the gap and
lead to civil awareness, political involvement, and to citizens voicing their demands
for the policy they prefer.
The research questions are:
1. Does actual policy reflect public preferences on the subject of the welfare state and
redistribution policy?
2. What are the factors that explain the gap between public preferences for
redistribution and policy outcomes?
2. Literature review
2.1 Preferences for Redistribution
There are many studies concerning the factors affecting preferences for redistribution,
such as: self-interest (Cusack, Iversen, & Rehm, 2008; Doherty, Gerber, & Green,
2006; Estevez-Abe, Iversen, & Soskice, 2001; Iversen & Soskice, 2001; Iversen &
Soskice, 2006; Rehm, 2005; Rehm, Hacker, & Schlesinger, 2012); values and norms
(Alesina & Glaeser, 2004; Alesina & Giuliano, 2009; Durante & Putterman, 2009);
socialization (Svallfors, 1997), and culture (Alesina & Schuendeln, 2005; Andreß &
Heien, 2001; Corneo & Grüner, 2002; Luttmer & Singhal, 2008; Sapienza, Zingales,
& Guiso, 2006) . Studies showed mixed findings about the relations between welfare
state type and redistribution preferences (Arts & Gelissen, 2001; Gelissen, 2000;
Jæger, 2006; Lipsmeyer & Nordstrom, 2003). Some studies found a connection
4
between welfare state type and redistribution preference, while others didn't find a
connection or found a non-linear connection.
2.3 Public policy and Public opinion
There is a body of literature addressing the topic of democratic deficit. A democratic
deficit occurs when democratic institutions (particularly governments) fall short of
fulfilling the principles of democracy in their practices. Theories of democratic deficit
speak about discontent with the government as well as low voter turnout, low civic
engagement and declining social capital, along with the claim that people hate
politics.
Russell Dalton claims that citizens in advanced industrial societies remain committed
to democratic principles although they have gradually become more distrustful of
politicians, detached from parties and doubtful about the public sector and
institutions. The gap between aspiration and satisfaction is captured by the concept of
democratic deficit (Dalton, 2004).
Researchers claim there is a democratic deficit in the EU (Follesdal & Hix, 2006) and
in the U.S. (Lax & Phillips, 2012). Other researchers maintain there is no democratic
deficit: Norris shows that trust in politics and political institutions has not declined
throughout the years and thus challenges the democratic deficit approach (Norris,
2011). Some researchers claim that the problem with the EU is not democratic deficit
but a credibility crisis. If the EU could increase its credibility through more
transparent decision-making and professionalism, then the public would accept its
legitimacy and democratic deficit would disappear (Crombez, 2003; Majone, 1998).
In sum, there is a claim in the literature about declining credibility and the
performance of governments and democratic institutions which leads to decreased
citizen involvement in politics. If the democratic deficit claim is true, this may explain
the gap between public preferences and policy. On the other hand, many researchers
maintain that there is no democratic deficit and the democratic institutions in Europe
and the U.S. are functioning well.
Another body of literature called "Agenda Setting" deals with the question: Does the
government respond to public demands and does the public adjust its demands when
there is a policy change? A normative model called the "Thermostat Model", which
originates with Deutsch & Deutsch (1963) and Easton (1965), claims that the public
5
acts like a thermostat for politicians: 1. If there is a gap between public preferences
and policy, the public will send a signal. 2. Politicians will respond to this signal with
policy change. 3. As the policy comes close to the desirable level, the signal will
weaken. Several studies found that the thermostat model works well. For instance, a
study conducted in the U.S., Canada and the U.K. found high responsiveness of the
public to policy change and high responsiveness of the government to public demands
(Soroka & Wlezien, 2010). Wlezien (1995) found that the public responds to policy
changes, and changes its preferences. However, politicians do not necessarily react to
preferences changes by the public and therefore we see a certain circular trend in
preferences over time. Baumgartner, et al. (2009) checked whether institutional
differences between countries affect the level of politicians' responsiveness to public
demands. They assumed that a gap between public preferences and outcomes will
emerge and that this gap will be larger in the U.S. than in the parliamentary
democracies (Belgium and Denmark). They found that despite institutional
differences, the results were similar between the countries. Page & Shapiro (1983)
found a match between public preference and policy in the years 1935-1979 in the
U.S. They found higher matches on social issues (abortion, civil rights) than on
welfare issues. They claimed that policy matches preferences, especially in subjects
with high visibility. Soroka & Wlezien (2004) conducted research in the U.S., Canada
and the U.K. They checked both the responsiveness of the public to policy changes
and the responsiveness of the government to policy demand from the public. They
found that the thermostat model works in each of the three countries. That is, in all
three countries the public responds to a change in the level of spending and the level
of spending is in line with the public demands. However, there are differences in the
nature of the response that may be affected by the type of government structure. It
was found that in the presidential system (the U.S.) responsiveness is higher than in
the parliamentary system.
In sum, most of the studies in the Agenda Setting field support the thermostat model –
that is, the government and the public respond to one another. However, it is
important to mention that most of these studies were conducted in the U.S. and
Canada.
6
2.2 Factors affecting the gap between public preferences and policy
outcomes
Our research assesses factors that may affect the gap between public preferences for
redistribution and policy outcomes. The next section introduces the factors assumed to
affect this gap and previous literature regarding them.
2.2.1 Social capital
Social capital is defined as "the network of social connections that exists between
people, and their shared values and norms of behavior, which enable and encourage
mutually advantageous social cooperation." (Putnam, 1995).
The term social capital was first introduced by Putnam, who investigated the
functioning of local government in several Italian districts. He found that although
they had the same budget, Northern districts had higher quality local government. He
claimed that this was because Northern Italy had better civil engagement: higher
involvement and sense of community, higher egalitarian and democratic ethos. That
is, social capital is a measure of the level of civil involvement in country or
community (Putnam, Leonardy, & Nannety, 1993).
Much research deals with the relation between social capital and democracy and
societal functioning (Brass, Butterfield, & Skaggs, 1998; Fukuyama, 1995; Newton,
1997; Porta, Lopez-De-Silane, Shleifer, & Vishny, 1996; Putnam et al., 1993;
Putnam, 1995; Putnam, 2002; Putnam, 2000).
Fukuyama (1995) claimed that a high level of trust and social capital enables better
functioning of a country's institutions. Porta et al. (1996) found that high level of trust
brings to better economic performance of the country.
Countries with a high level of social capital will show civic participation, which leads
to extensive government oversight. This could be manifested through non-profit
organizations in the relevant field, providing information and supervising decision-
making and policy. So we shall also expect a link between public opinion and policy
outcomes. Therefore, the first hypothesis is:
H1: Countries with lower social capital will show a bigger gap between public
preference and actual policy than country with higher social capital.
7
Social capital was not examined in previous literature as a factor affecting the gap
between public preferences and policy. Although there is much research in this field,
it mainly concerns the effect on political participation, quality of government and
health. If we find such an effect, it will be another application of the positive effect of
social capital on societies.
2.2.2 Ethnic heterogeneity
Much as in the case of social capital, where low levels of trust between citizens
sometime obtains, we would expect ethnically diverse countries to show more
suspicion between the different groups and therefore less support for universal policy.
In this situation we would also expect to have a gap between public preference and
policy. This can manifest itself, for example, by a low income population
characterizing a certain minority (as in Israel where most of the low income
populations are Arabs and Ultra-Orthodox Jews). This situation may lead to
diminished support for redistribution by the majority. Another factor operating in
ethnically diverse countries is political division, which leads to more interest groups
and higher costs of policy.
Studies found that ethnically diverse societies tend to show lower public spending
(Alesina, Baqir, & Easterly, 1999; Kuijs, 2000; Luttmer, 2001) and provide fewer
public services (Easterly & Levine, 1997).
La Porta, Lopez-de-Silanes, Shleifer, & Vishny (1999) found that countries with a
high level of ethnic heterogeneity had lower government quality. Alesina et al. (2001)
argued that ethnic heterogeneity is the main reason why the U.S. does not have a
European style welfare state. Kuijs (2000) also found that in ethnically diverse
societies the quality of public spending was lower. This means that the problem is not
only one of public choice but also of technical efficiency.
On the other hand, Annett (2001) found that ethnically diverse countries showed
higher public spending (in total). He claimed that these countries have lower political
stability, which leads to higher government consumption, causing coalition
governments to make efforts to fend off opposition demands. Easterly & Levine
(1997) claimed that ethnically diverse countries have more interest groups, which
leads to less than optimal public decision-making. Another study found that in Latin
8
America an increase in ethnic diversity leads to increased political division,
manifested by a large number of political parties (Birnir & Van Cott, 2007).
Gilens (2009) claimed that in reality the American public supports many components
of the welfare state. That is, they believe that government should spend more on
education, health etc. The source of the resistance to a more generous welfare policy
is the perception that all the money goes to African-Americans and the belief that they
are lazy. He points to media coverage of the welfare subject as the main source for
that perception.
There is probably a relation between ethnic heterogeneity and social capital. Research
has found that ethnically homogeneous countries have high social capital, meaning
ethnic heterogeneity may have a negative effect on social capital (Alesina, Gleaser &
Sacredote, 2001; Alesina & La Ferrara, 2002; Coffé & Geys, 2006; Letki, 2008;
Putnam, 2007).
In sum, ethnic heterogeneity was found to affect the quality of government and
economic growth in previous research via the mechanism of mistrust between the
different groups and the resultant political division. In divided societies, where there
is a feeling that not all groups are contributing equally or that there is a group which is
the main beneficiary of welfare policy, there may be a gap between preferences and
actual support for the policy.
Therefore, our second hypothesis is:
H2: Countries with high ethnic heterogeneity will show a bigger gap between
public preferences and policy outcomes than countries with low ethnic
heterogeneity.
2.2.3. Perceived government effectiveness and corruption
The following hypothesis deals with perceived government effectiveness and
corruption. These two factors concern the public's trust in the government.
Scholz & Lubell (1998) found that a high level of trust in government leads to a
higher rate of tax payments. Oh & Hong (2012) claimed that a low level of trust leads
to low willingness to pay taxes, which in turn leads to low support for redistribution.
Algan, Cahuc, & Sangnier (2011) found that a medium level of trust in government
leads to reduced welfare policy, as in the Anglo-Saxon countries and Japan.
9
Yamamura (2012) examined the relations between trust in government and support
for redistribution in Japan. He found that: 1.In regions where trust in local
government is high people tend to show more support for redistribution. 2. In regions
where trust in government is high, the tax burden is perceived as lower.
Roosma, Gelissen, & van Oorschot (2012) found that in European countries there is a
positive perception about the goals of the welfare state and yet, at the same time, there
is criticism of the efficiency, effectiveness, and results of the welfare state policies.
This difference is especially true for Eastern and Southern European countries,
whereas in Northern and Western European countries there is less criticism of
efficiency and the effectiveness of policy results. This finding indicates that there can
be support in principle for redistribution, but in practice such a policy encounters
resistance due to criticism of the government’s effectiveness. On the other hand,
research in Sweden, Norway and the U.S. found no relation between trust in
government/perceived government effectiveness and preferences for welfare policy
(Edlund, 1999).
Svallfors (1999) found that institutional quality (not that of politicians or political
parties) and trust in institutions affects the level of support for welfare policy. In
countries with a high level of trust and a low level of corruption, people who support
welfare policy in principal will tend to support welfare policy in practice (higher
taxes, increased benefits).
In addition, corrupt governments may exhibit ineffective policy, and therefore policy
outcomes may not reflect public preferences. Brewer, Choi, & Walker (2007) found
that better control of corruption leads to better governance. That is, when corruption is
low, budgets are being used more efficiently.
Olken (2006) examined the effect of corruption on wealth in an anti-poverty program
in Indonesia, which distributed subsidized rice to poor households. He estimated that
the welfare loss from the corruption was large enough to offset the potential welfare
gains from the plan. That is, corruption has an effect on welfare plans' effectiveness.
Kuijs (2000) found that corruption affects the level of public social spending on
health and education – that is, less corrupt governments spend more – but it doesn't
have an effect on policy outcomes, e.g. on technical efficiency.
10
There may be a high correlation between ethnic heterogeneity and corruption. Studies
found that corrupt countries are more ethnically diverse (La Porta et al., 1999; Glaeser
& Saks, 2006).
In sum, previous research dealing with trust in government found it to affect
willingness to pay taxes and support for redistribution. We believe, with Roosma, et
al. (2012), that when there is low trust in government or low perceived government
effectiveness, people who support redistribution in principle may not support it in
practice, because they don’t believe in government's ability to provide this policy
effectively. In addition, corruption can affect welfare plans' effectiveness as well as
government's effectiveness in general. If the public feels that money is being wasted,
this could create a gap between public preference and what it demands from the
government.
Therefore, our third hypothesis is:
H3: Countries with low level of perceived government effectiveness and high
level of perceived corruption will show a bigger gap between public
preferences and policy outcomes than countries with high perceived
government effectiveness and low level of perceived corruption.
2.3 Prior research
A few researchers have investigated the relations between preferences and actual
policy with regards to redistribution:
Kuhn (2012) found that in OECD countries the policy indices: change in GINI before
and after taxes, social spending index and GINI post transfers and taxes, showed a
strong and significant relation to preference for redistribution. That is, in countries
with high support for redistribution, there is also a high level of redistribution,
coupled with a high level of social spending and low income inequality. In addition,
Kuhn found a relation between individual preference for redistribution and wider
political perception. He also found that the relation between individual preference and
wider political perception becomes non-significant when countries' national
characteristics, such as political institutions or ethnic diversity are added to the
equation. His conclusion is that specific characteristics of a nation, like its political
institutions and ethnic diversity, affect both individual citizens' preferences for
redistribution and policy outcomes.
11
Jæger (2006) investigated the relations between welfare state type and support for
redistribution in Western European countries. He found a correlation between the
level of public spending and support for redistribution. In addition, he found a non-
linear relation between welfare state type and preference for redistribution. This could
mean that people from social-democratic countries, for example, may feel that there is
enough redistribution in the country, and therefore oppose more of it.
It can be noted that most previous research which looked at this topic found a match
between preference and policy in most of the European and OECD countries
(including the "Agenda-Setting" literature). However, our suggested method is
somewhat different, as is the set of countries we examine. The present study considers
the relation as not necessarily linear, as claimed by Jæger (2006). For instance, it is
possible that in the Scandinavian countries there is a feeling that too much
redistribution has already occurred and therefore there is an objection to more
redistribution.
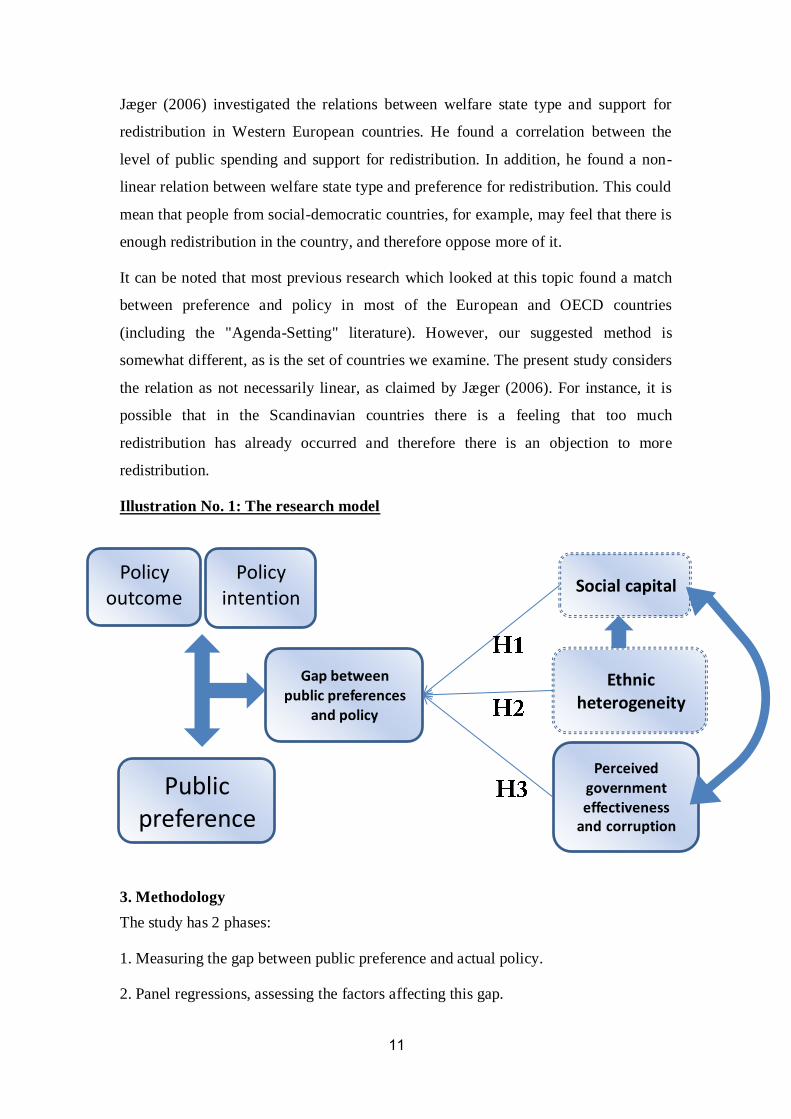
Illustration No. 1: The research model
3. Methodology
The study has 2 phases:
1. Measuring the gap between public preference and actual policy.
2. Panel regressions, assessing the factors affecting this gap.
Gap between public preferences
and policy
Social capital
Ethnic heterogeneity
Perceived government effectiveness
and corruption
Public preference
s
Policy outcome
s
Policy intention
s
12
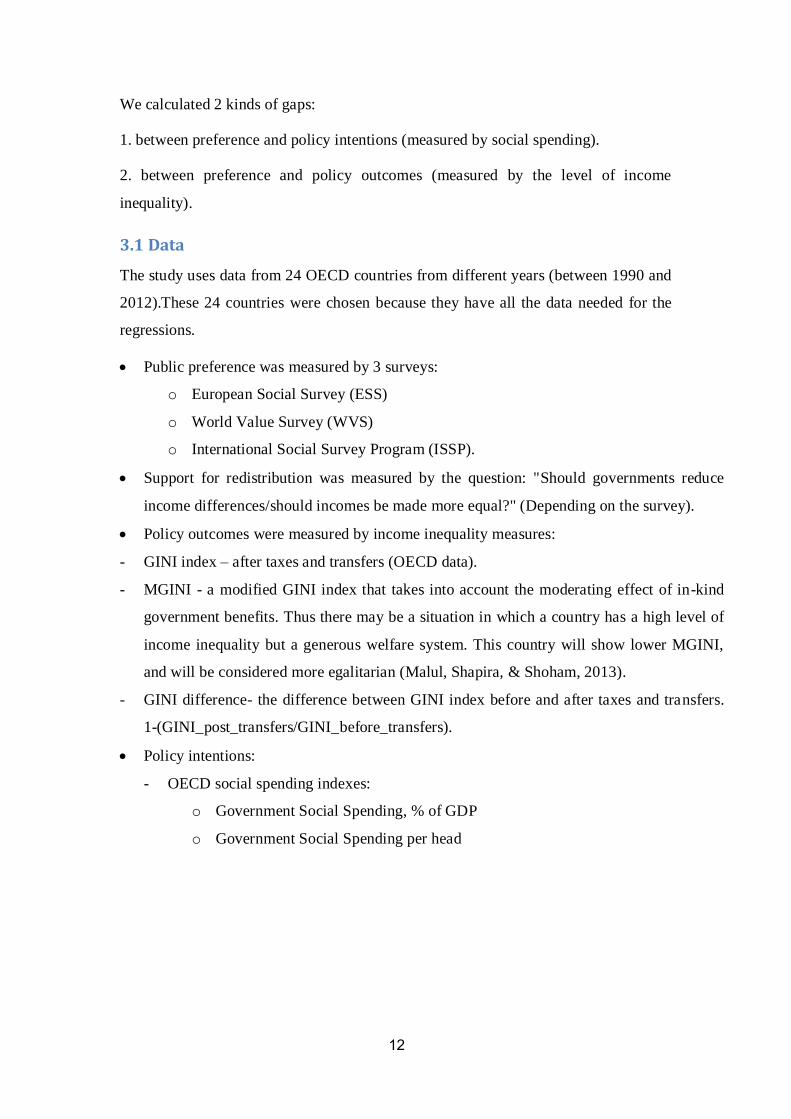
We calculated 2 kinds of gaps:
1. between preference and policy intentions (measured by social spending).
2. between preference and policy outcomes (measured by the level of income
inequality).
3.1 Data
The study uses data from 24 OECD countries from different years (between 1990 and
2012).These 24 countries were chosen because they have all the data needed for the
regressions.
Public preference was measured by 3 surveys:
o European Social Survey (ESS)
o World Value Survey (WVS)
o International Social Survey Program (ISSP).
Support for redistribution was measured by the question: "Should governments reduce
income differences/should incomes be made more equal?" (Depending on the survey).
Policy outcomes were measured by income inequality measures:
- GINI index – after taxes and transfers (OECD data).
- MGINI - a modified GINI index that takes into account the moderating effect of in-kind
government benefits. Thus there may be a situation in which a country has a high level of
income inequality but a generous welfare system. This country will show lower MGINI,
and will be considered more egalitarian (Malul, Shapira, & Shoham, 2013).
- GINI difference- the difference between GINI index before and after taxes and transfers.
1-(GINI_post_transfers/GINI_before_transfers).
Policy intentions:
- OECD social spending indexes:
o Government Social Spending, % of GDP
o Government Social Spending per head
13
3.2 Statistical methods
First step: Measuring the gap:
We measured the gap using 2 different techniques:
1. Difference index:
1. We created a 5 years average for each parameter (with a separate index for
preference and policy). The 15 year database was divided into three groups: 1990-
1998, 1999-2005, 2006-2012.
2. We calculated the index between all countries for the same period {value-
min)/(max-min)}.
3. We subtracted preference index from policy index.
When the difference index is close to 0 there is a match between public preference
and policy measure. When the difference index is high there is a positive gap (the
government spends more than the public demands). When the difference index is low
there is a negative gap (the government spends less than the public demands).
2. Ratio: Dividing policy measure (value) by preference measure (value).
Second step: Measuring the factors affecting the gap
The relations between the factors were examined using panel linear regression, which
takes into account the variance between countries and between the years within each
country. The dependent variable was the gap, defined in the first stage. The
independent variables were:
-Social capital: measured by a survey question: "Most people can be trusted or you
can't be too careful" taken from value surveys. The question was chosen because it
represents the level of trust in one's environment, which represents the level of social
capital. Previous research also used this question to measure social capital.
- Ethnic heterogeneity: measured by the ethnic fractionalization index – reflects the
probability that two randomly selected people from a given country will not share a
certain characteristic (ethnicity). The higher the number the less probability of those
two people sharing that characteristic ( Alesina, Devleeschauwer, Easterly, Kurlat, &
Wacziarg, 2003).
- Government effectiveness: 2 different measures are used:
14
1. ICRG – International country risk guide - ICRG collects political information and
financial and economic data, converting these into risk points. Higher values indicate
higher quality of government. The measure for government effectiveness is comprised
of the variables: "Corruption", "Law and order" and "Bureaucratic quality".
2. GEE (World bank) - These indicators are based on several hundred individual
variables measuring perceptions of governance, drawn from 31 separate data sources
constructed by 25 different organizations. Government effectiveness combines into
single grouping responses on the quality of civil servants, the independence of the
civil service from political pressures, and the credibility of the government's
commitment to policies. The main focus of this index is on "inputs" required for the
government to be able to produce and implement good policies and deliver public
goods.
-Corruption – CPI (corruption perception index)- is derived by "Transparency
International". CPI focuses on corruption in the public sector and defines corruption
as the abuse of public office for private gain. The CPI score relates to perceptions of
the degree of corruption as seen by business people, risk analysts and the general
public and ranges between 10 (highly clean) and 0 (highly corrupt).
Since there was high correlation between some of the indices1 and since the ICRG
index includes both government effectiveness and corruption, we ran a basic
regression (model 1) with three independent variables: ethnic heterogeneity, social
capital and government effectiveness measured by ICRG. In addition, we ran
regressions where government effectiveness and corruption were entered separately.
Model 2 included ethnic heterogeneity, social capital and government effectiveness
(measured by GEE). Model 3 included ethnic heterogeneity, social capital and
corruption (measured by CPI).
We conducted a Hausman test for each of the regressions and found that in all the
models based on difference index, there is no endogeneity and used "random effects".
In addition, for most of the ratio index regressions there is endogeneity (besides
MGINI), and therefore used "fixed effects".
1 The correlation between ICRG (government effectiveness and corruption) and CPI (corruption) was
0.848. The correlation between GEE (government effectiveness) and CPI (corruption) was 0.858.
These variables were entered in separate regressions. The correlation of social capital with
effectiveness and corruption was also high, but lower: 0.809 with ICRG, 0.758 with GEE and 0.749
with CPI. These variables were entered into the same regression.
15
We believe there is no endogeneity in the model. The existence of the gap is not
supposed to affect social capital: social capital is probably affected by cultural
characteristics of the country, so it shouldn’t change much throughout the years. Even
if there are changes in social capital, they would probably be affected by major
economic and social transitions and not by preferences for redistribution or by the gap
between preference and policy. The gap may affect the level of corruption and
government effectiveness, but not immediately. This effect can happen after a few
years. For example, if the level of corruption is high and leads to a gap, the public
may demand to narrow this gap, but this doesn't happen immediately. Finally, ethnic
heterogeneity is an exogenous variable that cannot be affected by the gap.
Ordinal and binary regressions:
An issue that came up during the study is the difference between a positive gap (when
the country spends more than the public demands) and a negative gap (when the
country spends less than the public demands). In the linear regression there is a
linearity assumption. That is, that positive gap is the optimal situation, no gap lies in
the middle and a negative gap is the least preferred situation; while, at least
theoretically, our assumption is that the best situation is no gap. To address this issue,
we conducted two regression types:
1. Ordinal logit- which differentiates between the three groups (positive gap, small or
no gap, negative gap). The cut-off for the groups was 0.1 and -0.1 in the difference
index. This created 3 groups for each variable, generally at the same size (for
"spending per head" the cut-off was changed to 0.05 and -0.2 for the groups to be at
the same size).
2. Binary logit- based on the ordinal logit but separating to 1- gap (positive and
negative) and 0 – no gap.
4. Results
4.1 Measuring the gap
The graphs shown here are all based on the difference index. The ratio index shows
similar results. The difference index was calculated for three different periods: 1990-
1998, 1999-2005, 2006-2012. Illustrations nos. 2-4 shows the different indices
between preference and social spending as a percent of GDP for all periods.
16
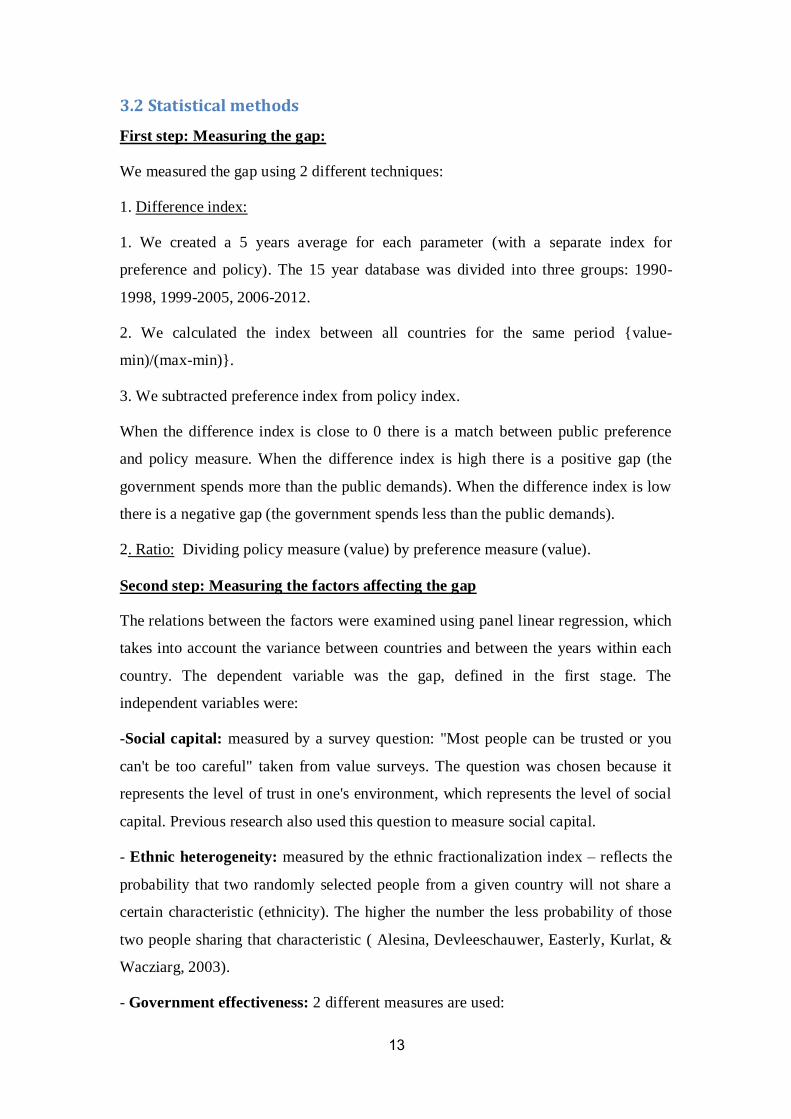
Illustration no. 2: Difference index of the gap between public preference and
social spending as % of GDP, averaged for the years 1990-1998
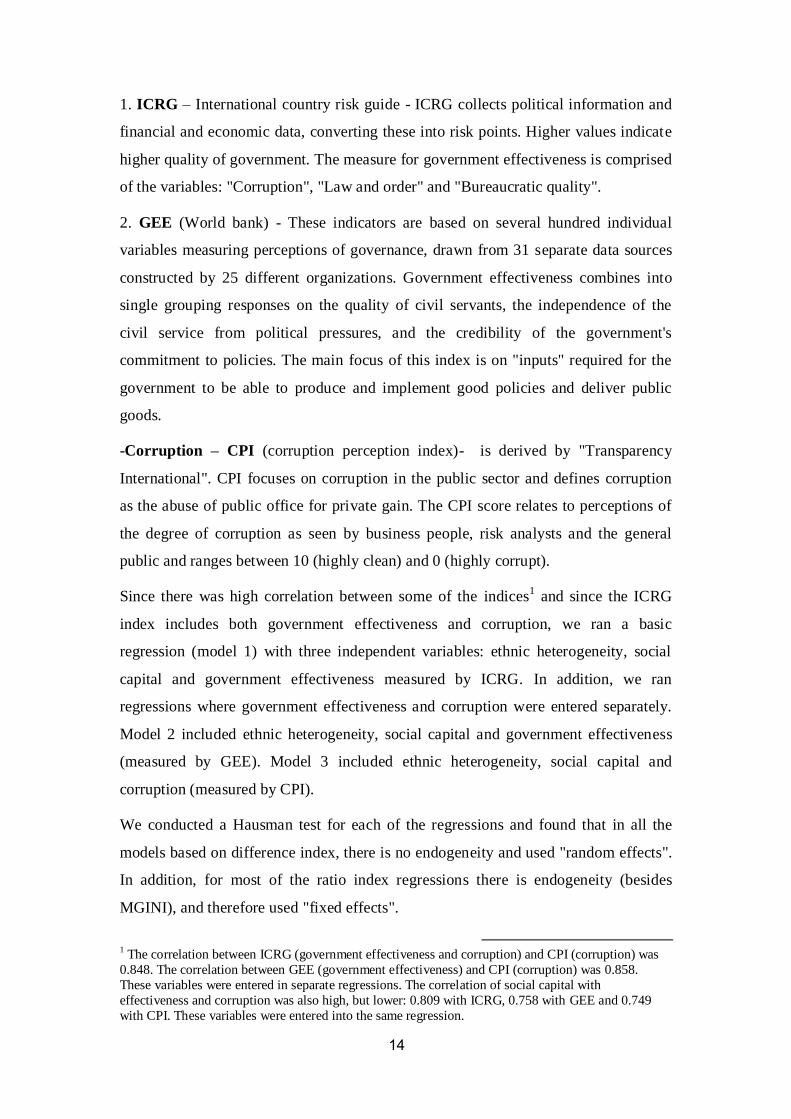
Illustration no. 3: Difference index of the gap between public preference and
social spending as % of GDP, averaged for the years 1999-2005
-1
-0.8
-0.6
-0.4
-0.2
0
0.2
0.4
0.6
0.8
1
Port
uga
l
Isra
el
Irel
and
Swit
zerl
and
Jap
an
Ital
y
Spai
n
Icel
and
Uni
ted
Kin
gdo
m
Au
stra
lia
Un
ited
Sta
tes
No
rway
Au
stri
a
New
-Zea
lan
d
Ger
man
y
Fran
ce
Can
ada
Fin
lan
d
Net
her
land
s
Bel
gium
Swed
en
Den
mar
k
-0.8
-0.6
-0.4
-0.2
0
0.2
0.4
0.6
0.8
1
Isra
el
Gre
ece
Po
rtu
gal
Irel
and
Icel
and
Swit
zerl
and
Spai
n
Au
stra
lia
Can
ada
Un
ited
Sta
tes
Un
ited
Kin
gdo
m
New
-Zea
lan
d
No
rway
Jap
an
Fin
lan
d
Net
her
land
s
Au
stri
a
Luxe
mb
urg
Fran
ce
Ital
y
Bel
gium
Ger
man
y
Swed
en
Den
mar
k
17
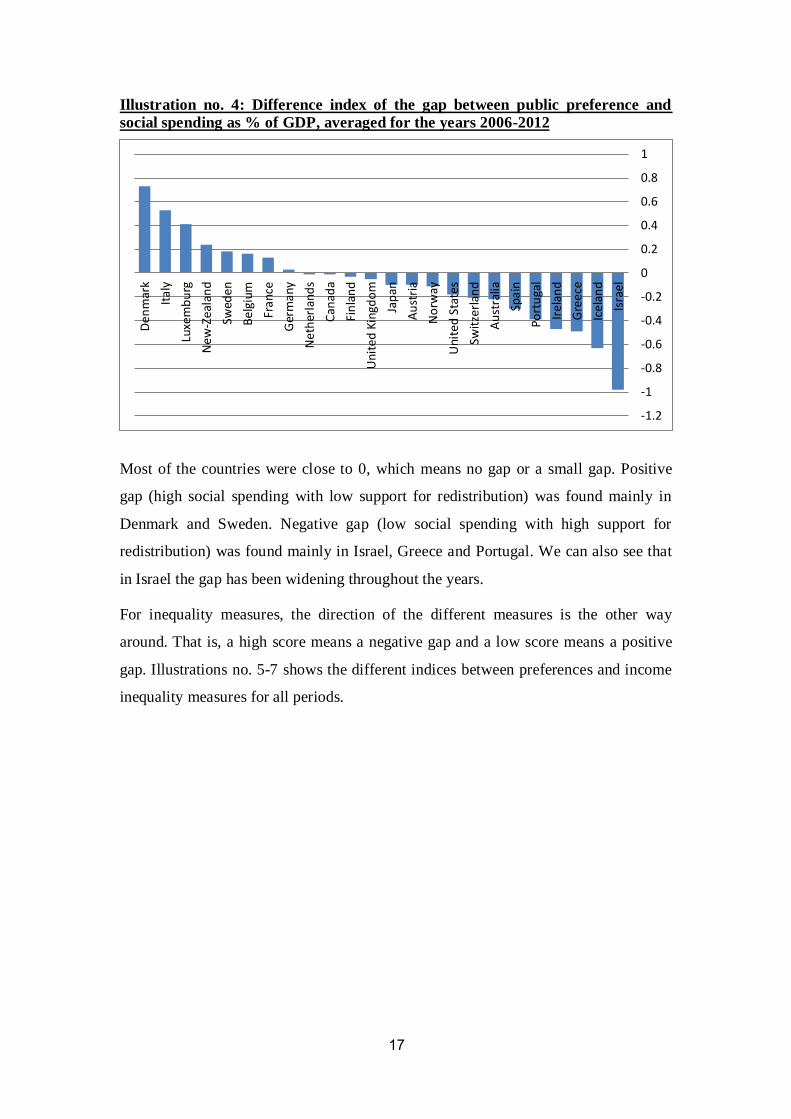
Illustration no. 4: Difference index of the gap between public preference and
social spending as % of GDP, averaged for the years 2006-2012
Most of the countries were close to 0, which means no gap or a small gap. Positive
gap (high social spending with low support for redistribution) was found mainly in
Denmark and Sweden. Negative gap (low social spending with high support for
redistribution) was found mainly in Israel, Greece and Portugal. We can also see that
in Israel the gap has been widening throughout the years.
For inequality measures, the direction of the different measures is the other way
around. That is, a high score means a negative gap and a low score means a positive
gap. Illustrations no. 5-7 shows the different indices between preferences and income
inequality measures for all periods.
-1.2
-1
-0.8
-0.6
-0.4
-0.2
0
0.2
0.4
0.6
0.8
1
Isra
el
Icel
and
Gre
ece
Irel
and
Po
rtu
gal
Spai
n
Au
stra
lia
Swit
zerl
and
Un
ited
Sta
tes
No
rway
Au
stri
a
Jap
an
Un
ited
Kin
gdo
m
Fin
lan
d
Can
ada
Net
her
land
s
Ger
man
y
Fran
ce
Bel
gium
Swed
en
New
-Zea
lan
d
Luxe
mb
urg
Ital
y
Den
mar
k
18
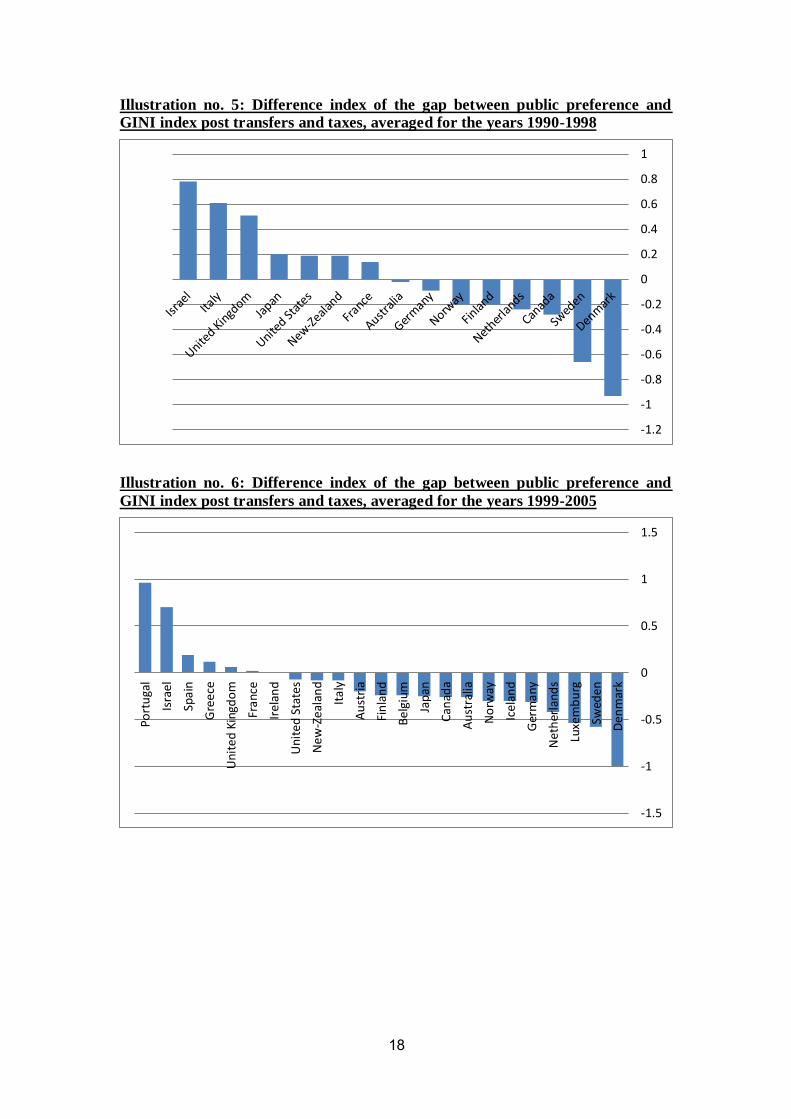
Illustration no. 5: Difference index of the gap between public preference and
GINI index post transfers and taxes, averaged for the years 1990-1998
Illustration no. 6: Difference index of the gap between public preference and
GINI index post transfers and taxes, averaged for the years 1999-2005
-1.2
-1
-0.8
-0.6
-0.4
-0.2
0
0.2
0.4
0.6
0.8
1
-1.5
-1
-0.5
0
0.5
1
1.5
Den
mar
k
Swed
en
Luxe
mb
urg
Net
her
land
s
Ger
man
y
Icel
and
No
rway
Au
stra
lia
Can
ada
Jap
an
Bel
gium
Fin
lan
d
Au
stri
a
Ital
y
New
-Zea
lan
d
Un
ited
Sta
tes
Irel
and
Fran
ce
Un
ited
Kin
gdo
m
Gre
ece
Spa
in
Isra
el
Po
rtu
gal
19
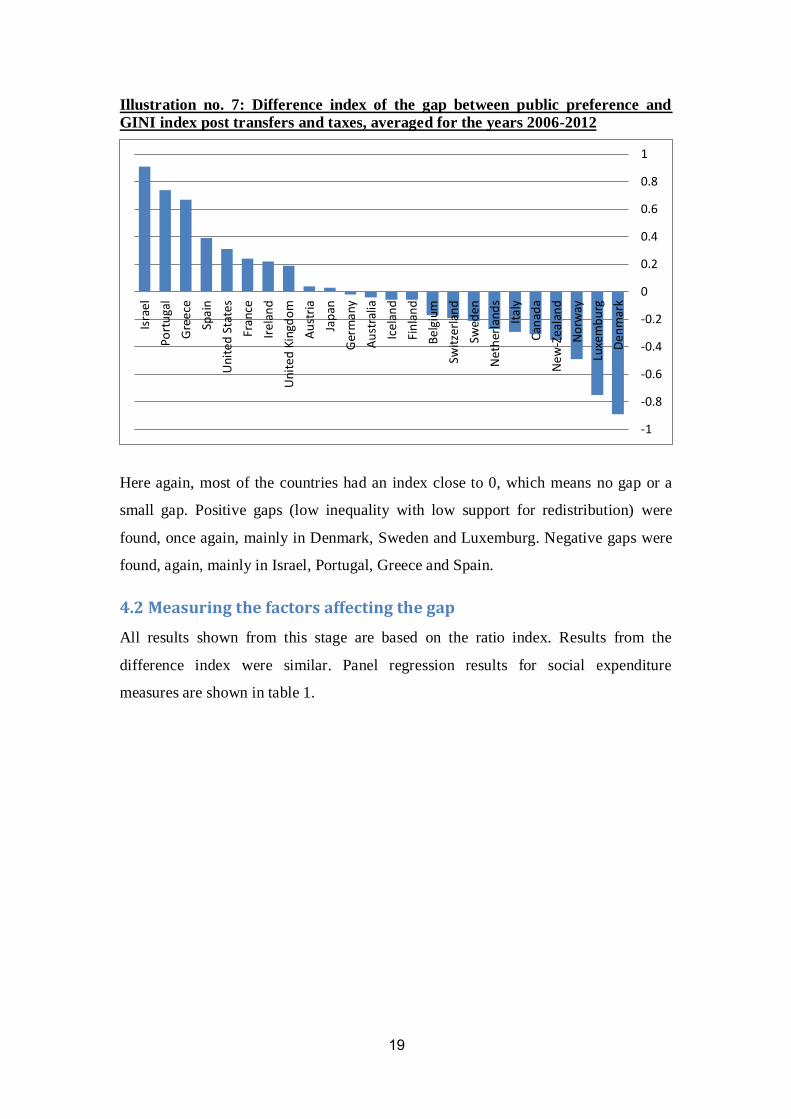
Illustration no. 7: Difference index of the gap between public preference and
GINI index post transfers and taxes, averaged for the years 2006-2012
Here again, most of the countries had an index close to 0, which means no gap or a
small gap. Positive gaps (low inequality with low support for redistribution) were
found, once again, mainly in Denmark, Sweden and Luxemburg. Negative gaps were
found, again, mainly in Israel, Portugal, Greece and Spain.
4.2 Measuring the factors affecting the gap
All results shown from this stage are based on the ratio index. Results from the
difference index were similar. Panel regression results for social expenditure
measures are shown in table 1.
-1
-0.8
-0.6
-0.4
-0.2
0
0.2
0.4
0.6
0.8
1
De
nm
ark
Luxe
mb
urg
No
rway
New
-Zea
lan
d
Can
ada
Ital
y
Ne
ther
lan
ds
Swed
en
Swit
zerl
and
Bel
gium
Fin
lan
d
Icel
and
Au
stra
lia
Ger
man
y
Jap
an
Au
stri
a
Un
ited
Kin
gdo
m
Irel
and
Fra
nce
Un
ite
d S
tate
s
Spai
n
Gre
ece
Port
uga
l
Isra
el
20
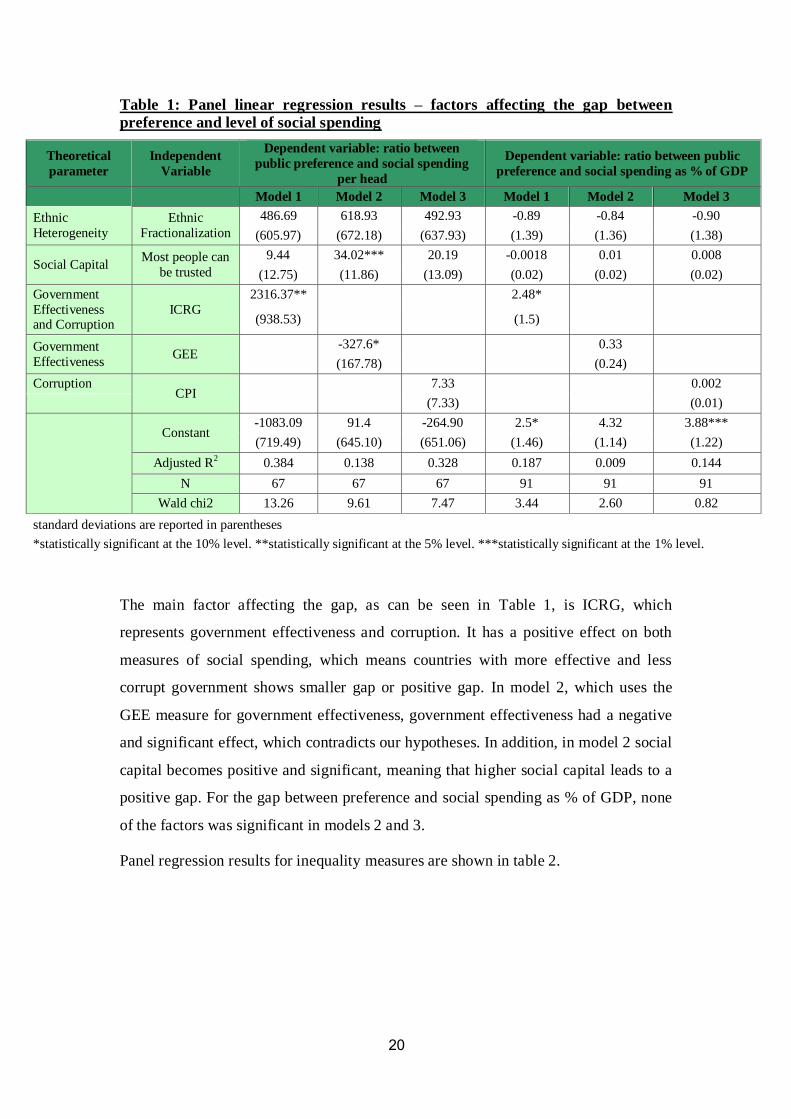
Table 1: Panel linear regression results – factors affecting the gap between
preference and level of social spending
Dependent variable: ratio between public
preference and social spending as % of GDP
Dependent variable: ratio between
public preference and social spending
per head
Independent
Variable
Theoretical
parameter
Model 3 Model 2 Model 1 Model 3 Model 2 Model 1
-0.90 -0.84 -0.89 492.93 618.93 486.69 Ethnic
Fractionalization
Ethnic
Heterogeneity (1.38) (1.36) (1.39) (637.93) (672.18) (605.97)
0.008 0.01 -0.0018 20.19 34.02*** 9.44 Most people can
be trusted Social Capital
(0.02) (0.02) (0.02) (13.09) (11.86) (12.75)
2.48* 2316.37**
ICRG
Government
Effectiveness and Corruption (1.5) (938.53)
0.33 -327.6* GEE
Government
Effectiveness (0.24) (167.78)
0.002 7.33 CPI
Corruption
(0.01) (7.33)
3.88*** 4.32 2.5* -264.90 91.4 -1083.09 Constant
(1.22) (1.14) (1.46) (651.06) (645.10) (719.49)
0.144 0.009 0.187 0.328 0.138 0.384 Adjusted R2
91 91 91 67 67 67 N
0.82 2.60 3.44 7.47 9.61 13.26 Wald chi2
standard deviations are reported in parentheses
*statistically significant at the 10% level. **statistically significant at the 5% level. ***statistically significant at the 1% level.
The main factor affecting the gap, as can be seen in Table 1, is ICRG, which
represents government effectiveness and corruption. It has a positive effect on both
measures of social spending, which means countries with more effective and less
corrupt government shows smaller gap or positive gap. In model 2, which uses the
GEE measure for government effectiveness, government effectiveness had a negative
and significant effect, which contradicts our hypotheses. In addition, in model 2 social
capital becomes positive and significant, meaning that higher social capital leads to a
positive gap. For the gap between preference and social spending as % of GDP, none
of the factors was significant in models 2 and 3.
Panel regression results for inequality measures are shown in table 2.
21
Table 2: Panel linear regression results – factors affecting the gap between
preference and level of income inequality
Dependent variable: ratio between public
preference and GINI difference
Dependent variable: ratio between
public preference and GINI index
Independent
Variable
Theoretical
parameter
Model 3 Model 2 Model 1 Model 3 Model 2 Model 1
0.005 0.002 0.005 -12.06 -8.19 -7.48 Ethnic
Fractionalization
Ethnic
Heterogeneity (0.02) (0.02) (0.25) (16.06) (17.07) (16.44)
0.0003 0.0004 -0.00001 -0.57* -0.68** -0.47 Most people can
be trusted Social Capital
(0.0004) (0.0004) (0.0004) (0.34) (0.34) (0.35)
0.097*** -80.04*** ICRG
Government Effectiveness
and Corruption (0.03) (27.02)
0.005 -13.62** GEE
Government
Effectiveness (0.007) (6.18)
0.0003 -0.54*** CPI
Corruption
(0.0002) (0.20)
0.031 0.04 -0.01 142.19*** 128.16*** 163.26*** Constant
(0.02) (0.02) (0.03) (15.98) (16.3) (19.63)
0.413 0.409 0.435 0.593 0.562 0.573 Adjusted R2
54 54 54 59 59 59 N
3.21 2.60 10.87 26.09 20.63 25.86 Wald chi2
standard deviations are reported in parentheses
*statistically significant at the 10% level. **statistically significant at the 5% level. ***statistically significant at the 1% level.
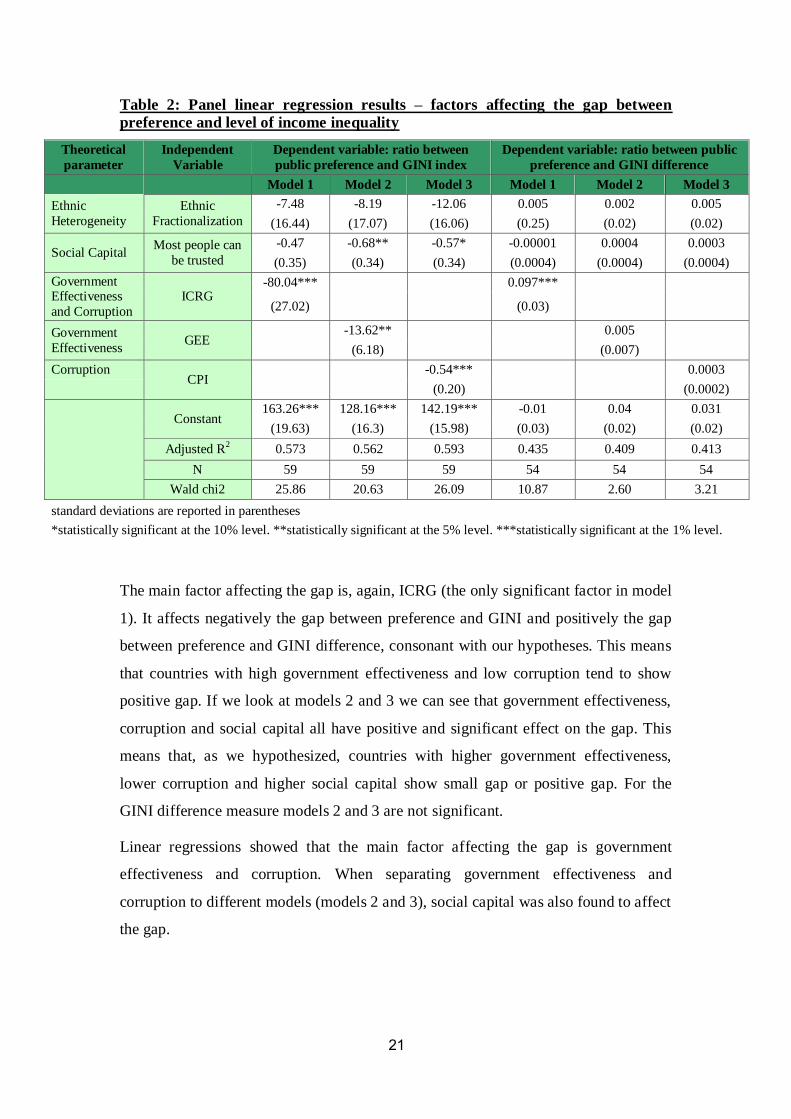
The main factor affecting the gap is, again, ICRG (the only significant factor in model
1). It affects negatively the gap between preference and GINI and positively the gap
between preference and GINI difference, consonant with our hypotheses. This means
that countries with high government effectiveness and low corruption tend to show
positive gap. If we look at models 2 and 3 we can see that government effectiveness,
corruption and social capital all have positive and significant effect on the gap. This
means that, as we hypothesized, countries with higher government effectiveness,
lower corruption and higher social capital show small gap or positive gap. For the
GINI difference measure models 2 and 3 are not significant.
Linear regressions showed that the main factor affecting the gap is government
effectiveness and corruption. When separating government effectiveness and
corruption to different models (models 2 and 3), social capital was also found to affect
the gap.
22
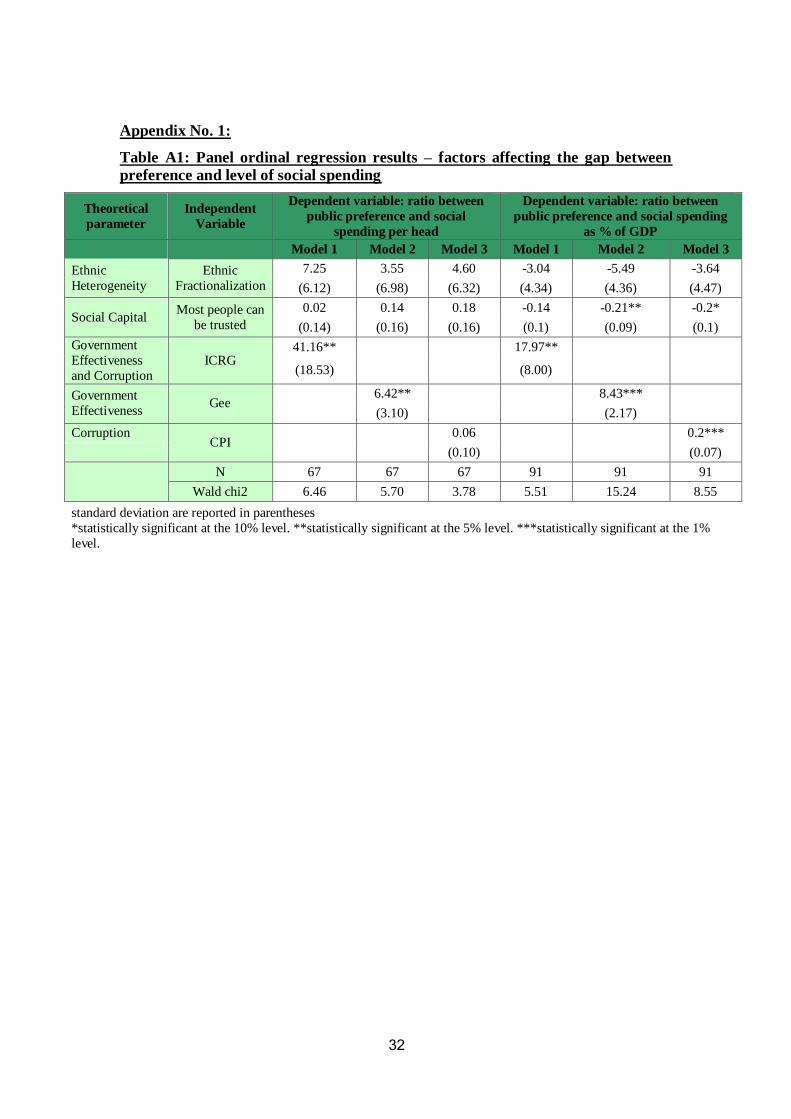
Ordinal regressions
In ordinal regressions there is a gross distinction between the three groups: countries
with a positive gap received the value 1. Countries with no gap or a small gap
received the value 0 and countries with a negative gap received the value -1. The
results for the gap between preference and social spending were very similar to the
linear regression results. That is, government effectiveness and corruption showed a
positive and significant effect. For the gap between preference and inequality
measures none of the factors were significant in the first model, but in model 2 and 3
both government effectiveness and corruption were negative and significant,
consonant with the hypothesis. This means that countries with high government
effectiveness and low corruption show small gaps between public preferences and
policy (the full tables are reported in Appendix 1).
In conclusion, Ordinal regressions results show that by looking at gross distinction
between the groups we achieve similar results, which strengthens our findings about
the effect of government effectiveness and corruption on the gap.
Binary regressions
In this regression we created binary factor where 1=gap and 0=no gap. The regression
results are presented in Tables 3 and 4.
23
Table 3: Logit regression results – factors affecting the gap between preference
and level of social spending
Dependent variable: ratio between
public preference and social spending
as % of GDP
Dependent variable: ratio between
public preference and social
spending per head
Independent
Variable
Theoretical
parameter
Model 3 Model 2 Model 1 Model 3 Model 2 Model 1
0.84 1.54 0.17 2.45 4.81 1.20 Ethnic
Fractionalization
Ethnic
Heterogeneity (1.90) (1.90) (1.79) (4.10) (5.03) (3.88)
0.07 0.05 0.11* 0.06 0.09 0.07 Most people can be
trusted Social Capital
(0.06) (0.05) (0.06) (0.12) (0.13) (0.11)
-18.90*** -19.27* ICRG
Government
Effectiveness
and Corruption (6.61) (1.77)
-2.58** -6.39* GEE
Government
Effectiveness (1.30) (3.38)
-0.10** -0.13 CPI
Corruption
(0.05) (0.09)
5.40** 2.77 11.89*** 7.73 8.84 14.89* Constant
(2.73) (2.16) (4.14 (6.65) (5.81) (8.51)
91 91 91 67 67 67 N
4.71 4.77 8.67 3.16 3.99 3.65 Wald chi2
standard deviations are reported in parentheses
*statistically significant at the 10% level. **statistically significant at the 5% level. ***statistically significant at the 1%
level.
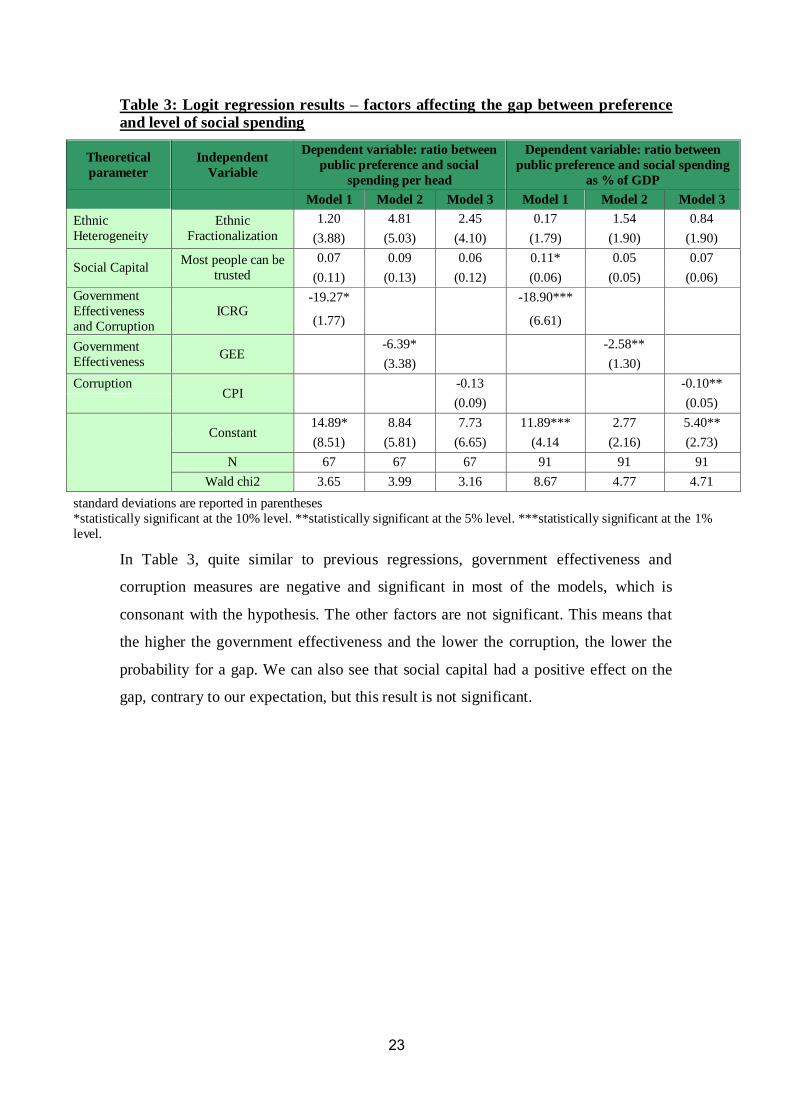
In Table 3, quite similar to previous regressions, government effectiveness and
corruption measures are negative and significant in most of the models, which is
consonant with the hypothesis. The other factors are not significant. This means that
the higher the government effectiveness and the lower the corruption, the lower the
probability for a gap. We can also see that social capital had a positive effect on the
gap, contrary to our expectation, but this result is not significant.
24
Table 4: Logit regression results – factors affecting the gap between preference
and level of income inequality
Dependent variable: ratio between
public preference and GINI index
Independent
Variable
Theoretical
parameter
Model 3 Model 2 Model 1
-1.47 0.23 -0.05 Ethnic
Fractionalization
Ethnic
Heterogeneity (2.38) (3.41) (3.37)
-0.01 0.08 0.06 Most people can
be trusted Social Capital
(0.05) (0.09) (0.09)
-13.26 ICRG
Government
Effectiveness
and Corruption (8.69)
-4.33* Gee
Government
Effectiveness (2.29)
-0.16* CPI
Corruption
(0.08)
9.33* 4.60 10.19* Constant
(4.89) (3.48) (5.47)
52 52 59 N
3.75 3.98 2.79 Wald chi2
standard deviations are reported in parentheses
*statistically significant at the 10% level. **statistically significant at the 5%
level. ***statistically significant at the 1% level.
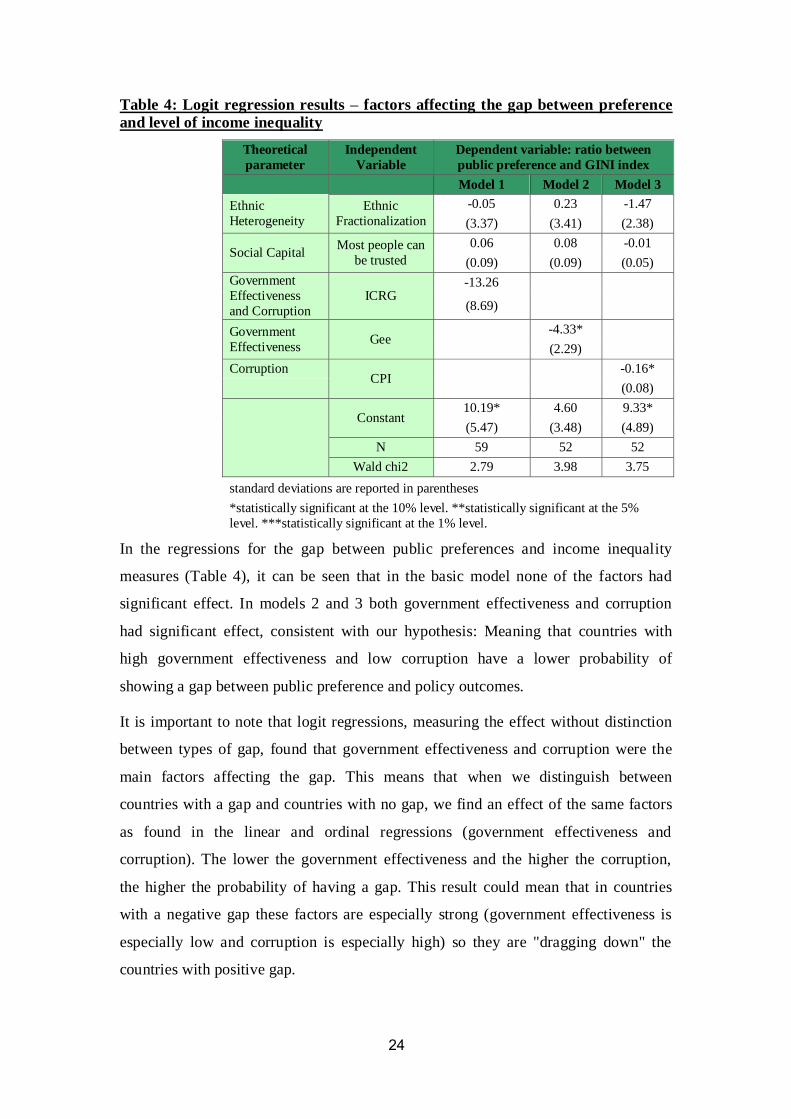
In the regressions for the gap between public preferences and income inequality
measures (Table 4), it can be seen that in the basic model none of the factors had
significant effect. In models 2 and 3 both government effectiveness and corruption
had significant effect, consistent with our hypothesis: Meaning that countries with
high government effectiveness and low corruption have a lower probability of
showing a gap between public preference and policy outcomes.
It is important to note that logit regressions, measuring the effect without distinction
between types of gap, found that government effectiveness and corruption were the
main factors affecting the gap. This means that when we distinguish between
countries with a gap and countries with no gap, we find an effect of the same factors
as found in the linear and ordinal regressions (government effectiveness and
corruption). The lower the government effectiveness and the higher the corruption,
the higher the probability of having a gap. This result could mean that in countries
with a negative gap these factors are especially strong (government effectiveness is
especially low and corruption is especially high) so they are "dragging down" the
countries with positive gap.
25
5. Discussion
This study examined the relation between public preferences for redistribution and
policy intentions (measured by social spending) and outcomes (measured by GINI
index) in OECD countries for different years. The first stage of the study defined the
gap. The results from this stage show that countries like Israel, Portugal, Greece and
Spain show mostly a negative gap (spending less than the public demands or are less
egalitarian than the public wishes). Countries like Denmark, Sweden and Luxemburg
show mostly positive gaps (spending more than the public demands or are more
egalitarian than the public wishes). Countries like Austria, Belgium, U.S.A. and
Canada mostly show a match between public preferences and policy or a small gap.
The second stage of the study looked at the factors affecting this gap. The results
show that among the factors suggested in the study, government effectiveness and
corruption were the most significant elements affecting the gap between public
preference and policy. This finding supports hypothesis 3. Another factor that was
found to be significant in some regressions was social capital- which partly supports
hypothesis 2. Ethnic heterogeneity wasn't found to affect the gap, contrary to the first
hypothesis.
The issue of consistency between public preference and policy is one of the aspects of
democratic functioning. This is an even more significant test of democracy's dealing
with the issue of redistribution, since this issue normally gets little coverage in the
media. Page & Shapiro (1983) claimed that when visibility of certain subjects is low,
the probability of government responding to public demand is similarly lower.
The findings for U.S.A., U.K., Canada and other countries support the Agenda Setting
theory (Baumgartner et al., 2009; Page & Shapiro, 1983; Soroka & Wlezien, 2004;
Soroka & Wlezien, 2010; Wlezien, 1995). In these countries, there is a match between
public preferences and actual policy, much like the predictions of the Agenda Setting
theory and the Thermostat model. The match found in the U.S. can be explained by
the type of governance, as Soroka & Wlezien (2004) claimed. This means that in a
presidential system (the U.S.), government responsiveness is greater than in the
parliamentarian system. This can also be explained by the level of centralization.
Under centralized governance (where the central government is strong)
responsiveness to public demands will be higher than under federal governance
(where local states has more power) (Soroka & Wlezien, 2004).
26
In contrast to previous Agenda Setting research, we also found countries with no
match between public preferences and policy. First, we will discuss countries with a
negative gap (lower level of spending than the public demands and higher level of
inequality than the public expects): Israel, Greece, Portugal and sometimes Spain.
One quality these countries (except Israel) have in common is that they have been
linked as belonging to the so-called PIGS countries (Portugal, Italy, Greece and
Spain): These are EU member countries that were unable to refinance their
government debt or to bail out over-indebted banks on their own during the debt
crisis, beginning in 2008. It is possible that the gap or the low government
effectiveness and high corruption, were the factors that lead to economic dysfunction
or the other way around. This can be a topic for future research.
Another interesting finding is that some countries show a positive gap (higher level of
public spending than the public demands and lower level of inequality than the public
expects). These are social-democratic countries, considered to have a good quality of
government, like Denmark, Sweden and Luxemburg. This raises the question: Is this a
situation where the government is not in touch with public demands? Understood in
thermostat model terms, the public demands lowering the level of spending and the
government has not responded. Another possibility is that the public feels there is too
much redistribution in these countries, meaning there is a non-linear relation between
welfare state type and preference for redistribution (Jæger, 2006). Yet another option
is that in these countries the government is confident enough to lead a policy even
when there is no demand from the public, assuming that the public will adopt
governmental preferences.
The main finding from the second stage of the study is that government effectiveness
and corruption are the main factors affecting the gap. This finding is consistent in
both linear regression (when a higher score equates to a positive gap and a lower
score to a negative gap), Ordinal regression (-1 for negative gap, 0 for small gap, 1 for
positive gap) and logit regression (0 for small gap, 1 for negative or positive gap).
This could mean that these factors (government effectiveness and corruption) are
especially strong in countries with a negative gap. The meaning of this finding may be
that the public doesn't demand the policy it believes in because of lack of trust in the
government's ability to deliver the policy effectively, or because it believes the
government is corrupt.
27
Another factor found to affect the gap in some regressions was social capital- the level
of trust in other people. This could mean that countries with low social capital show a
low level of civic action, and the citizens don’t act to demand the policy they want or
to supervise the government.
It is also important to mention that ethnic heterogeneity was not found significant in
any of the regressions. That is, contrary to former research that found an effect of
ethnic heterogeneity on quality of government and support for redistribution (Alesina
et al., 1999; Alesina et al., 2001; Easterly & Levine, 1997; Kuijs, 2000; Luttmer,
2001), in this study it had no effect on the gap between preference and policy.
Another interesting point is that government effectiveness and corruption had a
significant effect on both policy intentions (public spending) and policy outcomes
(income inequality). That is, these factors bring about low trust in government, which
may in turn lead to a failure to demand the policy citizens want. They can also lead to
ineffective performance, even if the intention is to deliver the desired policy.
It seems that improving government effectiveness and fighting corruption may
contribute to reducing the gap between public preference for redistribution and policy,
and can lead to better functioning democracy which acts according to the citizens'
preferences.
28
References
Alesina, A. Devleeschauwer, A., Easterly, W., Kurlat, S., & Wacziarg, R. (2003).
Fractionalization. Journal of Economic Growth, 8(2), 155-194.
Alesina, A., & Glaeser, E. L. (2004). Fighting poverty in the US and Europe: A world
of difference. Oxford : Oxford University Press.
Alesina, A., & La Ferrara, E. (2002). Who trusts others?. Journal of Public Economics, 85(2), 207-234.
Alesina, A., & Schuendeln, N. F. (2005). Good bye Lenin (or not?): The effect of
communism on people's preferences. National Bureau of Economic Research
Working Paper Series, No.w11700. Retrieved from: http://www.nber.org/papers/w11700
Alesina, A. F., & Giuliano, P. (2009). Preferences for redistribution. National Bureau
of Economic Research Working Paper Series, No. 14825. Retrieved from:
http://www.nber.org/papers/w14825; http://www.nber.org/papers/w14825.pdf
Alesina, A., Baqir, R., & Easterly, W. (1999). Public goods and ethnic divisions. The
Quarterly Journal of Economics, 114(4), 1243-1284. doi:10.1162/003355399556269
Alesina, A., Glaeser, E., & Sacerdote, B. (2001). Why doesn't the US have a
European-style welfare system?. National Bureau of Economic Research
Working Paper Series, No. 8524. Retrieved from http://www.nber.org/papers/w8524; http://www.nber.org/papers/w8524.pdf
Algan, Y., Cahuc, P., & Sangnier, M.,. (2011). Efficient and inefficient welfare states.
IZA Discussion No. Paper No. 5445.
Andreß, H., & Heien, T. (2001). Four worlds of welfare state attitudes? A comparison
of Germany, Norway, and the United States. European Sociological Review, 17(4), 337-356.
Annett, A. (2001). Social fractionalization, political instability, and the size of
government. IMF Staff Papers 561-592.
Arts, W., & Gelissen, J. (2001). Welfare states, solidarity and justice principles: Does the type really matter? Acta Sociologica, 44(4), 283-299.
Baumgartner, F. R., Breunig, C., Green‐Pedersen, C., Jones, B. D., Mortensen, P. B.,
Nuytemans, M., et al. (2009). Punctuated equilibrium in comparative perspective. American Journal of Political Science, 53(3), 603-620.
Birnir, J. K., & Van Cott, D. L. (2007). Disunity in diversity: Party system
fragmentation and the dynamic effect of ethnic heterogeneity on Latin American legislatures . Latin American Research Review, 42(1), 99-125.
Brass, D. J., Butterfield, K. D., & Skaggs, B. C. (1998). Relationships and unethical
behavior : A social network perspective. Academy of Management Review, 23(1),
14-31. doi:10.5465/AMR.1998.192955
Brewer, G. A., Choi, Y., & Walker, R. M. (2007). Accountability, corruption and
government effectiveness in Asia: An exploration of World Bank governance indicators. International Public Management Review, 8(2), 200-217.
29
Coffé, H., & Geys, B. (2006). Community heterogeneity: A burden for the creation of
social capital?. Social Science Quarterly, 87(5), 1053-1072. doi:10.1111/j.1540-
6237.2006.00415.x
Corneo, G., & Grüner, H. P. (2002). Individual preferences for political redistribution. Journal of Public Economics, 83(1), 83-107.
Crombez, C. (2003). The democratic deficit in the European Union: much ado about nothing? European Union Politics, 4(1), 101-120.
Cusack, T., Iversen, T., & Rehm, P. (2008). Economic shocks, inequality, and popular
support for redistribution. Democracy, Inequality, and Representation. New York: Russell Sage Foundation. 203-231.
Dalton, R. J. (2004). Democratic challenges, democratic choices: The erosion of
political support in advanced industrial democracies. Oxford: Oxford University
Press. doi:10.1093/acprof:oso/9780199268436.001.0001
Deutsch, K. W. & Deutsch, K. W. (1963). The nerves of government: Models of political communication and control. New York: Free Press of Glencoe.
Doherty, D., Gerber, A. S., & Green, D. P. (2006). Personal income and attitudes
toward redistribution: A study of lottery winners. Political Psychology, 27(3),
441-458.
Durante, R., & Putterman, L. (2009). Preferences for redistribution and perception of fairness: An experimental study. Available at SSRN 1004573,
Easterly, W., & Levine, R. (1997). Africa's growth tragedy: Policies and ethnic
divisions. The Quarterly Journal of Economics, 112(4), 1203-1250.
doi:10.1162/003355300555466
Easton, D. (1965). A framework for political analysis. New-Jersey: Prentice-Hall Englewood Cliffs.
Edlund, J. (1999). Trust in government and welfare regimes: Attitudes to
redistribution and financial cheating in the USA and Norway. European Journal
of Political Research, 35(3), 341-370.
Estevez-Abe, M., Iversen, T., & Soskice, D. (2001). Social protection and the
formation of skills: A reinterpretation of the welfare state. Varieties of Capitalism: The Institutional Foundations of Comparative Advantage. 145-183.
Fukuyama, F. (1995). Trust: The social virtues and the creation of prosperity. New
York: Free Press.
Gelissen, J. (2000). Popular support for institutionalized solidarity: A comparison
between European welfare states. International Journal of Social Welfare, 9(4), 285-300.
Gilens, M. (2009). Why Americans hate welfare: Race, media, and the politics of
antipoverty policy. Chicago: University of Chicago Press.
Glaeser, E. L., & Saks, R. E. (2006). Corruption in America. Journal of Public Economics, 90(6–7), 1053-1072. doi:10.1016/j.jpubeco.2005.08.007
Iversen, T., & Soskice, D. (2001). An asset theory of social policy preferences. American Political Science Review, 95(4), 875-894.
30
Iversen, T., & Soskice, D. (2006). Electoral institutions and the politics of coalitions:
Why some democracies redistribute more than others. American Political Science
Review, 100(2), 165.
Jæger, M. M. (2006). Welfare regimes and attitudes towards redistribution: The regime hypothesis revisited. European Sociological Review, 22(2), 157-170.
Kuhn, A. (2012). Redistributive preferences, redistribution, and inequality: Evidence
from a panel of OECD countries. IZA Discussion Paper No. 6721. Available at
SSRN: http://ssrn.com/abstract=2114901
Kuijs, L. (2000). The impact of ethnic heterogeneity on the quantity and quality of public spending . IMF Working Paper No. WP/00/49.
La Porta, R., Lopez-de-Silanes, F., Shleifer, A., & Vishny, R. (1999b). The quality of
government. Journal of Law, Economics, and Organization, 15(1), 222-279.
doi:10.1093/jleo/15.1.222
Lax, J. R., & Phillips, J. H. (2012). The democratic deficit in the states. American Journal of Political Science, 56(1), 148-166.
Letki, N. (2008). Does diversity erode social cohesion? Social capital and race in
British neighborhoods. Political Studies, 56(1), 99-126. doi:10.1111/j.1467-
9248.2007.00692.x
Lipsmeyer, C., & Nordstrom, T. (2003). East versus west: Comparing political
attitudes and welfare preferences across European societies. Journal of European Public Policy, 10(3), 339-364.
Luttmer, E. (2001). Group loyalty and the taste for redistribution. Journal of Political
Economy, 109(3), 500-528.
Luttmer, E. F., & Singhal, M. (2008). Culture, Context, and the Taste for Redistribution. National Bureau of Economic Research (No. w14268).
Majone, G. (1998). Europe’s ‘democratic deficit’: The question of standards. European Law Journal, 4(1), 5-28.
Malul, M., Shapira, D., & Shoham, A. (2013). Practical modified Gini index. Applied
Economics Letters, 20(4), 324-327.
Newton, K. (1997). Social capital and democracy. American Behavioral Scientist, 40(5), 575-586.
Norris, P. (2011). Democratic deficit critical citizens revisited. Cambridge, MA: Cambridge University Press.
Oh, H., & Hong, J. H. (2012). Citizens’ trust in government and their willingness-to-
pay. Economics Letters, 115(3), 345-347. doi:10.1016/j.econlet.2011.12.010
Olken, B. A. (2006). Corruption and the costs of redistribution: Micro evidence from
Indonesia. Journal of Public Economics, 90(4–5), 853-870. doi:10.1016/j.jpubeco.2005.05.004
Page, B. I., & Shapiro, R. Y. (1983). Effects of public opinion on policy. American
Political Science Review, 77(01), 175-190.
Porta, R. L., Lopez-De-Silane, F., Shleifer, A., & Vishny, R. W. (1996). Trust in Large Organizations. National Bureau of Economic Research (No. w5864).
31
Putnam, R. D. (1995). Bowling alone: America’s declining social capital. Journal of Democracy, 6(1), 65-78.
Putnam, R. D. (Ed.). (2002). Democracies in flux: The evolution of social capital in
contemporary society. Oxford: Oxford University Press.
Putnam, R. D., Leonardy, R., & Nannety, R. Y. (1993). Making democracy work: Civic traditions in modern Italy. Princeton, NJ: Princeton University Press.
Putnam, R. D. (2000). Bowling alone: The collapse and revival of American community. Simon and Schuster.
Putnam, R. D. (2007). E pluribus unum: Diversity and community in the twenty-first
century the 2006 Johan Skytte prize lecture. Scandinavian Political Studies, 30(2), 137-174. doi:10.1111/j.1467-9477.2007.00176.x
Rehm, P. (2005). Citizen support for the welfare state: Determinants of preferences
for income redistribution. WZB Markets and Political Economy Working Paper
no.SP II, 2
Rehm, P., Hacker, J. S., & Schlesinger, M. (2012). Insecure alliances: Risk,
inequality, and support for the welfare state. American Political Science Review, 106(02), 386-406.
Roosma, F., Gelissen, J., & van Oorschot, W. (2012). The multidimensionality of
welfare state attitudes: A European cross-national study. Social Indicators Research, , 1-21.
Sapienza, P., Zingales, L., & Guiso, L. (2006). Does Culture Affect Economic Outcomes? National Bureau of Economic Research (No. w11999).
Scholz, J., & Lubell, M. (1998). Trust and taxpaying: Testing the heuristic approach
to collective action. American Journal of Political Science, 42(2), 398-417.
Soroka, S. N., & Wlezien, C. (2004). Degrees of democracy. Instituto Juan March de estudios e investigaciones.
Soroka, S. N., & Wlezien, C. (2010). Degrees of democracy: Politics, public opinion, and policy. Cambridge MA: Cambridge University Press.
Svallfors, S. (1997). Worlds of welfare and attitudes to redistribution: A comparison
of eight western nations. European Sociological Review, 13(3), 283-304.
Svallfors, S. (1999). Political trust and attitudes towards redistribution: A comparison of Sweden and Norway. European Societies, 1(2), 241-268.
Wlezien, C. (1995). The public as thermostat: Dynamics of preferences for spending. American Journal of Political Science, 981-1000.
Yamamura, E. (2012). Trust in government and its effect on preferences for income
redistribution and perceived tax burden. MPRA Paper. Munich, Germany: University Library of Munich.
32
Appendix No. 1:
Table A1: Panel ordinal regression results – factors affecting the gap between
preference and level of social spending
Dependent variable: ratio between
public preference and social spending
as % of GDP
Dependent variable: ratio between
public preference and social
spending per head
Independent
Variable
Theoretical
parameter
Model 3 Model 2 Model 1 Model 3 Model 2 Model 1
-3.64 -5.49 -3.04 4.60 3.55 7.25 Ethnic
Fractionalization
Ethnic
Heterogeneity (4.47) (4.36) (4.34) (6.32) (6.98) (6.12)
-0.2* -0.21** -0.14 0.18 0.14 0.02 Most people can
be trusted Social Capital
(0.1) (0.09) (0.1) (0.16) (0.16) (0.14)
17.97** 41.16** ICRG
Government
Effectiveness
and Corruption (8.00) (18.53)
8.43*** 6.42** Gee
Government
Effectiveness (2.17) (3.10)
0.2*** 0.06 CPI
Corruption
(0.07) (0.10)
91 91 91 67 67 67 N
8.55 15.24 5.51 3.78 5.70 6.46 Wald chi2
standard deviation are reported in parentheses
*statistically significant at the 10% level. **statistically significant at the 5% level. ***statistically significant at the 1%
level.