public disclosure authorized -...
TRANSCRIPT
Pub
lic D
iscl
osur
e A
utho
rized
Pub
lic D
iscl
osur
e A
utho
rized
Pub
lic D
iscl
osur
e A
utho
rized
Pub
lic D
iscl
osur
e A
utho
rized

The World Bank’s Mozambique Economic Update (MEU) series is designed to present timely and concise assessments of current economic trends in Mozambique in light of the country’s broader development challenges. Each edition includes a section on recent economic developments and a discussion of Mozambique’s economic outlook, followed by a focus section analyzing issues of particular importance. The focus section in this edition explores the growth – poverty nexus in Mozambique, and the impact this has had on inequality. The MEU series seeks both to inform discussions within the World Bank and to contribute to a robust debate among government officials, the country’s international development partners, and civil society regarding Mozambique’s economic performance and key macroeconomic policy challenges.
The cutoff date for the current edition of the MEU was August 31, 2018.
ContentsAbbreviations and Acronyms .........................................................................................................................................
Acknowledgements ......................................................................................................................................................
Executive Summary ......................................................................................................................................................
Part One: Recent Economic Developments ........................................................................................................
Economic Growth ..................................................................................................................................................
Exchange Rate and Inflation ................................................................................................................................
The External Sector .................................................................................................................................................
Fiscal Policy ...............................................................................................................................................................
Monetary policy ......................................................................................................................................................
Part Two: Shifting To More Inclusive Growth ........................................................................................................
Structural change, Productivity, and Poverty Reduction ...............................................................................
Less Poverty, but More Inequality .......................................................................................................................
Dealing with the Challenge of Falling Productivity and Rising Inequality through
Broad-Based Growth ...............................................................................................................................................
References .....................................................................................................................................................................
FIGURES
Figure 1: GDP growth is expected to drop slightly in 2018 ….........................................................................
Figure 2: … as the growth rate in coal production declines …........................................................................
Figure 3: … and as household purchasing power remains eroded by prices ............................................
Figure 4: A more stable metical has helped reduce inflation, especially for tradable goods …................
Figure 5: … which, along with lower inflation in South Africa, has cooled food prices ..............................
Figure 6: Food price spikes have increased poverty across all provinces; the increase is
largely concentrated in rural areas ......................................................................................................
Figure 7: The REER is back at 2011 levels ...........................................................................................................
Figure 8: The current account deficit is set to widen due to a growing deficit in the non megaproject
economy ...................................................................................................................................................
Figure 9: …as consumer imports begin to recover ..........................................................................................
Figure 10: FDI inflows continue to decline ...........................................................................................................
Figure 11: A weaker price outlook is a source of external risk ........................................................................
Figure 12: Expenditure dropped faster than revenue in 2017 ..........................................................................
Figure 13: …allowing for narrowing of the primary balance ............................................................................
Figure 14: Domestic debt levels continue to rise ...............................................................................................
Figure 15: … adding to the debt service burden .................................................................................................
Figure 16: Fuel and bread subsidies have had a modest impact on poverty headcount ........................
Figure 17: The decrease in inflation has created space for lower reference lending rates since the
start of 2018 .............................................................................................................................................
iii
iv
1
3
3
5
8
12
18
21
21
25
27
35
4
5
5
6
6
7
8
11
11
11
11
14
15
15
15
17
19
i
Figure 18: Commercial bank rates are also decreasing, but tend to respond more slowly during
monetary easing cycles .........................................................................................................................
Figure 19: Credit growth remains negative, despite easing rates ...................................................................
Figure 20: Commercial bank asset quality has deteriorated with higher NPLs ...................................................
Figure 21: Mozambique has enjoyed robust growth that led to a sustained rise in GPD per capita ............
Figure 22: Productivity gains have been the main drivers of growth ....................................................................
Figure 23: Employment has gradually shifted from agriculture to services .........................................................
Figure 24: … where productivity is over six times larger than in agriculture ........................................................
Figure 25: An FDI boom supported growth and demand, including for services ..............................................
Figure 26: Fiscal and monetary expansion also supported faster private consumption growth ....................
Figure 27: Poverty has been falling since the early 2000s .......................................................................................
Figure 28: … and the pace accelerated after 2008 .....................................................................................................
Figure 29: The pattern of growth in the period 2008/09-2014/15 benefited mostly the non-poor, chiefly
those in urban areas ........................................................................................................................................
Figure 30: The distribution of household consumption is highly unequal in Mozambique relative to other
countries in the region ...................................................................................................................................
Figure 31: There are large differences in the prevalence of poverty across provinces .....................................
Figure 32: A reduction in the level of economic complexity accompanied the increase in exports ...........
Figure 33: In 1996, Mozambique exported a low volume/ variety of primary products ..................................
Figure 34: By 2016, exports became more diverse, but remained dominated by primary products ............
Figure 35: Mozambique has a low level of economic complexity compared to major and neighboring
African economies ............................................................................................................................................
Figure 36 The number of products exported by Mozambique declined in the 2000s and is below well-
performing economies in the region .........................................................................................................
Figure 37: Average yields are lower in Mozambique than in the region …...........................................................
Figure 38: … largely due to low adoption of modern inputs. ....................................................................................
Figure 39: Isolation is a major barrier for farmers in accessing inputs and markets …........................................
Figure 40: … and is compounded by exposure to weather shocks .......................................................................
Figure 41: Literacy rates are slowly improving but a large gap persists between rural and urban areas ......
Figure 42: Location, household consumption and parental education drive most of the inequality of
opportunity across the population ..............................................................................................................
TABLES
Table 1: Growth Outlook ................................................................................................................................................
Table 2: The Balance of Payments ...............................................................................................................................
Table 3: External Outlook ...............................................................................................................................................
Table 4: Government Finances (commitment basis) .............................................................................................
Table 5: Decomposition of Total Labor Productivity Change, 1996-2014 ......................................................
BOXES
Box 1: What happened to poverty after inflation soared in 2016? ...................................................................
Box 2: The distributional impact of recent fuel and bread subsidy reforms .................................................
19
20
20
22
22
22
22
23
23
24
24
26
26
26
28
30
30
31
31
32
32
33
33
34
34
4
10
10
16
23
7
16
ii
Abbreviationsand Acronyms
BoPBdMBVM CADCGECGTCPI
FAOFDI
FPC FPD GDPGEP
GFSMGIEWS
GICGIZ
IASIMFINEIOFIPI
LICLNG
MBTUMEF
MIMOMIT
MPCMPO
MSMEMt
MZNNPLPER
REERSSASOE
STATS SAUS
USDWDI
WEOWB
WMO
Balance of PaymentsBank of Mozambique (Banco de Moçambique) Mozambique Stock Exchange (Bolsa de Valores de Moçambique)Current-Account DeficitState’s General Account (Conta Geral do Estado)Capital Gains TaxConsumer Price IndexFood and Agriculture Organization of the United NationsForeign Direct Investment Standing Lending Facility (Facilidade Permanente de Cedência) Standing Deposit Facility (Facilidade Permanente de Depósito) Gross Domestic ProductGlobal Economic ProspectsGovernment Finance Statistics ManualFAO Global Information and Early Warning SystemGrowth Incidence CurveGerman International Cooperation Agency (Deutsche Gesellschaft für Internationale Zusammenarbeit) Integrated Agricultural Survey (Inquérito Agrário Integrado)International Monetary FundNational Statistics Institute (Instituto Nacional de Estatística)Household Survey (Inquérito sobre Orçamento Familiar)Industrial Production IndexLow Income CountriesLiquefied Natural GasMillion British Thermal UnitsMinistry of Economy and Finance (Ministério da Economia e Finanças)Interbank Reference Interest RateMassachusetts Institute of Technology Monetary Policy CommitteeMacro-Poverty OutlookMicro, Small and Medium EnterprisesMetric tonsNew Mozambican MeticalNon-Performing LoanPublic Expenditure ReviewReal Effective Exchange RateSub-Saharan AfricaState Owned EnterpriseStatistics South AfricaUnited StatesUnited States DollarWorld Development IndicatorsWorld Economic OutlookWorld BankWorld Meteorological Organization
iii
Acknowledgements
This edition of the Mozambique Economic Update was prepared by a team led by Shireen Mahdi (Senior Economist, GMTA4). The team included Anna Carlotta Allen Massingue (Research Analyst, GMTA4), Fernanda Ailina Pedro Massarongo Chivulele (Research Analyst, GMTA4), Javier Baez (Senior Economist, GPV01), Ian Walker (Lead Economist, GPSJB), Adelina Mucavele (Program Assistant, AFCS2), Ruben Barreto (Consultant, GFCAS) and Julian Casal (Senior Financial Sector Economist, GFCAS). Peer reviewers were Harold Zavarce (Senior Economist, IMF), Moritz Meyer (Economist, GPV07) and Sam Jones (University of Copenhagen). The report was prepared under the overall guidance and supervision of Mark R. Lundell (Country Director, AFCS2), Mathew Verghis (Practice Manager, GMTA4) and Carolin Geginat (Program Leader, AFCS2).
iv
executive summary
ExecutiveSummary
More stable, but with reduced capacity for growth.
Mozambique is beginning to emerge from a period of elevated macroeconomic volatility two years after hidden debt revelations triggered a significant economic downturn.1 The stability of the metical since mid 2017 helped to reduce inflation from 26 percent at its peak in November 2016 to just over 5 percent by August 2018, whilst a rapid increase in coal exports over the course of 2017, equivalent to 7 percent of GDP, supported an improvement in the trade balance and the recovery of central bank reserves to 7 months of import cover2 by August 2018. Moreover, by the start of 2018, Mozambique had secured the final investment decision for developing the Coral South project, one of two major gas projects in the Rovuma basin pipeline.
Yet, Mozambique is emerging from the recent episode of macroeconomic volatility with a reduced capacity for growth. GDP growth dropped to an average of 3.8 for 2016 and 2017, down from 8 percent on average over the preceding decade,3 and is expected to attain the slightly lower rate of 3.3 percent in 2018 as the economy continues to confront the downturn that followed the debt crisis in 2016. Private demand, especially for services, which was the largest driver of growth in the years prior to the economic downturn, has slowed significantly. This phenomenon reflects the extent of the reduction in consumer purchasing power, especially for households that have seen costs
go up without having seen their incomes rise at the same pace. It also signals the private sector’s reduced capacity to contribute to growth, and the diminished capability of the economy to generate a sufficient volume of jobs.
In addition, macroeconomic risks remain considerable. A weaker price setting for Mozambique’s main exports coal, aluminum and tobacco is a source of risk to the external outlook. Similarly, whilst the current external position is adequate, pressures could intensify in the medium-term if demand for consumer imports recovers, whilst exports and investment in the non-megaproject economy remain sluggish. A recovery in import demand, if not accompanied by an improved performance in exports from key sectors such as agriculture and energy, and an increase in investment, is likely to widen the economy’s external financing needs and raise pressure on central bank reserves. These dynamics, which were beginning to appear in the first half of 2018, would be further exacerbated if public-sector consumption grows and if monetary policy easing boosts consumer credit and demand for imports.
Budgetary financing needs and external sector risks cloud the economic outlook.
Fiscal consolidation efforts are progressing. Spending levels have dropped, largely through a sharp reduction in the investment budget. Additional savings were realized through the
A decline in investor and donor confidence followed the hidden debt revelations in 2016 as public debt increased to an unsustainable level and risk perceptions deteriorated, contributing to a reduction in external inflows from investors and donors.Excluding megaprojects.Average GDP growth from 2005 to 2015.
1
23
1
mozambique economic update october 2018
elimination of subsidies to fuel and bread. Together, these efforts yielded an estimated 3 percent reduction in the primary balance between 2015 and 2017 (excluding capital gains revenues). However, the gradual decline in the primary deficit has coincided with an increase in domestic debt, exacerbating debt levels and reflecting the public sector’s persistent financing needs, including those linked to underperforming state-owned enterprises. Rising domestic debt levels are of concern considering the high cost of domestic credit, and the potential for public-sector financing to crowd out the private sector’s access to credit.
Looking ahead, fiscal risks continue to be substantial. The wage bill, which is typically a rigid expense, is beginning to slow at a gradual pace but continues to be a significant source of fiscal pressure. In addition, the ongoing electoral cycle and the emerging decentralization arrangements could have significant budgetary implications that condition the pace of fiscal adjustment in the medium-term. With these spending pressures in view, creating fiscal space without exacerbating the debt burden requires a renewed focus on revenue mobilization, efficiency in spending, and lowering fiscal risks from state owned enterprises.
Raising the quality of growth.
The special focus section in this edition of the Mozambique Economic Update discusses the structure and drivers of Mozambique’s growth over the past two decades, and the extent to which past patterns of growth helped to shape current poverty and inequality outcomes. The analysis notes several positive developments. Firstly, Mozambique’s economy has been experiencing a gradual structural transition as workers began moving from agriculture, the sector with lowest level of productivity, to services – a sector that is
six times more productive. This boosted output per worker on average, established productivity as the engine of growth in recent years, and increased the pace of poverty reduction. The rate of poverty reduction accelerated between 2008 and 2014, bringing poverty down from 59 to 48 percent of the population. Yet, these gains were accompanied by a widening gap between the better-off and the poor. Although the poor gained from growth, the wealthier segments of society gained at a higher pace, especially in urban areas. This recent pattern of “pro-richness” in growth reflects the extent to which Mozambique’s growth acceleration and the improvements in access to services achieved have been concentrated in urban centers, hindering Mozambique’s progress in achieving shared prosperity and making it now among the most unequal countries in sub-Saharan Africa, with a Gini coefficient registering at 0.56 in 2014/2015.
The section concludes by highlighting that dealing with poverty and the challenge of rising inequality requires redefining the drivers of inclusive growth in Mozambique’s resource dependent economy. Rapid growth episodes, as experienced by Mozambique for most of the 2000s, are a welcome occurrence. But it is the breadth of this growth across the sectors of the economy and the extent to which it endurably raises productive capacity, whilst maintaining a sustainable macroeconomic setting, that determines the quality of this growth. Shifting the growth model to broaden the drivers of growth and to raise productivity in sectors with the highest employment potential is a primary challenge facing Mozambique’s policy makers today. Extractives will not be enough. An intensive and ambitious focus on achieving diversification, raising rural productivity, and providing more equal access to services in national development efforts is essential for inclusive growth.
2
Part One:Recent EconomicDevelopments
Economic Growth
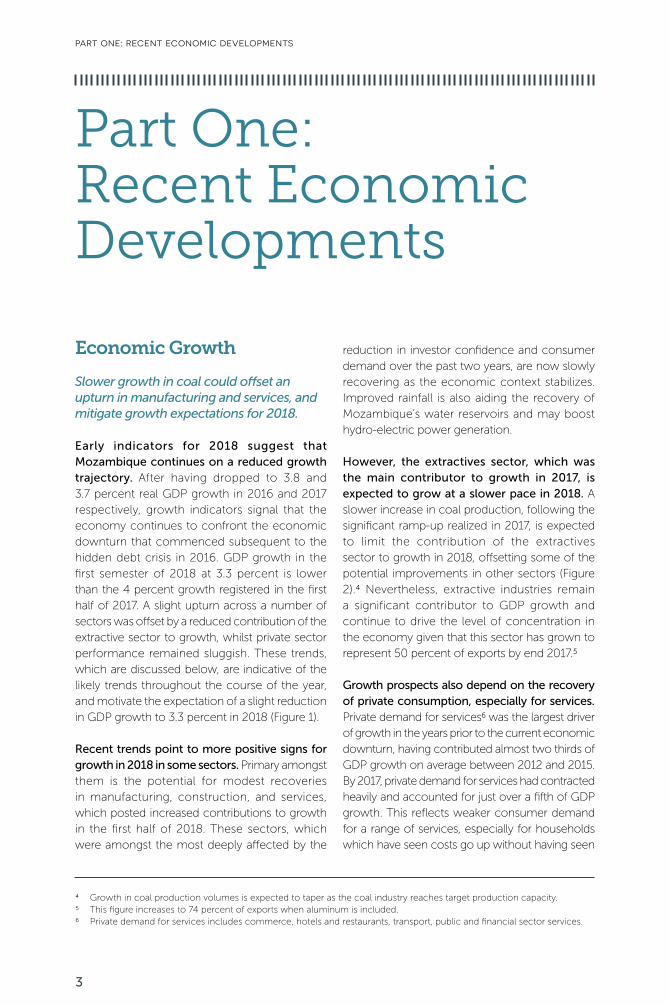
Slower growth in coal could offset an upturn in manufacturing and services, and mitigate growth expectations for 2018.
Early indicators for 2018 suggest that Mozambique continues on a reduced growth trajectory. After having dropped to 3.8 and 3.7 percent real GDP growth in 2016 and 2017 respectively, growth indicators signal that the economy continues to confront the economic downturn that commenced subsequent to the hidden debt crisis in 2016. GDP growth in the first semester of 2018 at 3.3 percent is lower than the 4 percent growth registered in the first half of 2017. A slight upturn across a number of sectors was offset by a reduced contribution of the extractive sector to growth, whilst private sector performance remained sluggish. These trends, which are discussed below, are indicative of the likely trends throughout the course of the year, and motivate the expectation of a slight reduction in GDP growth to 3.3 percent in 2018 (Figure 1).
Recent trends point to more positive signs for growth in 2018 in some sectors. Primary amongst them is the potential for modest recoveries in manufacturing, construction, and services, which posted increased contributions to growth in the first half of 2018. These sectors, which were amongst the most deeply affected by the
reduction in investor confidence and consumer demand over the past two years, are now slowly recovering as the economic context stabilizes. Improved rainfall is also aiding the recovery of Mozambique’s water reservoirs and may boost hydro-electric power generation.
However, the extractives sector, which was the main contributor to growth in 2017, is expected to grow at a slower pace in 2018. A slower increase in coal production, following the significant ramp-up realized in 2017, is expected to limit the contribution of the extractives sector to growth in 2018, offsetting some of the potential improvements in other sectors (Figure 2).4 Nevertheless, extractive industries remain a significant contributor to GDP growth and continue to drive the level of concentration in the economy given that this sector has grown to represent 50 percent of exports by end 2017.5
Growth prospects also depend on the recovery of private consumption, especially for services. Private demand for services6 was the largest driver of growth in the years prior to the current economic downturn, having contributed almost two thirds of GDP growth on average between 2012 and 2015. By 2017, private demand for services had contracted heavily and accounted for just over a fifth of GDP growth. This reflects weaker consumer demand for a range of services, especially for households which have seen costs go up without having seen
part one: recent economic developments
Growth in coal production volumes is expected to taper as the coal industry reaches target production capacity.This figure increases to 74 percent of exports when aluminum is included.Private demand for services includes commerce, hotels and restaurants, transport, public and financial sector services.
456
3
8%7%6%5%4%3%2%1%0%
-1% 2012 2013 20152014 2016 2017 2018f
Agriculture Extractives Manufacturing Private servicesPublic services Tax GDP
mozambique economic update october 2018
their incomes rise at the same pace (Figure 3). The recovery of this sector is critical for Mozambique’s future growth prospects, and is also critical for the employment prospects of many Mozambicans who escaped poverty by entering informal employment in this sector.
A strong policy focus on reducing macroeconomic uncertainty and on enhancing investment, especially in rural areas, would set the grounds for recovery and for more inclusive growth. The progress made in re-establishing peace in central Mozambique is a boon for growth. It paves the way for a gradual and more broad-based recovery if accompanied by reduced macroeconomic uncertainty and structural reforms that crowd public and private investment back-in, especially in rural areas. Part two of this report addresses this agenda by discussing the distribution of growth in recent years and the drivers of more inclusive and resilient future growth.
Weak performance in the non-megaproject economy could keep GDP
growth at the 3 to 4 percent range until the end of the decade.
Mozambique’s GDP growth is projected to increase gradually towards 4 percent by 2020, and may advance at a faster rate with progress in the development of its large liquified natural gas projects. Growth is expected to firm-up gradually in a stable price scenario, which would support conditions for monetary policy easing and provide stimulus for investment. An extended slump in consumer demand, delays in LNG investments, and continued growth in the domestic debt burden are sources of risk to the growth outlook in the near term. Exposure to weather related shocks are an additional and significant source of risk for Mozambique, which is one the economies with the highest exposures to climatic events in the Africa region and may be an emerging cause for concern for the 2018/19 harvest season.7 However, in the medium term, progress in advancing the gas projects in the Rovuma basin, would boost investment and confidence and represents a significant upside to the growth outlook.
According to the World Meteorological Organization, weather monitoring stations are predicting below normal rainfall for the southern Africa Region at the end of 2018 - El Niño / La Niña Update, September 2018.
7
Table 1: Growth Outlook
2017e 2018p 2019p 2020p
Real GDP, % ∆ 3.7 3.3 3.5 4.1
Source: World Bank staff estimates. p = Projection
Source: INE; World Bank staff estimates.
Figure 1: GDP growth is expected to drop slightly in 2018…
Annual contribution to growth (%), 2012 - 18
4

250%
200%
150%
100%
50%
0%
-50%
30%
25%
20%
15%
10%
5%
0%
-5%
Jan'
16M
ar '1
6M
ay '1
6Ju
l '16
Sep
'16
Nov
'16
Jan
'17
Mar
'17
May
'17
Jul '
17Se
p '1
7N
ov '1
7Ja
n '1
8M
ar '1
8M
ay '1
8
Thermal coal Coking coal
2013 2014 2015 2016 2017 2018f
part one: recent economic developments
Figure 2: … as the growth rate in coal production declines…
Figure 3: … and as household purchasing power remains eroded by prices.
Coal output volumes (% change), 2013 – 18 Remuneration index (12 month % change), 2016-18
Source: INE; World Bank staff estimates. Source: INE.
Exchange Rate and Inflation
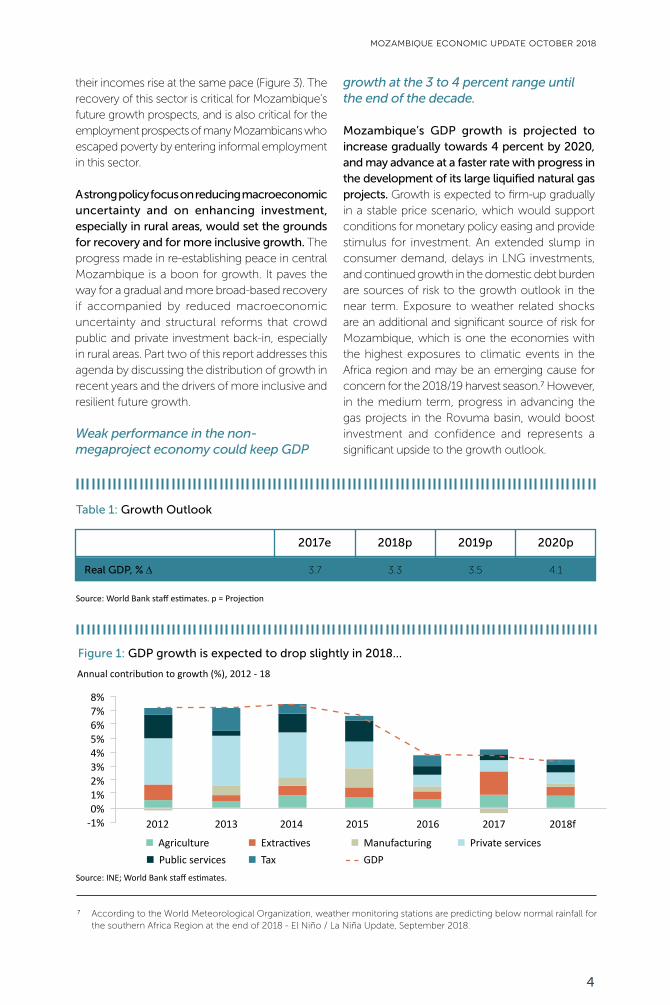
Easing food prices and a stable metical have enabled a more stable price outlook.
Mozambique is recovering from one of the most rapid currency depreciation and high inflation episodes in its history as the economy returns to a more stable currency and price outlook. The period of price instability in 2016-178 was the most evident indicator of the emerging turbulence in the economy at the time, and had significant consequences on the welfare of the least privileged segments of the population (Box 1). It also had a lasting impact on the private sector, especially amongst firms and state-owned enterprises (SOEs) with heightened exposure to foreign exchange risk.9
The continued stability of the metical since mid-2017 helped keep inflation in check. The
metical to US dollar exchange rate and inflation in South Africa are key determinants of inflationary trends in Mozambique.¹⁰ The recovery of the metical between October 2016 and June 2017 with support from tighter monetary policy, and lower inflation in South Africa contributed to restoring a more stable price outlook. Year-on-year inflation stood at 5 percent in August 2018,¹¹ bringing the 12-month average to 5 percent. Splitting inflation trends between tradable and non-tradable goods shows the extent to which the appreciation of the metical between October 2016 and June 2017, and its stability henceforth, has contributed to reducing the cost of imported goods (Figure 4).
Food prices ceased being the underlying driver of inflation since January 2018. This is partly due to improved domestic food supply,¹² and potentially, the positive contribution that
The volume of foreign currency inflows contracted after significant volumes of additional debt were revealed in April 2016, denting donor and investor confidence and reducing external inflows. Currency expectations also deteriorated in 2016, spurring the depreciation of the metical and a rise in inflation between 2016 and 2017.Mozambique Economic Update, “A Two Speed Economy”, 2017.Mozambique Economic Update, “Facing Hard Choices”, 2016.Inflation peaked at 26 percent in November 2016 and continued to subside through 2017.Above-average maize output in 2017 enabled the country to build up its stocks in the 2017/2018 marketing year, bolstering domestic stock availability (FAO GIEWS, 2018).
8
9101112
5
Jan
'16
Feb
'16
Mar
'16
Apr '
16M
ay '1
6Ju
n '1
6Ju
l '16
Aug
'16
Sep
'16
Oct
'16
Nov
'16
Dec
'16
Jan
'17
Feb
'17
Mar
'17
Apr '
17M
ay '1
7Ju
n '1
7Ju
l '17
Aug
'17
Sep
'17
Oct
'17
Nov
'17
Dec
'17
Jan
'18
Feb
'18
Mar
'18
Apr '
18M
ay '1
8Ju
n '1
8
Jan
'16
Feb
'16
Mar
'16
Apr '
16M
ay '1
6Ju
n '1
6Ju
l '16
Aug
'16
Sep
'16
Oct
'16
Nov
'16
Dec
'16
Jan
'17
Feb
'17
Mar
'17
Apr '
17M
ay '1
7Ju
n '1
7Ju
l '17
Aug
'17
Sep
'17
Oct
'17
Nov
'17
Dec
'17
Jan
'18
Feb
'18
Mar
'18
Apr '
18M
ay '1
8Ju
n '1
8Ju
l '18
Aug
'18
60%
50%
40%
30%
20%
10%
0%
-10%
-20%
30%
25%
20%
15%
10%
5%
0%
-5%
80
70
60
50
40
30
20
10
0
7.5%
7.0%
6.5%
6.0%
5.5%
5.0%
4.5%
4.0%
Tradeable non-foodNon-tradeable non-food
Tradeable foodMZN/USD,RHS
Non-tradeable food
Other non-food Food Electricity, gas, other fuelsTransport Mozambique Inflation RSA inflation, RHS
mozambique economic update october 2018
Figure 4: A more stable metical has helped reduce inflation, especially for tradable goods …
Figure 5: … which, along with lower inflation in South Africa, has cooled food prices.
Tradeable vs non-tradable inflation (12 month % change) and MZN/USD; 2016 – 18
Food and non-food contributions to inflation (%), 2016 – 18
Source: World Bank estimates based on INE data.
Source: World Bank estimates based on INE data; STATS SA
increased security in central Mozambique is having on the activities of farmers in those areas. South Africa’s food prices also tend to be a determinant of Mozambique’s food prices
given the volumes of trade between the two economies, where declining food inflation since January 2018 has helped reduced price pressures domestically (Figure 5).
6
908070605040302010
0
908070605040302010
0
Nia
ssa
Cabo
Del
gado
Nam
pula
Zam
bezia Tete
Man
ica
Sofa
la
Inha
mba
ne
Gaza
Map
uto
Prov
ince
Tota
l
71.1
49.4
67.1
63.9
43.3
43.1
60.8
36.6
47.6
22.0
55.0
(Rural) (Urban)
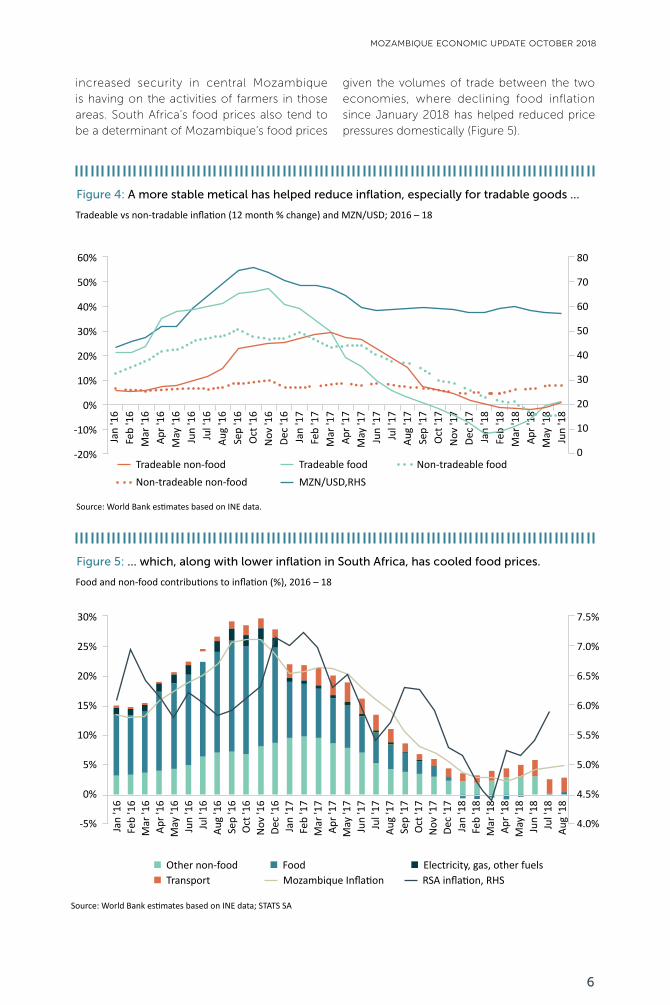
Figure 6: Food price spikes have increased poverty across all provinces; the increase islargely concentrated in rural areas.
Effect of food price increases on poverty across provinces
81.5
54.1
71.3
68.7
64.3
60.6 71
.6
38.6
53.1
25.3
63.4
After AfterInitial Initial
Nia
ssa
Cabo
Del
gado
Nam
pula
Zam
bezia Tete
Man
ica
Sofa
laIn
ham
bane
Gaza
M
aput
o Pr
ovin
ceM
aput
o Ci
tyTo
tal
60.5
51.4 59
.049
.5
32.4
25.9 31
.514
.934
.9
6.0
4.0 32
.6
57.8
50.3
57.6
48.2
31.3
20.9
29.1
14.6
33.3
31.35.
93.
7
part one: recent economic developments
Box 1: What happened to poverty after inflation soared in 2016?
Mozambique experienced steep food price inflation during 2016-17, going up as high as 40 percent in November 2016. Prices for maize, rice and cassava, which form a substantial part of the Mozambican diet (on average 30 percent of the household budget allocation), increased significantly during the period. The combined effects of a sharp currency depreciation, given that Mozambique is a net importer of maize and rice, and effects of the el-Niño drought were central to this trend.
Sharp increases in the price of staple goods led to a reduction in household consumption, particularly in rural areas. A recent World Bank analysis of the welfare implications of the spike in food inflation in 2016-17 found that it may have translated into a poverty increase of 4-6 percentage points, with some of the poorest provinces (Manica, Niassa and Tete) bearing much of the brunt due to their high level of dependence on maize consumption. An analysis of the net welfare impact of higher prices (i.e. the net impact on households after taking both food purchases and food production into account) shows
that a 10 percent increase in maize prices reduced household consumption per capita by 1.2 percent in rural areas and 0.2 percent in urban areas. The welfare effects from changes in prices of rice and cassava were lower but qualitatively equal. The negative effects of price increases were larger for the three first quintiles of the income distribution.
These findings underscore the costs of macroeconomic instability on the poor, especially given the extent to which food price spikes are disproportionately felt by the poorest households, even when they are producers of food. The findings of this analysis make the case for greater attention to the welfare impacts of food price inflation. Prudent macroeconomic management is vital. Other key policy actions include raising agriculture’s productivity and its resilience through more efficient and connected input and output markets, and investing in rural safety nets to mitigate the impact of shocks on rural households, including through mechanisms such as food price and food security monitoring systems.
Source: World Bank based on IOF-2014/15 and IAS-2015
Source: World Bank, “Who wins and who loses with staple food price spikes? Welfare implications in Mozambique”, 2018.
7
Jan
'11
Apr '
11Ju
l '11
Oct
'11
Jan'
12Ap
r '12
Jul '
12
Oct
'12
Jan
'13
Apr '
13Ju
l '13
Oct
'13
Jan
'14
Apr '
14Ju
l '14
Oct
'14
Jan'
15Ap
r '15
Jul '
15O
ct '1
5Ja
n '1
6Ap
r '16
Jul '
16O
ct '1
6Ja
n '1
7Ap
r '17
Jul '
17O
ct '1
7Ja
n '1
8Ap
r '18
Jul '
18
Figure 7: The REER is back at 2011 levels.
Real effective exchange rate index (2010 = 100) and Exports (USD millions), 2011 - 18
175
150
125
100
75
400
350
300
250
200
150
100
Real effective exchange rate (2010=100) Exports excl. coal (3 month moving avg), RHS
mozambique economic update october 2018
The External Sector
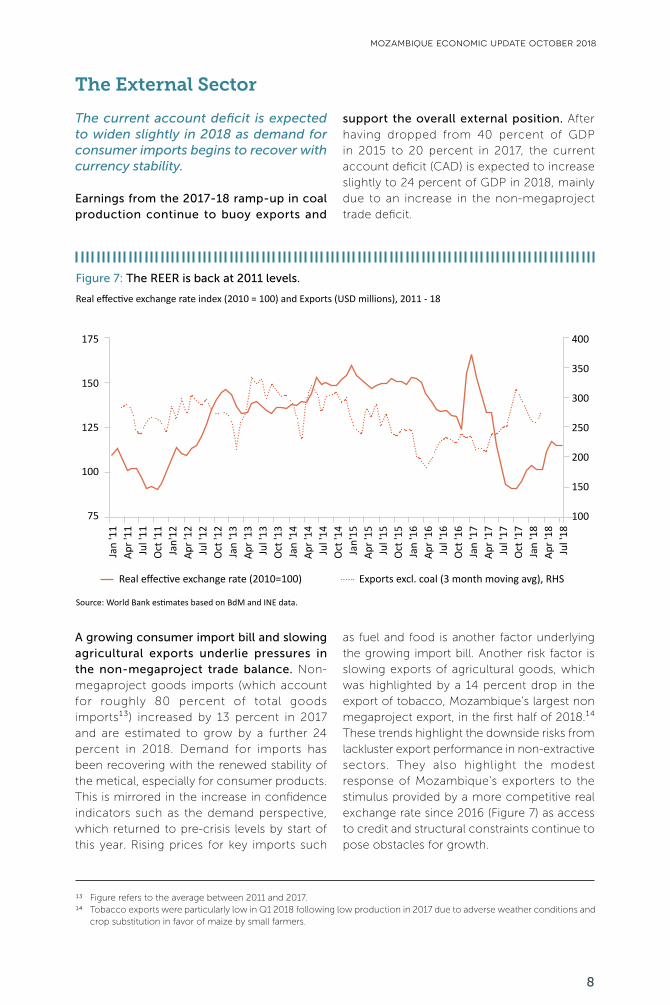
The current account deficit is expected to widen slightly in 2018 as demand for consumer imports begins to recover with currency stability.
Earnings from the 2017-18 ramp-up in coal production continue to buoy exports and
A growing consumer import bill and slowing agricultural exports underlie pressures in the non-megaproject trade balance. Non-megaproject goods imports (which account for roughly 80 percent of total goods imports¹³) increased by 13 percent in 2017 and are estimated to grow by a further 24 percent in 2018. Demand for imports has been recovering with the renewed stability of the metical, especially for consumer products. This is mirrored in the increase in confidence indicators such as the demand perspective, which returned to pre-crisis levels by start of this year. Rising prices for key imports such
support the overall external position. After having dropped from 40 percent of GDP in 2015 to 20 percent in 2017, the current account deficit (CAD) is expected to increase slightly to 24 percent of GDP in 2018, mainly due to an increase in the non-megaproject trade deficit.
as fuel and food is another factor underlying the growing import bill. Another risk factor is slowing exports of agricultural goods, which was highlighted by a 14 percent drop in the export of tobacco, Mozambique’s largest non megaproject export, in the first half of 2018.¹⁴ These trends highlight the downside risks from lackluster export performance in non-extractive sectors. They also highlight the modest response of Mozambique’s exporters to the stimulus provided by a more competitive real exchange rate since 2016 (Figure 7) as access to credit and structural constraints continue to pose obstacles for growth.
Source: World Bank estimates based on BdM and INE data.
Figure refers to the average between 2011 and 2017.Tobacco exports were particularly low in Q1 2018 following low production in 2017 due to adverse weather conditions and crop substitution in favor of maize by small farmers.
1314
8
part one: recent economic developments
External reserve levels remain adequate despite a continued decline in foreign direct investment.
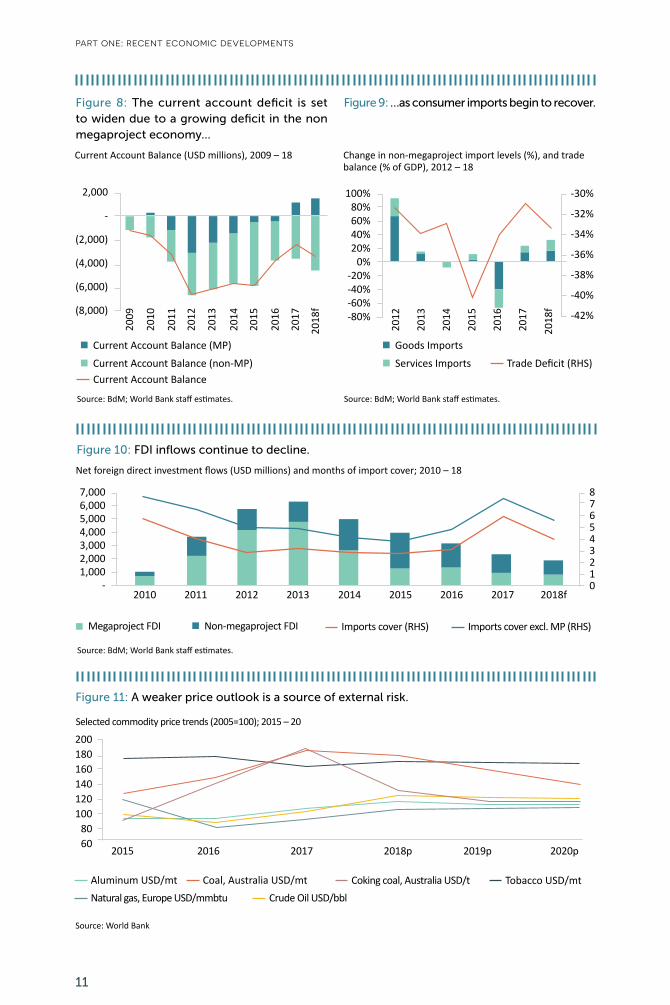
FDI continues to be the main source of external financing, but is covering a smaller share of the current account deficit, spurring the private sector to resort increasingly to shorter-term financing instruments. FDI inflows were equivalent to 84 percent of the current account deficit on average between 2010 and 2017. The continued drop in FDI inflows since 2015 (Figure 10) and the expected widening of the current account deficit suggest that its role in covering the external financing needs of the economy may decline further in 2018 (down to an estimated 54 percent of the current account deficit).¹⁵ Long-term debt financing has also declined as over indebtedness constrains the private and public sector’s external borrowing capacity. In this context, the private sector has been increasingly relying on short-term financing channels such as trade credits to finance external transactions. This trend, which largely affects non-megaproject firms, has negative implications. Short-term financing instruments offer higher exposure to financing risk than long-term finance and are less conducive to investment and expansion since they tend to cover current operational needs, highlighting the importance of recovering investor confidence to boost FDI and the economic outlook.
Having continued to recover through 2017, gross international reserves stood at USD 3.2 billion in August 2018, covering roughly 7 months of imports (excluding megaprojects). The balance of payments surplus in 2017 helped to bring Mozambique’s reserve coverage to more comfortable levels, more in line with other resource-dependent economies in the region (Figure 11). This improvement put reserves in a position to absorb emerging pressures in early 2018, such as the fuel sector’s financing needs
and public debt servicing, which contributed to a USD 110 million drop in reserves in the first half of 2018.
Global economic activity is robust, but potential imbalances in the non-megaproject economy and a softer commodity price outlook increase external risks.
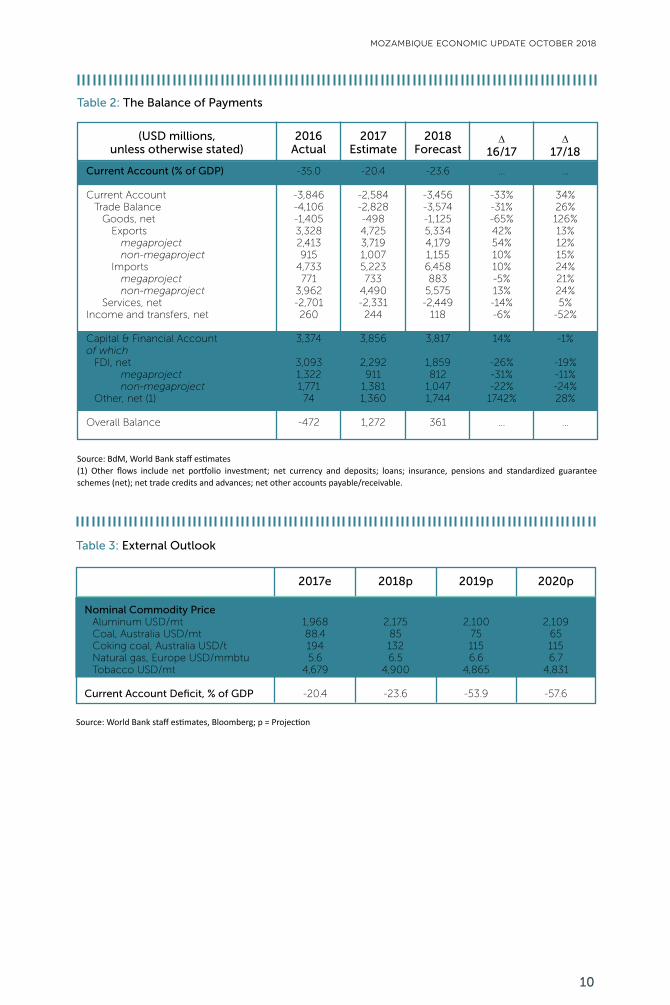
A weaker price outlook for some of Mozambique’s largest commodities is a source of risk to the external outlook. Commodity prices strengthened in the first quarter of 2018, supported by accelerating global growth and tighter supply conditions for a number of commodities. However, the most recent commodity price outlook¹⁶ suggests a softer price setting for coal, aluminum and tobacco in 2019 and 2020, which together accounted for 64 percent of exports in 2017. The increase in commodity prices over the past two years, coal in particular, has played a central role in supporting the economy, making the weaker price setting a significant source of macroeconomic risk.
Moreover, pressures on the external position could intensify in the medium-term if demand for consumer imports recovers, whilst exports and investment in the non-megaproject economy remain sluggish. A recovery in import demand, if not accompanied by improved performance in exports from key sectors such as agriculture and energy and an increase in investment, is likely to widen the economy’s external financing needs and raise pressure on central bank reserves. These dynamics, which were beginning to appear in the first half of 2018, would be further exacerbated if public-sector consumption grows and if monetary policy easing leads to a rapid increase in consumer credit and demand for imports.
A combination of reduced confidence in the economy post 2016 and the tapering investment cycle in the LNG sector caused the reduction in FDI. World Bank Commodity Markets Outlook, 2018.
15
16
9
mozambique economic update october 2018
Table 3: External Outlook
2017e 2018p 2019p 2020p
Nominal Commodity Price Aluminum USD/mt Coal, Australia USD/mt Coking coal, Australia USD/t Natural gas, Europe USD/mmbtu Tobacco USD/mt
Current Account Deficit, % of GDP
1,96888.41945.6
4,679
-20.4
2,175851326.5
4,900
-23.6
2,100751156.6
4,865
-53.9
2,109651156.7
4,831
-57.6
Source: World Bank staff estimates, Bloomberg; p = Projection
Table 2: The Balance of Payments
2016Actual
2017Estimate
2018Forecast
∆16/17
∆17/18
Current Account (% of GDP)
Current Account Trade Balance Goods, net Exports megaproject non-megaproject Imports megaproject non-megaproject Services, netIncome and transfers, net Capital & Financial Accountof which FDI, net megaproject non-megaproject Other, net (1) Overall Balance
-35.0
-3,846-4,106-1,4053,3282,413915
4,733771
3,962-2,701260
3,374
3,0931,3221,77174
-472
-20.4
-2,584-2,828-4984,7253,7191,0075,223733
4,490-2,331244
3,856
2,292911
1,3811,360
1,272
-23.6
-3,456-3,574-1,1255,3344,1791,1556,458883
5,575-2,449
118
3,817
1,859812
1,0471,744
361
…
-33%-31%-65%42%54%10%10%-5%13%-14%-6%
14%
-26%-31%-22%
1742%
…
…
34%26%126%13%12%15%24%21%24%5%
-52%
-1%
-19%-11%-24%28%
…
Source: BdM, World Bank staff estimates(1) Other flows include net portfolio investment; net currency and deposits; loans; insurance, pensions and standardized guarantee schemes (net); net trade credits and advances; net other accounts payable/receivable.
(USD millions, unless otherwise stated)
10
Aluminum USD/mt Tobacco USD/mtCrude Oil USD/bbl
Coking coal, Australia USD/tNatural gas, Europe USD/mmbtu
Coal, Australia USD/mt
Source: World Bank
Source: BdM; World Bank staff estimates.
7,0006,0005,0004,0003,0002,0001,000
-2010 2011 2012 2013 2014 2015 2016 2017 2018f
Megaproject FDI Non-megaproject FDI Imports cover (RHS) Imports cover excl. MP (RHS)
876543210
Current Account Balance (MP) Goods Imports
Services ImportsCurrent Account Balance (non-MP)Current Account Balance
Trade Deficit (RHS)
Figure 8: The current account deficit is set to widen due to a growing deficit in the non megaproject economy…
Figure 9: …as consumer imports begin to recover.
Current Account Balance (USD millions), 2009 – 18 Change in non-megaproject import levels (%), and trade balance (% of GDP), 2012 – 18
Source: BdM; World Bank staff estimates. Source: BdM; World Bank staff estimates.
2009
2010
2011
2012
2013
2014
2015
2016
2017
2018
f
2012
2013
2014
2015
2016
2017
2018
f
200180160140120100
8060
2,000
-
(2,000)
(4,000)
(6,000)
(8,000)
100%80%60%40%20%
0%-20%-40%-60%-80%
-30%
-32%
-34%
-36%
-38%
-40%
-42%
2015 2016 2017 2018p 2019p 2020p
part one: recent economic developments
Figure 11: A weaker price outlook is a source of external risk.
Selected commodity price trends (2005=100); 2015 – 20
Figure 10: FDI inflows continue to decline.
Net foreign direct investment flows (USD millions) and months of import cover; 2010 – 18
11
mozambique economic update october 2018
Fiscal Policy
Fiscal adjustment efforts are hampered by persistent public-sector financing needs and increased domestic borrowing.
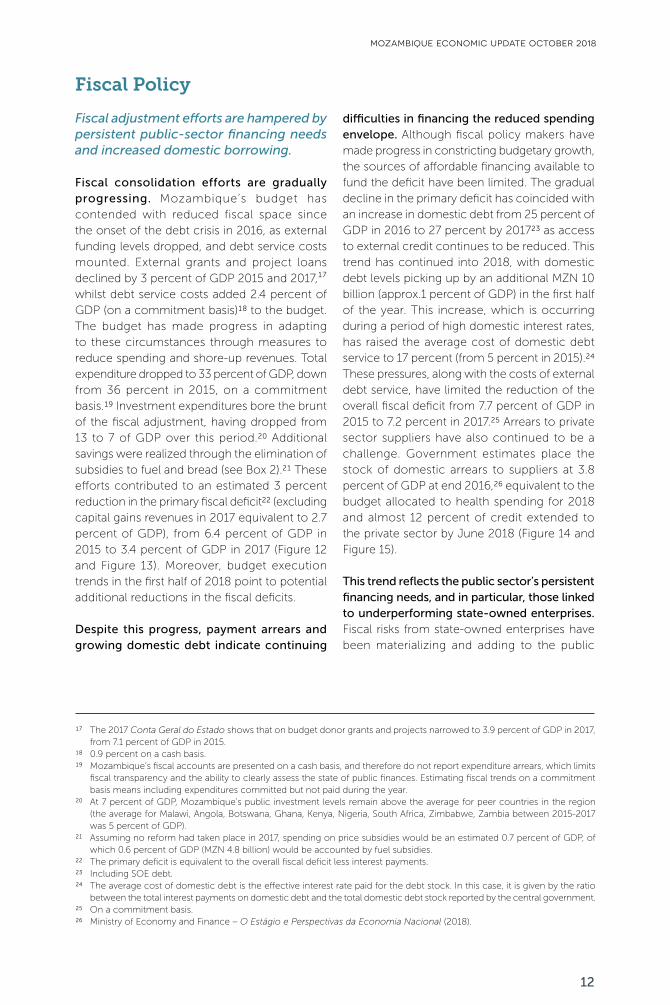
Fiscal consolidation efforts are gradually progressing. Mozambique’s budget has contended with reduced fiscal space since the onset of the debt crisis in 2016, as external funding levels dropped, and debt service costs mounted. External grants and project loans declined by 3 percent of GDP 2015 and 2017,¹⁷ whilst debt service costs added 2.4 percent of GDP (on a commitment basis)18 to the budget. The budget has made progress in adapting to these circumstances through measures to reduce spending and shore-up revenues. Total expenditure dropped to 33 percent of GDP, down from 36 percent in 2015, on a commitment basis.19 Investment expenditures bore the brunt of the fiscal adjustment, having dropped from 13 to 7 of GDP over this period.20 Additional savings were realized through the elimination of subsidies to fuel and bread (see Box 2).21 These efforts contributed to an estimated 3 percent reduction in the primary fiscal deficit22 (excluding capital gains revenues in 2017 equivalent to 2.7 percent of GDP), from 6.4 percent of GDP in 2015 to 3.4 percent of GDP in 2017 (Figure 12 and Figure 13). Moreover, budget execution trends in the first half of 2018 point to potential additional reductions in the fiscal deficits.
Despite this progress, payment arrears and growing domestic debt indicate continuing
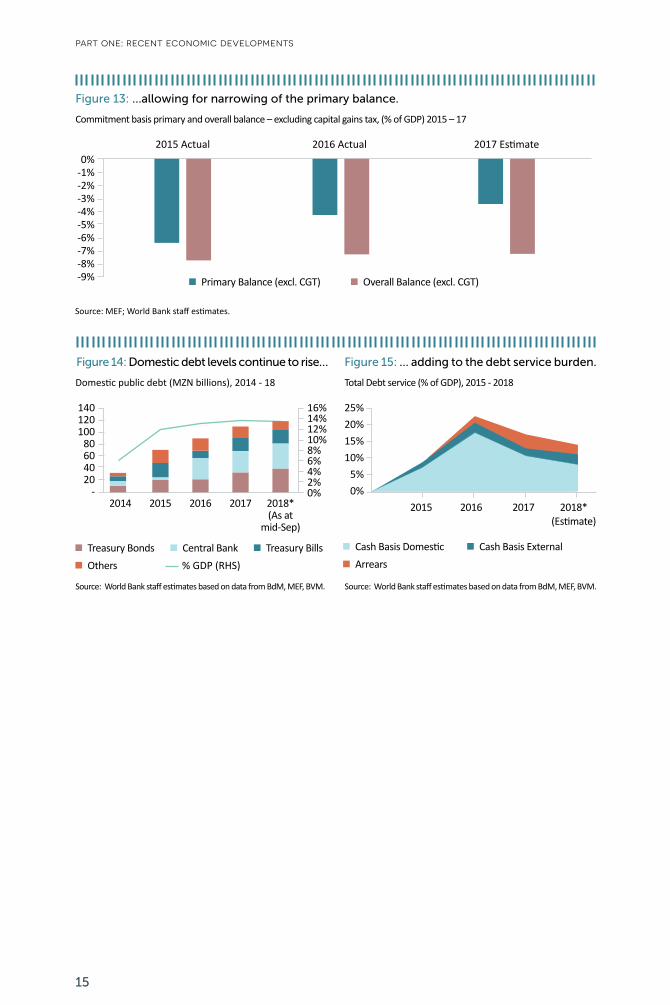
difficulties in financing the reduced spending envelope. Although fiscal policy makers have made progress in constricting budgetary growth, the sources of affordable financing available to fund the deficit have been limited. The gradual decline in the primary deficit has coincided with an increase in domestic debt from 25 percent of GDP in 2016 to 27 percent by 201723 as access to external credit continues to be reduced. This trend has continued into 2018, with domestic debt levels picking up by an additional MZN 10 billion (approx.1 percent of GDP) in the first half of the year. This increase, which is occurring during a period of high domestic interest rates, has raised the average cost of domestic debt service to 17 percent (from 5 percent in 2015).24 These pressures, along with the costs of external debt service, have limited the reduction of the overall fiscal deficit from 7.7 percent of GDP in 2015 to 7.2 percent in 2017.25 Arrears to private sector suppliers have also continued to be a challenge. Government estimates place the stock of domestic arrears to suppliers at 3.8 percent of GDP at end 2016,26 equivalent to the budget allocated to health spending for 2018 and almost 12 percent of credit extended to the private sector by June 2018 (Figure 14 and Figure 15).
This trend reflects the public sector’s persistent financing needs, and in particular, those linked to underperforming state-owned enterprises. Fiscal risks from state-owned enterprises have been materializing and adding to the public
The 2017 Conta Geral do Estado shows that on budget donor grants and projects narrowed to 3.9 percent of GDP in 2017, from 7.1 percent of GDP in 2015.0.9 percent on a cash basis. Mozambique’s fiscal accounts are presented on a cash basis, and therefore do not report expenditure arrears, which limits fiscal transparency and the ability to clearly assess the state of public finances. Estimating fiscal trends on a commitment basis means including expenditures committed but not paid during the year.At 7 percent of GDP, Mozambique’s public investment levels remain above the average for peer countries in the region (the average for Malawi, Angola, Botswana, Ghana, Kenya, Nigeria, South Africa, Zimbabwe, Zambia between 2015-2017 was 5 percent of GDP).Assuming no reform had taken place in 2017, spending on price subsidies would be an estimated 0.7 percent of GDP, of which 0.6 percent of GDP (MZN 4.8 billion) would be accounted by fuel subsidies.The primary deficit is equivalent to the overall fiscal deficit less interest payments.Including SOE debt.The average cost of domestic debt is the effective interest rate paid for the debt stock. In this case, it is given by the ratio between the total interest payments on domestic debt and the total domestic debt stock reported by the central government.On a commitment basis.Ministry of Economy and Finance – O Estágio e Perspectivas da Economia Nacional (2018).
17
1819
20
21
222324
2526
12

part one: recent economic developments
sector’s financing needs, which have been increasingly met through domestic borrowing. In particular, assistance to support financial and operational costs of underperforming SOEs raised domestic financing needs in 2017, as did the payments to meet outstanding obligations to fuel suppliers. In total, MZN 11 billion (1.4 percent of GDP) are reported to have been allocated to support public entities, including MZN 7.4 billion in securitization of SOE debt through bond issuance and MZN 3.6 billion in assumed debt.27 In the absence of an effective restructuring program, SOEs will continue to be a source of fiscal risk given the persisting operational and financial difficulties facing a number of enterprises.
The shift away from external financing and the stronger metical have helped to reduce the public debt stock from 128 percent at its peak in 2016 to 112 percent by end 2017,28 but domestic debt stock and service needs have risen. External debt dropped to 85 percent of GDP by end 2017, down from 104 percent of GDP in 2016. In contrast, domestic debt is estimated to have increased over this period by 2 percent of GDP to 27 percent (including SOEs), and has continued to grow in 2018. Although it represents a relatively small share of the total public debt stock, domestic debt issued since 2016 comes at a relatively high cost. It also has shorter maturity profiles than most multilateral and bilateral external loans, thereby amplifying potential rollover risks.
With spending pressures in view, creating fiscal space without exacerbating the debt burden requires a renewed focus on revenue mobilization, efficiency in spending, and lowering fiscal risks.
The ongoing electoral cycle and the emerging decentralization arrangements could have significant budgetary implications that condition the pace of fiscal adjustment in the medium-term. With municipal elections in 2018 and general elections in 2019, budgetary costs related to the electoral cycle are an emerging
source of fiscal pressure. The domestic investment budget (which typically accounts for a large share of the election budget) increased by an average 17 and 20 percent in the last round of municipal and general elections, respectively.29 Similarly, goods and services spending increased by an average of 20 and 27 percent over the same period. Further pressures spring from the emerging decentralization arrangements accompanying the peace agreements between Frelimo and Renamo, which could raise personnel and administrative overhead costs.
A package of recent regulatory reforms, if implemented well, will strengthen fiscal management. The Government of Mozambique has advanced on a number of key reforms to strengthen fiscal management, including new regulations to strengthen the management of public debt and guarantees, a revised legal framework for strengthening the governance of SOEs, and a new framework to improve the selection of public investment projects. The authorities also introduced measures to limit wage bill growth through measures30 to constrain admissions, subsidies and promotions. These reforms help to rebuild confidence in fiscal institutions, particularly subsequent to the events surrounding the hidden debts, which revealed significant gaps in the regulatory frameworks for guarantees, SOEs and public investment. The quality and extent of implementation of these reforms will determine their impact, and the extent to which they will contribute to placing Mozambique’s fiscal framework on a more solid footing.
The remaining reform agenda is substantial. With significant fiscal risks in view, reforms to widen fiscal space and increase the efficiency of public expenditure continue to be urgent. These include administrative reforms to reduce Mozambique’s wage bill and align it with levels in peer countries (where wage-bill spending averaged at 6.6 percent of GDP in 2016).31 Tackling the underperforming SOE sector is also urgent, and will involve restructuring the portfolio
The State’s General Accounts for 2017 report transactions to bailout public entities, including Maputo Sul, the Roads Fund and fuel suppliers. Based on the February 2018 Debt Sustainability Analysis prepared by the staffs of the IMF and World Bank.In 2013 and 2014, respectively.New measures were introduced through the Diploma Ministerial no 49/2018 of 23/05/2018.Figure refers to the median for a group of 42 low-income and developing countries, as presented in IMF (2018).
27
28293031
13
Expe
nditu
re (%
of G
DP)
Source: MEF; World Bank staff estimates.
2014
2018
2013
2017
2015
2016
2012
↑∆Exp>∆R
↓∆Exp>∆R
Revenue (% of GDP)
-4% -2% 2% 4% 6% 8% 10%
10%
8%
6%
4%
2%
0%
-2%
-4%
-6%
-8%
mozambique economic update october 2018
of distressed companies and refocusing on a smaller number of strategic and well-performing firms. Sectoral reforms to increase the quality and equity of spending, especially in improving service delivery and rural infrastructure, are also critical for achieving national development objectives in a tight fiscal context.32
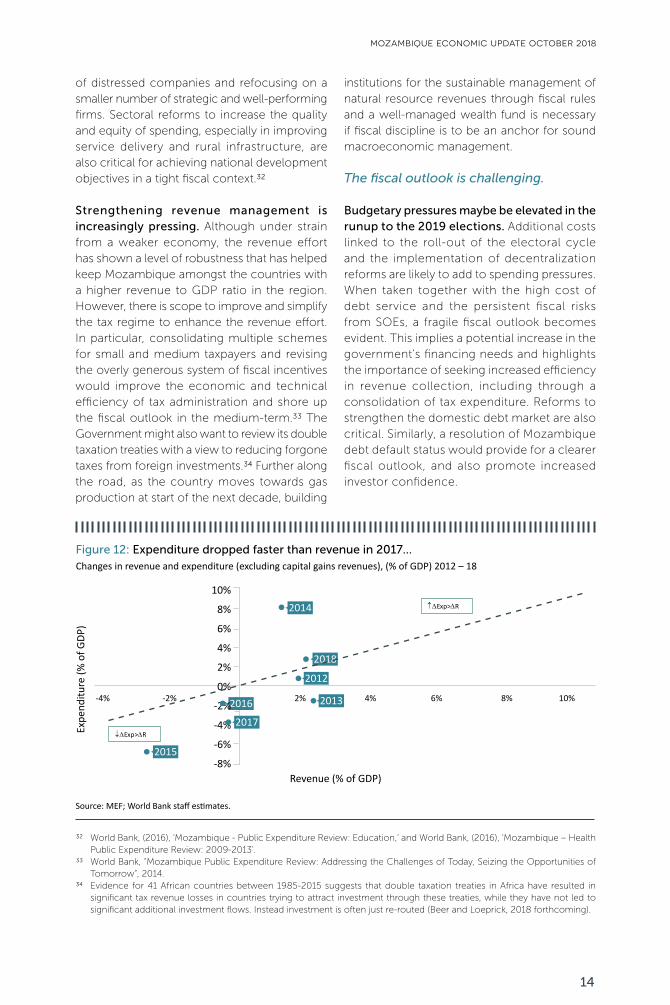
Strengthening revenue management is increasingly pressing. Although under strain from a weaker economy, the revenue effort has shown a level of robustness that has helped keep Mozambique amongst the countries with a higher revenue to GDP ratio in the region. However, there is scope to improve and simplify the tax regime to enhance the revenue effort. In particular, consolidating multiple schemes for small and medium taxpayers and revising the overly generous system of fiscal incentives would improve the economic and technical efficiency of tax administration and shore up the fiscal outlook in the medium-term.33 The Government might also want to review its double taxation treaties with a view to reducing forgone taxes from foreign investments.34 Further along the road, as the country moves towards gas production at start of the next decade, building
institutions for the sustainable management of natural resource revenues through fiscal rules and a well-managed wealth fund is necessary if fiscal discipline is to be an anchor for sound macroeconomic management.
The fiscal outlook is challenging.
Budgetary pressures maybe be elevated in the runup to the 2019 elections. Additional costs linked to the roll-out of the electoral cycle and the implementation of decentralization reforms are likely to add to spending pressures. When taken together with the high cost of debt service and the persistent fiscal risks from SOEs, a fragile fiscal outlook becomes evident. This implies a potential increase in the government’s financing needs and highlights the importance of seeking increased efficiency in revenue collection, including through a consolidation of tax expenditure. Reforms to strengthen the domestic debt market are also critical. Similarly, a resolution of Mozambique debt default status would provide for a clearer fiscal outlook, and also promote increased investor confidence.
World Bank, (2016), ‘Mozambique - Public Expenditure Review: Education,’ and World Bank, (2016), ‘Mozambique – Health Public Expenditure Review: 2009-2013’.World Bank, “Mozambique Public Expenditure Review: Addressing the Challenges of Today, Seizing the Opportunities of Tomorrow”, 2014.Evidence for 41 African countries between 1985-2015 suggests that double taxation treaties in Africa have resulted in significant tax revenue losses in countries trying to attract investment through these treaties, while they have not led to significant additional investment flows. Instead investment is often just re-routed (Beer and Loeprick, 2018 forthcoming).
32
33
34
Figure 12: Expenditure dropped faster than revenue in 2017… Changes in revenue and expenditure (excluding capital gains revenues), (% of GDP) 2012 – 18
14
Source: MEF; World Bank staff estimates.
2015 Actual 2016 Actual 2017 Estimate
Primary Balance (excl. CGT) Overall Balance (excl. CGT)
140120100
80604020
-
16%14%12%10%8%6%4%2%0%
Treasury Bonds Cash Basis Domestic
2014 2015 2016 2017 2018*(Estimate)
2015 2016 2017 2018* (As at
mid-Sep)
Others ArrearsCentral Bank Cash Basis ExternalTreasury Bills% GDP (RHS)
Source: World Bank staff estimates based on data from BdM, MEF, BVM. Source: World Bank staff estimates based on data from BdM, MEF, BVM.
25%20%15%10%
5%0%
0%-1%-2%-3%-4%-5%-6%-7%-8%-9%
Figure 13: …allowing for narrowing of the primary balance.
Commitment basis primary and overall balance – excluding capital gains tax, (% of GDP) 2015 – 17
Figure 14: Domestic debt levels continue to rise… Figure 15: … adding to the debt service burden.
Domestic public debt (MZN billions), 2014 - 18 Total Debt service (% of GDP), 2015 - 2018
part one: recent economic developments
15
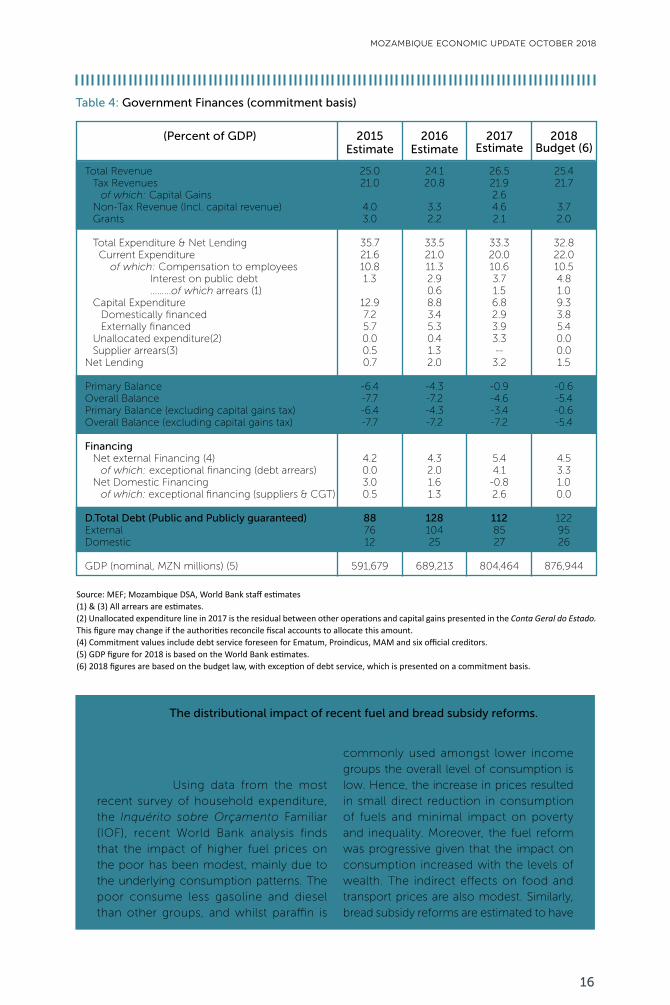
Table 4: Government Finances (commitment basis)
(Percent of GDP) 2015Estimate
2016Estimate
2017Estimate
2018Budget (6)
Total Revenue Tax Revenues of which: Capital Gains Non-Tax Revenue (Incl. capital revenue) Grants
Total Expenditure & Net Lending Current Expenditure of which: Compensation to employees Interest on public debt ………of which arrears (1) Capital Expenditure Domestically financed Externally financed Unallocated expenditure(2) Supplier arrears(3)Net Lending Primary Balance Overall Balance Primary Balance (excluding capital gains tax)Overall Balance (excluding capital gains tax) Financing Net external Financing (4) of which: exceptional financing (debt arrears) Net Domestic Financing of which: exceptional financing (suppliers & CGT)
D.Total Debt (Public and Publicly guaranteed)ExternalDomestic
GDP (nominal, MZN millions) (5)
25.021.0
4.03.0
35.721.610.81.3
12.97.25.70.00.50.7
-6.4-7.7-6.4-7.7
4.20.03.00.5
887612
591,679
24.120.8
3.32.2
33.521.011.32.90.68.83.45.30.41.32.0
-4.3-7.2-4.3-7.2
4.32.01.61.3
12810425
689,213
26.521.92.6 4.62.1
33.320.010.63.71.56.82.93.93.3--
3.2
-0.9-4.6-3.4-7.2
5.44.1-0.82.6
1128527
804,464
25.421.7
3.72.0
32.822.010.54.81.09.33.85.40.00.01.5
-0.6-5.4-0.6-5.4
4.53.31.00.0
1229526
876,944
Source: MEF; Mozambique DSA, World Bank staff estimates(1) & (3) All arrears are estimates. (2) Unallocated expenditure line in 2017 is the residual between other operations and capital gains presented in the Conta Geral do Estado. This figure may change if the authorities reconcile fiscal accounts to allocate this amount. (4) Commitment values include debt service foreseen for Ematum, Proindicus, MAM and six official creditors.(5) GDP figure for 2018 is based on the World Bank estimates.(6) 2018 figures are based on the budget law, with exception of debt service, which is presented on a commitment basis.
Box 2: The distributional impact of recent fuel and bread subsidy reforms.
How did the increase in fuel and bread prices since 2017 affect the Mozambican population? Using data from the most recent survey of household expenditure, the Inquérito sobre Orçamento Familiar (IOF), recent World Bank analysis finds that the impact of higher fuel prices on the poor has been modest, mainly due to the underlying consumption patterns. The poor consume less gasoline and diesel than other groups, and whilst paraffin is
commonly used amongst lower income groups the overall level of consumption is low. Hence, the increase in prices resulted in small direct reduction in consumption of fuels and minimal impact on poverty and inequality. Moreover, the fuel reform was progressive given that the impact on consumption increased with the levels of wealth. The indirect effects on food and transport prices are also modest. Similarly, bread subsidy reforms are estimated to have
mozambique economic update october 2018
16
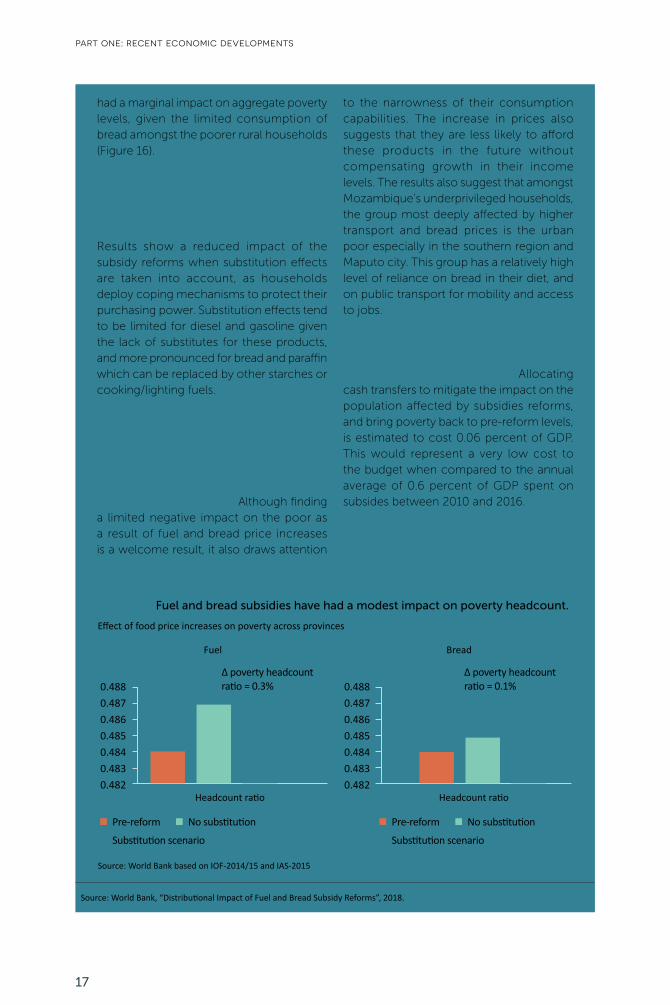
Figure 16: Fuel and bread subsidies have had a modest impact on poverty headcount.
Effect of food price increases on poverty across provinces
Fuel
Headcount ratio Headcount ratio
Bread
0.4880.4870.4860.4850.4840.4830.482
0.4880.4870.4860.4850.4840.4830.482
Pre-reform Pre-reform
Substitution scenario Substitution scenario
No substitution No substitution
Source: World Bank based on IOF-2014/15 and IAS-2015
Source: World Bank, “Distributional Impact of Fuel and Bread Subsidy Reforms”, 2018.
had a marginal impact on aggregate poverty levels, given the limited consumption of bread amongst the poorer rural households (Figure 16). The impact of the reforms on welfare is even lower under a substitution scenario, which assumes that households adjust their consumption patterns as prices increase. Results show a reduced impact of the subsidy reforms when substitution effects are taken into account, as households deploy coping mechanisms to protect their purchasing power. Substitution effects tend to be limited for diesel and gasoline given the lack of substitutes for these products, and more pronounced for bread and paraffin which can be replaced by other starches or cooking/lighting fuels.
These results highlight the limited nature of the consumption basket of the poorest in the Mozambican population, and suggest that urban households were the most affected by higher transport and bread prices amongst the poor. Although finding a limited negative impact on the poor as a result of fuel and bread price increases is a welcome result, it also draws attention
to the narrowness of their consumption capabilities. The increase in prices also suggests that they are less likely to afford these products in the future without compensating growth in their income levels. The results also suggest that amongst Mozambique’s underprivileged households, the group most deeply affected by higher transport and bread prices is the urban poor especially in the southern region and Maputo city. This group has a relatively high level of reliance on bread in their diet, and on public transport for mobility and access to jobs.
Social protection programs have a role in mitigating the impact of these reforms, especially on the urban poor. Allocating cash transfers to mitigate the impact on the population affected by subsidies reforms, and bring poverty back to pre-reform levels, is estimated to cost 0.06 percent of GDP. This would represent a very low cost to the budget when compared to the annual average of 0.6 percent of GDP spent on subsides between 2010 and 2016.
∆ poverty headcount ratio = 0.3%
∆ poverty headcount ratio = 0.1%
part one: recent economic developments
17
Monetary Policy
Monetary policy easing continues, but with moderation in view of external and fiscal risks.
Lower inflation facilitated the continuation of the monetary policy easing cycle, but macroeconomic risks continue to moderate the pace of adjustment. The reference lending rate (FPC35) dropped by 250 basis points (to 18 percent) since the start of 2018 as inflationary pressures eased. Similarly, the interbank reference lending rate (MIMO36) dropped by 450 basis points so far this year, registering at 15 percent by the end of August 2018. There is potential for continuation of the easing cycle, but the pace will depend on the central bank’s assessment of macroeconomic risks, including risks related to the sustainability of the external position and the rate of fiscal adjustment.
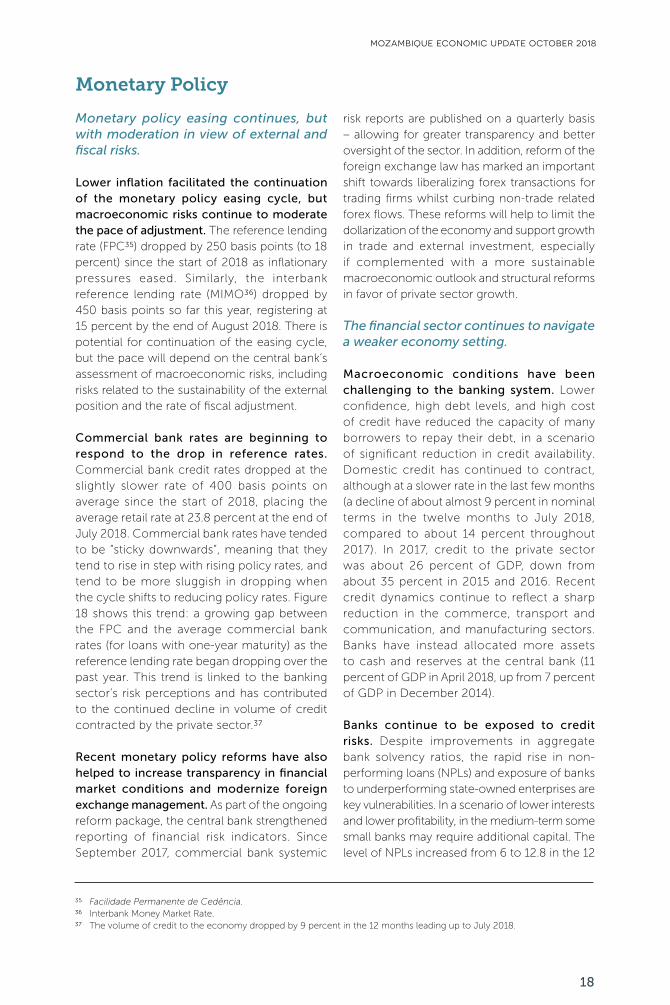
Commercial bank rates are beginning to respond to the drop in reference rates. Commercial bank credit rates dropped at the slightly slower rate of 400 basis points on average since the start of 2018, placing the average retail rate at 23.8 percent at the end of July 2018. Commercial bank rates have tended to be “sticky downwards”, meaning that they tend to rise in step with rising policy rates, and tend to be more sluggish in dropping when the cycle shifts to reducing policy rates. Figure 18 shows this trend: a growing gap between the FPC and the average commercial bank rates (for loans with one-year maturity) as the reference lending rate began dropping over the past year. This trend is linked to the banking sector’s risk perceptions and has contributed to the continued decline in volume of credit contracted by the private sector.37
Recent monetary policy reforms have also helped to increase transparency in financial market conditions and modernize foreign exchange management. As part of the ongoing reform package, the central bank strengthened reporting of financial risk indicators. Since September 2017, commercial bank systemic
risk reports are published on a quarterly basis – allowing for greater transparency and better oversight of the sector. In addition, reform of the foreign exchange law has marked an important shift towards liberalizing forex transactions for trading firms whilst curbing non-trade related forex flows. These reforms will help to limit the dollarization of the economy and support growth in trade and external investment, especially if complemented with a more sustainable macroeconomic outlook and structural reforms in favor of private sector growth.
The financial sector continues to navigate a weaker economy setting.
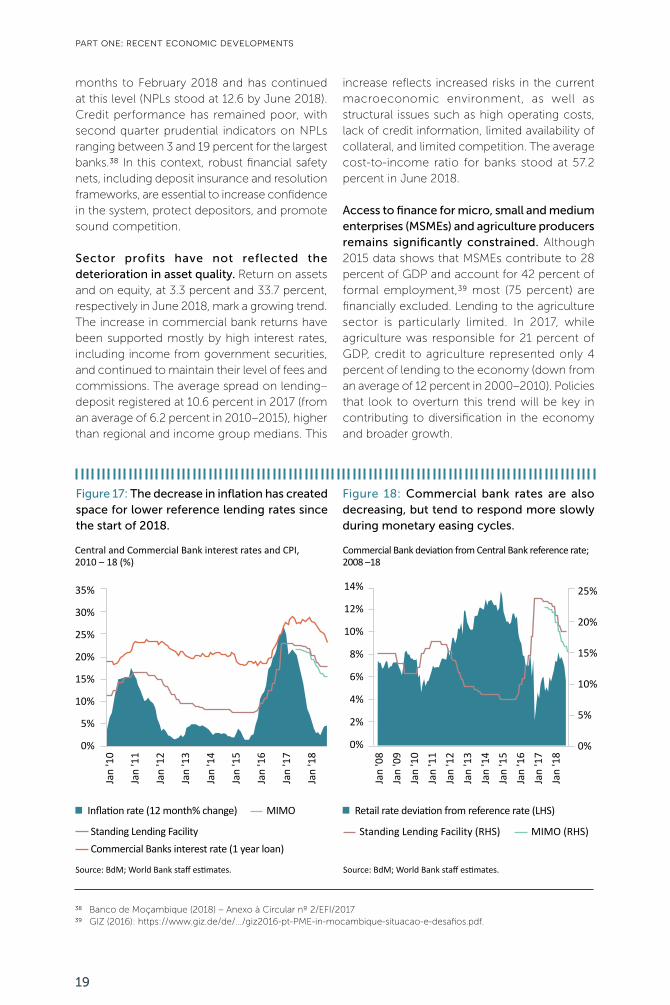
Macroeconomic conditions have been challenging to the banking system. Lower confidence, high debt levels, and high cost of credit have reduced the capacity of many borrowers to repay their debt, in a scenario of significant reduction in credit availability. Domestic credit has continued to contract, although at a slower rate in the last few months (a decline of about almost 9 percent in nominal terms in the twelve months to July 2018, compared to about 14 percent throughout 2017). In 2017, credit to the private sector was about 26 percent of GDP, down from about 35 percent in 2015 and 2016. Recent credit dynamics continue to reflect a sharp reduction in the commerce, transport and communication, and manufacturing sectors. Banks have instead allocated more assets to cash and reserves at the central bank (11 percent of GDP in April 2018, up from 7 percent of GDP in December 2014).
Banks continue to be exposed to credit risks. Despite improvements in aggregate bank solvency ratios, the rapid rise in non-performing loans (NPLs) and exposure of banks to underperforming state-owned enterprises are key vulnerabilities. In a scenario of lower interests and lower profitability, in the medium-term some small banks may require additional capital. The level of NPLs increased from 6 to 12.8 in the 12
Facilidade Permanente de Cedência.Interbank Money Market Rate.The volume of credit to the economy dropped by 9 percent in the 12 months leading up to July 2018.
353637
mozambique economic update october 2018
18
Inflation rate (12 month% change) Retail rate deviation from reference rate (LHS)
Jan
'08
Jan
'09
Jan
'10
Jan
'11
Jan
'12
Jan
'13
Jan
'14
Jan
'15
Jan
'16
Jan
'17
Jan
'18
Jan
'10
Jan
'11
Jan
'12
Jan
'13
Jan
'14
Jan
'15
Jan
'16
Jan
'17
Jan
'18
Standing Lending FacilityCommercial Banks interest rate (1 year loan)
MIMO
Standing Lending Facility (RHS) MIMO (RHS)
Source: BdM; World Bank staff estimates. Source: BdM; World Bank staff estimates.
Figure 17: The decrease in inflation has created space for lower reference lending rates since the start of 2018.
Figure 18: Commercial bank rates are also decreasing, but tend to respond more slowly during monetary easing cycles.
Central and Commercial Bank interest rates and CPI, 2010 – 18 (%)
Commercial Bank deviation from Central Bank reference rate; 2008 –18
14%
12%
10%
8%
6%
4%
2%
0%
35%
30%
25%
20%
15%
10%
5%
0%
25%
20%
15%
10%
5%
0%
months to February 2018 and has continued at this level (NPLs stood at 12.6 by June 2018). Credit performance has remained poor, with second quarter prudential indicators on NPLs ranging between 3 and 19 percent for the largest banks.38 In this context, robust financial safety nets, including deposit insurance and resolution frameworks, are essential to increase confidence in the system, protect depositors, and promote sound competition.
Sector profits have not reflected the deterioration in asset quality. Return on assets and on equity, at 3.3 percent and 33.7 percent, respectively in June 2018, mark a growing trend. The increase in commercial bank returns have been supported mostly by high interest rates, including income from government securities, and continued to maintain their level of fees and commissions. The average spread on lending–deposit registered at 10.6 percent in 2017 (from an average of 6.2 percent in 2010–2015), higher than regional and income group medians. This
increase reflects increased risks in the current macroeconomic environment, as well as structural issues such as high operating costs, lack of credit information, limited availability of collateral, and limited competition. The average cost-to-income ratio for banks stood at 57.2 percent in June 2018.
Access to finance for micro, small and medium enterprises (MSMEs) and agriculture producers remains significantly constrained. Although 2015 data shows that MSMEs contribute to 28 percent of GDP and account for 42 percent of formal employment,39 most (75 percent) are financially excluded. Lending to the agriculture sector is particularly limited. In 2017, while agriculture was responsible for 21 percent of GDP, credit to agriculture represented only 4 percent of lending to the economy (down from an average of 12 percent in 2000–2010). Policies that look to overturn this trend will be key in contributing to diversification in the economy and broader growth.
Banco de Moçambique (2018) – Anexo à Circular nº 2/EFI/2017GIZ (2016): https://www.giz.de/de/.../giz2016-pt-PME-in-mocambique-situacao-e-desafios.pdf.
3839
part one: recent economic developments
19
40%30%20%10%
0%-10%-20%-30%
18%14%12%10%
8%6%4%2%0%
Constant Current
Source: BdM; World Bank staff estimates. Source: BdM
Figure 19: Credit growth remains negative, despite easing rates.
Figure 20: Commercial bank asset quality has deteriorated with higher NPLs.
Credit growth (12 month % change); 2015 – 18 Non-performing loans (% of total loans); 2014 – 18
Jan
'15
Mar
'15
May
'15
Jul '
15Se
p '1
5N
ov '1
5Ja
n '1
6 M
ar '1
6M
ay '1
6Ju
l '16
Sep
'16
Nov
'16
Jan
'17
Mar
'17
May
'17
Jul '
17Se
p '1
7N
ov '1
7Ja
n '1
8 M
ar '1
8M
ay '1
8Ju
l '18
Jan
'14
Mar
'14
May
'14
Jul '
14Se
p '1
4N
ov '1
4Ja
n '1
5 M
ar '1
5M
ay '1
5Ju
l '15
Sep
'15
Nov
'15
Jan
'16
Mar
'16
May
'16
Jul '
16Se
p '1
6N
ov '1
6Ja
n '1
7 M
ar '1
7M
ay '1
7Ju
l '17
Sep
'17
Nov
'17
Jan
'18
mozambique economic update october 2018
20

Part Two:Shifting to More Inclusive Growth
There is little doubt of the role that broadly shared economic growth plays in reducing poverty and distributing wealth. Drawing on the recent World Bank Poverty Assessment and Jobs Diagnostic reports for Mozambique, this section of the Mozambique Economic Update discusses the structure and drivers of Mozambique’s growth, and the extent to which past patterns of growth helped to shape current poverty and inequality outcomes. The analysis shows that increased productivity and a gradual structural transition in jobs, from agriculture to services, boosted productivity and accelerated the pace of poverty reduction in recent years. Yet, these gains were accompanied by a widening gap between the better-off and the poor as growth was concentrated in urban areas, and as advances in access to both services and infrastructure accrued mostly to urban populations. Dealing with the challenges of poverty and rising inequality requires redefining the drivers of inclusive growth in Mozambique’s resource dependent economy. Extractives will not be enough. An intensive and ambitious focus on achieving diversification, raising rural productivity, and providing more equal access to services is essential.
Structural change, Productivity, and Poverty Reduction.
Productivity has been the main engine of Mozambique’s strong and sustained economic growth over the last two decades. It is well known that Mozambique’s GDP growth picked up remarkably following the end of the civil war in 199240 boosting incomes and living standards, and making it one of the fastest-growing countries in Sub-Saharan Africa (Figure 21). This growth was mostly driven by the rising labor productivity (Figure 22).41 Broadly speaking, two forces can raise labor productivity. First, workers can become more productive if there is an increase in the stock of capital, an improvement in technology, or knowledge that leads to higher output per worker in their sector of employment (within-sector productivity growth). Second, productivity can increase with the reallocation of workers from lower to higher productivity sectors (between-sector productivity growth). As shown in Table 5 below, overall the two sources have contributed almost equally to labor productivity growth in the period 1996-2014. Yet, after 2008, it is the redeployment of labor across sectors that explains most of the growth in labor productivity. In contrast, changes in employment levels and labor force participation have had a negligible contribution.
part two: a missed opportunity - strong but not broadly shared growth
GDP grew at an annual average rate of 7.2 percent between 2000 and 2016.Table 5 shows the results of a “growth accounting exercise” used to decompose GDP per capita growth into four components: productivity, the employment rate, the labor participation rate and the ratio of the working age population to the total population.
4041
21
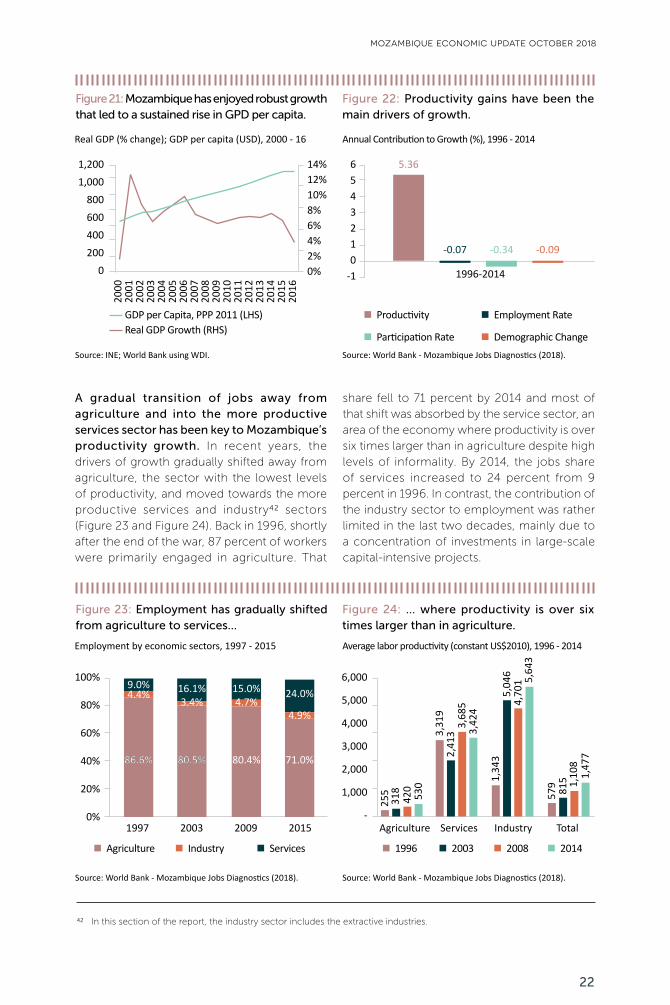
Figure 21: Mozambique has enjoyed robust growth that led to a sustained rise in GPD per capita.
Figure 23: Employment has gradually shifted from agriculture to services…
Figure 22: Productivity gains have been the main drivers of growth.
Figure 24: … where productivity is over six times larger than in agriculture.
Real GDP (% change); GDP per capita (USD), 2000 - 16
Employment by economic sectors, 1997 - 2015
Annual Contribution to Growth (%), 1996 - 2014
Average labor productivity (constant US$2010), 1996 - 2014
1,2001,000
800600400200
0
2000
2001
2002
2003
2004
2005
2006
2007
2008
2009
2010
2011
2012
2013
2014
2015
2016
14%12%10%8%6%4%2%0%
GDP per Capita, PPP 2011 (LHS)Real GDP Growth (RHS)
Source: INE; World Bank using WDI.
Source: World Bank - Mozambique Jobs Diagnostics (2018).
Source: World Bank - Mozambique Jobs Diagnostics (2018).
Source: World Bank - Mozambique Jobs Diagnostics (2018).
6543210
-1
5.36
-0.07 -0.34 -0.09
1996-2014
Productivity
Participation Rate
Employment Rate
Demographic Change
100%
80%
60%
40%
20%
0%
6,000
5,000
4,000
3,000
2,000
1,000
-1997 Agriculture2003 Services2009 Industry2015 Total
Agriculture 1996 2003 2008 2014Industry Services
86.6% 80.5%
9.0% 16.1%
86.6% 80.5%
15.0% 24.0%
80.4% 71.0%
255
3,31
9
1,34
3
579
318
2,41
3
5,04
6
815
420
3,68
5 4,70
1
1,10
8
530
3,42
4
5,64
3
1,47
7
4.4%3.4% 4.7%
4.9%
mozambique economic update october 2018
A gradual transition of jobs away from agriculture and into the more productive services sector has been key to Mozambique’s productivity growth. In recent years, the drivers of growth gradually shifted away from agriculture, the sector with the lowest levels of productivity, and moved towards the more productive services and industry42 sectors (Figure 23 and Figure 24). Back in 1996, shortly after the end of the war, 87 percent of workers were primarily engaged in agriculture. That
share fell to 71 percent by 2014 and most of that shift was absorbed by the service sector, an area of the economy where productivity is over six times larger than in agriculture despite high levels of informality. By 2014, the jobs share of services increased to 24 percent from 9 percent in 1996. In contrast, the contribution of the industry sector to employment was rather limited in the last two decades, mainly due to a concentration of investments in large-scale capital-intensive projects.
In this section of the report, the industry sector includes the extractive industries.42
22
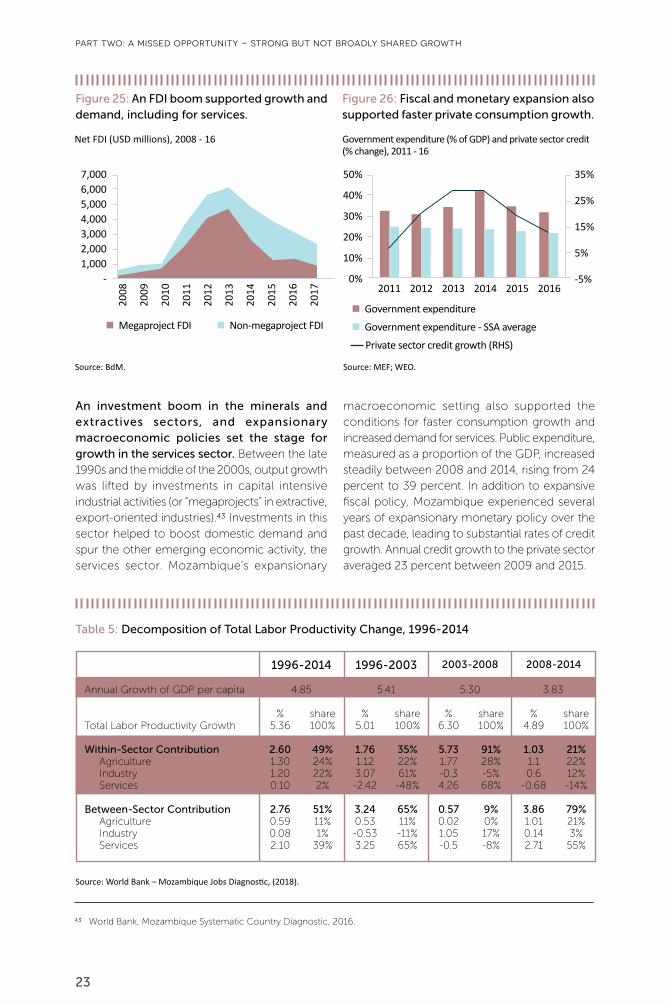
Figure 25: An FDI boom supported growth and demand, including for services.
Figure 26: Fiscal and monetary expansion also supported faster private consumption growth.
Net FDI (USD millions), 2008 - 16 Government expenditure (% of GDP) and private sector credit (% change), 2011 - 16
7,0006,0005,0004,0003,0002,0001,000
-
50%
40%
30%
20%
10%
0%
2008
2009
2010
2011
2012
2013
2014
2015
2016
2017
Megaproject FDIGovernment expenditure
Government expenditure - SSA averageNon-megaproject FDI
35%
25%
15%
5%
-5%2011 2013 20152012 2014 2016
Private sector credit growth (RHS)
Source: BdM. Source: MEF; WEO.
Source: World Bank – Mozambique Jobs Diagnostic, (2018).
An investment boom in the minerals and extractives sectors, and expansionary macroeconomic policies set the stage for growth in the services sector. Between the late 1990s and the middle of the 2000s, output growth was lifted by investments in capital intensive industrial activities (or “megaprojects” in extractive, export-oriented industries).43 Investments in this sector helped to boost domestic demand and spur the other emerging economic activity, the services sector. Mozambique’s expansionary
macroeconomic setting also supported the conditions for faster consumption growth and increased demand for services. Public expenditure, measured as a proportion of the GDP, increased steadily between 2008 and 2014, rising from 24 percent to 39 percent. In addition to expansive fiscal policy, Mozambique experienced several years of expansionary monetary policy over the past decade, leading to substantial rates of credit growth. Annual credit growth to the private sector averaged 23 percent between 2009 and 2015.
Table 5: Decomposition of Total Labor Productivity Change, 1996-2014
1996-2014 1996-2003 2003-2008 2008-2014
Annual Growth of GDP per capita
Total Labor Productivity Growth
Within-Sector Contribution Agriculture Industry Services
Between-Sector Contribution Agriculture Industry Services
4.85
%5.36
2.601.301.200.10
2.760.590.082.10
%5.01
1.761.123.07-2.42
3.240.53-0.533.25
%6.30
5.731.77-0.34.26
0.570.021.05-0.5
%4.89
1.031.10.6
-0.68
3.861.010.142.71
share100%
49%24%22%2%
51%11%1%
39%
share100%
35%22%61%-48%
65%11%-11%65%
share100%
91%28%-5%68%
9%0%17%-8%
share100%
21%22%12%-14%
79%21%3%55%
5.41 5.30 3.83
World Bank, Mozambique Systematic Country Diagnostic, 2016.43
part two: a missed opportunity - strong but not broadly shared growth
23
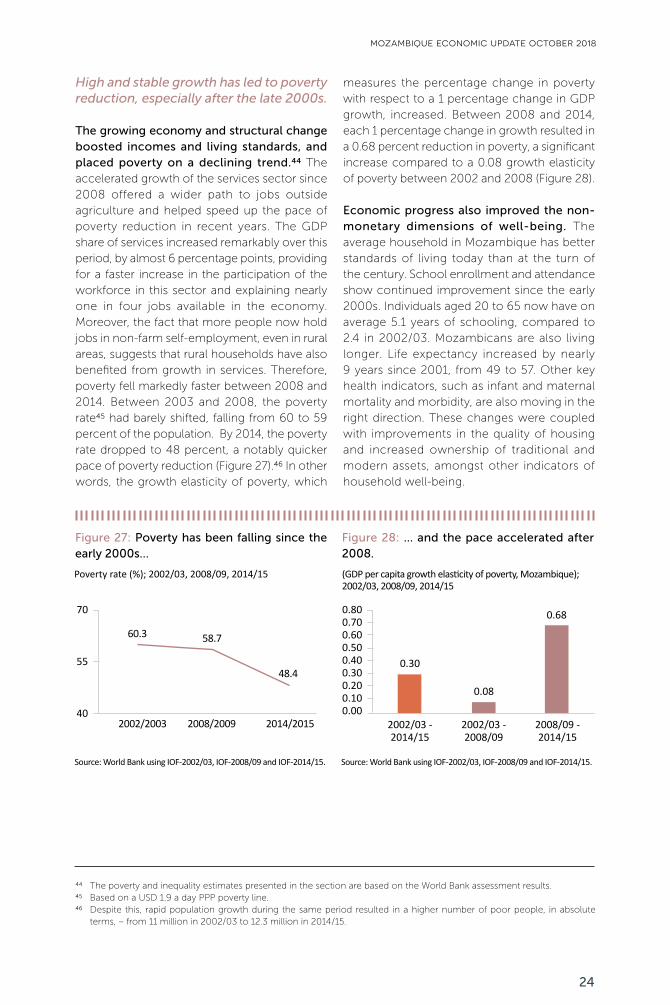
Figure 27: Poverty has been falling since the early 2000s…
Figure 28: … and the pace accelerated after 2008.
Poverty rate (%); 2002/03, 2008/09, 2014/15 (GDP per capita growth elasticity of poverty, Mozambique); 2002/03, 2008/09, 2014/15
70
55
40
0.800.700.600.500.400.300.200.100.00
2002/2003 2008/2009 2014/2015
60.3 58.7
48.4
2002/03 - 2014/15
0.30
0.08
0.68
2002/03 - 2008/09
2008/09 - 2014/15
Source: World Bank using IOF-2002/03, IOF-2008/09 and IOF-2014/15. Source: World Bank using IOF-2002/03, IOF-2008/09 and IOF-2014/15.
mozambique economic update october 2018
High and stable growth has led to poverty reduction, especially after the late 2000s.
The growing economy and structural change boosted incomes and living standards, and placed poverty on a declining trend.44 The accelerated growth of the services sector since 2008 offered a wider path to jobs outside agriculture and helped speed up the pace of poverty reduction in recent years. The GDP share of services increased remarkably over this period, by almost 6 percentage points, providing for a faster increase in the participation of the workforce in this sector and explaining nearly one in four jobs available in the economy. Moreover, the fact that more people now hold jobs in non-farm self-employment, even in rural areas, suggests that rural households have also benefited from growth in services. Therefore, poverty fell markedly faster between 2008 and 2014. Between 2003 and 2008, the poverty rate45 had barely shifted, falling from 60 to 59 percent of the population. By 2014, the poverty rate dropped to 48 percent, a notably quicker pace of poverty reduction (Figure 27).46 In other words, the growth elasticity of poverty, which
measures the percentage change in poverty with respect to a 1 percentage change in GDP growth, increased. Between 2008 and 2014, each 1 percentage change in growth resulted in a 0.68 percent reduction in poverty, a significant increase compared to a 0.08 growth elasticity of poverty between 2002 and 2008 (Figure 28).
Economic progress also improved the non-monetary dimensions of well-being. The average household in Mozambique has better standards of living today than at the turn of the century. School enrollment and attendance show continued improvement since the early 2000s. Individuals aged 20 to 65 now have on average 5.1 years of schooling, compared to 2.4 in 2002/03. Mozambicans are also living longer. Life expectancy increased by nearly 9 years since 2001, from 49 to 57. Other key health indicators, such as infant and maternal mortality and morbidity, are also moving in the right direction. These changes were coupled with improvements in the quality of housing and increased ownership of traditional and modern assets, amongst other indicators of household well-being.
The poverty and inequality estimates presented in the section are based on the World Bank assessment results.Based on a USD 1.9 a day PPP poverty line.Despite this, rapid population growth during the same period resulted in a higher number of poor people, in absolute terms, – from 11 million in 2002/03 to 12.3 million in 2014/15.
444546
24
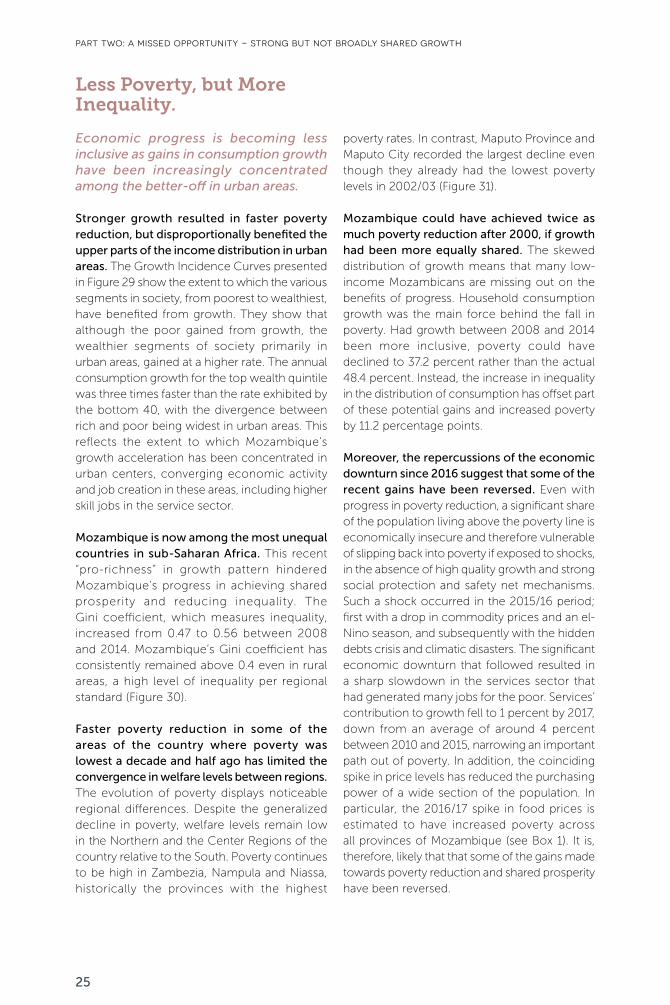
Less Poverty, but More Inequality.
Economic progress is becoming less inclusive as gains in consumption growth have been increasingly concentrated among the better-off in urban areas.
Stronger growth resulted in faster poverty reduction, but disproportionally benefited the upper parts of the income distribution in urban areas. The Growth Incidence Curves presented in Figure 29 show the extent to which the various segments in society, from poorest to wealthiest, have benefited from growth. They show that although the poor gained from growth, the wealthier segments of society primarily in urban areas, gained at a higher rate. The annual consumption growth for the top wealth quintile was three times faster than the rate exhibited by the bottom 40, with the divergence between rich and poor being widest in urban areas. This reflects the extent to which Mozambique’s growth acceleration has been concentrated in urban centers, converging economic activity and job creation in these areas, including higher skill jobs in the service sector.
Mozambique is now among the most unequal countries in sub-Saharan Africa. This recent “pro-richness” in growth pattern hindered Mozambique’s progress in achieving shared prosperity and reducing inequality. The Gini coefficient, which measures inequality, increased from 0.47 to 0.56 between 2008 and 2014. Mozambique’s Gini coefficient has consistently remained above 0.4 even in rural areas, a high level of inequality per regional standard (Figure 30).
Faster poverty reduction in some of the areas of the country where poverty was lowest a decade and half ago has limited the convergence in welfare levels between regions. The evolution of poverty displays noticeable regional differences. Despite the generalized decline in poverty, welfare levels remain low in the Northern and the Center Regions of the country relative to the South. Poverty continues to be high in Zambezia, Nampula and Niassa, historically the provinces with the highest
poverty rates. In contrast, Maputo Province and Maputo City recorded the largest decline even though they already had the lowest poverty levels in 2002/03 (Figure 31).
Mozambique could have achieved twice as much poverty reduction after 2000, if growth had been more equally shared. The skewed distribution of growth means that many low-income Mozambicans are missing out on the benefits of progress. Household consumption growth was the main force behind the fall in poverty. Had growth between 2008 and 2014 been more inclusive, poverty could have declined to 37.2 percent rather than the actual 48.4 percent. Instead, the increase in inequality in the distribution of consumption has offset part of these potential gains and increased poverty by 11.2 percentage points.
Moreover, the repercussions of the economic downturn since 2016 suggest that some of the recent gains have been reversed. Even with progress in poverty reduction, a significant share of the population living above the poverty line is economically insecure and therefore vulnerable of slipping back into poverty if exposed to shocks, in the absence of high quality growth and strong social protection and safety net mechanisms. Such a shock occurred in the 2015/16 period; first with a drop in commodity prices and an el-Nino season, and subsequently with the hidden debts crisis and climatic disasters. The significant economic downturn that followed resulted in a sharp slowdown in the services sector that had generated many jobs for the poor. Services’ contribution to growth fell to 1 percent by 2017, down from an average of around 4 percent between 2010 and 2015, narrowing an important path out of poverty. In addition, the coinciding spike in price levels has reduced the purchasing power of a wide section of the population. In particular, the 2016/17 spike in food prices is estimated to have increased poverty across all provinces of Mozambique (see Box 1). It is, therefore, likely that that some of the gains made towards poverty reduction and shared prosperity have been reversed.
part two: a missed opportunity - strong but not broadly shared growth
25
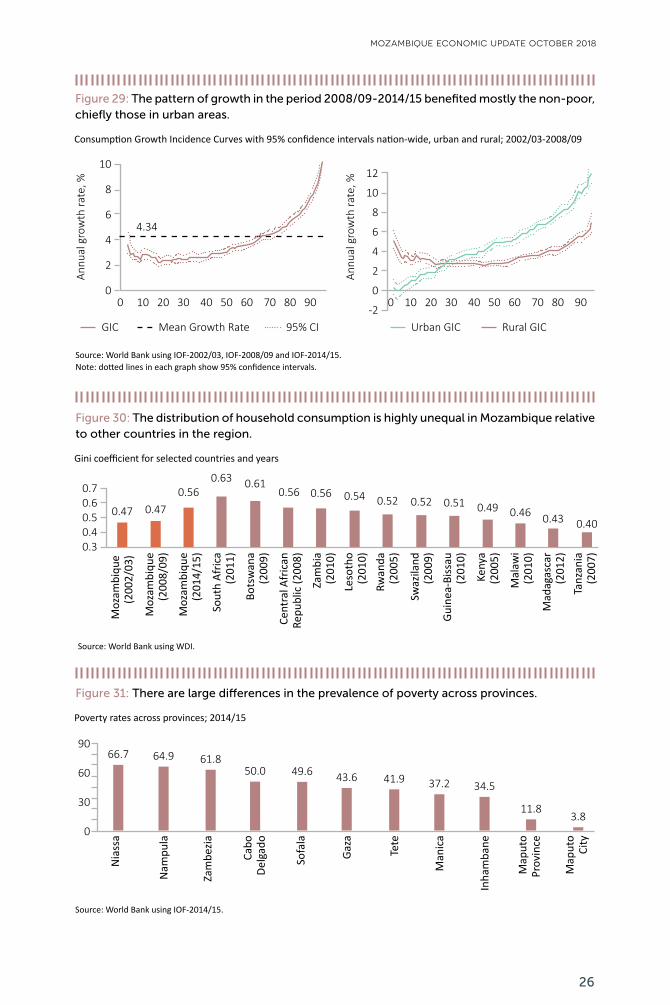
Figure 29: The pattern of growth in the period 2008/09-2014/15 benefited mostly the non-poor, chiefly those in urban areas.
Consumption Growth Incidence Curves with 95% confidence intervals nation-wide, urban and rural; 2002/03-2008/09
Gini coefficient for selected countries and years
Poverty rates across provinces; 2014/15
10
8
6
4
2
0
12
10
8
6
4
2
0
-2
Annu
al g
row
th ra
te, %
Annu
al g
row
th ra
te, %
4.34
0 10 20 30 40 50 60 70 80 90 0 10 20 30 40 50 60 70 80 90
GIC Urban GIC Rural GICMean Growth Rate 95% CI
Source: World Bank using IOF-2002/03, IOF-2008/09 and IOF-2014/15.Note: dotted lines in each graph show 95% confidence intervals.
Figure 30: The distribution of household consumption is highly unequal in Mozambique relative to other countries in the region.
Figure 31: There are large differences in the prevalence of poverty across provinces.
0.70.60.50.40.3
90
60
30
0
0.47
66.7 64.9 61.850.0 49.6 43.6 41.9 37.2 34.5
11.83.8
0.470.56
0.63 0.610.56 0.56 0.54 0.52 0.52 0.51 0.49 0.46 0.43 0.40
Moz
ambi
que
(200
2/03
)N
iass
a
Nam
pula
Zam
bezia
Sofa
la
Gaza
Tete
Man
ica
Inha
mba
ne
Map
uto
Prov
ince
Map
uto
City
Cabo
Delg
ado
Moz
ambi
que
(200
8/09
)
Moz
ambi
que
(201
4/15
)
Sout
h Af
rica
(201
1)
Bots
wan
a(2
009)
Cent
ral A
fric
an
Repu
blic
(200
8)
Zam
bia
(201
0)Le
soth
o(2
010)
Rwan
da(2
005)
Swaz
iland
(200
9)
Guin
ea-B
issau
(201
0)
Keny
a (2
005)
Mal
awi
(201
0)M
adag
asca
r(2
012)
Tanz
ania
(200
7)
Source: World Bank using WDI.
Source: World Bank using IOF-2014/15.
mozambique economic update october 2018
26
Dealing with the Challenge of Falling Productivity and Rising Inequality through Broad-Based Growth.
Is Mozambique’s recent growth model suited for a future of sustained and inclusive growth? Mozambique’s growth model, especially from 2008 onwards, relied increasingly on investment inflows linked to the extractive sector. Booming investments in this sector, coupled with a cycle of expansionary macroeconomic policies, raised growth and boosted domestic demand for goods and services. This model contributed to important advances in poverty reduction as the volume of jobs in the service sector increased to meet the consumptions needs of the domestic economy, and drew labor from the low productivity agricultural sector, but it was accompanied by a reduction in productivity growth since 2008, and increased inequality.
The service sector was key to boosting growth and poverty reduction, but its declining level of productivity may limit its future contribution to growth. Productivity growth in services declined between 2008 and 2014 as the sector began to absorb more labor over this period, pulling the economy’s overall rate of productivity growth downwards, which suggests that the skills and marginal productivity of new workers entering the services sector is below the average level of productivity in the sector. In the absence of significant increases in the use of technology and development of skills, a continued shift of labor from agriculture to services will reduce within-sector productivity growth in services further, turning this sector into a drag on the economy’s rate of productivity growth.47 Moreover, whilst an expansionary macroeconomic policy setting can help to boost demand, such policies can prove counterproductive to sustained long-term growth, especially if they lead to an unsustainable increase in the levels of public and private debt.
Similarly, limited job creation and slow productivity growth in industry could limit the
role of this sector if the capacity of SMEs to add value and to export is not raised. This sector, which includes the majority of Mozambique’s megaprojects, has played an important role as a driver of investment and growth over the past 20 years. It nearly doubled its share in GDP from 10 percent to 19 percent between 1996 and 2014 and maintained the highest level of output per worker. Much of this growth accompanied the emergence of capital-intensive megaprojects at a time when the manufacturing base was small, which skewed the sector towards these large industries whilst small and medium enterprises played a smaller role.48 This structure of the sector contributed to the low job share of industry, which has remained stagnant at 4-5 percent of total employment since 1996. Besides its low contribution to employment, two other factors standout as causes for concern in the evolution of Mozambique’s industrial sector. Firstly, industry’s contribution to productivity growth has been lower than both agriculture and services’ contributions between 1996 and 2014, which given its stable job share, indicates limited progress in increasing innovation and value added within the sector. Secondly, only a small fraction of small and medium enterprises sells to export markets (only 4 percent of MSMEs49), which limits the sector’s contribution to export diversification, and also limits increase in value added through knowledge transfers that accompany growth in export industries.
Shifting the growth model to broaden the drivers of output growth and to raise productivity in sectors with the highest employment potential is a primary challenge facing Mozambique’s policy makers today. Rapid growth episodes, as experienced by Mozambique for most of the 2000s, are a welcome occurrence. But it is the breadth of this growth across the sectors of the economy,
World Bank, Mozambique Jobs Diagnostic, 2018.World Bank, Mozambique Systematic Country Diagnostic, 2016.A 2017 survey of micro, small and medium enterprises, carried out by the University of Copenhagen in collaborations with others, found that 19 out of 520 of Mozambican micro, small and medium sized firms (3.7 percent) sell to export markets.
474849
part two: a missed opportunity - strong but not broadly shared growth
27
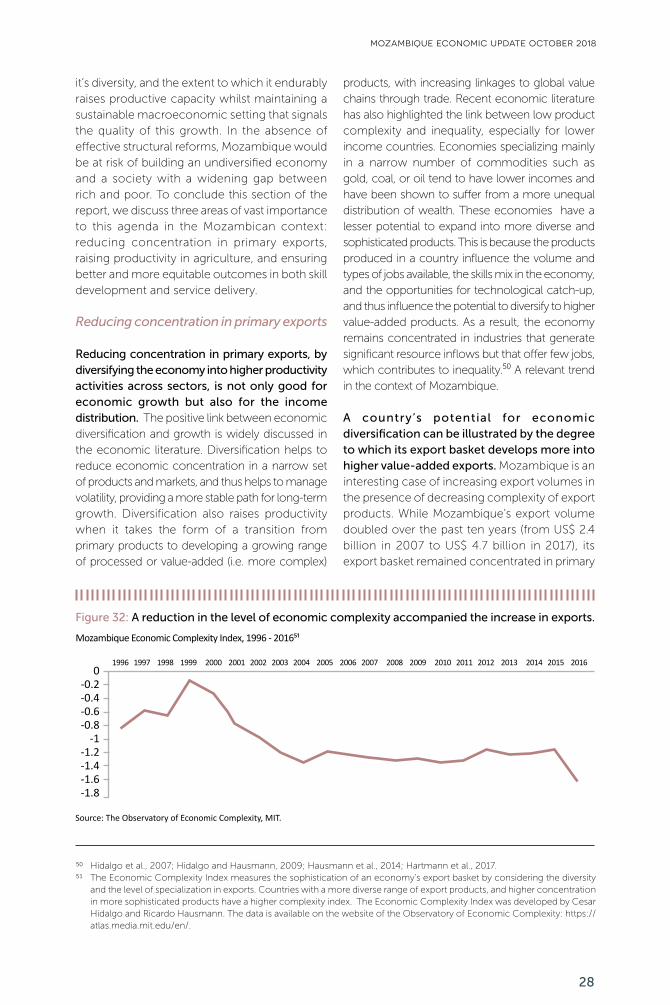
Figure 32: A reduction in the level of economic complexity accompanied the increase in exports.
Mozambique Economic Complexity Index, 1996 - 2016⁵¹
0-0.2-0.4-0.6-0.8
-1-1.2-1.4-1.6-1.8
Source: The Observatory of Economic Complexity, MIT.
1996 1997 1998 1999 2000 2001 2002 2003 2004 2005 2006 2007 2008 2009 2010 2011 2012 2013 2014 2015 2016
mozambique economic update october 2018
it’s diversity, and the extent to which it endurably raises productive capacity whilst maintaining a sustainable macroeconomic setting that signals the quality of this growth. In the absence of effective structural reforms, Mozambique would be at risk of building an undiversified economy and a society with a widening gap between rich and poor. To conclude this section of the report, we discuss three areas of vast importance to this agenda in the Mozambican context: reducing concentration in primary exports, raising productivity in agriculture, and ensuring better and more equitable outcomes in both skill development and service delivery.
Reducing concentration in primary exports
Reducing concentration in primary exports, by diversifying the economy into higher productivity activities across sectors, is not only good for economic growth but also for the income distribution. The positive link between economic diversification and growth is widely discussed in the economic literature. Diversification helps to reduce economic concentration in a narrow set of products and markets, and thus helps to manage volatility, providing a more stable path for long-term growth. Diversification also raises productivity when it takes the form of a transition from primary products to developing a growing range of processed or value-added (i.e. more complex)
products, with increasing linkages to global value chains through trade. Recent economic literature has also highlighted the link between low product complexity and inequality, especially for lower income countries. Economies specializing mainly in a narrow number of commodities such as gold, coal, or oil tend to have lower incomes and have been shown to suffer from a more unequal distribution of wealth. These economies have a lesser potential to expand into more diverse and sophisticated products. This is because the products produced in a country influence the volume and types of jobs available, the skills mix in the economy, and the opportunities for technological catch-up, and thus influence the potential to diversify to higher value-added products. As a result, the economy remains concentrated in industries that generate significant resource inflows but that offer few jobs, which contributes to inequality.⁵⁰ A relevant trend in the context of Mozambique.
A country’s potential for economic diversification can be illustrated by the degree to which its export basket develops more into higher value-added exports. Mozambique is an interesting case of increasing export volumes in the presence of decreasing complexity of export products. While Mozambique’s export volume doubled over the past ten years (from US$ 2.4 billion in 2007 to US$ 4.7 billion in 2017), its export basket remained concentrated in primary
Hidalgo et al., 2007; Hidalgo and Hausmann, 2009; Hausmann et al., 2014; Hartmann et al., 2017.The Economic Complexity Index measures the sophistication of an economy’s export basket by considering the diversity and the level of specialization in exports. Countries with a more diverse range of export products, and higher concentration in more sophisticated products have a higher complexity index. The Economic Complexity Index was developed by Cesar Hidalgo and Ricardo Hausmann. The data is available on the website of the Observatory of Economic Complexity: https://atlas.media.mit.edu/en/.
5051
28
part two: a missed opportunity - strong but not broadly shared growth
products. In 1996, Mozambique’s export basket was dominated by primary marine and agricultural exports, by 2016 coal, gas, and minerals emerged as major additional products. The composition of the export basket changed but new and old major exports all shared the feature of being primary products (Figure 33 and Figure 34). As a result, Mozambique’s position on MIT’s Economic Complexity Index decreased (Figure 32). Mozambique’s performance as measured by this index, which estimates the sophistication of an economy’s export basket, has been dropping since the late 1990s (Figure 32), placing Mozambique’s level of economic complexity at a lower level than several of its peers in the Africa region (Figure 35). In addition to this, the number of products exported by Mozambique declined between 2003 and 2012, before picking up slightly, a trend that contrasts with most well-performing African economies over this period, and which suggests a less competitive context for Mozambican exporters not specialized in the main primary products (Figure 36).
How can Mozambique broaden its economy by diversifying and progressively increasing the sophistication of its productive base? There is no single answer or unique approach to this important question. It will take a long-term multifaceted policy package that successfully builds the competitiveness of Mozambican firms, increases their capacity to export, and that invests in building skills, against the background of an appropriate macroeconomic framework, to advance towards this goal. A focus on building broad-based firm, labor, and institutional capacities will also help place Mozambique in a position to create opportunities, increase productivity and sophistication across a wide a range of sectors. This includes manufacturing, which created a pathway to development for Asian and Latin American countries in the 20th century, but also agriculture and services, which hold potential to become more productive and to create pathways to jobs for many Mozambicans.
29
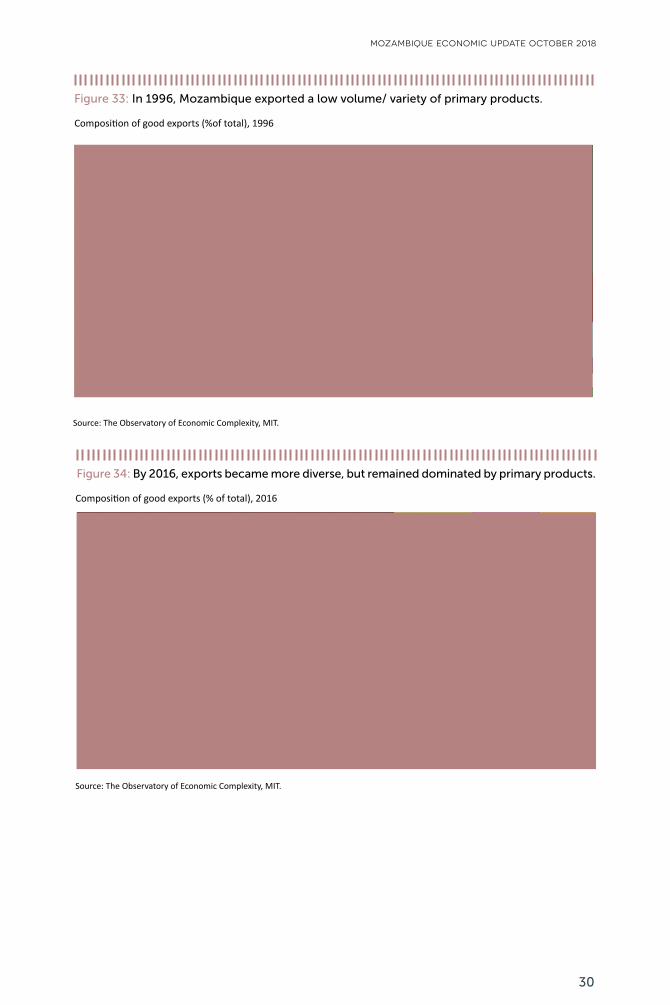
Composition of good exports (%of total), 1996
Composition of good exports (% of total), 2016
Figure 33: In 1996, Mozambique exported a low volume/ variety of primary products.
Figure 34: By 2016, exports became more diverse, but remained dominated by primary products.
Source: The Observatory of Economic Complexity, MIT.
Source: The Observatory of Economic Complexity, MIT.
mozambique economic update october 2018
30
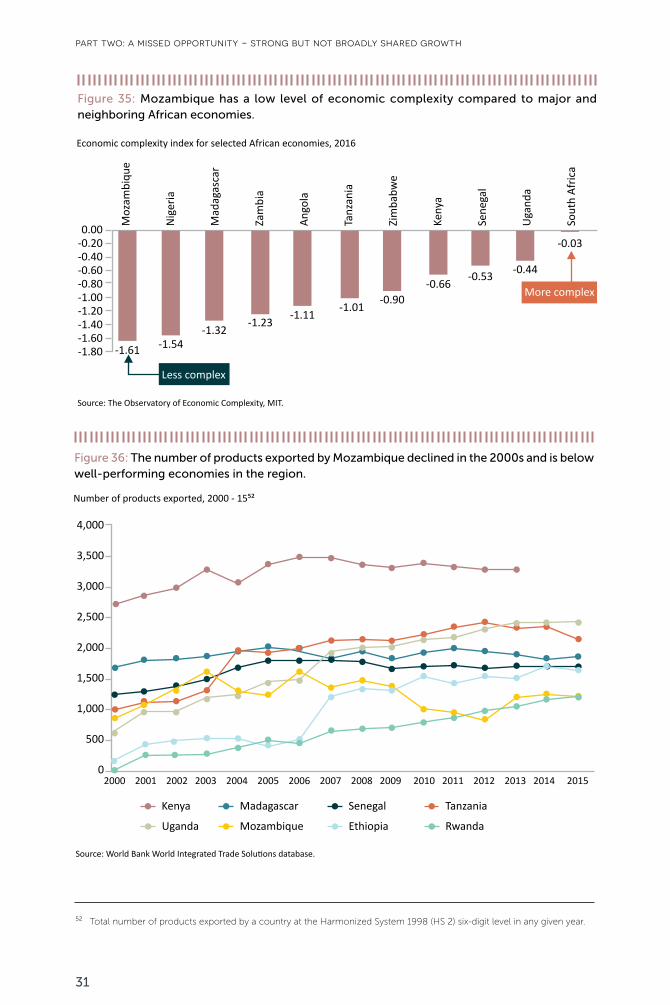
Source: The Observatory of Economic Complexity, MIT.
Figure 35: Mozambique has a low level of economic complexity compared to major and neighboring African economies.
Economic complexity index for selected African economies, 2016
0.00-0.20-0.40-0.60-0.80-1.00-1.20-1.40-1.60-1.80
Moz
ambi
que
Nig
eria
Mad
agas
car
Zam
bia
Ango
la
Tanz
ania
Zim
babw
e
Keny
a
Sene
gal
Uga
nda
Sout
h Af
rica
Less complex
More complex
-1.61 -1.54-1.32
-1.23-1.11
-1.01-0.90
-0.66-0.53 -0.44
-0.03
Figure 36: The number of products exported by Mozambique declined in the 2000s and is below well-performing economies in the region.
Number of products exported, 2000 - 15⁵²
4,000
3,500
3,000
2,500
2,000
1,500
1,000
500
02000 2001 2002 2003 2004 2005 2006 2007 2008 2009 2010 2011 2012 2013 2014 2015
Source: World Bank World Integrated Trade Solutions database.
Kenya
Mozambique
Madagascar
Ethiopia
Senegal
Rwanda
Tanzania
Uganda
Total number of products exported by a country at the Harmonized System 1998 (HS 2) six-digit level in any given year.⁵²
part two: a missed opportunity - strong but not broadly shared growth
31
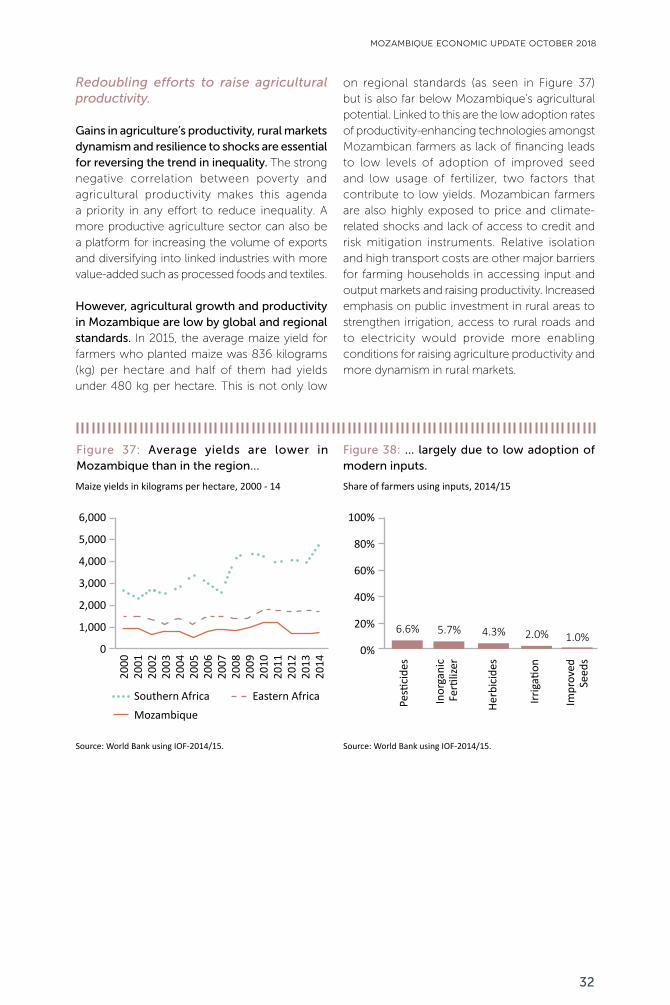
Source: World Bank using IOF-2014/15. Source: World Bank using IOF-2014/15.
Figure 37: Average yields are lower in Mozambique than in the region…
Figure 38: … largely due to low adoption of modern inputs.
Maize yields in kilograms per hectare, 2000 - 14 Share of farmers using inputs, 2014/15
6,000
5,000
4,000
3,000
2,000
1,000
0
Southern AfricaMozambique
Eastern Africa
2000
2001
2002
2003
2004
2005
2006
2007
2008
2009
2010
2011
2012
2013
2014
100%
80%
60%
40%
20%
0%
Pesti
cide
s
Inor
gani
c Fe
rtiliz
er
Herb
icid
es
Irrig
ation
Impr
oved
Se
eds
6.6% 5.7% 4.3% 2.0% 1.0%
mozambique economic update october 2018
Redoubling efforts to raise agricultural productivity.
Gains in agriculture’s productivity, rural markets dynamism and resilience to shocks are essential for reversing the trend in inequality. The strong negative correlation between poverty and agricultural productivity makes this agenda a priority in any effort to reduce inequality. A more productive agriculture sector can also be a platform for increasing the volume of exports and diversifying into linked industries with more value-added such as processed foods and textiles.
However, agricultural growth and productivity in Mozambique are low by global and regional standards. In 2015, the average maize yield for farmers who planted maize was 836 kilograms (kg) per hectare and half of them had yields under 480 kg per hectare. This is not only low
on regional standards (as seen in Figure 37) but is also far below Mozambique’s agricultural potential. Linked to this are the low adoption rates of productivity-enhancing technologies amongst Mozambican farmers as lack of financing leads to low levels of adoption of improved seed and low usage of fertilizer, two factors that contribute to low yields. Mozambican farmers are also highly exposed to price and climate-related shocks and lack of access to credit and risk mitigation instruments. Relative isolation and high transport costs are other major barriers for farming households in accessing input and output markets and raising productivity. Increased emphasis on public investment in rural areas to strengthen irrigation, access to rural roads and to electricity would provide more enabling conditions for raising agriculture productivity and more dynamism in rural markets.
32
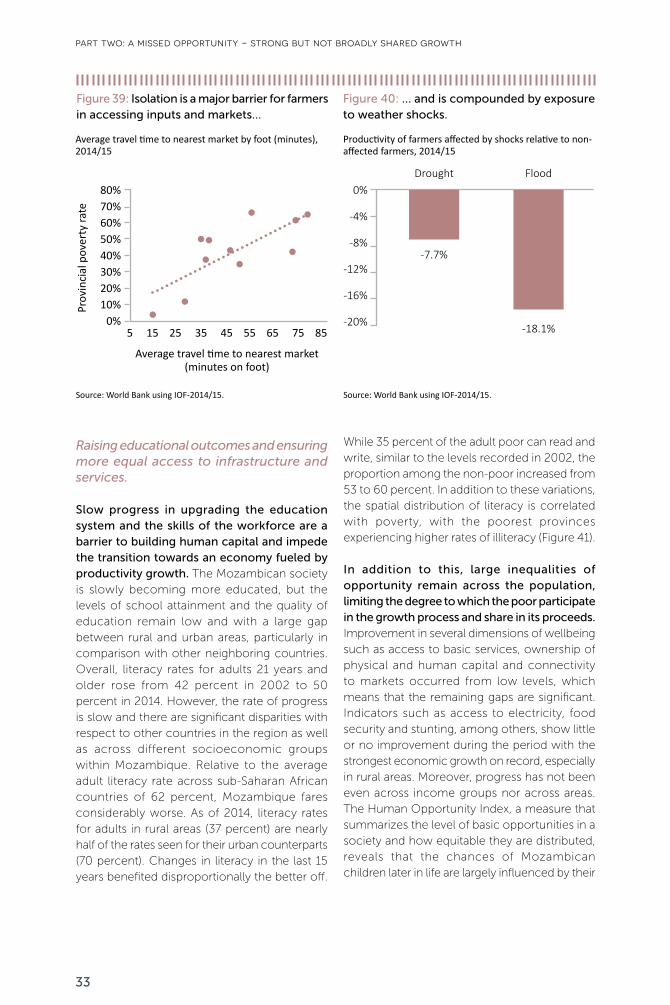
Figure 39: Isolation is a major barrier for farmers in accessing inputs and markets…
Figure 40: … and is compounded by exposure to weather shocks.
Average travel time to nearest market by foot (minutes), 2014/15
Productivity of farmers affected by shocks relative to non-affected farmers, 2014/15
80%70%60%50%40%30%20%10%
0%
Prov
inci
al p
over
ty ra
te
5 15 25 35 45 55 65 75 85
Average travel time to nearest market (minutes on foot)
-7.7%
Drought Flood
-18.1%
0%
-4%
-8%
-12%
-16%
-20%
Source: World Bank using IOF-2014/15. Source: World Bank using IOF-2014/15.
part two: a missed opportunity - strong but not broadly shared growth
Raising educational outcomes and ensuring more equal access to infrastructure and services.
Slow progress in upgrading the education system and the skills of the workforce are a barrier to building human capital and impede the transition towards an economy fueled by productivity growth. The Mozambican society is slowly becoming more educated, but the levels of school attainment and the quality of education remain low and with a large gap between rural and urban areas, particularly in comparison with other neighboring countries. Overall, literacy rates for adults 21 years and older rose from 42 percent in 2002 to 50 percent in 2014. However, the rate of progress is slow and there are significant disparities with respect to other countries in the region as well as across different socioeconomic groups within Mozambique. Relative to the average adult literacy rate across sub-Saharan African countries of 62 percent, Mozambique fares considerably worse. As of 2014, literacy rates for adults in rural areas (37 percent) are nearly half of the rates seen for their urban counterparts (70 percent). Changes in literacy in the last 15 years benefited disproportionally the better off.
While 35 percent of the adult poor can read and write, similar to the levels recorded in 2002, the proportion among the non-poor increased from 53 to 60 percent. In addition to these variations, the spatial distribution of literacy is correlated with poverty, with the poorest provinces experiencing higher rates of illiteracy (Figure 41).
In addition to this, large inequalities of opportunity remain across the population, limiting the degree to which the poor participate in the growth process and share in its proceeds. Improvement in several dimensions of wellbeing such as access to basic services, ownership of physical and human capital and connectivity to markets occurred from low levels, which means that the remaining gaps are significant. Indicators such as access to electricity, food security and stunting, among others, show little or no improvement during the period with the strongest economic growth on record, especially in rural areas. Moreover, progress has not been even across income groups nor across areas. The Human Opportunity Index, a measure that summarizes the level of basic opportunities in a society and how equitable they are distributed, reveals that the chances of Mozambican children later in life are largely influenced by their
33
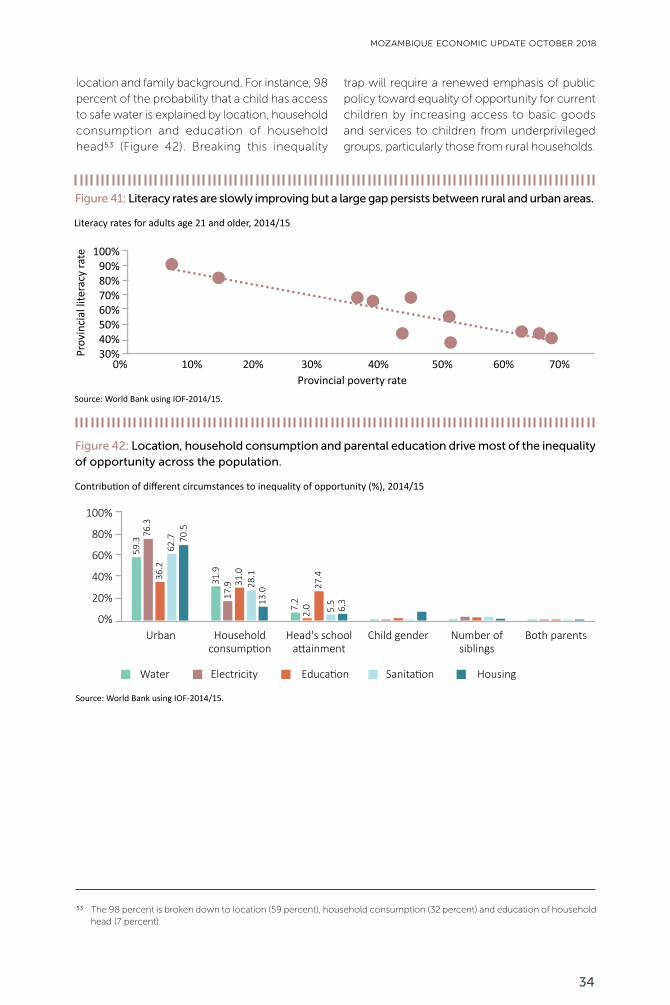
Figure 41: Literacy rates are slowly improving but a large gap persists between rural and urban areas.
Literacy rates for adults age 21 and older, 2014/15
Contribution of different circumstances to inequality of opportunity (%), 2014/15
Prov
inci
al li
tera
cy ra
te
0% 10% 20% 30% 40% 50% 60% 70%Provincial poverty rate
Source: World Bank using IOF-2014/15.
Figure 42: Location, household consumption and parental education drive most of the inequality of opportunity across the population.
Urban Household consumption
Head's school attainment
Child gender Number of siblings
Both parents
59.3
76.3
36.2
31.9
17.9 31
.028
.113
.0
7.2
2.0
27.4
5.5
6.3
62.7 70
.5
Water Electricity Education Sanitation Housing
Source: World Bank using IOF-2014/15.
100%90%80%70%60%50%40%30%
100%
80%
60%
40%
20%
0%
location and family background. For instance, 98 percent of the probability that a child has access to safe water is explained by location, household consumption and education of household head53 (Figure 42). Breaking this inequality
trap will require a renewed emphasis of public policy toward equality of opportunity for current children by increasing access to basic goods and services to children from underprivileged groups, particularly those from rural households.
mozambique economic update october 2018
The 98 percent is broken down to location (59 percent), household consumption (32 percent) and education of household head (7 percent).
53
34
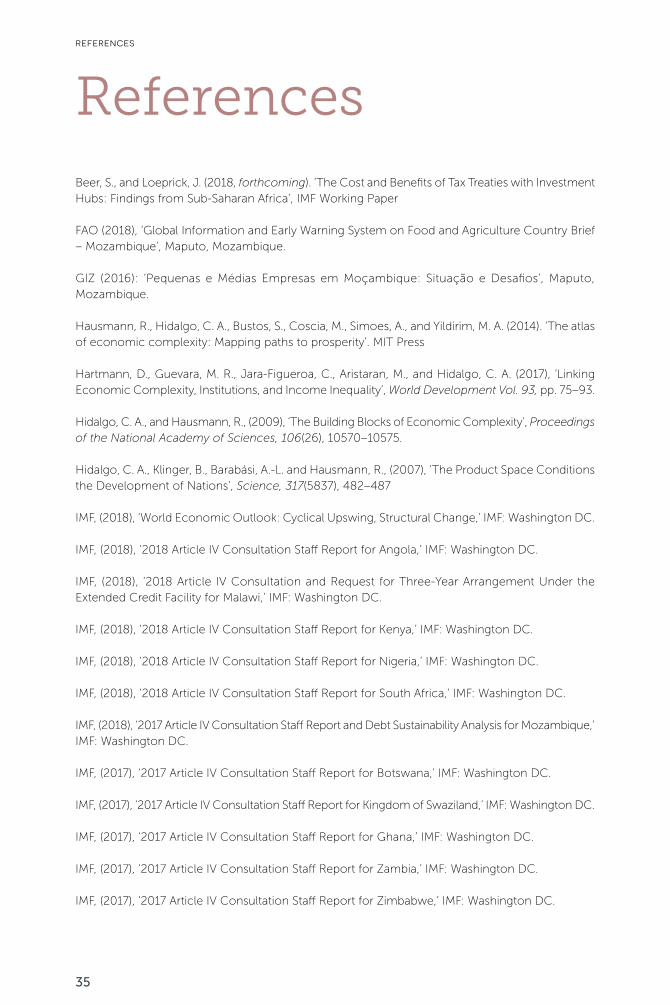
references
ReferencesBeer, S., and Loeprick, J. (2018, forthcoming). ‘The Cost and Benefits of Tax Treaties with Investment Hubs: Findings from Sub-Saharan Africa’, IMF Working Paper
FAO (2018), ‘Global Information and Early Warning System on Food and Agriculture Country Brief – Mozambique’, Maputo, Mozambique.
GIZ (2016): ‘Pequenas e Médias Empresas em Moçambique: Situação e Desafios’, Maputo, Mozambique.
Hausmann, R., Hidalgo, C. A., Bustos, S., Coscia, M., Simoes, A., and Yildirim, M. A. (2014). ‘The atlas of economic complexity: Mapping paths to prosperity’. MIT Press
Hartmann, D., Guevara, M. R., Jara-Figueroa, C., Aristaran, M., and Hidalgo, C. A. (2017), ‘Linking Economic Complexity, Institutions, and Income Inequality’, World Development Vol. 93, pp. 75–93.
Hidalgo, C. A., and Hausmann, R., (2009), ‘The Building Blocks of Economic Complexity’, Proceedings of the National Academy of Sciences, 106(26), 10570–10575.
Hidalgo, C. A., Klinger, B., Barabási, A.-L. and Hausmann, R., (2007), ‘The Product Space Conditions the Development of Nations’, Science, 317(5837), 482–487
IMF, (2018), ‘World Economic Outlook: Cyclical Upswing, Structural Change,’ IMF: Washington DC.
IMF, (2018), ‘2018 Article IV Consultation Staff Report for Angola,’ IMF: Washington DC.
IMF, (2018), ‘2018 Article IV Consultation and Request for Three-Year Arrangement Under the Extended Credit Facility for Malawi,’ IMF: Washington DC.
IMF, (2018), ‘2018 Article IV Consultation Staff Report for Kenya,’ IMF: Washington DC.
IMF, (2018), ‘2018 Article IV Consultation Staff Report for Nigeria,’ IMF: Washington DC.
IMF, (2018), ‘2018 Article IV Consultation Staff Report for South Africa,’ IMF: Washington DC.
IMF, (2018), ‘2017 Article IV Consultation Staff Report and Debt Sustainability Analysis for Mozambique,’ IMF: Washington DC.
IMF, (2017), ‘2017 Article IV Consultation Staff Report for Botswana,’ IMF: Washington DC.
IMF, (2017), ‘2017 Article IV Consultation Staff Report for Kingdom of Swaziland,’ IMF: Washington DC.
IMF, (2017), ‘2017 Article IV Consultation Staff Report for Ghana,’ IMF: Washington DC.
IMF, (2017), ‘2017 Article IV Consultation Staff Report for Zambia,’ IMF: Washington DC.
IMF, (2017), ‘2017 Article IV Consultation Staff Report for Zimbabwe,’ IMF: Washington DC.
35
mozambique economic update october 2018
IMF, (2017), ‘Regional Economic Outlook Sub-Saharan Africa: Restarting the Growth Engine,’ IMF: Washington DC.
IMF, (2014), ‘Government Finance Statistics Manual,’ IMF: Washington DC.
Lachler, U., and Walker, I., (2018), ‘Mozambique Jobs Diagnostic’, World Bank: Washington DC.
Republic of Mozambique, Central Bank of Mozambique (2018), ‘Indicadores Prudenciais e Económico-Financeiros, Anexo à Circular nº2/EFI/2017,’ Maputo, Mozambique.
Republic of Mozambique, Ministry of Economy and Finance, (2018), ‘O Estágio e Perspectivas da Economia Nacional,’ Maputo, Mozambique.
Republic of Mozambique, Central Bank of Mozambique, various quarters ‘BOP and Monetary Survey data,’ Maputo, Mozambique.
Republic of Mozambique, Central Bank of Mozambique, various months ‘Monthly Situation bulletin,’ Maputo, Mozambique.
Republic of Mozambique, Central Bank of Mozambique, various sessions ‘Monetary Policy Committee briefings,’ Maputo, Mozambique.
Republic of Mozambique, National Institute of Statistics, various years ‘National Accounts,’ Maputo, Mozambique.
Republic of Mozambique, National Institute of Statistics, various months ‘Consumer Price Index bulletin,’ Maputo, Mozambique.
Republic of Mozambique, National Institute of Statistics, various months ‘Economic Activities Index bulletin,’ Maputo, Mozambique.
Republic of Mozambique, National Institute of Statistics, various months ‘Economic Confidence Indicators bulletin,’ Maputo, Mozambique.
Republic of Mozambique, National Institute of Statistics, various quarters ‘Short-Term Industry Indicators,’ Maputo, Mozambique.
Republic of Mozambique, Ministry of Economy and Finance, (various years), ‘Audited State Accounts,’ Maputo, Mozambique.
Republic of Mozambique, Ministry of Economy and Finance, (various years), ‘State Budget,’ Maputo, Mozambique.
Republic of Mozambique, Ministry of Economy and Finance, (various years), ‘Budget Execution Report,’ Maputo, Mozambique.
36
references
Republic of Mozambique, Ministry of Economy and Finance, (various years) ‘Annual Public Debt Report,’ Maputo, Mozambique.
Vale Moçambique (2018), ‘Quarterly Performance Report’, Maputo, Mozambique
World Bank, (2018), ‘Annual Meetings Macro-Poverty Outlook, (various countries)’, World Bank: Washington DC.
World Bank, (2018), ‘Strong but not broadly shared growth. Mozambique Poverty Assessment’, World Bank: Washington DC.
World Bank, (2018), ‘Who wins and who loses with staple food price spikes? Welfare implications in Mozambique’, World Bank: Washington DC.
World Bank, (2018), ‘Distributional Impact of Fuel and Bread Subsidy Reforms’, World Bank: Washington DC.
World Bank, (2018), ‘Commodity Markets Outlook – April 2018’, World Bank: Washington DC.
World Bank, (2017), ‘Global Economic Monitor – April 2017’, World Bank: Washington DC.
World Bank, (2017), ‘Mozambique Economic Update: A Two Speed Economy’, World Bank: Washington DC.
World Bank, (2016), ‘Mozambique Economic Update: Facing Hard Choices’, World Bank: Washington DC.
World Bank, (2016), ‘Mozambique – Systematic Country Diagnostic,’ World Bank: Washington DC.
World Bank, (2016), ‘Mozambique - Public Expenditure Review: Education,’ World Bank: Washington DC.
World Bank, (2016), ‘Mozambique – Health Public Expenditure Review: 2009-2013,’ World Bank: Washington DC.
World Bank (2014), “Mozambique Public Expenditure Review: Addressing the Challenges of Today, Seizing the Opportunities of Tomorrow”, World Bank: Washington DC.
World Bank, (various years), ‘World Development Indicators,’ World Bank: Washington DC.
World Meteorological Organization, (2018), ‘El Niño / La Niña Update – September 2018’.
37