public accounts of pei, 2011 - volume 1
DESCRIPTION
Volume 1 of Public Accounts of PEI, 2011 contains the consolidated financial statements for the Province. These statements consolidate the financial statements of the Province's operating fund with the financial statements of agencies and crown corporations owned or controlled by the Province.TRANSCRIPT
Public Accountsof the Province of
Prince Edward Island
Volume I
Consolidated Financial Statements
For the Year Ended March 31st
2011


To His HonourThe Honourable H. Frank LewisLieutenant-Governor of the Province ofPrince Edward Island
May It Please Your Honour:
The undersigned has the honour to submit herewith the Public Accounts Volume 1 of the Province ofPrince Edward Island for the fiscal year ended March 31, 2011.
Respectfully submitted,
Hon. Wes SheridanMinister of Finance and Municipal Affairs
Department of Finance and Municipal AffairsCharlottetown, Prince Edward Island

To the Honourable Wes SheridanMinister of Finance and Municipal Affairs
Sir:
I have the honour to submit herewith the Public Accounts Volume 1 of the Province of Prince EdwardIsland for the fiscal year ended March 31, 2011.
Respectfully submitted,
K. Scott Stevens, C.G.A.Comptroller
Office of the ComptrollerCharlottetown, Prince Edward Island

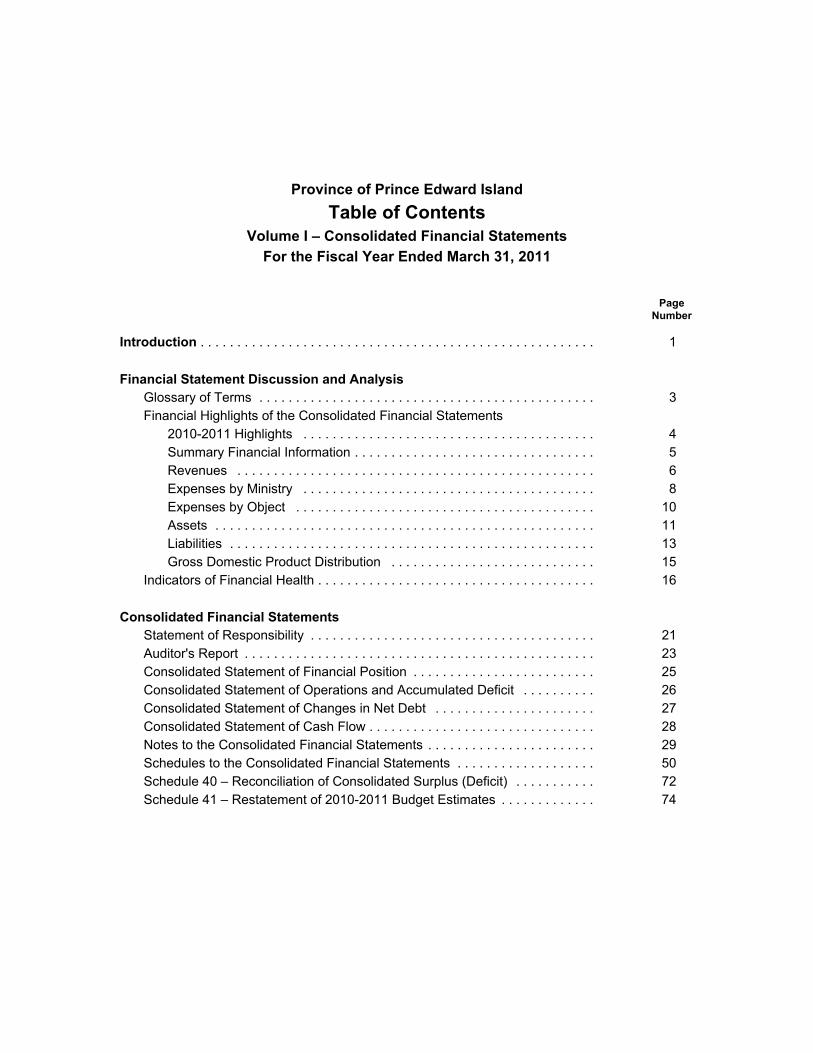
Province of Prince Edward Island
Table of ContentsVolume I – Consolidated Financial Statements
For the Fiscal Year Ended March 31, 2011
Page Number
Introduction . . . . . . . . . . . . . . . . . . . . . . . . . . . . . . . . . . . . . . . . . . . . . . . . . . . . . . 1
Financial Statement Discussion and AnalysisGlossary of Terms . . . . . . . . . . . . . . . . . . . . . . . . . . . . . . . . . . . . . . . . . . . . . . 3Financial Highlights of the Consolidated Financial Statements
2010-2011 Highlights . . . . . . . . . . . . . . . . . . . . . . . . . . . . . . . . . . . . . . . . 4Summary Financial Information . . . . . . . . . . . . . . . . . . . . . . . . . . . . . . . . . 5Revenues . . . . . . . . . . . . . . . . . . . . . . . . . . . . . . . . . . . . . . . . . . . . . . . . . 6Expenses by Ministry . . . . . . . . . . . . . . . . . . . . . . . . . . . . . . . . . . . . . . . . 8Expenses by Object . . . . . . . . . . . . . . . . . . . . . . . . . . . . . . . . . . . . . . . . . 10Assets . . . . . . . . . . . . . . . . . . . . . . . . . . . . . . . . . . . . . . . . . . . . . . . . . . . . 11Liabilities . . . . . . . . . . . . . . . . . . . . . . . . . . . . . . . . . . . . . . . . . . . . . . . . . . 13Gross Domestic Product Distribution . . . . . . . . . . . . . . . . . . . . . . . . . . . . 15
Indicators of Financial Health . . . . . . . . . . . . . . . . . . . . . . . . . . . . . . . . . . . . . . 16
Consolidated Financial StatementsStatement of Responsibility . . . . . . . . . . . . . . . . . . . . . . . . . . . . . . . . . . . . . . . 21Auditor's Report . . . . . . . . . . . . . . . . . . . . . . . . . . . . . . . . . . . . . . . . . . . . . . . . 23Consolidated Statement of Financial Position . . . . . . . . . . . . . . . . . . . . . . . . . 25Consolidated Statement of Operations and Accumulated Deficit . . . . . . . . . . 26Consolidated Statement of Changes in Net Debt . . . . . . . . . . . . . . . . . . . . . . 27Consolidated Statement of Cash Flow . . . . . . . . . . . . . . . . . . . . . . . . . . . . . . . 28Notes to the Consolidated Financial Statements . . . . . . . . . . . . . . . . . . . . . . . 29Schedules to the Consolidated Financial Statements . . . . . . . . . . . . . . . . . . . 50Schedule 40 – Reconciliation of Consolidated Surplus (Deficit) . . . . . . . . . . . 72Schedule 41 – Restatement of 2010-2011 Budget Estimates . . . . . . . . . . . . . 74

CONSOLIDATED FINANCIAL STATEMENTS 2010-2011 1
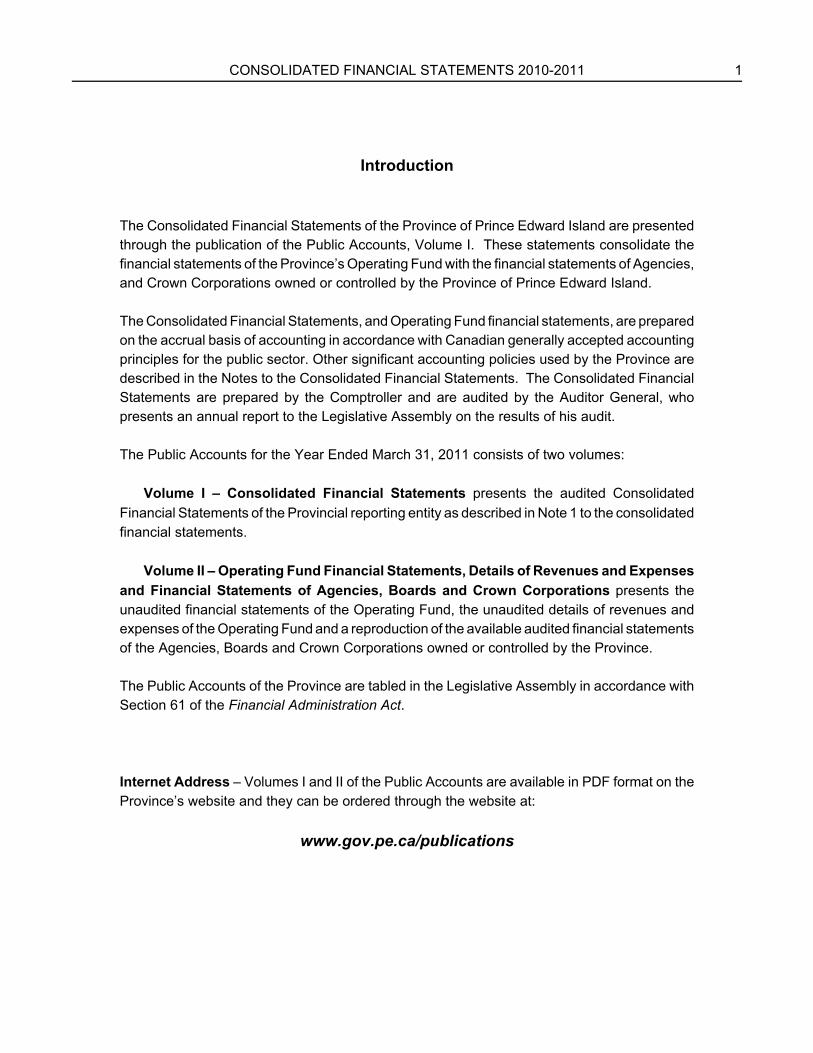
Introduction
The Consolidated Financial Statements of the Province of Prince Edward Island are presentedthrough the publication of the Public Accounts, Volume I. These statements consolidate thefinancial statements of the Province’s Operating Fund with the financial statements of Agencies,and Crown Corporations owned or controlled by the Province of Prince Edward Island.
The Consolidated Financial Statements, and Operating Fund financial statements, are preparedon the accrual basis of accounting in accordance with Canadian generally accepted accountingprinciples for the public sector. Other significant accounting policies used by the Province aredescribed in the Notes to the Consolidated Financial Statements. The Consolidated FinancialStatements are prepared by the Comptroller and are audited by the Auditor General, whopresents an annual report to the Legislative Assembly on the results of his audit.
The Public Accounts for the Year Ended March 31, 2011 consists of two volumes:
Volume I – Consolidated Financial Statements presents the audited Consolidated
Financial Statements of the Provincial reporting entity as described in Note 1 to the consolidatedfinancial statements.
Volume II – Operating Fund Financial Statements, Details of Revenues and Expenses
and Financial Statements of Agencies, Boards and Crown Corporations presents theunaudited financial statements of the Operating Fund, the unaudited details of revenues andexpenses of the Operating Fund and a reproduction of the available audited financial statementsof the Agencies, Boards and Crown Corporations owned or controlled by the Province.
The Public Accounts of the Province are tabled in the Legislative Assembly in accordance withSection 61 of the Financial Administration Act.
Internet Address – Volumes I and II of the Public Accounts are available in PDF format on theProvince’s website and they can be ordered through the website at:
www.gov.pe.ca/publications

CONSOLIDATED FINANCIAL STATEMENTS 2010-2011 3
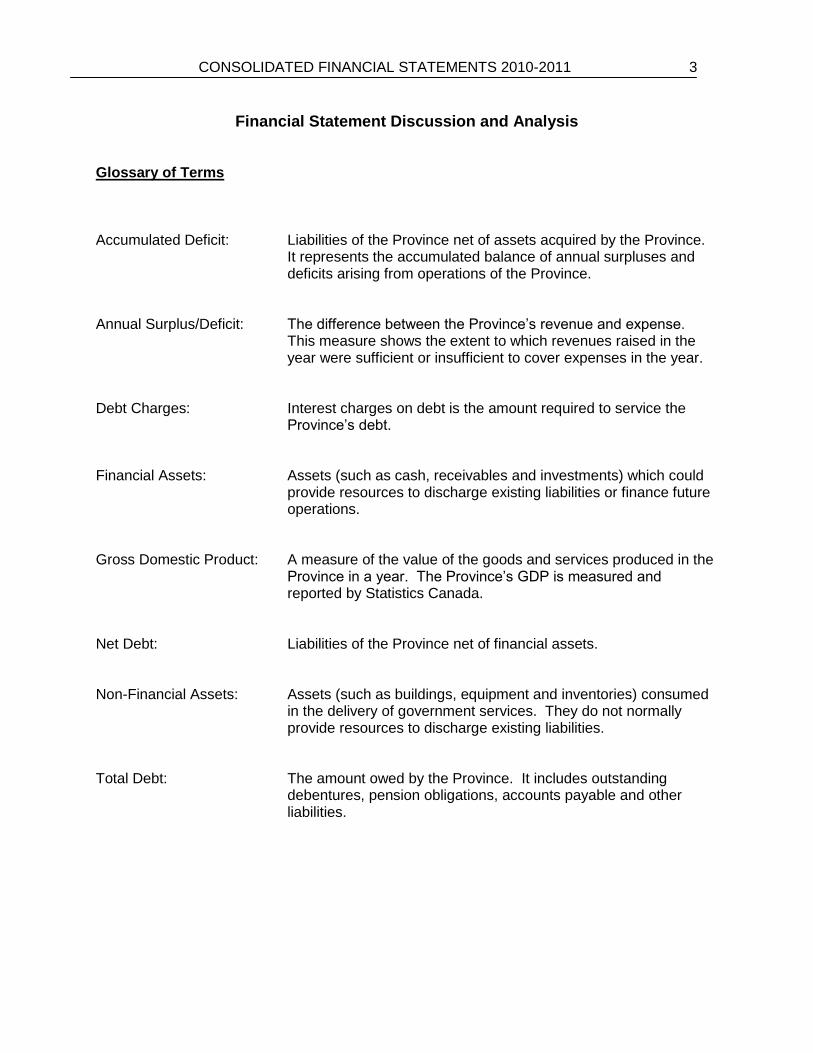
Financial Statement Discussion and Analysis Glossary of Terms Accumulated Deficit: Liabilities of the Province net of assets acquired by the Province.
It represents the accumulated balance of annual surpluses and deficits arising from operations of the Province.
Annual Surplus/Deficit: The difference between the Province’s revenue and expense.
This measure shows the extent to which revenues raised in the year were sufficient or insufficient to cover expenses in the year.
Debt Charges: Interest charges on debt is the amount required to service the
Province’s debt. Financial Assets: Assets (such as cash, receivables and investments) which could
provide resources to discharge existing liabilities or finance future operations.
Gross Domestic Product: A measure of the value of the goods and services produced in the
Province in a year. The Province’s GDP is measured and reported by Statistics Canada.
Net Debt: Liabilities of the Province net of financial assets. Non-Financial Assets: Assets (such as buildings, equipment and inventories) consumed
in the delivery of government services. They do not normally provide resources to discharge existing liabilities.
Total Debt: The amount owed by the Province. It includes outstanding
debentures, pension obligations, accounts payable and other liabilities.
4 CONSOLIDATED FINANCIAL STATEMENTS 2010-2011
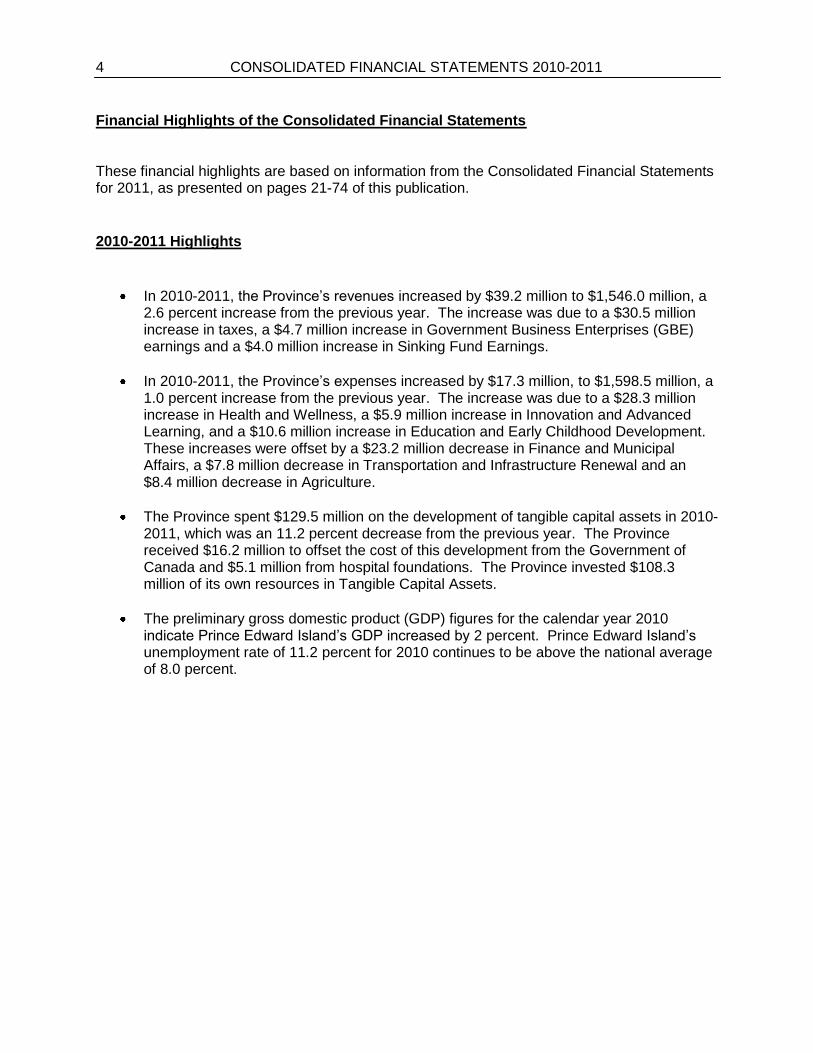
Financial Highlights of the Consolidated Financial Statements These financial highlights are based on information from the Consolidated Financial Statements for 2011, as presented on pages 21-74 of this publication.
2010-2011 Highlights
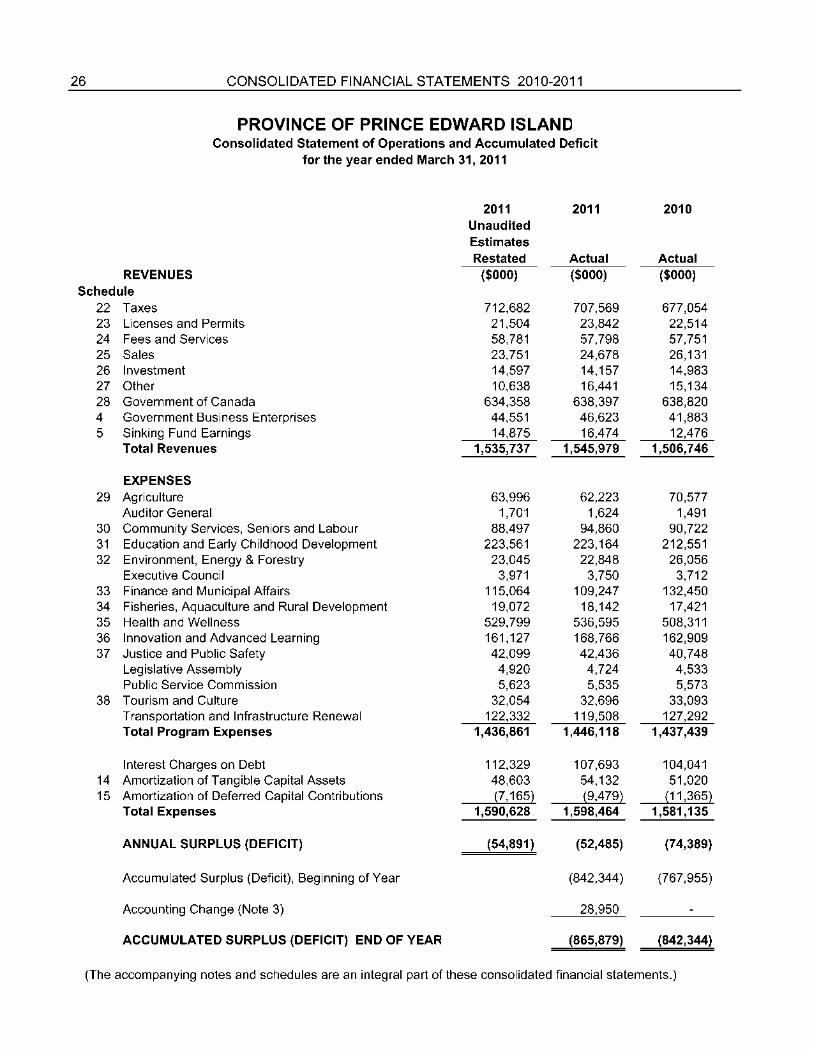
In 2010-2011, the Province’s revenues increased by $39.2 million to $1,546.0 million, a 2.6 percent increase from the previous year. The increase was due to a $30.5 million increase in taxes, a $4.7 million increase in Government Business Enterprises (GBE) earnings and a $4.0 million increase in Sinking Fund Earnings.
In 2010-2011, the Province’s expenses increased by $17.3 million, to $1,598.5 million, a 1.0 percent increase from the previous year. The increase was due to a $28.3 million increase in Health and Wellness, a $5.9 million increase in Innovation and Advanced Learning, and a $10.6 million increase in Education and Early Childhood Development. These increases were offset by a $23.2 million decrease in Finance and Municipal Affairs, a $7.8 million decrease in Transportation and Infrastructure Renewal and an $8.4 million decrease in Agriculture.
The Province spent $129.5 million on the development of tangible capital assets in 2010-2011, which was an 11.2 percent decrease from the previous year. The Province received $16.2 million to offset the cost of this development from the Government of Canada and $5.1 million from hospital foundations. The Province invested $108.3 million of its own resources in Tangible Capital Assets.
The preliminary gross domestic product (GDP) figures for the calendar year 2010 indicate Prince Edward Island’s GDP increased by 2 percent. Prince Edward Island’s unemployment rate of 11.2 percent for 2010 continues to be above the national average of 8.0 percent.
CONSOLIDATED FINANCIAL STATEMENTS 2010-2011 5
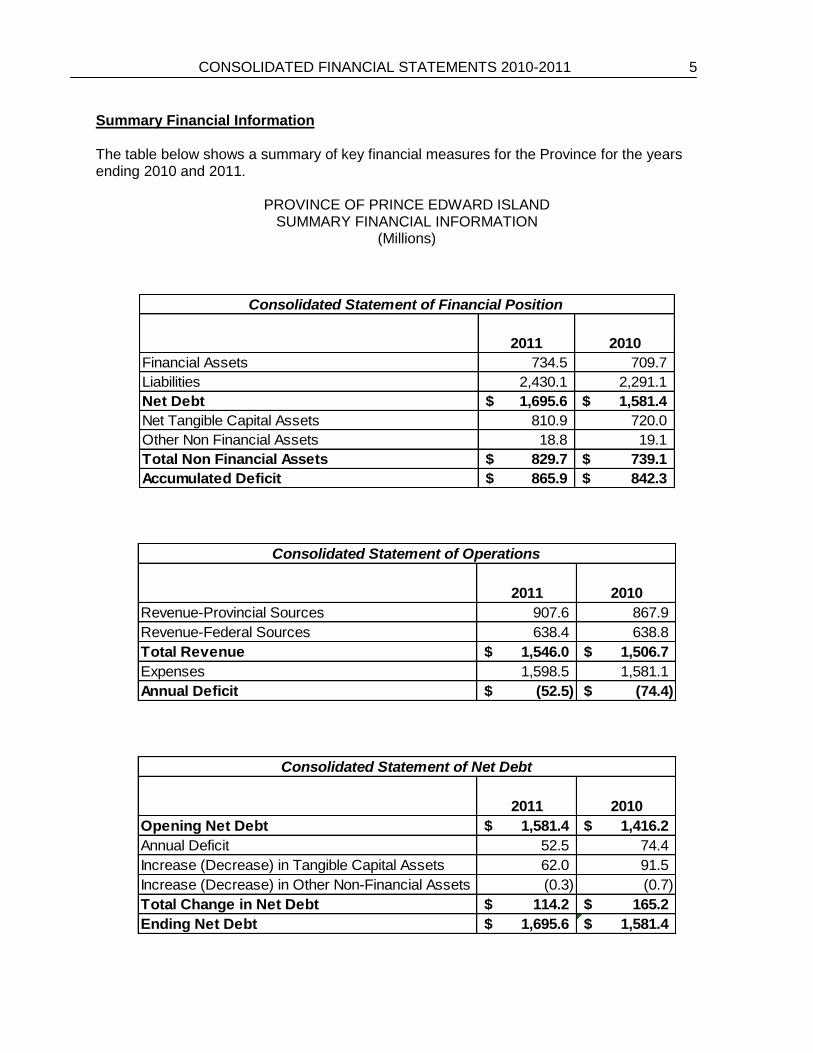
Summary Financial Information The table below shows a summary of key financial measures for the Province for the years ending 2010 and 2011.
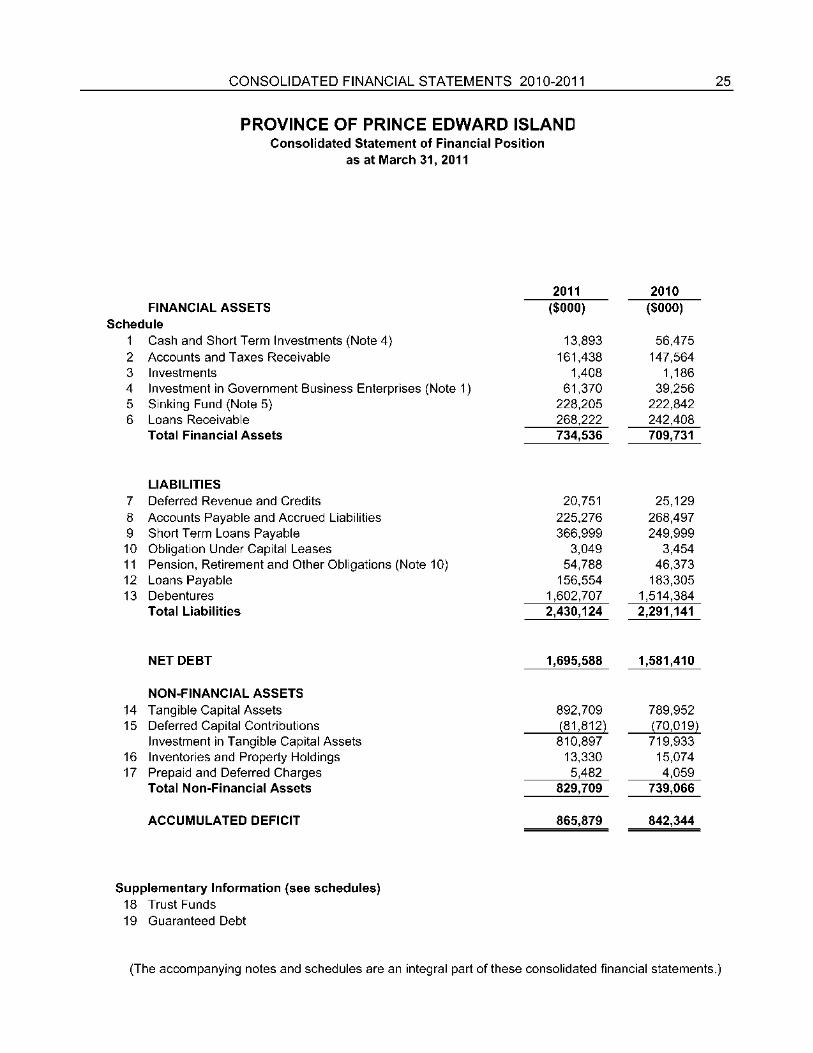
PROVINCE OF PRINCE EDWARD ISLAND SUMMARY FINANCIAL INFORMATION
(Millions)
2011 2010
Financial Assets 734.5 709.7
Liabilities 2,430.1 2,291.1
Net Debt 1,695.6$ 1,581.4$
Net Tangible Capital Assets 810.9 720.0
Other Non Financial Assets 18.8 19.1
Total Non Financial Assets 829.7$ 739.1$
Accumulated Deficit 865.9$ 842.3$
Consolidated Statement of Financial Position
2011 2010
Revenue-Provincial Sources 907.6 867.9
Revenue-Federal Sources 638.4 638.8
Total Revenue 1,546.0$ 1,506.7$
Expenses 1,598.5 1,581.1
Annual Deficit (52.5)$ (74.4)$
Consolidated Statement of Operations
2011 2010
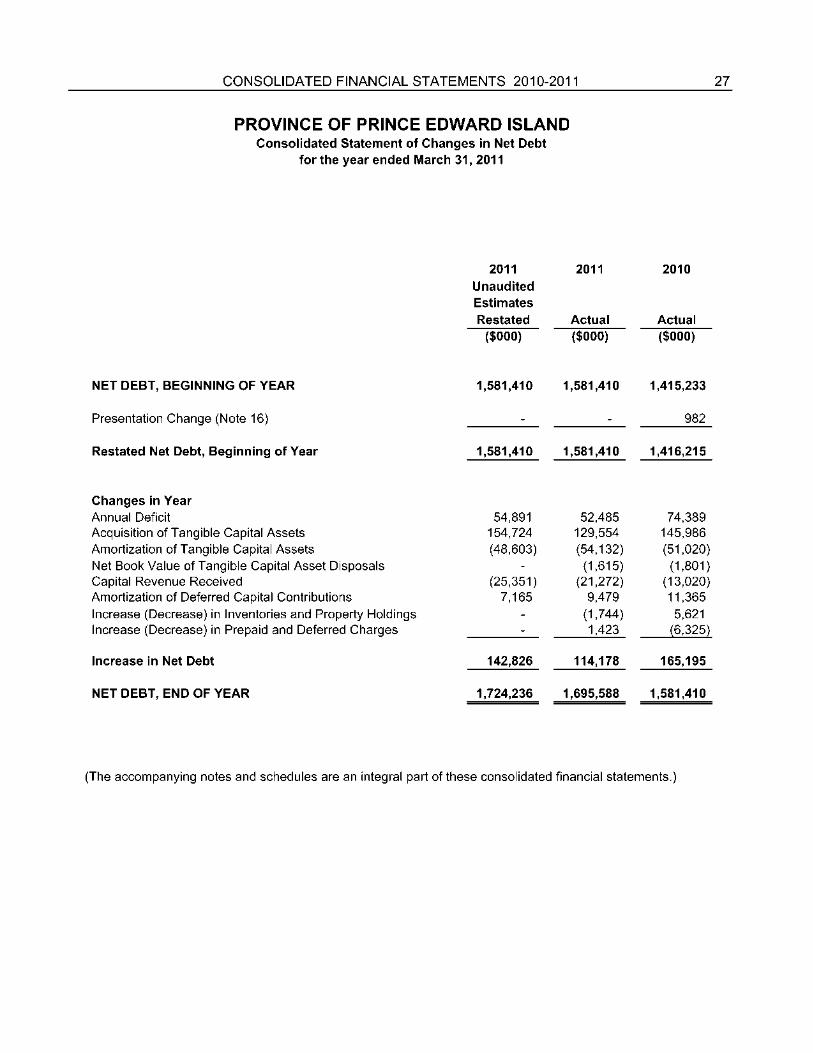
Opening Net Debt 1,581.4$ 1,416.2$
Annual Deficit 52.5 74.4
Increase (Decrease) in Tangible Capital Assets 62.0 91.5
Increase (Decrease) in Other Non-Financial Assets (0.3) (0.7)
Total Change in Net Debt 114.2$ 165.2$
Ending Net Debt 1,695.6$ 1,581.4$
Consolidated Statement of Net Debt
6 CONSOLIDATED FINANCIAL STATEMENTS 2010-2011
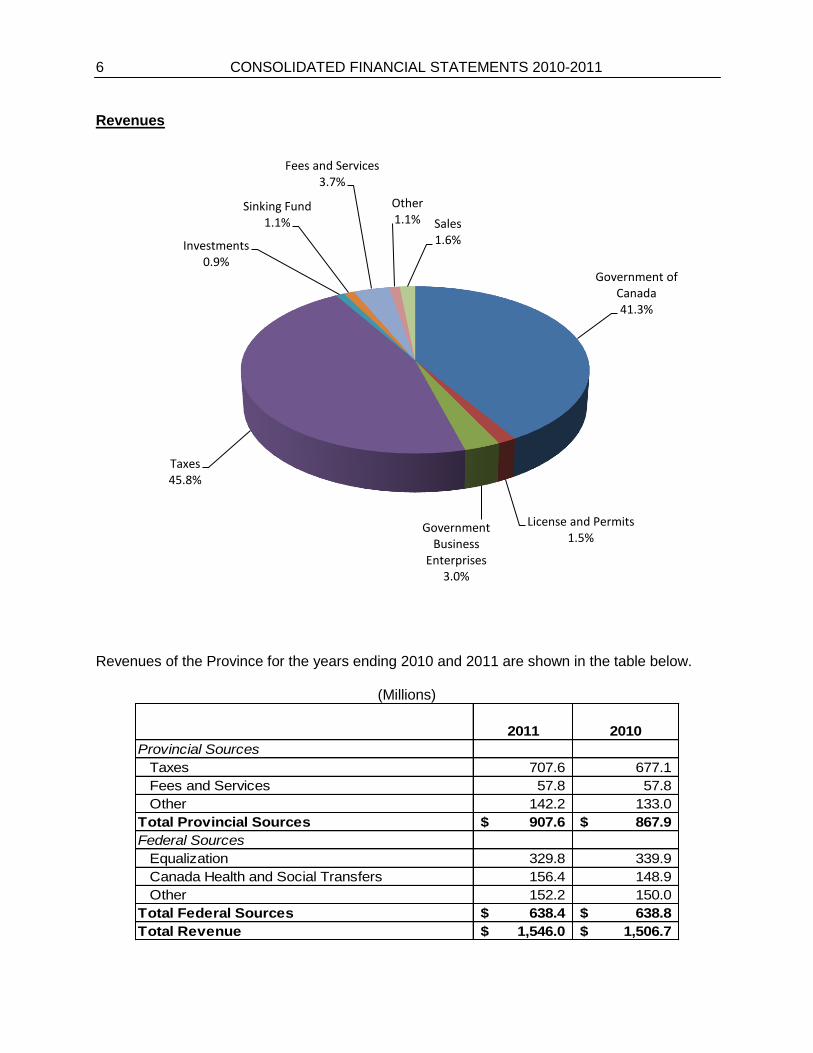
Revenues
Revenues of the Province for the years ending 2010 and 2011 are shown in the table below.
(Millions)
2011 2010
Provincial Sources
Taxes 707.6 677.1
Fees and Services 57.8 57.8
Other 142.2 133.0
Total Provincial Sources 907.6$ 867.9$
Federal Sources
Equalization 329.8 339.9
Canada Health and Social Transfers 156.4 148.9
Other 152.2 150.0
Total Federal Sources 638.4$ 638.8$
Total Revenue 1,546.0$ 1,506.7$
Government of Canada41.3%
License and Permits1.5%
Government Business
Enterprises3.0%
Taxes45.8%
Investments0.9%
Sinking Fund1.1%
Fees and Services3.7%
Other1.1% Sales
1.6%
CONSOLIDATED FINANCIAL STATEMENTS 2010-2011 7
Total revenue for the Province in 2010-2011 was $1,546.0 million, an increase of $39.2 million over the previous year. Explanations of the major variances are below.
Taxes Taxes increased by $30.5 million over the previous year, due to:
Personal Income Taxes increased by $14.0 million due to rises in employment and personal incomes in the province,
Corporate Income Taxes increased by $6.1 million due to a rise in corporate profits. The small business tax rate was reduced by 1.1 percentage points, and
Real Property Tax increased $4.6 million as a result of increased assessments on non-residential properties and an increase in the total value of residential properties.
Government of Canada Government of Canada decreased by $0.4 million due to:
Equalization declined by $10.1 million due to combined effects of the artificial ceiling on the total amount of the Equalization program and the province of Ontario qualifying for a significantly larger entitlement in 2010-11. The increase in Ontario’s entitlement was financed through reductions in other province’s entitlements. The combined impacts reduced P.E.I.’s Equalization by $27 million from what it would have otherwise been,
Canada Health Transfer increased by $6.0 million which reflects the annual escalator for the program’s funding,
Canada Eco-Trust for Clean Air and Climate Change decreased by $5.0 million due to the fact that 2009-10 was the final year of the scheduled revenue for this program,
Labour Market Agreement increased by $10.3 million. Devolution of these programs from the Government of Canada to the Province occurred in October 2009. The 2009-10 funding represented a partial year under the Labour Market Development Agreement and Labour Market Agreement. In 2010-11, funding for a full year was provided under these agreements. The increase in revenues is offset by increases in program expenditures.
Government Business Enterprises Revenue from Government Business Enterprises increased by $4.7 million due primarily to the following 2010-11 financial results:
Island Investment Dev. Inc. $18.7 million (2010 - $11.3 million)- Increase of $7.4 million,
P.E.I. Energy Corporation $3.1 million (2010- $4.9 million)- Decrease of $1.8 million,
P.E.I. Lotteries Commission $9.3 million (2010- $10.5 million)- Decrease of $1.2 million.
8 CONSOLIDATED FINANCIAL STATEMENTS 2010-2011
Expenses by Ministry
Expenses for the Province for the years ending 2010 and 2011 are shown in the table below.
(Millions)
2011 2010
Expenses
Program Expenses 1,446.1$ 1,437.4$
Interest Charges on Debt 107.7 104.0
Amortization (Net of Capital Contributions) 44.7 39.7
Total 1,598.5$ 1,581.1$
Total expenses for the Province in 2010-11 were $1,598.5 million, an increase of $17.3 million over the prior year. Explanations of the major variances are described below.
Agriculture 3.9%Justice and Public
Safety 2.7%
Community Services, Seniors and Labour 5.9%
Education and Early Childhood
Development 14.0%
Tourism and Culture 2.0%
Environment, Energy and Forestry
1.4%
Health and Wellness 33.6%
Fisheries, Aquaculture and
Rural Development 1.1%
Finance and Municipal Affairs
6.8%
Other 1.0%
Innovation and Advanced Learning
10.6%
Transportation and Infrastructure Renewal 7.5%
Interest Charges on Debt 6.7%
Amortization of Tangible Capital
Assets 2.8%
CONSOLIDATED FINANCIAL STATEMENTS 2010-2011 9
Department of Agriculture Expenses decreased by $8.4 million due to:
Agricultural Insurance Corporation paid $9.7 million fewer indemnities to producers as a result of improved crops during the 2010 growing season. This was offset by higher administrative costs.
Department of Education and Early Childhood Development Expenses increased by $10.6 million due primarily to increases in salaries and benefits.
Department of Finance and Municipal Affairs Expenses decreased by $23.2 million due to:
Employee Benefits expenditures decreased by $21.7 million as a result of the change in
government pension obligations and worker’s compensation coverage changing from
self-insured to premium-based coverage (see Note 10 (c) ).
Department of Health and Wellness Expenses increased by $28.3 million due to:
Increase in salaries of $15.9 million attributable to collective agreements and new health initiatives,
Increase in materials, supplies and services of $5.1 million as a result of increased costs for medical and surgical supplies, utilities, laboratory supplies, food and drugs, and
Increase of $5.6 million in subsidies for provincial drug programs, ambulance services and private nursing homes.
Department of Innovation and Advanced Learning Expenses increased by $5.9 million due to:
Increase of $14.5 million for post secondary grants and SkillsPEI program expenditures. Devolution of these programs from the Government of Canada to the Province occurred in October 2009. The 2009-10 programs represented a partial year under the Labour Market Development Agreement and Labour Market Agreement. In 2010-11, expenditures for a full year were incurred under these agreements. The increase in program expenditures is partially offset by increases in federal revenues.
Department of Transportation and Infrastructure Renewal Expenses decreased by $7.8 million due to:
Decrease in infrastructure expenditures.
10 CONSOLIDATED FINANCIAL STATEMENTS 2010-2011
Expenses by Object
Total expenses for the Province in 2010-11 were $1,598.5 million, an increase of $17.3 million over the previous year. Increases were mainly in Salaries and Benefits of $20.5 million and Administration of $7.1 million. These increases were offset by decreases in Interest on Unfunded Employee Future Benefits of $11.8 million and Professional and Contract Services of $8.6 million.
Administration 2.7%
Amortization of Tangible Capital
Assets 2.8%Debt - Interest Charges 6.7%
Debt - Provisions and Other 0.6%
Transfer Payments 23.0%
Debt- Interest on Unfunded
Employee Future Benefits 1.3%
Travel and Training 0.7%Professional and
Contract Services 12.5%
Salaries and Benefits 41.2%
Materials and Supplies 8.5%
CONSOLIDATED FINANCIAL STATEMENTS 2010-2011 11
Assets Financial Assets Financial Assets at March 31, 2011 consist of the following:
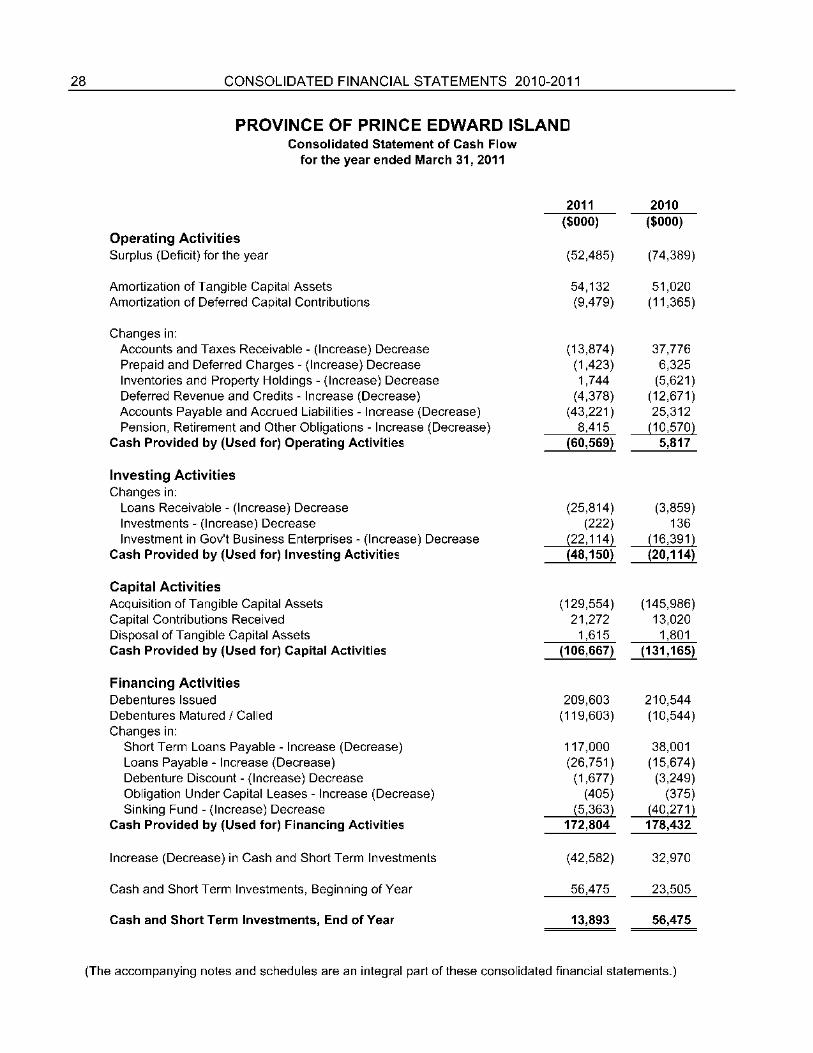
Total financial assets held by the Province at March 31, 2011 were $734.5 million, an increase of $24.8 million over the previous year. Explanations of the major variances are below. Cash and Short Term Investments Cash and Short Term Investments decreased by $42.6 million due to:
Operating Fund cash decreased by $37.1 million, and
Consolidated Agencies and Crown Corporations decreased by $5.5 million.
Cash 1.9%
Accounts and Taxes Receivable 22.0%
Sinking Fund 31.1%
Loans Receivable 36.4%
Investment in GBEs 8.4%
Investments 0.2%
12 CONSOLIDATED FINANCIAL STATEMENTS 2010-2011
Accounts and Taxes Receivable Accounts and Taxes Receivable increased by $13.9 million due to:
Receivables from the Government of Canada increased by $9.5 million,
Other Receivables increased by $6.0 million,
Taxes Receivable increased by $4.9 million, and
Receivables from agencies and crown corporations decreased by $4.1 million. Government Business Enterprises Investment in Government Business Enterprises increased by $22.1 million due to surpluses from the following:
Island Investment Development Inc. $18.7 million, and
P.E.I. Energy Corporation $3.1 million. Sinking Fund The Province’s Sinking Fund increased by $5.4 million. Sinking Fund earnings were $16.5 million for the year, $11.1 million of which was used to redeem debentures.
Loans Receivable Loans Receivable increased $25.8 million due to:
Mortgages and Loans due to P.E.I. Lending Agency increased by $18.9 million,
Student loans assumed during the year by the P.E.I. Student Financial Assistance Corporation were $25.6 million,
Mortgages and Loans due to Innovation PEI decreased by $6.7 million, and
An increase of $6.1 million in Provision for Doubtful Accounts reduced Loans Receivable.
Non-Financial Assets Tangible Capital Assets account for 98 percent of Non-Financial Assets. In 2010-11, the Province made the following investment in Tangible Capital Assets:
(Millions)
Opening Balance, April 1, 2010 790.0$
Add: Investment during the year 129.5
Adjustment to land values 28.9
Less: Disposal and write-downs (1.6)
Amortization (54.1)
Ending Balance, March 31, 2011 892.7$
Of the $129.5 million invested in Tangible Capital Assets during the year, $54.7 million was on roads and bridges, $41.6 million was on buildings and $20.2 million was on equipment.
CONSOLIDATED FINANCIAL STATEMENTS 2010-2011 13
Liabilities Liabilities at March 31, 2011 consist of the following:
Total Liabilities held by the Province at March 31, 2011 were $2,430.1 million, an increase of $139.0 million over the previous year. Explanations of the major variances are below. Accounts Payable and Accrued Liabilities Accounts Payable and Accrued Liabiliies decreased by $43.2 million due to:
Goods and Services Payable decreased by $26.7 million,
Goods and Services Payable by Consolidated Agencies and Crown Corporations decreased by $5.3 million, and
Wage and Benefits Payable decreased by $4.5 million.
Accounts Payable and Accrued
Liabilities 9.3%
Other 1.0%Pension,
Retirement and Other Obligations
2.2%
Short Term Loans Payable 15.1%
Loans Payable 6.4%Debentures 66.0%
14 CONSOLIDATED FINANCIAL STATEMENTS 2010-2011
Short Term Loans Payable Short Term Loans Payable increased by $117.0 million due to:
Treasury Notes Payable held by the Operating Fund increased by $125.0 million, and
Short Term Notes Payable held by Innovation PEI decreased by $8.0 million.
Pension, Retirement and Other Obligations
The amounts due for future employee benefits increased by $8.4 million. Notes 10 (b) and 10 (c) provide detailed information on these liability balances at March 31, 2011.
Loans Payable Loans Payable decreased by $26.8 million due primarily to payments on the following:
Loan Payable to the Teacher’s Superannuation Fund of $16.0 million, and
Loan Payable to the Civil Service Superannuation Fund of $5.2 million.
Debentures Debentures increased by $88.3 million. Schedule 21 provides details of debentures issued and matured. Debentures issued were $90.0 million higher than those matured. An increase in debenture discounts of $1.7 million offset the overall increase.
CONSOLIDATED FINANCIAL STATEMENTS 2010-2011 15
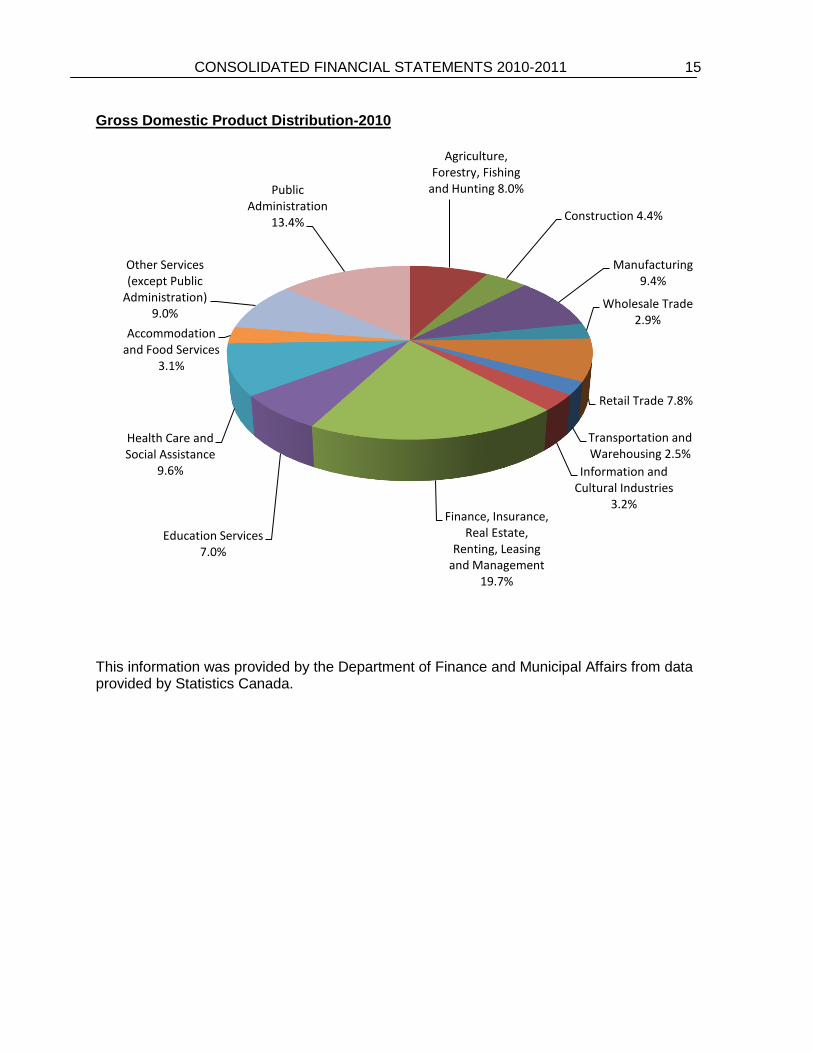
Gross Domestic Product Distribution-2010
This information was provided by the Department of Finance and Municipal Affairs from data provided by Statistics Canada.
Agriculture, Forestry, Fishing
and Hunting 8.0%
Construction 4.4%
Manufacturing 9.4%
Wholesale Trade 2.9%
Retail Trade 7.8%
Transportation and Warehousing 2.5%
Information and Cultural Industries
3.2%Finance, Insurance,
Real Estate, Renting, Leasing
and Management 19.7%
Education Services 7.0%
Health Care and Social Assistance
9.6%
Accommodation and Food Services
3.1%
Other Services (except Public
Administration) 9.0%
Public Administration
13.4%
16 CONSOLIDATED FINANCIAL STATEMENTS 2010-2011
Indicators of Financial Health
This section provides indicators of the Province’s financial condition and follows Canadian Institute of Chartered Accountants (CICA) guidelines, using information provided in the Province’s consolidated financial statements as well as other standard socio-economic indicators such as nominal Gross Domestic Product (GDP) data from Statistics Canada. The analysis provides results in a manner that improves transparency and provides a clearer understanding of recent trends in the Province’s financial health. Trends over the last five years are evaluated using sustainability, flexibility and vulnerability criteria established by the CICA. Though many potential indicators are available, those found to be the most relevant, measurable and transparent to users of government financial information are included. Similar data series are also widely used by banks and other financial institutions, investors and credit-rating agencies. In evaluating a government’s financial health, it should be acknowledged that governments have exposure to a number of variables that are beyond their direct scope of control, but still can exert major influences on financial results and indicators. These include but are not limited to:
• Changing global economic conditions such as energy prices, commodity prices, investment valuation and inflation,
• Changes to international financial conditions that impact interest rates, currency fluctuations or availability of credit,
• Changes to federal transfers or programs, • Emergencies such as floods, forest fires and pandemics, and • Developments affecting agencies that are reflected on the province’s books.
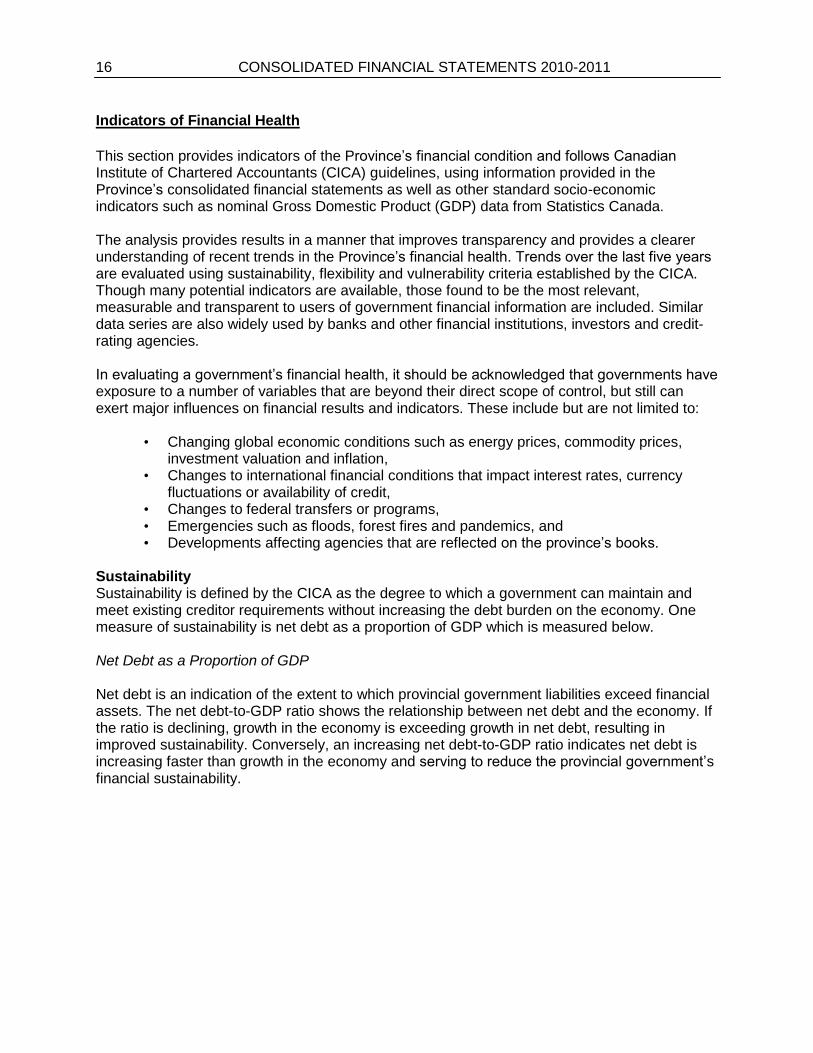
Sustainability Sustainability is defined by the CICA as the degree to which a government can maintain and meet existing creditor requirements without increasing the debt burden on the economy. One measure of sustainability is net debt as a proportion of GDP which is measured below. Net Debt as a Proportion of GDP Net debt is an indication of the extent to which provincial government liabilities exceed financial assets. The net debt-to-GDP ratio shows the relationship between net debt and the economy. If the ratio is declining, growth in the economy is exceeding growth in net debt, resulting in improved sustainability. Conversely, an increasing net debt-to-GDP ratio indicates net debt is increasing faster than growth in the economy and serving to reduce the provincial government’s financial sustainability.
CONSOLIDATED FINANCIAL STATEMENTS 2010-2011 17
Net Debt as a Percentage of GDP
The net debt to GDP ratio has increased over the last five years. The increase in the last two years is due to an acceleration of capital expenditures and deficits that were incurred as part of stimulus actions to support the economy during the global economic and financial downturn. Flexibility Flexibility is defined as the degree to which a government can increase its financial resources to respond to its commitments. One measure of flexibility is the cost of debt as a percentage of total revenue. Debt service costs as a proportion of total revenue is an indicator of the province’s ability to satisfy existing credit requirements in the context of the government’s overall revenue. Debt service costs can be impacted by variables outside the direct control of government, such as credit ratings, interest rates, financial markets and currency fluctuations. Investment in public infrastructure resulting in a change in the amount of debt can also influence borrowing requirements.
25.0%
27.0%
29.0%
31.0%
33.0%
35.0%
37.0%
39.0%
2006-07 2007-08 2008-09 2009-10 2010-11
30.4%
29.7%
30.4%
33.3%
34.9%
18 CONSOLIDATED FINANCIAL STATEMENTS 2010-2011
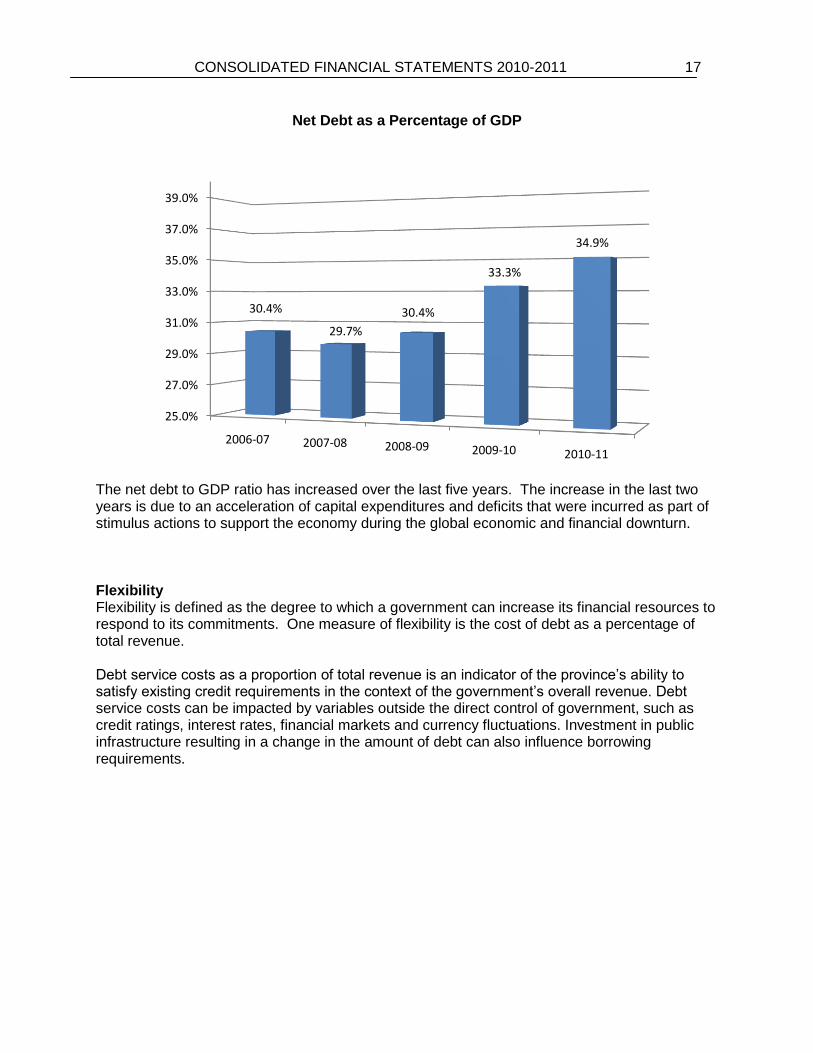
Interest Costs as a Percentage of Revenue
The Province’s proportion of debt service costs to revenue declined steadily over the past five years. The decline is primarily the result of lower interest rates as the stock of interest bearing debt increased by 24 percent compared to total revenue growth of 26 percent over the period. A decrease in this ratio indicates that debt service costs are a smaller financial burden on the Provinces finances, allowing for a greater proportion of financial resources to provide public programs and services. Vulnerability Vulnerability is defined as the degree to which a government becomes dependent on, and therefore vulnerable to, sources of funding outside its control or influence, both domestic and international. A common measurement of vulnerability is federal government transfers as a proportion of revenue. Revenue from federal sources is comprised of conditional and unconditional grants from the federal government, including:
• Fiscal Equalization Program payments, • The Canada Health Transfer and the Canada Social Transfer, and • Conditional grants or capital revenue in support of economic development,
infrastructure, education and labour training and other areas. Federal transfer payments can be affected by both federal fiscal policy decisions, as well as the normal annual estimate process that guides federal payments under the Equalization Program and Canada Health and Social Transfers. Both of these factors can contribute to year-to-year changes in the level of transfers.
0.0%
2.0%
4.0%
6.0%
8.0%
10.0%
12.0%
2006-07 2007-08 2008-09 2009-10 2010-11
9.8% 9.1%
7.8%
6.9% 7.0%
CONSOLIDATED FINANCIAL STATEMENTS 2010-2011 19
Comparing the level of federal transfers to total revenue provides an indication of the vulnerability of the Province. Generally, if the ratio is increasing, the Province is increasingly reliant on federal transfers, resulting in increased vulnerability. If the ratio is declining, vulnerability is diminished.
Federal Government Transfers as a Proportion of Total Revenue
The dependence of the Province on federal revenues has increased from 38.6 percent in 2007 to 41.3 percent in 2011. The increased dependency from 2006-07 to 2009-10 was due to rises in federal revenues that outpaced rises in provincial revenues. The decline in dependency in 2010-11 was a result of a $0.4 million decline in total federal revenues and a $39.7 million increase in provincial source revenues.
35.0%
37.0%
39.0%
41.0%
43.0%
45.0%
2006-07 2007-08 2008-09 2009-10 2010-11
38.6%
39.8% 40.1%
42.2%
41.3%

CONSOLIDATED FINANCIAL STATEMENTS 2010-2011 21
Government of the Province of Prince Edward Island
Statement of Responsibility
Responsibility for the integrity, objectivity and fair presentation of the consolidated financialstatements of the Province of Prince Edward Island rests with the Government. The financialstatements are prepared by the Comptroller in accordance with the stated accounting policiesof the Government as described in Note 2 of the consolidated financial statements.
These financial statements include a Consolidated Statement of Financial Position, aConsolidated Statement of Operations and Accumulated Deficit, a Consolidated Statement ofChanges in Net Debt, a Consolidated Statement of Cash Flow and notes and schedules integralto the statements. Together, they present fairly, in all material respects the Province's financialposition at the fiscal year-end and results of operations for the year ended March 31, 2011. Moredetailed information regarding the Province's financial position and operating results can befound in other sections of either Volume I or Volume II.
The Government is responsible for maintaining a system of internal accounting andadministrative controls in order to provide reasonable assurance that transactions areappropriately authorized, assets are safeguarded and financial records are properly maintained.
On behalf of the Government
Hon. Wes SheridanMinister of Finance and Municipal Affairs
August 2011

CONSOLIDATED FINANCIAL STATEMENTS 2010-2011 23

CONSOLIDATED FINANCIAL STATEMENTS 2010-2011 29
PROVINCE OF PRINCE EDWARD ISLAND
Notes to the Consolidated Financial Statements As at March 31, 2011
1 Reporting Entity The financial position of the Province is presented by a Consolidated Statement of Financial Position combining the Statement of Financial Position of the Operating Fund and the balance sheets of such agencies, crown corporations and boards as determined under Section 61 (2) of the Financial Administration Act.
The following agencies, crown corporations and boards are included in the Consolidated Statement of Financial Position using the consolidation method of accounting. Under the consolidation method of accounting inter-organizational balances and transactions are eliminated. This method reports the organizations as if they were one organization.
Eastern School District P.E.I. Aquaculture and Fisheries Research Initiative Inc. French Language School Board P.E.I. Crown Building Corporation Western School Board P.E.I. Grain Elevators Corporation Employment Development Agency P.E.I. Housing Corporation Harness Racing P.E.I. Inc. P.E.I. Human Rights Commission Health PEI P.E.I. Lending Agency Innovation PEI P.E.I. Museum and Heritage Foundation F.T.C. Enterprises Limited P.E.I. Regulatory and Appeals Commission Atlantic Technology Centre Inc. P.E.I. Self-Insurance and Risk Management Fund 100417 P.E.I. Inc. P.E.I. Student Financial Assistance Corporation P.E.I. Biocommons Inc. Summerside Regional Development Corporation P.E.I. Agricultural Insurance Corporation Tourism PEI The Province owns 75% of Summerside Regional Development Corporation. The Corporation has been included in the governmental unit on a proportionate consolidation basis.
The Eastern, Western and French Language School Boards have a fiscal year end of June 30th. Unaudited financial information as of March 31, 2011 has been used for consolidation purposes.
Harness Racing P.E.I. Inc. has a fiscal year end of January 31, 2011.
The P.E.I. Grain Elevators Corporation has a fiscal year end of July 31, 2010.
All other agencies, crown corporations and boards have a fiscal year end of March 31, 2011.
Certain provincial agencies, crown corporations and boards are included in the Consolidated Statement of Financial Position using the modified equity method of accounting. This method is used for government business enterprises which are defined as those agencies, crown corporations and boards which, (i) have the power to contract in their own name, (ii) have the financial and operating authority to carry on a business, (iii) sell goods and services to customers outside the provincial reporting entity as their principal activity and source of revenue, and (iv) are able to maintain their operations and meet their liabilities from revenues received from sources outside the provincial reporting entity. The modified equity method reports the percentage of a government business
30 CONSOLIDATED FINANCIAL STATEMENTS 2010-2011
enterprise’s net assets owned by the Province as an investment in the Province’s Consolidated Statement of Financial Position. Inter-organizational balances and transactions are not eliminated. Schedule 4 presents condensed financial information of the following government business enterprises:
Charlottetown Area Development Corporation P.E.I. Energy Corporation Harbourside Management Services Inc. P.E.I. Renewable Energy Corporation Island Investment Development Inc. P.E.I. Liquor Control Commission Prince Edward Island Century 2000 Fund Inc. P.E.I. Lotteries Commission Island Waste Management Corporation Environmental Industrial Services Inc.
The Consolidated Statement of Financial Position does not include the financial position of the Workers’ Compensation Board of Prince Edward Island. The Board as at, December 31, 2010, had assets of $166.5 million (2009 - $133.9 million) and liabilities of $146.4 million (2009 - $129.0 million). The Board has the ability to establish premium rates sufficient to meet its financial obligations.
2 Significant Accounting Policies
(a) Basis of Accounting These financial statements are prepared in accordance with Canadian generally accepted accounting principles (GAAP) for the public sector. The Province complies with the recommendations of the Public Sector Accounting Board (PSAB) of the Canadian Institute of Chartered Accountants (CICA) wherever applicable. PSAB standards are supplemented, where appropriate, by other CICA accounting pronouncements.
(b) Financial Assets Financial assets are those assets on hand at the end of an accounting period which could provide resources to discharge existing liabilities or finance future operations.
Cash and Short Term Investments represents the cash position including bank balances and short term investments. The Province has an available credit facility with a financial institution in the amount of $20 million for the General Account. The credit facility expires December 31, 2011.
Accounts Receivables are recorded for all amounts due for work performed and goods or services supplied in the fiscal year. A provision for loss is established for doubtful accounts.
Investments are recorded at the lower of cost or net realizable value with the exception of investments in private companies that are considered to be concessionary, which are recorded at one-half of cost, and net investment in leases, which are recorded at the net present value of minimum lease payments receivable. A provision for loss is established.
Investment in Government Business Enterprises represents the net assets of government business enterprises recorded on the modified equity basis as described in Note 1.
Sinking Fund assets are recorded at cost plus accrued interest. A portion of the Sinking Fund assets are externally restricted.
CONSOLIDATED FINANCIAL STATEMENTS 2010-2011 31
Loans Receivable are recorded at cost less adjustments for impairment in value and concessionary terms. Where concessionary terms apply loans are reported at their net present value. Loans usually bear interest at approximate market rates and normally have fixed repayment schedules. A provision for loss is established for doubtful accounts. Interest revenue is recognized on an accrual basis until such time that the collectability of either principal or interest is not reasonably assured.
(c) Liabilities Deferred Revenue and Credits represent amounts received but not earned.
Payables, Accruals and Other Liabilities are recorded for all amounts due for work performed, goods or services received and other charges incurred in the fiscal year.
Short Term Loans are recorded at cost, which approximates market value.
Obligation Under Capital Leases represents the liability recorded for contractual arrangements which are deemed to be capital leases. Establishment of a capital lease recognizes the lease contract as a financing tool to acquire an asset.
Pension, Retirement and Other Obligations represent the Province’s net liability for future employee benefit obligations as calculated using an accrued benefits actuarial method on an accounting basis. The net liability represents the present value of accrued benefits less the market value of assets plus or minus deferred gains or losses to be amortized.
Loans Payable are recorded at face value less adjustments for concessionary terms.
Debentures represent the gross funded debt of the Province of P.E.I. public debenture issues and Canada Pension Plan debenture issues less unamortized discounts.
(d) Net Debt The Province’s consolidated financial statements are presented so as to highlight net debt as the measure of financial position. The net debt of the Province is determined as its liabilities less its financial assets.
(e) Non-Financial Assets Non-Financial Assets are acquired, constructed or developed assets that do not normally provide resources to discharge existing liabilities. They are normally employed to deliver government services and may be consumed in the normal course of operations.
Tangible Capital Assets are recorded at historical cost, or estimated cost where historical cost information is not available. Amortization is calculated using the straight line and the declining balance method at the following rates:
Land Improvements 5 - 12 years Buildings and Improvements 10 - 40 years Leasehold Improvements Based on length of lease Roads 10 - 20 years Bridges 20 - 40 years Motor Vehicles 3 - 10 years Equipment 1 - 20 years Other 5 - 40 years
32 CONSOLIDATED FINANCIAL STATEMENTS 2010-2011
Tangible Capital Assets do not include works of art and historical treasures because a reasonable estimate of the future benefits associated with such property cannot be made. Works of art and historic property consist mainly of paintings, drawings, prints, artifacts, and photographs. The cost of works of art and historic property are expensed in the fiscal year in which they are acquired.
Deferred Capital Contributions are revenues received for the purchase or construction of tangible capital assets. Capital contributions are recorded as a deferred credit when received and recognized as revenue over the same period of time that the asset acquired is amortized.
Inventories consist of items on hand which were purchased for consumption or use by the Province in the course of its operations. They are recorded at cost and expensed as they are consumed. Inventories consist of medical and drug supplies, fuel, repair parts, highway materials, textbooks etc.
Property Holdings are recorded at the lower of cost or net realizable value. A provision for loss is established.
Prepaid and Deferred Charges are goods and services purchased which will provide economic benefits in future periods and includes premiums and discounts on short term borrowings.
(f) Accumulated Deficit Accumulated Deficit is the net debt of the Province less non-financial assets. It represents the accumulated balance of annual surpluses and deficits arising from operations of the Province.
(g) Revenues Revenues are recorded on an accrual basis. Revenue from the Government of Canada, under Federal–Provincial fiscal arrangements (equalization, health and social transfers, etc), are based on estimated entitlements received which are adjusted against future years’ revenues when actual results or new information become available.
Transfers from the Government of Canada are recognized as revenue in the period during which the transfer is authorized and any eligibility criteria are met. Supplementary funding received for special purposes is recorded as deferred revenue and recognized as revenue over the term of the project or projects funded.
Income taxes are collected by the Government of Canada on behalf of the Province under a tax collection agreement and are remitted to the Province monthly net of credits. The remittances are based on the Government of Canada’s Department of Finance’s best estimates for the taxation year, which are periodically adjusted until the income tax assessments for the year are finalized. The Government recognizes income tax revenues based on estimates made by the Government of Canada, adjusted for known factors. Any adjustments upon finalization are recorded in the year they are identified.
Sales, fuel and tobacco tax revenues are recorded based on returns which are filed by collectors and taxpayers. Returns filed or estimated for prior periods, adjustments and audit assessments are recognized as revenue in the period during which the return is filed or estimated, or the amount is determined.
CONSOLIDATED FINANCIAL STATEMENTS 2010-2011 33
Property tax revenues are recorded based on a pro-ration of actual property tax billings for each of the calendar years that comprise the fiscal year. Adjustments recorded subsequent to fiscal year end, due to adjustments to property assessments or provincial tax credits, are recognized as revenue adjustments in the period in which the adjustments are determined.
(h) Expenses Expenses are recorded on an accrual basis.
Capital expenditures are incurred in the acquisition, development and/or construction of tangible capital assets. They do not include operational expenses. The acquisition of tangible capital assets are not reported as expenses in the year the assets are acquired. Tangible capital assets are included in the Province’s Consolidated Statement of Financial Position as non-financial assets and their cost is amortized over their estimated useful life.
Transfer payments are transfers of money to individuals, organizations or other governments for which the government making the transfer does not receive any goods or services directly in return. Transfer payments are recognized by the Province as expenses in the period during which both the payment is authorized and any eligibility criteria are met.
Provisions are made for probable losses or impairments in the value of the asset on certain loans, investments, loan guarantees and accounts receivable when it is likely that impairment in the value of the asset or a liability exists and the amount can be reasonably determined. These provisions are updated at least annually as estimates are revised.
3 Accounting Change
Land – Increase in Historical Cost In the fiscal year 2010-2011 a review of properties owned by the Province was completed and the decision was made to place an estimated value on a number of properties which previously had been recorded at one dollar or at zero value. An adjustment in the amount of $28.9 million has been made at March 31, 2011 increasing the historical cost of Tangible Capital Assets (land) and reducing Accumulated Deficit by the same amount. This change has had no impact on the current deficit or on Net Debt and has not been applied retroactively.
4 Cash and Short Term Investments As at March 31, 2011 cash and short term investments of $5.6 million (2010 - $18.3 million) have been restricted for designated purposes by external parties. Restricted cash includes, $3.5 million for the Cable Replacement Fund, $1.6 million for the Labour Market Development Agreement and $0.5 million for three other trust funds.
5 Sinking Fund
(a) Description of Sinking Fund The Province of Prince Edward Island Sinking Fund was established to reserve funds to meet future debt retirement. Earnings on Sinking Funds are reflected as current revenue.
34 CONSOLIDATED FINANCIAL STATEMENTS 2010-2011
Certain funds in the Sinking Fund designated for debentures are externally restricted and as a result cannot be used for other purposes. Installment payments are made to the Sinking Fund from the Operating Fund, they are allocations within the Operating Fund and as such are not treated as an expense. The installment payments for the next five years are:
($000)
2011-2012 13,750 2012-2013 12,225 2013-2014 12,225 2014-2015 12,225 2015-2016 11,100
(b) P.E.I. Issues Held by the Sinking Fund As at March 31, 2011 Sinking Fund investments include P.E.I. issues held but not cancelled in the amounts of:
($000) ($000) Debentures Par Value 94,026 Book Value 104,614 Residuals Par Value 82,512 Book Value 46,370
6 Solid Waste Landfill Closure and Post-Closure Liability The collection and disposal of all solid waste generated in Prince Edward Island is included in the mandate of Island Waste Management Corporation (IWMC). IWMC is responsible for liabilities related to the closure and post-closure costs of the East Prince Landfill Site, which was in use at March 31, 2011. IWMC is also responsible for monitoring and administering post-closure issues at four landfill sites and approximately one hundred smaller community dumps which were closed prior to 2003. The Province is responsible for the costs associated with the closure and decommissioning of the sites closed prior to 2003.
IWMC has included in its liabilities at March 31, 2011 an obligation associated with the retirement, closure and post-closure costs of the East Prince Landfill Site in the amount of $2.4 million (2010 - $1.9 million). The Province recognizes its responsibility regarding landfill sites closed prior to 2003 but at this time is unable to estimate the costs involved due to the absence of a formal action plan. A provisional amount of $0.35 million, established in 2003 to deal with future costs, is included in accounts payable and accrued liabilities.
CONSOLIDATED FINANCIAL STATEMENTS 2010-2011 35
7 Contractual Obligations
The Province has entered into a number of multiple-year contracts for the delivery of services. These contractual obligations will become liabilities in the future when the terms of the contracts are met. Significant obligations for the next five years and beyond include:
2012 2013 2014 2015 2016 2017 onward
Total
($000) ($000) ($000) ($000) ($000) ($000) ($000)Operating Fund Highway Maintenance and Safety 13,490 2,496 1,795 1,724 1,724 424 21,653Infrastructure 575 575 - - - 1,150Highway Capital 23,545 - - - - - 23,545Public Works and Planning 54,528 11,578 2,142 2,115 2,115 21,154 93,632Building Leases 4,777 4,200 3,603 3,503 3,447 27,054 46,584Provincial Policing Service Agreement 11,620 - - - - - 11,620Holland College and University of Prince Edward Island 1
17,963 10,502 10,440 10,377 9,934 102,168 161,384
Early Years Centres 7,200 - - - - - 7,200Community Care Facilities 7,613 1,925 - - - - 9,538Telephone Services 1,800 1,800 1,800 1,800 1,800 - 9,000Training, Recruiting, Life Works Programs 1,400 1,400 1,575 1,875 833 - 7,083Other Significant Obligations 1,293 1,033 1,033 1,033 1,033 3,797 9,222
Agencies and Crown Corporations Health PEI 23,658 22,706 7,036 6,963 6,420 5,639 72,422Island Waste Management Corporation 5,541 4,630 2,714 508 384 - 13,777P.E.I. Liquor Control Commission 745 684 581 488 367 390 3,255Total 175,748 63,529 32,719 30,386 28,057 160,626 491,065
1 The Province has various commitments to make debt service payments to Holland College and the University of Prince Edward Island (UPEI). The aggregate of these commitments of $161.4 million. The commitments for the next five years are:
Holland College UPEI Total ($000) ($000) ($000) 2011-2012 4,472 13,491 17,9632012-2013 5,072 5,430 10,5022013-2014 5,072 5,368 10,4402014-2015 5,072 5,305 10,3772015-2016 4,672 5,262 9,934
8 Commitments The nature of the Province’s activities results in commitments against future appropriations. Payments are subject to the approval of the Legislature through the annual budget process. Significant financial commitments at March 31, 2011 include:
36 CONSOLIDATED FINANCIAL STATEMENTS 2010-2011
(a) Loans
2011 2010 ($000) ($000)
Loans approved but not disbursed at March 31: Innovation PEI 1,200 9,898 Island Investment Development Inc. 44,331 37,693 P.E.I. Lending Agency 1,201 9,722
46,732 57,313
(b) Innovation PEI The agency has committed to disbursing $22.6 million (2010 - $23.2 million) for labour rebate program assistance, $6.8 million (2010 - $6.7 million) for enriched investment tax credits, $1.1 million (2010 - $1.5 million) in industry chair program assistance, $0.7 million (2010 – $1.4 million) for specialized labour rebates and $0.2 million (2010 - $0.07 million) for share purchase tax credit, over the next four years provided the companies meet their eligibility requirements.
(c) Island Waste Management Corporation The Corporation has entered into a waste processing agreement dated August 8, 1995 to supply P.E.I. Energy Systems with a minimum annual guaranteed amount of 30,617 metric tonnes of waste. The 30 year agreement, expiring in August 2025, provides for the payment by IWMC of a $45 per metric tonne quarterly fee adjusted for consumer price index fluctuations. Any shortage is the responsibility of IWMC. Current annual costs for the waste processing are estimated at $1.92 million (2010 - $1.89 million).
(d) Maritime Electric Company Ltd. As part of an overall cost savings and price stabilization initiative, the Province entered into a multi-action agreement with Maritime Electric Company Ltd (MECL) resulting in future commitments as follows:
(i) The Province, through its agency the P.E.I. Energy Corporation, will assist in financing the debt associated with the shutdown of Point Lepreau. The Province agrees that commencing March 1, 2011 and until such time as Point Lepreau is to return to service it will assume responsibility for the cost of securing replacement energy as well as the operating and maintenance charges for the period of refurbishment subsequent to March 1, 2011 related to MECL’s entitlement pursuant to the Point Lepreau Unit Participation Agreement entered into by MECL with New Brunswick Power. In the event Point Lepreau does not return to service by the fall of 2012, the Province reserves the right to cease monthly payments. Monthly payments are expected to be in the range of $2.0 million. All costs borne by the Province will ultimately be recovered from rate payers, beginning in 2013, over an expected term of 25 to 30 years.
(ii) The Province, through its agency the P.E.I. Energy Corporation, agrees to pay all costs associated with MECL exiting from the Dalhousie Unit Participation Agreement. The one-time costs associated with exiting the Dalhousie agreement are expected to be in the range of $9.0 - $13.0 million. Under the agreement, the Province will finance these costs over a ten year period and recover all of its costs from rate payers beginning in 2013.
CONSOLIDATED FINANCIAL STATEMENTS 2010-2011 37
9 Contingent Liabilities
(a) Claims Outstanding The Province is subject to legal actions arising in the normal course of business. At March 31, 2011 there were a number of outstanding claims arising from legal action in progress against the Crown.
The cost, if any, of most of the claims outstanding will be paid through the P.E.I. Self-Insurance and Risk Management Fund. The P.E.I. Self-Insurance and Risk Management Fund was established in 1988 under Part II of the Financial Administration Act. The Fund provides general liability insurance, errors and omissions insurance, primary property and crime insurance, and automobile liability insurance. At March 31, 2011, Fund reserves were $4.9 million (2010 - $6.1 million). Claims amounting to $3.3 million were settled in the current year (2010 - $3.0 million). The estimated amount for claims outstanding at March 31, 2011 is $4.0 million (2010 - $2.6 million). The Fund carries an excess liability policy limiting the liability of the Fund.
At March 31, 2011 a loss provision of $1.4 million (2010 - $3.0 million) has been recorded for legal action claims not covered through the Self-Insurance and Risk Management Fund.
No loss provision has been made for costs, if any, relating to claims of abuse at the former Mt. Herbert Orphanage, which are not covered through the Self-Insurance and Risk Management Fund. The cost to the Province resulting from legal actions cannot be determined because the outcome of these actions is uncertain.
(b) Credit Union Deposit Insurance Corporation The Credit Unions Act states that the Province shall ensure that the obligations of the Credit Union Deposit Insurance Corporation (CUDIC) are carried out. The CUDIC provides deposit insurance coverage on deposits within established limits held by P.E.I. credit unions. The CUDIC is funded by an assessment on insurable deposits in each of the ten credit unions. The Province holds two director positions on the CUDIC Board of Directors. At December 31, 2010 the CUDIC had an equity balance of $10.2 million (2009 - $9.5 million).
Deposits insured by CUDIC, on the basis of returns received from its member institutions, as at December 31, 2010, were $606.3 million (2009 - $596.1 million). The Province’s contingent liability, if any, is offset by equity held by the CUDIC, Credit Union Central of Prince Edward Island and the ten credit unions on P.E.I.
(c) P.E.I. Energy Corporation During the year, the Corporation entered into an irrevocable stand-by letter of credit in the amount of $11.84 million on behalf of a wind energy company.
The Corporation has entered into a contract with the Department of Natural Resources (NRCan) under the Wind Power Production Incentive program. In the event that revenue from the sale of production of the Wind Farm exceeds the standardized market value of that production, the incentives received must be repaid to NRCan. During the year, revenue was not in excess of the standardized market value and consequently, no liability must be recognized.
38 CONSOLIDATED FINANCIAL STATEMENTS 2010-2011
(d) Guaranteed Debt
The Province has guaranteed the repayment of a variety of types of loans. Guarantees amounting to $252.7 million (2010 - $254.7 million) are reported in Schedule 19.
10 Pension, Retirement and Other Obligations
(a) Basis of Accounting for Obligations The Province has adopted the recommendations of the Public Sector Accounting Board (PSAB) in accounting for its pension and other retirement obligation liabilities. Assumptions used in the valuation of these benefits and obligations are developed on two criteria; for funding purposes and for accounting purposes. The Province uses assumptions developed for accounting purposes.
(b) Pension Funds Civil Service Superannuation Fund Employees of the Province, and some of its entities, are entitled to receive pension benefits pursuant to the provisions of a pension plan under the Civil Service Superannuation Act. Pension benefits are based on the number of years of service times 2 percent of the best three years’ average salary. The plan provides for inflation protection to a maximum of 6 percent.
The plan is operated within the Civil Service Superannuation Fund which is not part of the Operating Fund of the Province. Investments of the Fund are held within the Province of Prince Edward Island Master Trust, which is administered by external investment managers under policy guidelines set down by Executive Council and supervised by an advisory committee to the Minister of Finance and Municipal Affairs. The plan is funded by employee contributions equal to 7.09 percent of the portion of their salary up to the Year’s Maximum Pensionable Earnings (YMPE) and 8.75 percent on the portion of their salary that is in excess of the YMPE, with the Province matching those contributions. By Act, the Province is committed to make payments if the Civil Service Superannuation Fund is insufficient to provide for pension payments as they become due. In addition, a funding policy has been adopted which requires the Province to make special contributions when the Fund’s funding level declines below 90 percent. As a result of an unfunded liability at April 1, 2005, the Province made a special contribution through the signing of a $52 million promissory note. The note, which is held by the Fund, is receivable in ten equal installments of $5.2 million beginning October 15, 2006. Interest on the note is accrued at a rate of 4.41 percent per annum and is receivable semi-annually on April 15 and October 15. Prior to October 15, 2015 any monies owing may be suspended on six months prior notice if the Minister of Finance and Municipal Affairs deems the funding level of the Fund, excluding any outstanding balances on promissory notes, to be at a level of 90 percent on a going concern basis as defined in the Province of Prince Edward Island Funding Policy for Government Sponsored Registered Pension Plans. Interest will be accrued to the date of any suspension implemented. Any monies suspended prior to and including October 15, 2015 are no longer due and owing. Provided no further monies are payable, the promissory note shall be deemed paid in full.
The most recent going concern actuarial valuation for funding purposes, dated April 1, 2008, determined an unfunded liability of $126.9 million. At this date, after taking into account the outstanding balance on the promissory note and the present value of excess contributions as stipulated in the Funding Policy, the funding level was above 90 percent. Therefore, no additional special contributions were required.
CONSOLIDATED FINANCIAL STATEMENTS 2010-2011 39
Teachers’ Superannuation Fund
The Teachers’ Superannuation Act established a fund for the payment of pensions to retired teachers or refund of contributions under certain circumstances. Pension benefits are based on the number of years of service times 2 percent of the best five years’ average salary. The plan provides for inflation protection to a maximum of 4 percent.
The plan is operated within the Teachers’ Superannuation Fund which is not part of the Operating Fund of the Province. Investments of the Fund are held within the Province of Prince Edward Island Master Trust, which is administered by external investment managers under policy guidelines set down by Executive Council and supervised by an advisory committee to the Minister of Finance and Municipal Affairs. The plan is funded by employee contributions equal to 7.3 percent of the portion of their salary up to the Year’s Maximum Pensionable Earnings (YMPE) and 9 percent on the portion of their salary that is in excess of the YMPE, with the Province matching those contributions. By Act, the Province is committed to make payments if the Teachers’ Superannuation Fund is insufficient to provide for pension payments as they become due. In addition, a funding policy has been adopted which requires the Province to make special contributions when the Fund’s funding level declines below 90 percent. As a result of an unfunded liability at July 1, 2005, the Province made a special contribution through the signing of a $160 million promissory note. The note, which is held by the Fund, is receivable in ten equal installments of $16 million beginning April 15, 2005. Interest on the note is accrued at a rate of 4.345 percent per annum and is receivable semi-annually on April 15 and October 15. Prior to April 15, 2014, any monies owing may be suspended on six months prior notice if the Minister of Finance and Municipal Affairs deems the funding level of the fund, excluding any outstanding balances on promissory notes, to be at a level of 90 percent on a going concern basis as defined in the Province of Prince Edward Island Funding Policy for Government Sponsored Registered Pension Plans. Interest will be accrued to the date of any suspension implemented. Any monies suspended prior to and including April 15, 2014 are no longer due and owing. Provided no further monies are payable, the promissory note shall be deemed paid in full.
The most recent going concern actuarial valuation for funding purposes, dated July 1, 2008, determined an unfunded liability of $130.5 million. At this date, after taking into account the outstanding balance on the promissory note and the present values of excess contributions as stipulated in the Funding Policy, the funding level was 81 percent. As a result, the Province made a special cash contribution of $53 million to the Fund on March 12, 2010 to bring the funding level, including the outstanding balance on the promissory note, to 90 percent.
Pension Plan for Members of the Legislative Assembly The Legislative Assembly Act provides for an Indemnities and Allowances Commission to review and determine the remuneration and benefits to be paid to the Members of the Legislative Assembly, Ministers, Speaker, Deputy Speaker, Leader of the Opposition, Government House Leader, Opposition House Leader, Government Whip, and Opposition Whip. The Commission established the “Pension Plan for Members of the Legislative Assembly of Prince Edward Island” and designated the Minister of Finance and Municipal Affairs as Administrator having responsibility for the day-to-day operation and administration of the plan. Pension benefits are based on criteria which differ depending on the period of service. The criteria for the different periods are as follows:
(i) For the period up to and including June 30, 1994, annual members’ pensions are equal to the lesser of 75 percent of contributions and the average annual indemnity during the last five years of service. Annual Ministers’ pensions are equal to the lesser of 75 percent of contributions and one half of the highest annual salary as a Minister.
40 CONSOLIDATED FINANCIAL STATEMENTS 2010-2011
(ii) For the period July 1, 1994 to March 31, 2001, benefits are based on the number of years of
service times 2 percent of the best thirty-six consecutive months’ average indemnity and salary earned by the member.
(iii) For the period on or after April 1, 2001, benefits are 25 percent of the required contributions made by the participant commencing after April 1, 2001, indexed annually by the percentage increase in the Consumer Price Index, subject to a maximum increase of 8 percent per annum.
The plan provides a pre-retirement inflation protection equal to the increase in the Consumer Price Index to a maximum of 8 percent. Post-retirement inflation protection is the increase in the Consumer Price Index minus 2 percent, to a maximum of 8 percent.
A plan amendment effective January 1, 2010 provides that if after the deaths of the participant and the eligible survivors, the sum of all payments made to those parties is less than two times the participant’s contributions plus interest, the difference will be paid in a cash lump sum to the participant’s estate or children. The plan was also amended effective January 1, 2010 to change the pre-retirement death benefit for participants elected for the first time on or after January 1, 2009 from the present value of the earned pension to two times the contributions plus interest.
This plan operates within the Pension Plan for Members of the Legislative Assembly of Prince Edward Island Fund and is not part of the Operating Fund of the Province. The plan is funded by contributions from the members of the Legislative Assembly equal to 8 percent of their salary. Investments of the Fund are held within the Province of Prince Edward Island Master Trust, which is administered by external investment managers under policy guidelines set down by Executive Council and supervised by an advisory committee to the Minister of Finance and Municipal Affairs. The Province is required to make contributions to the Fund to ensure that there is sufficient money to cover the cost of current service accruals as well as provide for the proper amortization of any unfunded liability. The plan text and tax legislation require that an employer contribution holiday must be taken while the plan is in a surplus position.
Pension Plan for Members of the Legislative Assembly (Supplementary) The supplementary to the Pension Plan for Members of the Legislative Assembly was established effective April 1, 1999. The plan provides a pension which is supplementary to the benefits provided under the Pension Plan for Members of the Legislative Assembly. Supplementary benefits are provided for service rendered subsequent to June 30, 1994 and the amount of benefit is approximately equal to those benefits provided under the Pension Plan for Members of the Legislative Assembly of Prince Edward Island. This plan is unfunded. The Province is responsible for the unfunded liability and makes payments from the Operating Fund as they become due. The plan provides for inflation protection to a maximum of 8 percent.
Senior Compensation Program An executive compensation plan is provided to the senior management of the Province. The plan provides a pension which is supplementary to the benefits provided under the Civil Service Superannuation Act. Pension benefits are based on the number of years’ participation in the Senior Compensation Program to a maximum of 5 years times 2 percent of the best three years’ average salary. This plan is unfunded. The Province is responsible for the unfunded liability and makes payments from the Operating Fund as they become due. The plan provides for inflation protection to a maximum of 6 percent.
CONSOLIDATED FINANCIAL STATEMENTS 2010-2011 41
Pension Plan for Judges – Old
The Provincial Court Act provides a pension plan for Provincial Court judges who were appointed before April 1, 1997. Pension benefits are based on two thirds of the salary payable to the judge at the time of retirement. This plan is unfunded. The Province is responsible for the unfunded liability and makes payments from the Operating Fund as they become due. The plan provides for inflation protection to a maximum of 8 percent.
Pension Plan for Judges – New The Provincial Court Act established a Judicial Remuneration Review Commission which reviews salary, benefits and expenses paid to judges. In February 2002, the Commission approved the establishment of a pension plan for judges appointed after March 31, 1997 which is supplementary to the benefits provided under the Civil Service Superannuation Act. Pension benefits are based on the number of years’ service times 3 percent of the best three years’ average salary less benefits received under the Civil Service Superannuation Plan. This plan is unfunded. The Province is responsible for the unfunded liability and makes payments from the Operating Fund as they become due. The plan provides for inflation protection to a maximum of 6 percent.
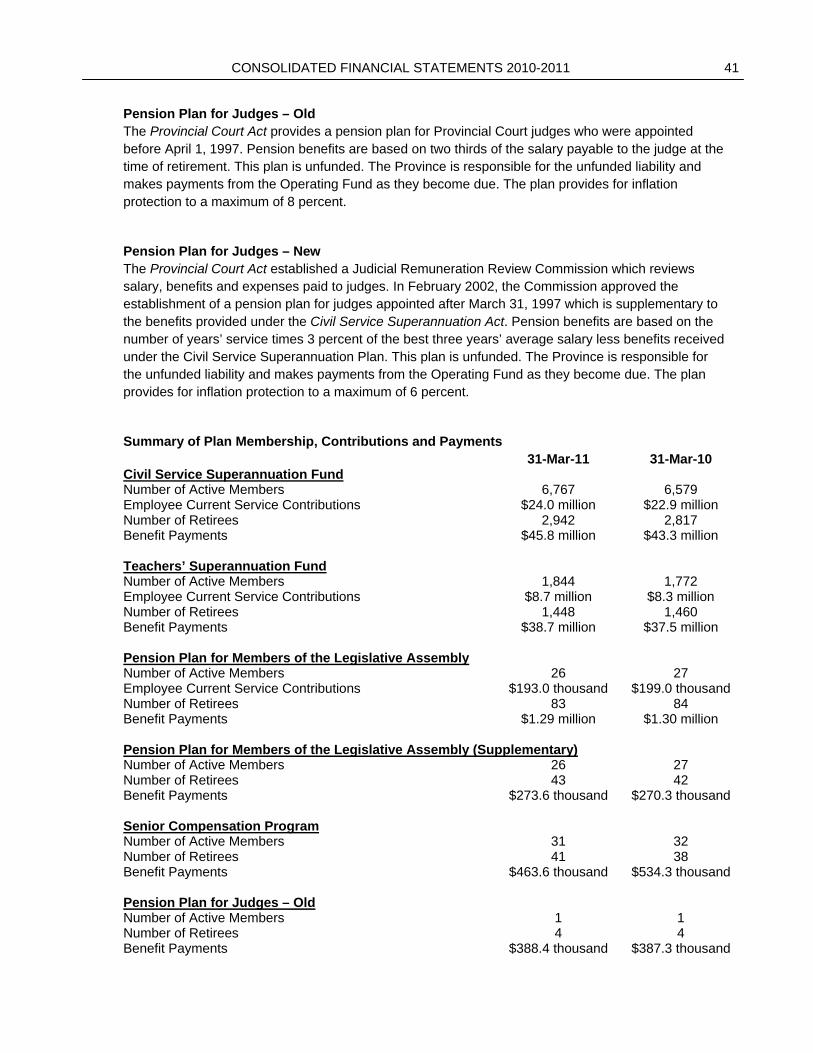
Summary of Plan Membership, Contributions and Payments 31-Mar-11 31-Mar-10
Civil Service Superannuation Fund Number of Active Members 6,767 6,579 Employee Current Service Contributions $24.0 million $22.9 million Number of Retirees 2,942 2,817 Benefit Payments $45.8 million $43.3 million
Teachers’ Superannuation Fund Number of Active Members 1,844 1,772 Employee Current Service Contributions $8.7 million $8.3 million Number of Retirees 1,448 1,460 Benefit Payments $38.7 million $37.5 million
Pension Plan for Members of the Legislative Assembly Number of Active Members 26 27 Employee Current Service Contributions $193.0 thousand $199.0 thousand Number of Retirees 83 84 Benefit Payments $1.29 million $1.30 million Pension Plan for Members of the Legislative Assembly (Supplementary)
Number of Active Members 26 27 Number of Retirees 43 42 Benefit Payments $273.6 thousand $270.3 thousand
Senior Compensation Program Number of Active Members 31 32 Number of Retirees 41 38 Benefit Payments $463.6 thousand $534.3 thousand Pension Plan for Judges – Old Number of Active Members 1 1 Number of Retirees 4 4 Benefit Payments $388.4 thousand $387.3 thousand
42 CONSOLIDATED FINANCIAL STATEMENTS 2010-2011
Pension Plan for Judges – New Number of Active Members 2 2 Number of Retirees 0 0
Actuarial Valuations / Estimates Actuarial valuations of the Province’s pension funds are carried out every three years. An estimated update, which is a calculation based on an extrapolation of the most recent valuation, is calculated by the Province at the end of each fiscal year.
Actuarial gains and losses are amortized on a straight-line basis over the expected average remaining service life of the related employee group, which is 5 years for MLAs and 14 years for all other groups.
Actuarial valuations and estimates are based on a number of assumptions about future events, such as inflation rates, interest rates, wage and salary increases and employee turnover and mortality. The assumptions used reflect the Province’s best estimates. The assumptions for the most recent valuations are as follows:
MLA CSSF/TSF 1-Apr-09 1-Apr-08
Expected Inflation Rate 2.50% 2.50% Discount Rate Used to Determine Accrued Obligation 7.88% 7.37% Expected Rate of Return on Plan Assets 7.88% 7.37%
Pension fund assets are valued at market values. The actual return on plan assets was 10.2 percent in 2011 (2010 – 22.1 percent)
The following are the most recent actuarial valuations for the Province’s three pension funds:
Civil Service Fund
Teachers' Fund MLA Fund
Date of Valuation 01-Apr-08 01-Apr-08 01-Apr-09($000) ($000) ($000)
Actuarial Liability 912,334 571,631 14,830 Fund Assets 866,541 493,264 16,933 Unfunded Liability (Surplus) 45,793 78,367 (2,103)
For the fiscal year 2010-2011, formal actuarial projections were performed for the Civil Service Fund and Teachers’ Fund to reflect changes to the discount rate and expected rate of return assumptions. Assumptions used in the projections were as follows:
Expected Inflation Rate 2.50% Discount Rate Used to Determine Accrued Obligation 7.63% Expected Rate of Return on Plan Assets 7.63%
At April 1, 2011, adjustments were made to reflect changes to the discount rate assumptions. The assumptions used in the projections were as follows:
CONSOLIDATED FINANCIAL STATEMENTS 2010-2011 43
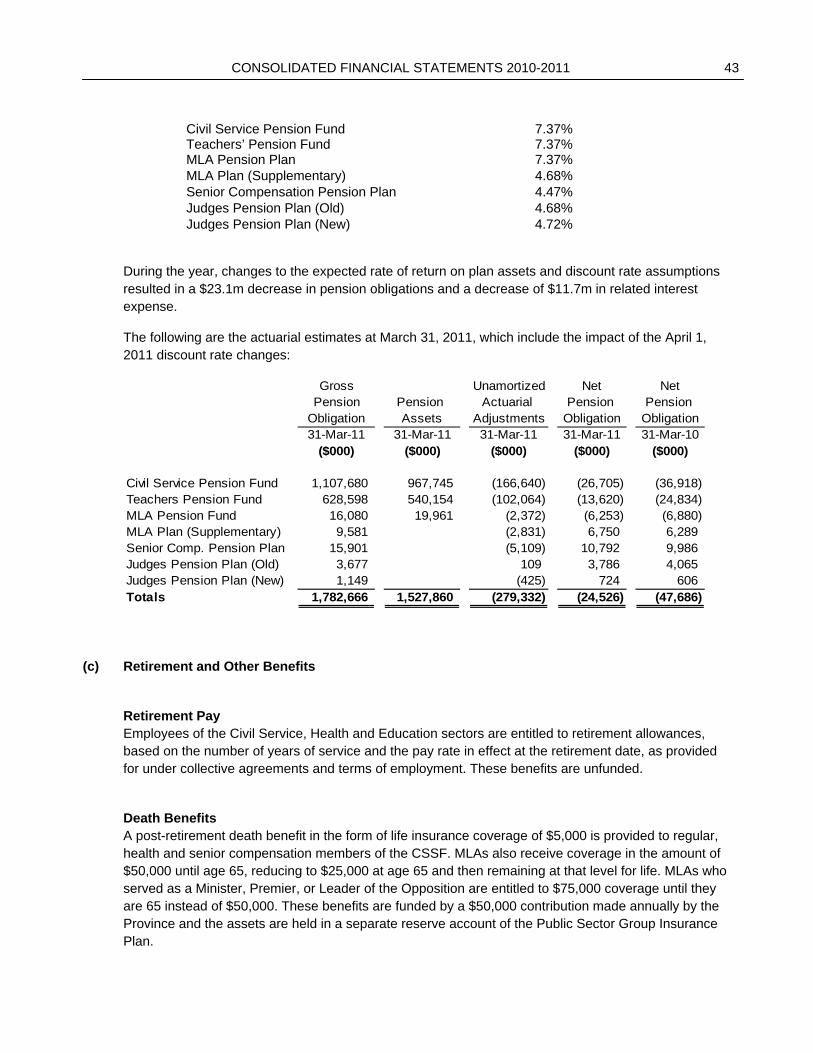
Civil Service Pension Fund 7.37% Teachers’ Pension Fund 7.37% MLA Pension Plan 7.37% MLA Plan (Supplementary) 4.68% Senior Compensation Pension Plan 4.47% Judges Pension Plan (Old) 4.68% Judges Pension Plan (New) 4.72%
During the year, changes to the expected rate of return on plan assets and discount rate assumptions resulted in a $23.1m decrease in pension obligations and a decrease of $11.7m in related interest expense.
The following are the actuarial estimates at March 31, 2011, which include the impact of the April 1, 2011 discount rate changes:
Gross Unamortized Net NetPension Pension Actuarial Pension Pension
Obligation Assets Adjustments Obligation Obligation31-Mar-11 31-Mar-11 31-Mar-11 31-Mar-11 31-Mar-10
($000) ($000) ($000) ($000) ($000)
Civil Service Pension Fund 1,107,680 967,745 (166,640) (26,705) (36,918) Teachers Pension Fund 628,598 540,154 (102,064) (13,620) (24,834) MLA Pension Fund 16,080 19,961 (2,372) (6,253) (6,880) MLA Plan (Supplementary) 9,581 (2,831) 6,750 6,289 Senior Comp. Pension Plan 15,901 (5,109) 10,792 9,986 Judges Pension Plan (Old) 3,677 109 3,786 4,065 Judges Pension Plan (New) 1,149 (425) 724 606 Totals 1,782,666 1,527,860 (279,332) (24,526) (47,686)
(c) Retirement and Other Benefits
Retirement Pay Employees of the Civil Service, Health and Education sectors are entitled to retirement allowances, based on the number of years of service and the pay rate in effect at the retirement date, as provided for under collective agreements and terms of employment. These benefits are unfunded.
Death Benefits A post-retirement death benefit in the form of life insurance coverage of $5,000 is provided to regular, health and senior compensation members of the CSSF. MLAs also receive coverage in the amount of $50,000 until age 65, reducing to $25,000 at age 65 and then remaining at that level for life. MLAs who served as a Minister, Premier, or Leader of the Opposition are entitled to $75,000 coverage until they are 65 instead of $50,000. These benefits are funded by a $50,000 contribution made annually by the Province and the assets are held in a separate reserve account of the Public Sector Group Insurance Plan.
44 CONSOLIDATED FINANCIAL STATEMENTS 2010-2011
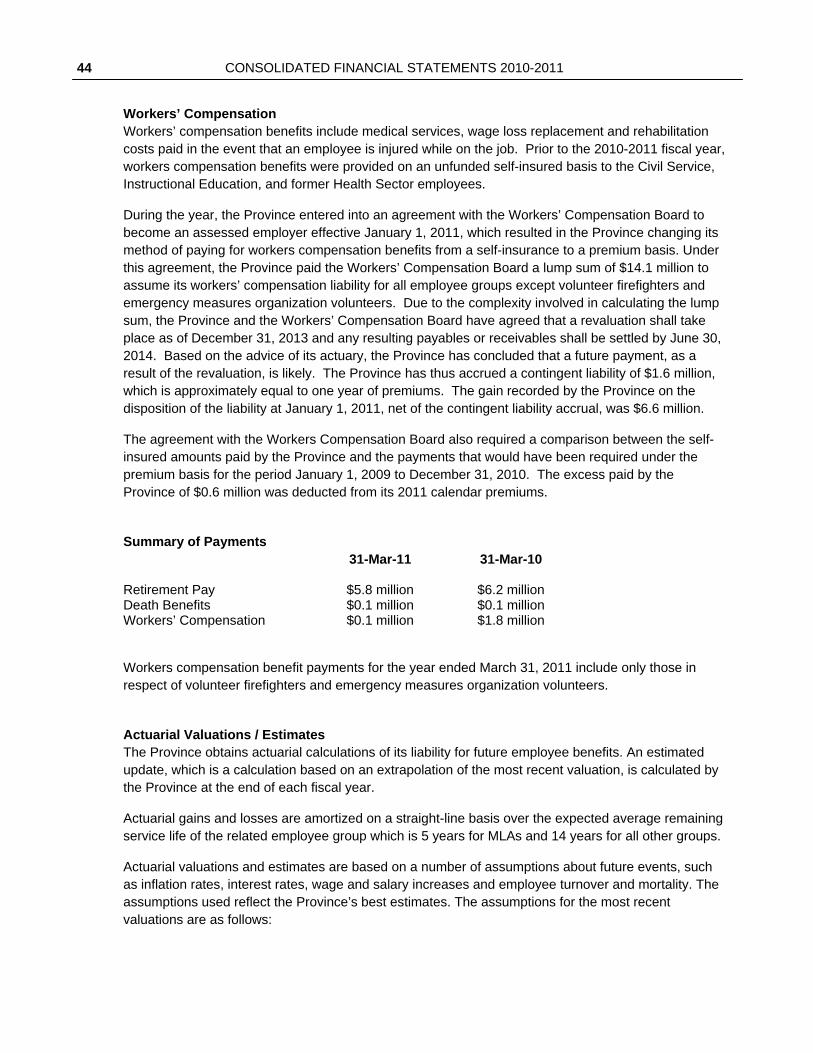
Workers’ Compensation
Workers’ compensation benefits include medical services, wage loss replacement and rehabilitation costs paid in the event that an employee is injured while on the job. Prior to the 2010-2011 fiscal year, workers compensation benefits were provided on an unfunded self-insured basis to the Civil Service, Instructional Education, and former Health Sector employees.
During the year, the Province entered into an agreement with the Workers’ Compensation Board to become an assessed employer effective January 1, 2011, which resulted in the Province changing its method of paying for workers compensation benefits from a self-insurance to a premium basis. Under this agreement, the Province paid the Workers’ Compensation Board a lump sum of $14.1 million to assume its workers’ compensation liability for all employee groups except volunteer firefighters and emergency measures organization volunteers. Due to the complexity involved in calculating the lump sum, the Province and the Workers’ Compensation Board have agreed that a revaluation shall take place as of December 31, 2013 and any resulting payables or receivables shall be settled by June 30, 2014. Based on the advice of its actuary, the Province has concluded that a future payment, as a result of the revaluation, is likely. The Province has thus accrued a contingent liability of $1.6 million, which is approximately equal to one year of premiums. The gain recorded by the Province on the disposition of the liability at January 1, 2011, net of the contingent liability accrual, was $6.6 million.
The agreement with the Workers Compensation Board also required a comparison between the self-insured amounts paid by the Province and the payments that would have been required under the premium basis for the period January 1, 2009 to December 31, 2010. The excess paid by the Province of $0.6 million was deducted from its 2011 calendar premiums.
Summary of Payments 31-Mar-11 31-Mar-10
Retirement Pay $5.8 million $6.2 million Death Benefits $0.1 million $0.1 million Workers’ Compensation $0.1 million $1.8 million
Workers compensation benefit payments for the year ended March 31, 2011 include only those in respect of volunteer firefighters and emergency measures organization volunteers.
Actuarial Valuations / Estimates The Province obtains actuarial calculations of its liability for future employee benefits. An estimated update, which is a calculation based on an extrapolation of the most recent valuation, is calculated by the Province at the end of each fiscal year.
Actuarial gains and losses are amortized on a straight-line basis over the expected average remaining service life of the related employee group which is 5 years for MLAs and 14 years for all other groups.
Actuarial valuations and estimates are based on a number of assumptions about future events, such as inflation rates, interest rates, wage and salary increases and employee turnover and mortality. The assumptions used reflect the Province’s best estimates. The assumptions for the most recent valuations are as follows:
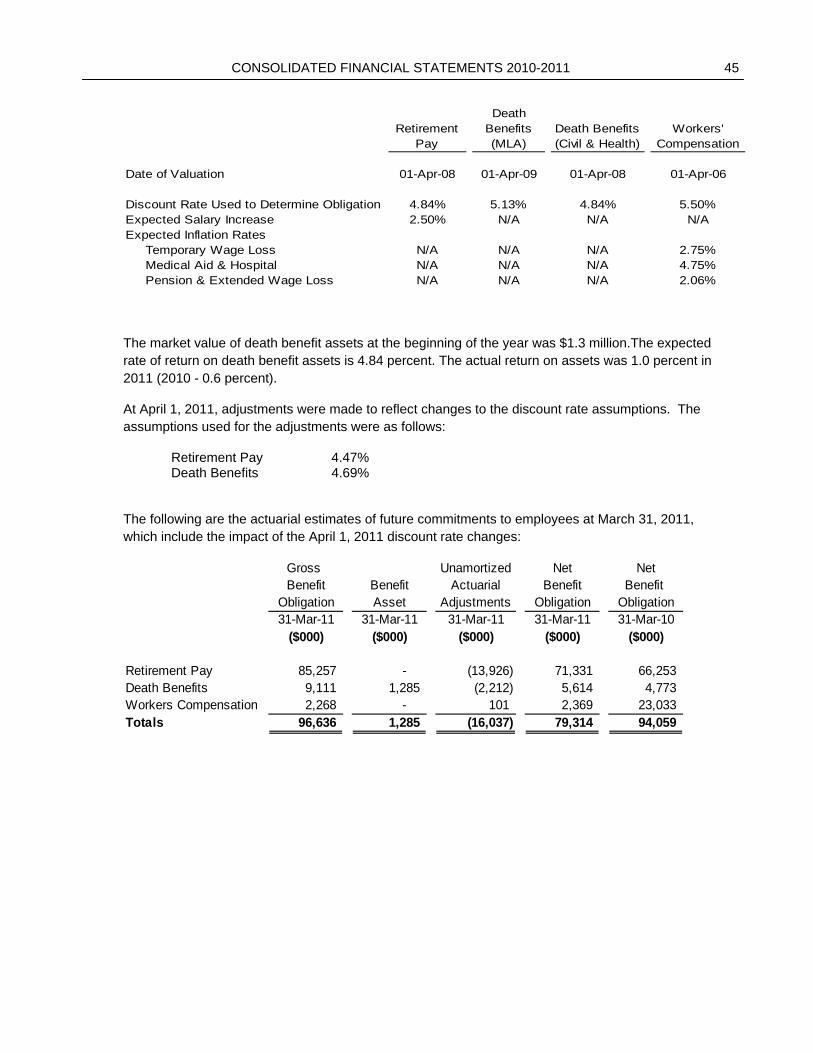
CONSOLIDATED FINANCIAL STATEMENTS 2010-2011 45
Retirement Pay
Death Benefits (MLA)
Death Benefits (Civil & Health)
Workers' Compensation
Date of Valuation 01-Apr-08 01-Apr-09 01-Apr-08 01-Apr-06
Discount Rate Used to Determine Obligation 4.84% 5.13% 4.84% 5.50%Expected Salary Increase 2.50% N/A N/A N/AExpected Inflation Rates Temporary Wage Loss N/A N/A N/A 2.75% Medical Aid & Hospital N/A N/A N/A 4.75% Pension & Extended Wage Loss N/A N/A N/A 2.06%
The market value of death benefit assets at the beginning of the year was $1.3 million.The expected rate of return on death benefit assets is 4.84 percent. The actual return on assets was 1.0 percent in 2011 (2010 - 0.6 percent).
At April 1, 2011, adjustments were made to reflect changes to the discount rate assumptions. The assumptions used for the adjustments were as follows:
Retirement Pay 4.47% Death Benefits 4.69%
The following are the actuarial estimates of future commitments to employees at March 31, 2011, which include the impact of the April 1, 2011 discount rate changes:
Gross Unamortized Net NetBenefit Benefit Actuarial Benefit Benefit
Obligation Asset Adjustments Obligation Obligation31-Mar-11 31-Mar-11 31-Mar-11 31-Mar-11 31-Mar-10
($000) ($000) ($000) ($000) ($000)
Retirement Pay 85,257 - (13,926) 71,331 66,253 Death Benefits 9,111 1,285 (2,212) 5,614 4,773 Workers Compensation 2,268 - 101 2,369 23,033 Totals 96,636 1,285 (16,037) 79,314 94,059
46 CONSOLIDATED FINANCIAL STATEMENTS 2010-2011
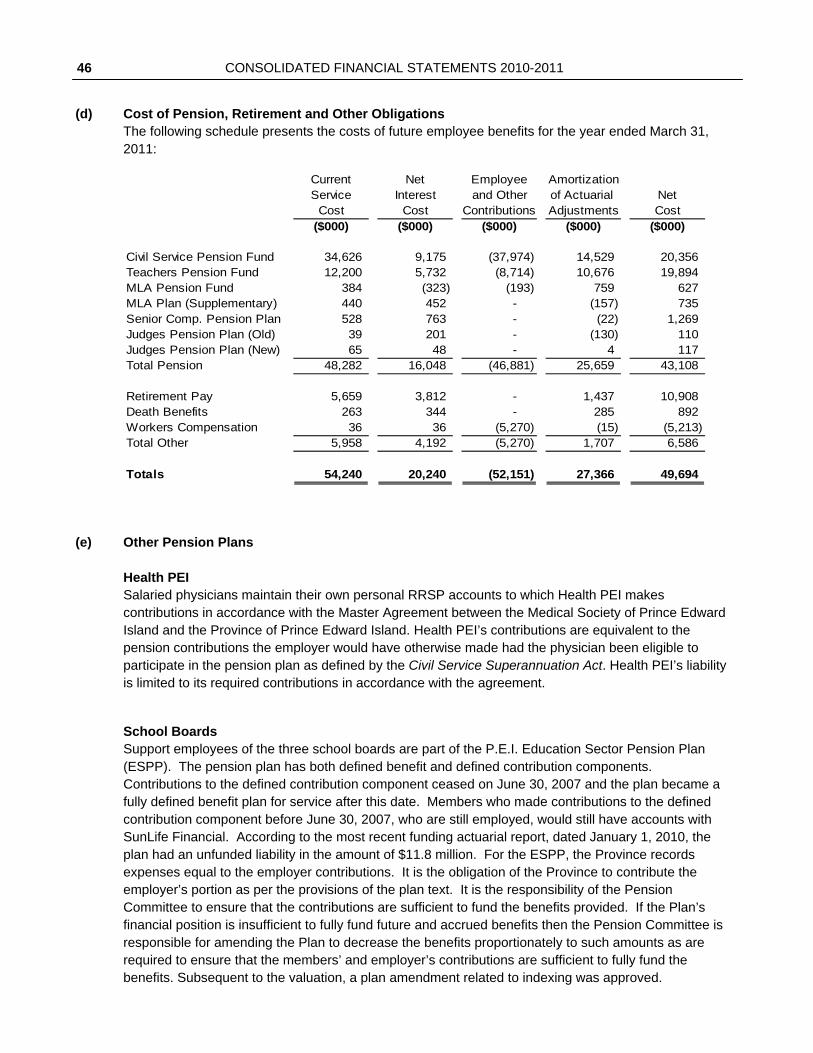
(d) Cost of Pension, Retirement and Other Obligations
The following schedule presents the costs of future employee benefits for the year ended March 31, 2011:
Current Net Employee AmortizationService Interest and Other of Actuarial Net
Cost Cost Contributions Adjustments Cost($000) ($000) ($000) ($000) ($000)
Civil Service Pension Fund 34,626 9,175 (37,974) 14,529 20,356 Teachers Pension Fund 12,200 5,732 (8,714) 10,676 19,894 MLA Pension Fund 384 (323) (193) 759 627 MLA Plan (Supplementary) 440 452 - (157) 735 Senior Comp. Pension Plan 528 763 - (22) 1,269 Judges Pension Plan (Old) 39 201 - (130) 110 Judges Pension Plan (New) 65 48 - 4 117 Total Pension 48,282 16,048 (46,881) 25,659 43,108
Retirement Pay 5,659 3,812 - 1,437 10,908 Death Benefits 263 344 - 285 892 Workers Compensation 36 36 (5,270) (15) (5,213) Total Other 5,958 4,192 (5,270) 1,707 6,586
Totals 54,240 20,240 (52,151) 27,366 49,694
(e) Other Pension Plans Health PEI Salaried physicians maintain their own personal RRSP accounts to which Health PEI makes contributions in accordance with the Master Agreement between the Medical Society of Prince Edward Island and the Province of Prince Edward Island. Health PEI’s contributions are equivalent to the pension contributions the employer would have otherwise made had the physician been eligible to participate in the pension plan as defined by the Civil Service Superannuation Act. Health PEI’s liability is limited to its required contributions in accordance with the agreement.
School Boards Support employees of the three school boards are part of the P.E.I. Education Sector Pension Plan (ESPP). The pension plan has both defined benefit and defined contribution components. Contributions to the defined contribution component ceased on June 30, 2007 and the plan became a fully defined benefit plan for service after this date. Members who made contributions to the defined contribution component before June 30, 2007, who are still employed, would still have accounts with SunLife Financial. According to the most recent funding actuarial report, dated January 1, 2010, the plan had an unfunded liability in the amount of $11.8 million. For the ESPP, the Province records expenses equal to the employer contributions. It is the obligation of the Province to contribute the employer’s portion as per the provisions of the plan text. It is the responsibility of the Pension Committee to ensure that the contributions are sufficient to fund the benefits provided. If the Plan’s financial position is insufficient to fully fund future and accrued benefits then the Pension Committee is responsible for amending the Plan to decrease the benefits proportionately to such amounts as are required to ensure that the members’ and employer’s contributions are sufficient to fully fund the benefits. Subsequent to the valuation, a plan amendment related to indexing was approved.
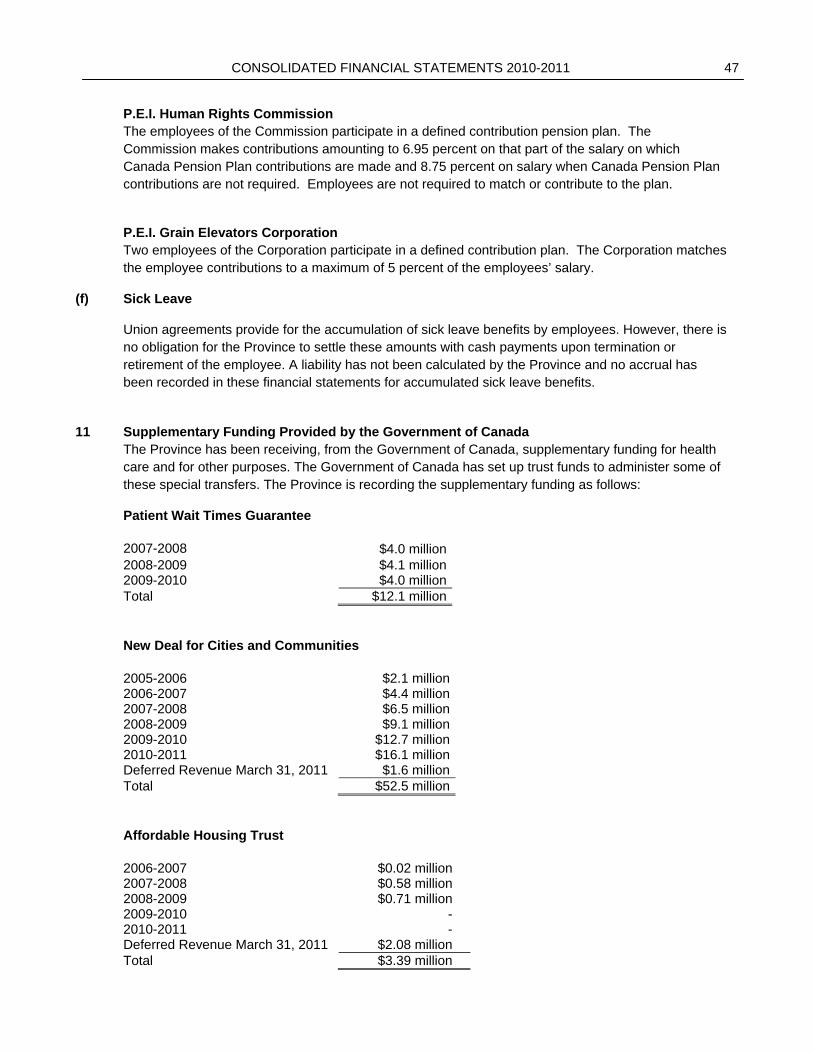
CONSOLIDATED FINANCIAL STATEMENTS 2010-2011 47
P.E.I. Human Rights Commission The employees of the Commission participate in a defined contribution pension plan. The Commission makes contributions amounting to 6.95 percent on that part of the salary on which Canada Pension Plan contributions are made and 8.75 percent on salary when Canada Pension Plan contributions are not required. Employees are not required to match or contribute to the plan.
P.E.I. Grain Elevators Corporation Two employees of the Corporation participate in a defined contribution plan. The Corporation matches the employee contributions to a maximum of 5 percent of the employees’ salary.
(f) Sick Leave
Union agreements provide for the accumulation of sick leave benefits by employees. However, there is no obligation for the Province to settle these amounts with cash payments upon termination or retirement of the employee. A liability has not been calculated by the Province and no accrual has been recorded in these financial statements for accumulated sick leave benefits.
11 Supplementary Funding Provided by the Government of Canada The Province has been receiving, from the Government of Canada, supplementary funding for health care and for other purposes. The Government of Canada has set up trust funds to administer some of these special transfers. The Province is recording the supplementary funding as follows:
Patient Wait Times Guarantee
2007-2008 $4.0 million2008-2009 $4.1 million2009-2010 $4.0 millionTotal $12.1 million
New Deal for Cities and Communities
2005-2006 $2.1 million2006-2007 $4.4 million2007-2008 $6.5 million2008-2009 $9.1 million2009-2010 2010-2011
$12.7 million$16.1 million
Deferred Revenue March 31, 2011 $1.6 millionTotal $52.5 million
Affordable Housing Trust
2006-2007 $0.02 million 2007-2008 $0.58 million 2008-2009 $0.71 million 2009-2010 - 2010-2011 - Deferred Revenue March 31, 2011 $2.08 million Total $3.39 million
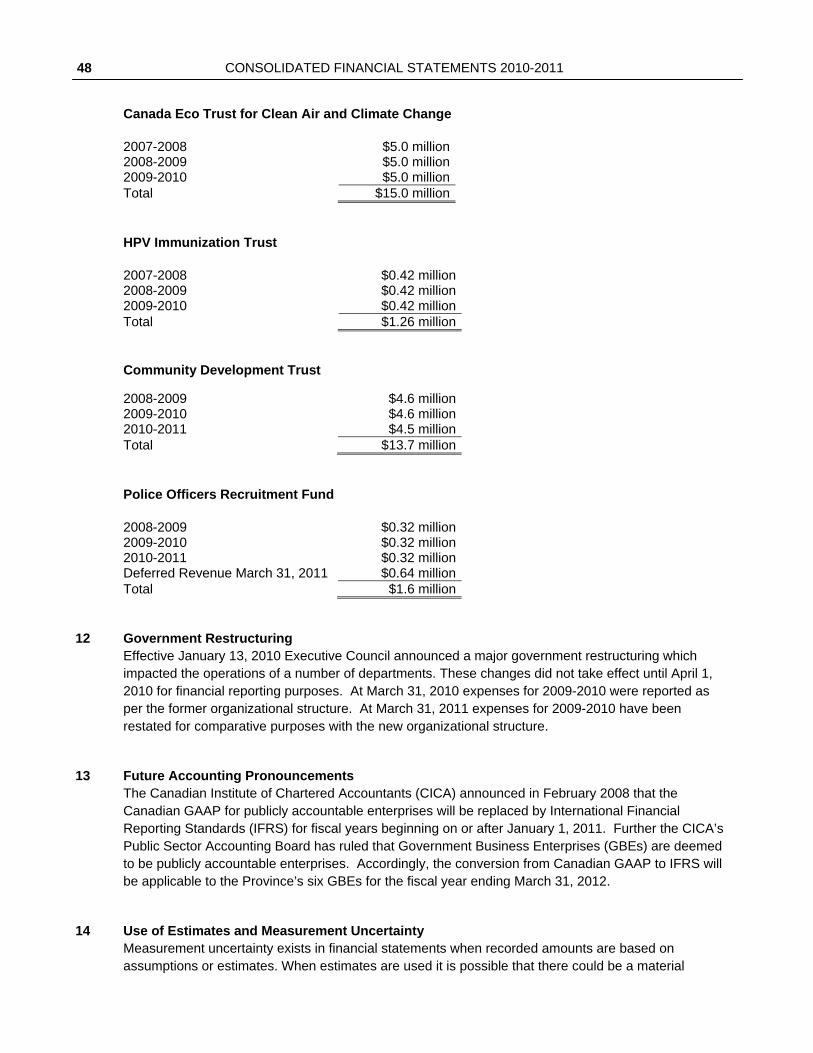
48 CONSOLIDATED FINANCIAL STATEMENTS 2010-2011
Canada Eco Trust for Clean Air and Climate Change 2007-2008 $5.0 million2008-2009 $5.0 million2009-2010 $5.0 millionTotal $15.0 million
HPV Immunization Trust
2007-2008 $0.42 million2008-2009 $0.42 million2009-2010 $0.42 millionTotal $1.26 million
Community Development Trust
2008-2009 $4.6 million2009-2010 $4.6 million2010-2011 $4.5 millionTotal $13.7 million
Police Officers Recruitment Fund
2008-2009 $0.32 million2009-2010 $0.32 million2010-2011 $0.32 millionDeferred Revenue March 31, 2011 $0.64 millionTotal $1.6 million
12 Government Restructuring Effective January 13, 2010 Executive Council announced a major government restructuring which impacted the operations of a number of departments. These changes did not take effect until April 1, 2010 for financial reporting purposes. At March 31, 2010 expenses for 2009-2010 were reported as per the former organizational structure. At March 31, 2011 expenses for 2009-2010 have been restated for comparative purposes with the new organizational structure.
13 Future Accounting Pronouncements The Canadian Institute of Chartered Accountants (CICA) announced in February 2008 that the Canadian GAAP for publicly accountable enterprises will be replaced by International Financial Reporting Standards (IFRS) for fiscal years beginning on or after January 1, 2011. Further the CICA’s Public Sector Accounting Board has ruled that Government Business Enterprises (GBEs) are deemed to be publicly accountable enterprises. Accordingly, the conversion from Canadian GAAP to IFRS will be applicable to the Province’s six GBEs for the fiscal year ending March 31, 2012.
14 Use of Estimates and Measurement Uncertainty Measurement uncertainty exists in financial statements when recorded amounts are based on assumptions or estimates. When estimates are used it is possible that there could be a material
CONSOLIDATED FINANCIAL STATEMENTS 2010-2011 49
variance between the recorded amount and another reasonably possible amount. The accuracy of estimates depends on the completeness and quality of information available at the time of preparation of financial statements. Estimates are adjusted annually to reflect new information as it becomes available. Measurement uncertainty exists in these financial statements in the accruals for such items as future pension, retirement and other obligations, environmental remediation obligations, various federal and provincial revenues and provisions for losses on loans and accounts receivable. The nature of uncertainty in the accruals for pension, retirement and other obligations arises because actual results may differ significantly from the province’s various assumptions about plan members and economic conditions in the market place. Uncertainty exists for environmental remediation obligations because the actual extent of remediation activities required may differ significantly based on the actual extent of site contamination and the chosen remediation process. Uncertainty related to federal and provincial revenues arises because of the possible differences between the estimated and actual economic growth and other assumptions used to accrue these revenues. Uncertainty related to loan provisions arises due to assumptions on economic conditions in the market place and the financial health of loan recipients. Measurement uncertainty also exists in the estimate of useful life of tangible capital assets.
15 Over Expenditure In accordance with section 37 of the Financial Administration Act a special warrant may be obtained authorizing payment out of the Operating Fund for any payments over and above those amounts originally authorized by the Legislative Assembly. A special warrant made under this section is deemed to be an appropriation for the fiscal year for which the warrant is made.
16 Prior Period Comparative Figures Certain prior period comparatives have been restated to conform to the presentation format adopted in the current period.
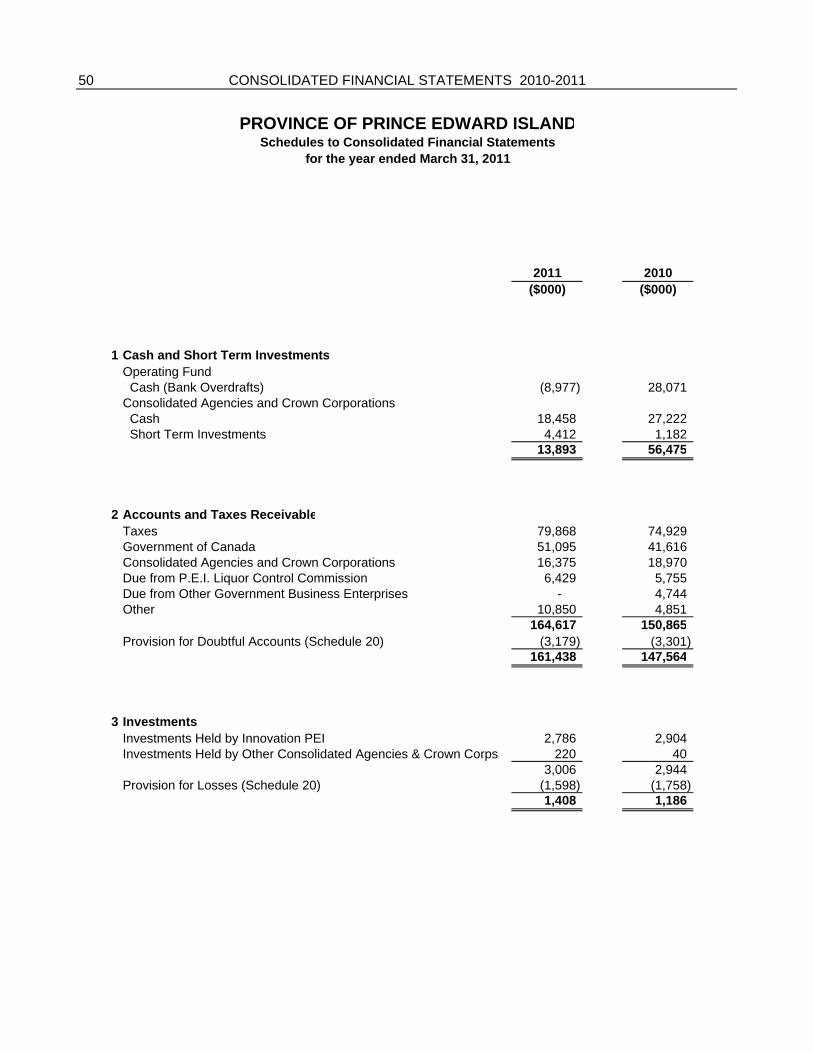
50
2011 2010($000) ($000)
1 Cash and Short Term InvestmentsOperating Fund Cash (Bank Overdrafts) (8,977) 28,071 Consolidated Agencies and Crown Corporations Cash 18,458 27,222 Short Term Investments 4,412 1,182
13,893 56,475
2 Accounts and Taxes ReceivableTaxes 79,868 74,929 Government of Canada 51,095 41,616 Consolidated Agencies and Crown Corporations 16,375 18,970 Due from P.E.I. Liquor Control Commission 6,429 5,755 Due from Other Government Business Enterprises - 4,744 Other 10,850 4,851
164,617 150,865 Provision for Doubtful Accounts (Schedule 20) (3,179) (3,301)
161,438 147,564
3 Investments Investments Held by Innovation PEI 2,786 2,904 Investments Held by Other Consolidated Agencies & Crown Corps 220 40
3,006 2,944 Provision for Losses (Schedule 20) (1,598) (1,758)
1,408 1,186
CONSOLIDATED FINANCIAL STATEMENTS 2010-2011
PROVINCE OF PRINCE EDWARD ISLANDSchedules to Consolidated Financial Statements
for the year ended March 31, 2011
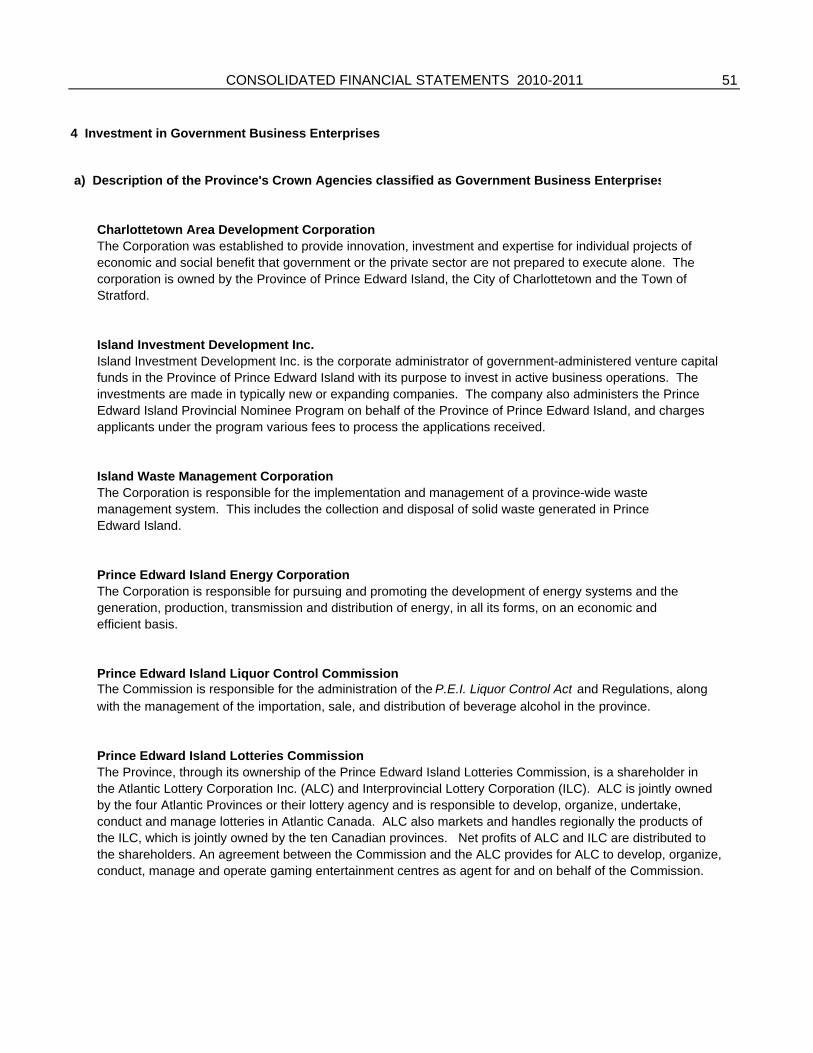
51
4 Investment in Government Business Enterprises
a) Description of the Province's Crown Agencies classified as Government Business Enterprises
Charlottetown Area Development Corporation The Corporation was established to provide innovation, investment and expertise for individual projects of economic and social benefit that government or the private sector are not prepared to execute alone. The corporation is owned by the Province of Prince Edward Island, the City of Charlottetown and the Town of Stratford.
Island Investment Development Inc. Island Investment Development Inc. is the corporate administrator of government-administered venture capital funds in the Province of Prince Edward Island with its purpose to invest in active business operations. The investments are made in typically new or expanding companies. The company also administers the Prince Edward Island Provincial Nominee Program on behalf of the Province of Prince Edward Island, and charges applicants under the program various fees to process the applications received.
Island Waste Management CorporationThe Corporation is responsible for the implementation and management of a province-wide waste management system. This includes the collection and disposal of solid waste generated in Prince Edward Island.
Prince Edward Island Energy Corporation The Corporation is responsible for pursuing and promoting the development of energy systems and thegeneration, production, transmission and distribution of energy, in all its forms, on an economic and efficient basis.
Prince Edward Island Liquor Control Commission The Commission is responsible for the administration of the P.E.I. Liquor Control Act and Regulations, along with the management of the importation, sale, and distribution of beverage alcohol in the province.
Prince Edward Island Lotteries CommissionThe Province, through its ownership of the Prince Edward Island Lotteries Commission, is a shareholder in the Atlantic Lottery Corporation Inc. (ALC) and Interprovincial Lottery Corporation (ILC). ALC is jointly owned by the four Atlantic Provinces or their lottery agency and is responsible to develop, organize, undertake, conduct and manage lotteries in Atlantic Canada. ALC also markets and handles regionally the products of the ILC, which is jointly owned by the ten Canadian provinces. Net profits of ALC and ILC are distributed to the shareholders. An agreement between the Commission and the ALC provides for ALC to develop, organize, conduct, manage and operate gaming entertainment centres as agent for and on behalf of the Commission.
CONSOLIDATED FINANCIAL STATEMENTS 2010-2011
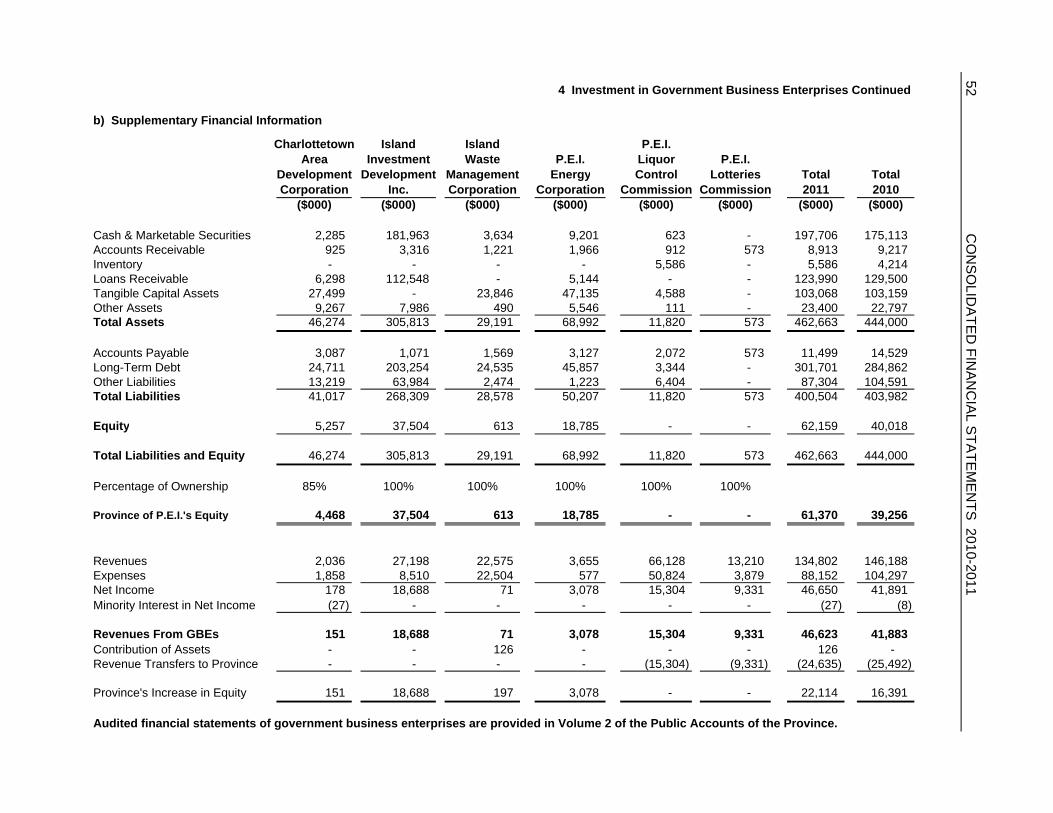
52
b) Supplementary Financial Information
Charlottetown Island Island P.E.I.Area Investment Waste P.E.I. Liquor P.E.I.
Development Development Management Energy Control Lotteries Total TotalCorporation Inc. Corporation Corporation Commission Commission 2011 2010
($000) ($000) ($000) ($000) ($000) ($000) ($000) ($000)
Cash & Marketable Securities 2,285 181,963 3,634 9,201 623 - 197,706 175,113 Accounts Receivable 925 3,316 1,221 1,966 912 573 8,913 9,217 Inventory - - - - 5,586 - 5,586 4,214 Loans Receivable 6,298 112,548 - 5,144 - - 123,990 129,500 Tangible Capital Assets 27,499 - 23,846 47,135 4,588 - 103,068 103,159 Other Assets 9,267 7,986 490 5,546 111 - 23,400 22,797 Total Assets 46,274 305,813 29,191 68,992 11,820 573 462,663 444,000
Accounts Payable 3,087 1,071 1,569 3,127 2,072 573 11,499 14,529 Long-Term Debt 24,711 203,254 24,535 45,857 3,344 - 301,701 284,862 Other Liabilities 13,219 63,984 2,474 1,223 6,404 - 87,304 104,591 Total Liabilities 41,017 268,309 28,578 50,207 11,820 573 400,504 403,982
Equity 5,257 37,504 613 18,785 - - 62,159 40,018
Total Liabilities and Equity 46,274 305,813 29,191 68,992 11,820 573 462,663 444,000
Percentage of Ownership 85% 100% 100% 100% 100% 100%
Province of P.E.I.'s Equity 4,468 37,504 613 18,785 - - 61,370 39,256
Revenues 2,036 27,198 22,575 3,655 66,128 13,210 134,802 146,188 Expenses 1,858 8,510 22,504 577 50,824 3,879 88,152 104,297 Net Income 178 18,688 71 3,078 15,304 9,331 46,650 41,891 Minority Interest in Net Income (27) - - - - - (27) (8)
Revenues From GBEs 151 18,688 71 3,078 15,304 9,331 46,623 41,883 Contribution of Assets - - 126 - - - 126 - Revenue Transfers to Province - - - - (15,304) (9,331) (24,635) (25,492)
Province's Increase in Equity 151 18,688 197 3,078 - - 22,114 16,391
Audited financial statements of government business enterprises are provided in Volume 2 of the Public Accounts of the Province.
4 Investment in Government Business Enterprises ContinuedC
ON
SO
LIDA
TED
FINA
NC
IAL S
TATE
ME
NTS
2010-2011
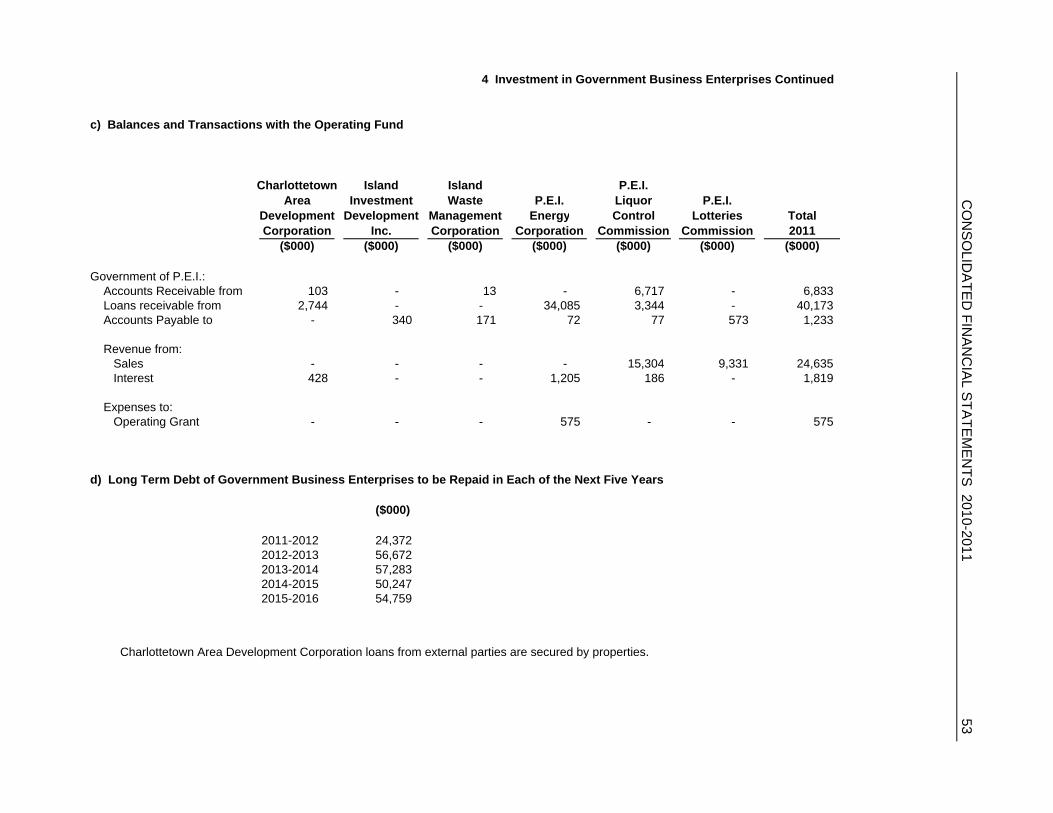
c) Balances and Transactions with the Operating Fund
Charlottetown Island Island P.E.I.Area Investment Waste P.E.I. Liquor P.E.I.
Development Development Management Energy Control Lotteries TotalCorporation Inc. Corporation Corporation Commission Commission 2011
($000) ($000) ($000) ($000) ($000) ($000) ($000)
Government of P.E.I.: Accounts Receivable from 103 - 13 - 6,717 - 6,833 Loans receivable from 2,744 - - 34,085 3,344 - 40,173 Accounts Payable to - 340 171 72 77 573 1,233
Revenue from: Sales - - - - 15,304 9,331 24,635 Interest 428 - - 1,205 186 - 1,819
Expenses to: Operating Grant - - - 575 - - 575
d) Long Term Debt of Government Business Enterprises to be Repaid in Each of the Next Five Years
($000)
2011-2012 24,372 2012-2013 56,672 2013-2014 57,283 2014-2015 50,247 2015-2016 54,759
Charlottetown Area Development Corporation loans from external parties are secured by properties.
53 4 Investment in Government Business Enterprises Continued
CO
NS
OLID
ATE
D FIN
AN
CIA
L STA
TEM
EN
TS 2010-2011
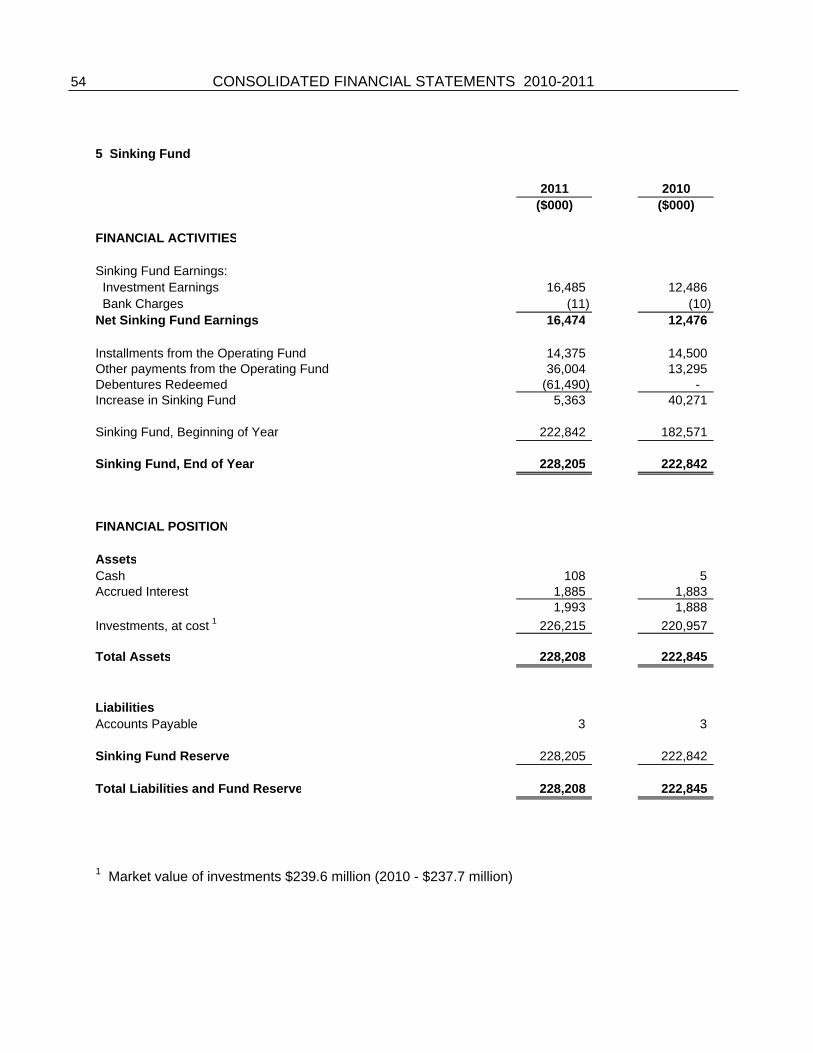
54
2011 2010($000) ($000)
FINANCIAL ACTIVITIES
Sinking Fund Earnings: Investment Earnings 16,485 12,486 Bank Charges (11) (10) Net Sinking Fund Earnings 16,474 12,476
Installments from the Operating Fund 14,375 14,500 Other payments from the Operating Fund 36,004 13,295 Debentures Redeemed (61,490) - Increase in Sinking Fund 5,363 40,271
Sinking Fund, Beginning of Year 222,842 182,571
Sinking Fund, End of Year 228,205 222,842
FINANCIAL POSITION
AssetsCash 108 5 Accrued Interest 1,885 1,883
1,993 1,888 Investments, at cost 1 226,215 220,957
Total Assets 228,208 222,845
LiabilitiesAccounts Payable 3 3
Sinking Fund Reserve 228,205 222,842
Total Liabilities and Fund Reserve 228,208 222,845
1 Market value of investments $239.6 million (2010 - $237.7 million)
CONSOLIDATED FINANCIAL STATEMENTS 2010-2011
5 Sinking Fund
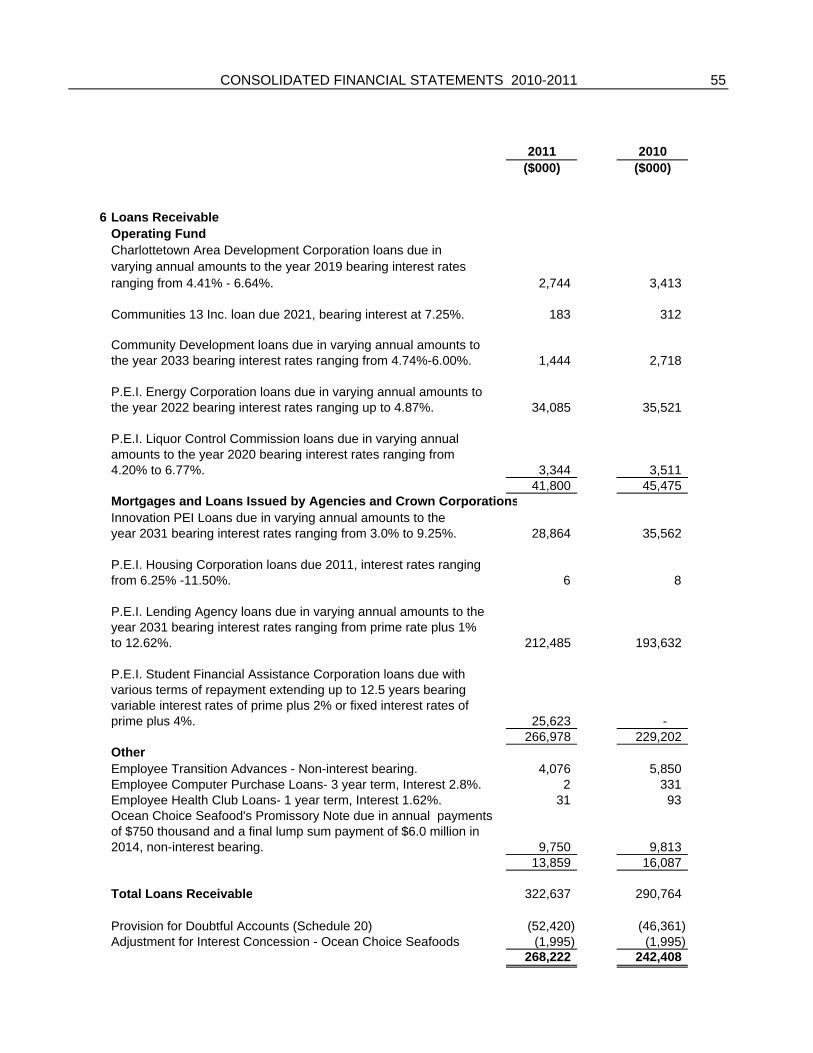
55
2011 2010($000) ($000)
6 Loans Receivable Operating FundCharlottetown Area Development Corporation loans due in varying annual amounts to the year 2019 bearing interest rates ranging from 4.41% - 6.64%. 2,744 3,413
Communities 13 Inc. loan due 2021, bearing interest at 7.25%. 183 312
Community Development loans due in varying annual amounts to the year 2033 bearing interest rates ranging from 4.74%-6.00%. 1,444 2,718
P.E.I. Energy Corporation loans due in varying annual amounts to the year 2022 bearing interest rates ranging up to 4.87%. 34,085 35,521
P.E.I. Liquor Control Commission loans due in varying annual amounts to the year 2020 bearing interest rates ranging from 4.20% to 6.77%. 3,344 3,511
41,800 45,475
CONSOLIDATED FINANCIAL STATEMENTS 2010-2011
, ,Mortgages and Loans Issued by Agencies and Crown CorporationsInnovation PEI Loans due in varying annual amounts to the year 2031 bearing interest rates ranging from 3.0% to 9.25%. 28,864 35,562
P.E.I. Housing Corporation loans due 2011, interest rates ranging from 6.25% -11.50%. 6 8
P.E.I. Lending Agency loans due in varying annual amounts to theyear 2031 bearing interest rates ranging from prime rate plus 1%to 12.62%. 212,485 193,632
P.E.I. Student Financial Assistance Corporation loans due withvarious terms of repayment extending up to 12.5 years bearing variable interest rates of prime plus 2% or fixed interest rates ofprime plus 4%. 25,623 -
266,978 229,202 OtherEmployee Transition Advances - Non-interest bearing. 4,076 5,850 Employee Computer Purchase Loans- 3 year term, Interest 2.8%. 2 331 Employee Health Club Loans- 1 year term, Interest 1.62%. 31 93 Ocean Choice Seafood's Promissory Note due in annual paymentsof $750 thousand and a final lump sum payment of $6.0 million in 2014, non-interest bearing. 9,750 9,813
13,859 16,087
Total Loans Receivable 322,637 290,764
Provision for Doubtful Accounts (Schedule 20) (52,420) (46,361) Adjustment for Interest Concession - Ocean Choice Seafoods (1,995) (1,995)
268,222 242,408
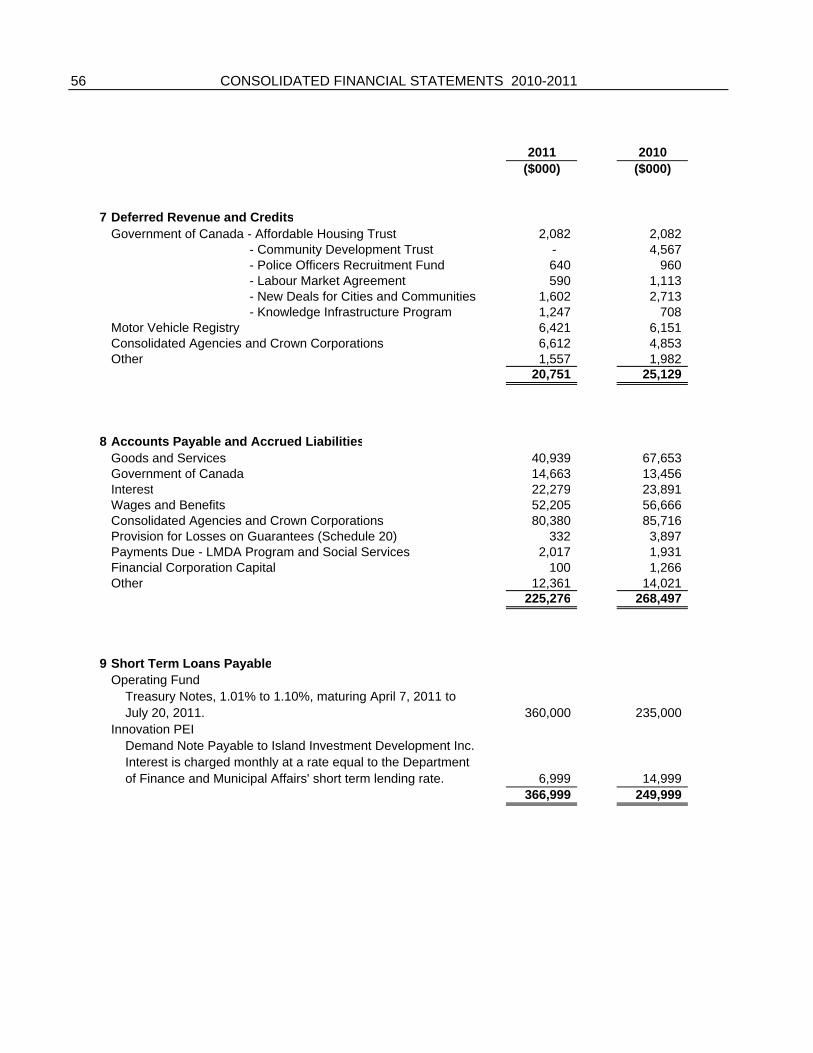
56
2011 2010($000) ($000)
7 Deferred Revenue and CreditsGovernment of Canada - Affordable Housing Trust 2,082 2,082 - Community Development Trust - 4,567 - Police Officers Recruitment Fund 640 960 - Labour Market Agreement 590 1,113 - New Deals for Cities and Communities 1,602 2,713 - Knowledge Infrastructure Program 1,247 708 Motor Vehicle Registry 6,421 6,151 Consolidated Agencies and Crown Corporations 6,612 4,853 Other 1,557 1,982
20,751 25,129
8 Accounts Payable and Accrued LiabilitiesGoods and Services 40,939 67,653 Government of Canada 14,663 13,456 Interest 22,279 23,891
CONSOLIDATED FINANCIAL STATEMENTS 2010-2011
Interest 22,279 23,891 Wages and Benefits 52,205 56,666 Consolidated Agencies and Crown Corporations 80,380 85,716 Provision for Losses on Guarantees (Schedule 20) 332 3,897 Payments Due - LMDA Program and Social Services 2,017 1,931 Financial Corporation Capital 100 1,266 Other 12,361 14,021
225,276 268,497
9 Short Term Loans PayableOperating Fund Treasury Notes, 1.01% to 1.10%, maturing April 7, 2011 to July 20, 2011. 360,000 235,000 Innovation PEI Demand Note Payable to Island Investment Development Inc. Interest is charged monthly at a rate equal to the Department of Finance and Municipal Affairs' short term lending rate. 6,999 14,999
366,999 249,999
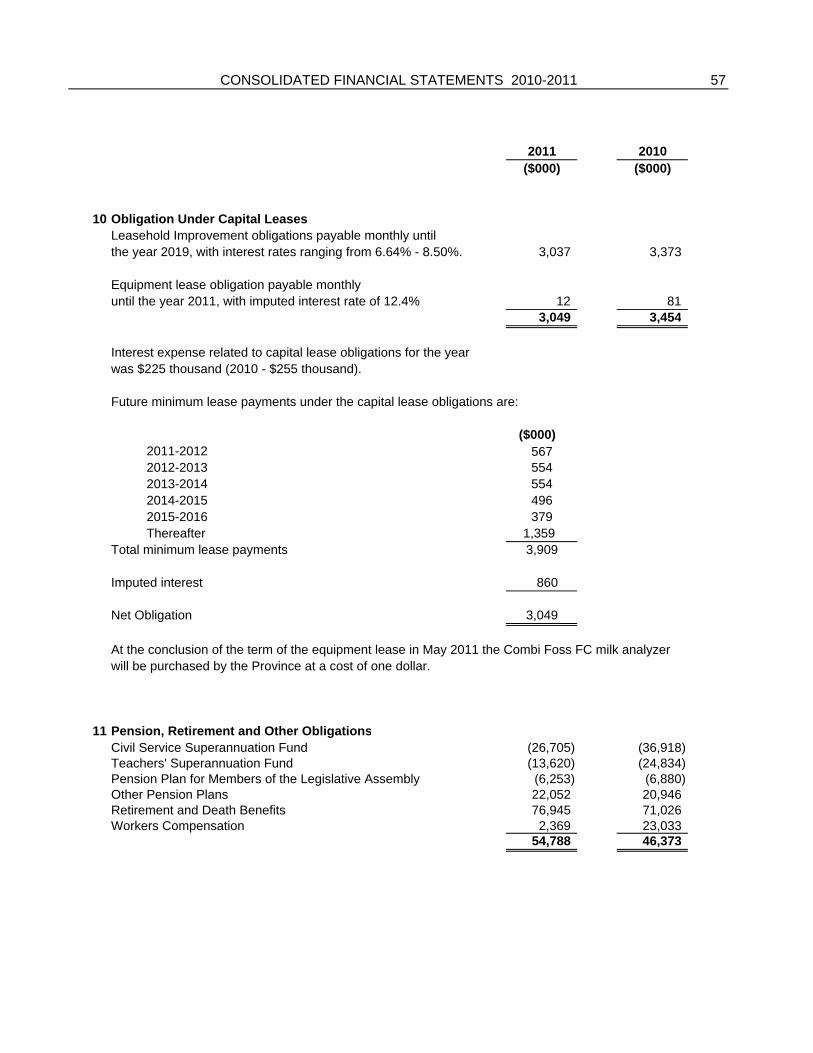
57
2011 2010($000) ($000)
10 Obligation Under Capital LeasesLeasehold Improvement obligations payable monthly untilthe year 2019, with interest rates ranging from 6.64% - 8.50%. 3,037 3,373
Equipment lease obligation payable monthlyuntil the year 2011, with imputed interest rate of 12.4% 12 81
3,049 3,454
Interest expense related to capital lease obligations for the year was $225 thousand (2010 - $255 thousand).
Future minimum lease payments under the capital lease obligations are:
($000) 2011-2012 567 2012-2013 554 2013-2014 554
CONSOLIDATED FINANCIAL STATEMENTS 2010-2011
2014-2015 496 2015-2016 379 Thereafter 1,359Total minimum lease payments 3,909
Imputed interest 860
Net Obligation 3,049
At the conclusion of the term of the equipment lease in May 2011 the Combi Foss FC milk analyzer will be purchased by the Province at a cost of one dollar.
11 Pension, Retirement and Other ObligationsCivil Service Superannuation Fund (26,705) (36,918) Teachers' Superannuation Fund (13,620) (24,834) Pension Plan for Members of the Legislative Assembly (6,253) (6,880) Other Pension Plans 22,052 20,946 Retirement and Death Benefits 76,945 71,026 Workers Compensation 2,369 23,033
54,788 46,373
58
2011 2010($000) ($000)
12 Loans Payable
Operating Fund Government of Canada, non-interest bearing, maturing March 31, 2016, payable in monthly installments of $316,567. 18,994 22,793 Adjustment for Interest Concession. (2,081) (2,925)
16,913 19,868 Teachers' Superannuation Fund, 4.35%, maturing April 15, 2014, with interest payable semi-annually and principal payments of $16.0 million payable annually. 64,000 80,000
Civil Service Superannuation Fund, 4.41%, maturing October 15, 2015, with interest payable semi-annually and principal payments of $5.2 million payable annually. 26,000 31,200
Consolidated Agencies and Crown Corporations Innovation PEI Bank of Nova Scotia, 6.62%, maturing August 30, 2017, payable in monthly installments of $40,333 plus interest. 7,946 8,430
CONSOLIDATED FINANCIAL STATEMENTS 2010-2011
p y y $ , p , ,
Island Investment Development Inc., 4% Note Payable, due January 2013. 1,430 1,430
Island Investment Development Inc., 4% Note Payable, due March 1, 2015, with interest to be paid quarterly and principal due at maturity. - 857
Island Investment Development Inc., 4% Note Payable, due January 2012. 557 557
Manulife Financial, 6.01% note payable, due December 2024, repayable $88,025 monthly including principal and interest. 9,912 10,365
Manulife Financial, 5.54% note payable, due December 2024, repayable $7,969 monthly including principal and interest. 923 966
The Manulife Financial notes payable are secured by a general security agreement covering certain property holdings.
P.E.I. Grain Elevators Corporation Scotiabank, prime plus 0.25% line of credit, maturing May 16, 2013, repayable $12,500 monthly including principal and interest. 1,213 1,363
Scotiabank, interest at prime note payable, due July 30 2014, repayable $6,000 monthly plus interest. 655 721
59
2011 2010($000) ($000)
12 Loans Payable continued
P.E.I. Housing Corporation Canada Mortgage and Housing Corp. - Mortgages Payable 19,171 20,543 - Debentures Payable 3,089 3,225 Interest rates range - 2.65% to 11% Maturity dates range - 2011 to 2029
Loans and debentures are secured by properties.
Summerside Regional Development Corporation P.E.I. Century 2000 Fund Inc, 4.00% note payable, due February 2013, repayment terms to be determined in December 2011. 2,292 2,204
P.E.I. Century 2000 Fund Inc, 4.00% note payable, due September 2014, repayment terms to be determined in
CONSOLIDATED FINANCIAL STATEMENTS 2010-2011
p , p y December 2011. 1,640 1,576
P.E.I. Century 2000 Fund Inc, 4.00% note payable, due February 2016, repayment terms to be determined in December 2011. 449 -
P.E.I. Century 2000 Fund Inc, 4.00% note payable, due September 2014, repayable in monthly payments of principal and interest of $3,937. 364 -
As security for the notes payable the company has provided a first collateral mortgage on the Holman Centre.
156,554 183,305
Principal repayment requirements over the next five years on outstanding loans payable are as follows:
($000) 2011-2012 34,545 2012-2013 31,079 2013-2014 30,686 2014-2015 29,900 2015-2016 11,720
137,930
60
13 Debentures and Sinking Fund
Net NetGross Funded Funded
Issue Maturity Interest Term of Funded Debt DebtDate Date Rate Years Debt Sinking Fund 2011 2010
($000) ($000) ($000) ($000)Public Issues:16-Aug-90 16-Aug-10 11.500% 20 - - - 27,224 14-Mar-91 14-Mar-11 11.000% 20 - - - 24,910 19-Sep-91 19-Sep-11 11.000% 20 50,000 26,318 23,682 25,841 17-Dec-92 17-Dec-12 9.750% 20 50,000 22,776 27,224 29,165 18-Mar-93 18-Mar-13 9.250% 20 60,000 31,513 28,487 31,194 12-Mar-09 02-Jun-14 3.200% 5 100,000 - 100,000 100,000 27-Oct-95 27-Oct-15 8.500% 20 75,000 29,793 45,207 48,050 15-Sep-09 24-Sep-19 4.250% 10 100,000 - 100,000 100,000 25-Aug-10 02-Sep-20 3.700% 10 100,000 - 100,000 - 15-Dec-93 15-Dec-23 8.500% 30 60,000 29,381 30,619 33,214 03-Sep-02 29-Jul-27 6.100% 25 100,000 13,064 86,936 88,932 21-Feb-00 21-Feb-30 6.800% 30 80,000 18,573 61,427 63,659 29-Jan-02 29-Jan-32 6.250% 30 100,000 17,693 82,307 84,776 12-Jun-03 21-Feb-34 5.600% 30 100,000 12,590 87,410 89,336 30-Sep-04 15-Jun-35 5.700% 30 100,000 9,176 90,824 92,599 10-Feb-05 19-May-36 5.300% 31 100,000 7,413 92,587 94,264 12-Sep-05 19-Nov-37 4.650% 32 100,000 7,189 92,811 94,438 17-Mar-10 19-Nov-37 4.650% 27 100,000 1,278 98,722 100,000 16-Mar-11 19-May-41 4.600% 30 100,000 - 100,000 -
1,475,000 226,757 1,248,243 1,127,602 Canada Pension Plan Issues
1990-91 2010-2011 10.846% 20 - - - 9,603 1991-92 2011-2012 9.919% 20 9,794 - 9,794 9,794 1992-93 2012-2013 9.368% 20 6,971 - 6,971 6,971 1998-99 2018-2019 5.930% 20 376 - 376 376 1999-00 2019-2020 6.347% 20 7,332 - 7,332 7,332 2000-01 2020-2021 6.681% 20 9,136 - 9,136 9,136 2001-02 2021-2022 6.593% 20 11,374 - 11,374 11,374 2002-03 2022-2023 6.285% 20 11,360 - 11,360 11,360 2003-04 2023-2024 5.728% 20 11,135 - 11,135 11,135 2004-05 2024-2025 5.659% 20 10,500 - 10,500 10,500 2005-06 2025-2026 5.212% 20 3,036 - 3,036 3,036 2005-06 2035-2036 4.772% 30 5,939 - 5,939 5,939 2006-07 2036-2037 4.879% 30 13,526 - 13,526 13,526 2007-08 2037-2038 4.851% 30 10,010 - 10,010 10,010 2008-09 2038-2039 4.970% 30 9,703 - 9,703 9,703 2009-10 2039-2040 5.092% 30 10,544 - 10,544 10,544 2010-11 2040-2041 4.818% 30 9,603 - 9,603 -
140,339 - 140,339 140,339
1,615,339 226,757 1,388,582 1,267,941
Debenture Discount (12,632) - (12,632) (10,955) Unfunded (Over-funded) Portion of Fund - 1,448 (1,448) 34,556
Total Debentures and Sinking Fund 1,602,707 228,205 1,374,502 1,291,542
CONSOLIDATED FINANCIAL STATEMENTS 2010-2011
61
13 Debentures and Sinking Fund Continued
The debentures listed on this schedule have been issued in Canadian dollars.
Canada Pension Plan debentures are callable in whole or in part before maturity at the option of theMinister of Finance and Municipal Affairs of Prince Edward Island.
Interest rates are calculated on a weighted average basis.
The unfunded (over-funded) portion of the Sinking Fund represents cash loaned to (borrowed from) the Province's Operating Fund.
Projected Payments Projected payments for the next five years are:
Sinking NetTotal Fund Principal
Repayments Requirements Repayments($000) ($000) ($000)
2011-2012 59,794 26,318 33,476 2012-2013 116,971 54,289 62,682 2013-2014 - - - 2014-2015 100,000 - 100,000 2015-2016 75,000 29,793 45,207
Net principal repayments are comprised of the principal amount due less available designated sinking funds to retire the debenture.
CONSOLIDATED FINANCIAL STATEMENTS 2010-2011
62
Land and Buildings and Leasehold Roads and Motor Total TotalImprovements Improvements Improvements Bridges Vehicles Equipment Other 2011 2010
($000) ($000) ($000) ($000) ($000) ($000) ($000) ($000) ($000)
Cost, beginning of year 43,573 605,983 7,152 879,394 57,883 209,639 81,931 1,885,555 1,747,792
Additions 4,839 41,586 - 54,650 6,624 20,159 1,696 129,554 145,986
Adjustments 28,950 - - - - - - 28,950 -
Disposals (368) (1,153) (343) - (2,112) (856) (645) (5,477) (8,223)
Cost, end of year 76,994 646,416 6,809 934,044 62,395 228,942 82,982 2,038,582 1,885,555
Accumulated Amortization, beginning of year 154 243,955 3,408 626,949 42,091 138,248 40,798 1,095,603 1,051,005
Amortization 11 12,109 323 17,370 4,270 17,066 2,983 54,132 51,020
Disposals / Adjustments - (911) - - (2,042) (806) (103) (3,862) (6,422)
Accumulated Amortization, end of year 165 255,153 3,731 644,319 44,319 154,508 43,678 1,145,873 1,095,603
Net Book Value 76,829 391,263 3,078 289,725 18,076 74,434 39,304 892,709 789,952
Amortization is calculated using the straight line and declining balance methods (see Note 2 (e) ).
Historical cost of land has been increased by $28.9 million based on estimated cost of properties previously recorded at $1 or nil (see Note 3).
The net book value of capital assets not being amortized because they are under construction or development is $64.5 million (2010 - $31.1 million).
No interest was capitalized during the year.
14 Tangible Capital AssetsC
ON
SO
LIDA
TED
FINA
NC
IAL S
TATE
ME
NTS
2010-2011
63
14 Tangible Capital Assets Continued
Leased capital assets are reported as part of the respective asset category. These leased assets are amortized on a straight line basis over the term or estimated economic life. The amortization expense for the year was $362 thousand (2010 - $362 thousand). The cost and accumulated amortization of leased capital assets that are included in the schedule of tangible capital assets are as follows:
2011 2010($000) ($000)
Leasehold Improvements (cost) 6,416 6,416 Less accumulated amortization (3,662) (3,357)
2,754 3,059
Equipment (cost) 281 281 Less accumulated amortization (253) (197)
28 84
CONSOLIDATED FINANCIAL STATEMENTS 2010-2011
64
2011 2010($000) ($000)
15 Deferred Capital ContributionsBalance, beginning of year 70,019 68,364 Contributions Received 21,272 13,020 Amortized to Revenue During the Year (9,479) (11,365) Balance, end of year 81,812 70,019
16 Inventories and Property HoldingsOperating Fund Inventory- Department of Education and Early Childhood 1,230 1,319 Inventory- Department of Health and Wellness 595 285 Inventory- Dept. of Transportation and Infrastructure Renewal 4,401 4,531 Inventory- Miscellaneous - 2 Property Holdings 313 258 Consolidated Agencies and Crown Corporations Inventory - Health PEI 5,463 7,120 Inventory-Other Consolidated Agencies and Crown Corporations 797 1,091 Property Holdings 1,123 783
13,922 15,389 Provision for Losses on Property Holdings (Schedule 20) (592) (315)
13,330 15,074
17 Prepaid and Deferred ChargesOperating Fund 1,115 942 Consolidated Agencies and Crown Corporations 4,367 3,117
5,482 4,059
18 Trust FundsOperating Fund Civil Service Superannuation Fund 967,745 876,163 Pension Plan for MLAs 19,961 19,115 Public Trustee 6,110 6,419 Supreme Court 750 580 Teachers' Superannuation Fund 540,154 492,774 Health PEI 360 370 Eastern School Board - 5 Western School Board 241 448 P.E.I. Museum and Heritage Foundation 713 704
1,536,034 1,396,578
CONSOLIDATED FINANCIAL STATEMENTS 2010-2011
65
19 Guaranteed DebtOutstanding Outstanding
31-Mar-11 31-Mar-10($000) ($000)
1 Lines of Credit / Demand Loans 49 40 2 Debentures / Capital Loans 249,805 226,227 3 Agencies and Crown Corporations 2,853 3,346 4 Student Loans - 25,108
Total Guaranteed Debt 252,707 254,721
Principal Outstanding OutstandingGuaranteed 31-Mar-11 31-Mar-10
($000) ($000) ($000)1 Lines of Credit / Demand Loans
Communities 13 Inc. 100 49 40
2 Debentures / Capital Loans Ch'town Area Dev. Corp. 11,800 5,837 6,477 Communities 13 Inc. 288 178 196 Fathers of Confed. Building 1,000 953 - Island Investment Dev. Inc. 203,254 203,254 179,991 Island Waste Manage. Corp. 30,130 24,535 25,331 L.M.Montgomery Land Trust 1,570 1,342 - PEI Energy Corporation 9,360 4,511 5,246 PEI Energy Savings Bonds 20,000 8,362 8,089 Pownal Sports Centre 1,085 833 897
278,487 249,805 226,227
Both principal and interest are guaranteed for loan guarantees and debenture share issues. During the term authorized, lines of credit may revolve up to the original principal guaranteed plus interest due.
3 Agencies and Crown Corporations 31-Mar-11 31-Mar-10($000) ($000)
Innovation PEI 2,853 3,346
4 Student LoansEffective August 1, 2001 and February 1, 2007 the Province entered into agreements with Credit Union Central of P.E.I. for the funding and delivery of the P.E.I. Student Loan Program. All provincial student loans issued under this program were guaranteed by the Province.
P.E.I. Student Financial Assistance Corporation, a Crown corporation, was established January 1, 2011under the Prince Edward Island Student Financial Assistance Act with the primary function of administering the Prince Edward Island student loan portfolio. All loans previously under the administration of Credit Union Central of PEI were transferred to the P.E.I. Student Financial Assistance Corporation on March 21, 2011.
CONSOLIDATED FINANCIAL STATEMENTS 2010-2011
Maturity Date
01-Aug-11
15-May-13Aug-12 to Mar-18
30-Sep-20Apr-11 to Apr-16
31-Dec-2730-Jun-14 06-Mar-17
May-13 to Dec-16Mar-14 to Mar-24
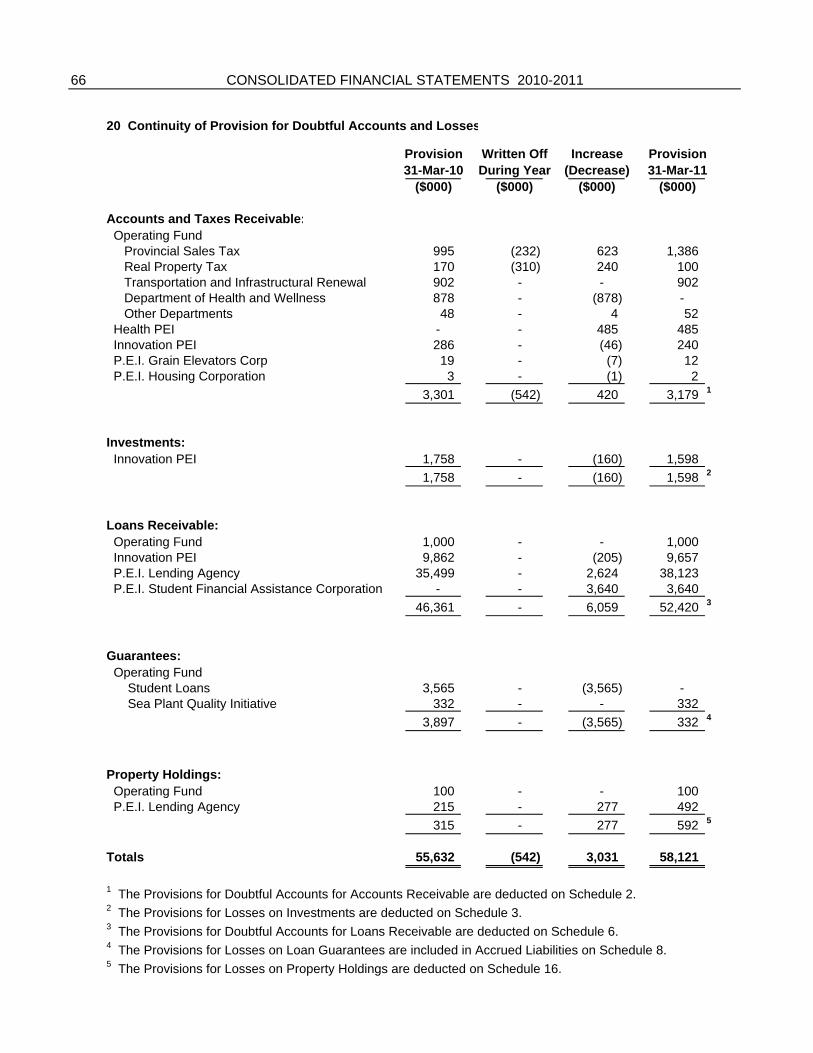
66
20 Continuity of Provision for Doubtful Accounts and Losses
Provision Written Off Increase Provision31-Mar-10 During Year (Decrease) 31-Mar-11
($000) ($000) ($000) ($000)
Accounts and Taxes Receivable: Operating Fund Provincial Sales Tax 995 (232) 623 1,386 Real Property Tax 170 (310) 240 100 Transportation and Infrastructural Renewal 902 - - 902 Department of Health and Wellness 878 - (878) - Other Departments 48 - 4 52 Health PEI - - 485 485 Innovation PEI 286 - (46) 240 P.E.I. Grain Elevators Corp 19 - (7) 12 P.E.I. Housing Corporation 3 - (1) 2
3,301 (542) 420 3,179 1
Investments: Innovation PEI 1,758 - (160) 1,598
1,758 - (160) 1,598 2
Loans Receivable: Operating Fund 1,000 - - 1,000 Innovation PEI 9,862 - (205) 9,657 P.E.I. Lending Agency 35,499 - 2,624 38,123 P.E.I. Student Financial Assistance Corporation - - 3,640 3,640
46,361 - 6,059 52,420 3
Guarantees: Operating Fund Student Loans 3,565 - (3,565) - Sea Plant Quality Initiative 332 - - 332
3,897 - (3,565) 332 4
Property Holdings: Operating Fund 100 - - 100 P.E.I. Lending Agency 215 - 277 492
315 - 277 592 5
Totals 55,632 (542) 3,031 58,121
1 The Provisions for Doubtful Accounts for Accounts Receivable are deducted on Schedule 2.2 The Provisions for Losses on Investments are deducted on Schedule 3.3 The Provisions for Doubtful Accounts for Loans Receivable are deducted on Schedule 6.4 The Provisions for Losses on Loan Guarantees are included in Accrued Liabilities on Schedule 8.5 The Provisions for Losses on Property Holdings are deducted on Schedule 16.
CONSOLIDATED FINANCIAL STATEMENTS 2010-2011
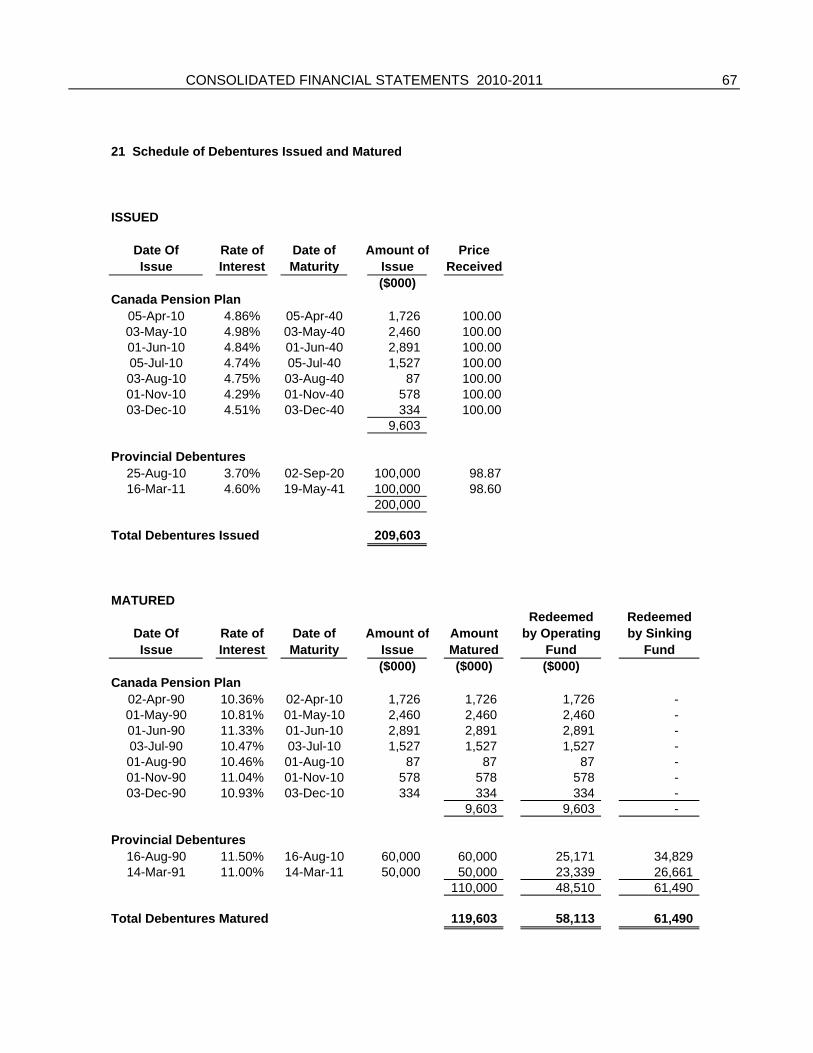
67
21 Schedule of Debentures Issued and Matured
ISSUED
Date Of Rate of Date of Amount of PriceIssue Interest Maturity Issue Received
($000)Canada Pension Plan
05-Apr-10 4.86% 05-Apr-40 1,726 100.0003-May-10 4.98% 03-May-40 2,460 100.0001-Jun-10 4.84% 01-Jun-40 2,891 100.0005-Jul-10 4.74% 05-Jul-40 1,527 100.0003-Aug-10 4.75% 03-Aug-40 87 100.0001-Nov-10 4.29% 01-Nov-40 578 100.0003-Dec-10 4.51% 03-Dec-40 334 100.00
9,603
Provincial Debentures25-Aug-10 3.70% 02-Sep-20 100,000 98.8716-Mar-11 4.60% 19-May-41 100,000 98.60
200,000
Total Debentures Issued 209,603
MATUREDRedeemed Redeemed
Date Of Rate of Date of Amount of Amount by Operating by SinkingIssue Interest Maturity Issue Matured Fund Fund
($000) ($000) ($000)Canada Pension Plan
02-Apr-90 10.36% 02-Apr-10 1,726 1,726 1,726 - 01-May-90 10.81% 01-May-10 2,460 2,460 2,460 - 01-Jun-90 11.33% 01-Jun-10 2,891 2,891 2,891 - 03-Jul-90 10.47% 03-Jul-10 1,527 1,527 1,527 - 01-Aug-90 10.46% 01-Aug-10 87 87 87 - 01-Nov-90 11.04% 01-Nov-10 578 578 578 - 03-Dec-90 10.93% 03-Dec-10 334 334 334 -
9,603 9,603 -
Provincial Debentures16-Aug-90 11.50% 16-Aug-10 60,000 60,000 25,171 34,829 14-Mar-91 11.00% 14-Mar-11 50,000 50,000 23,339 26,661
110,000 48,510 61,490
Total Debentures Matured 119,603 58,113 61,490
CONSOLIDATED FINANCIAL STATEMENTS 2010-2011
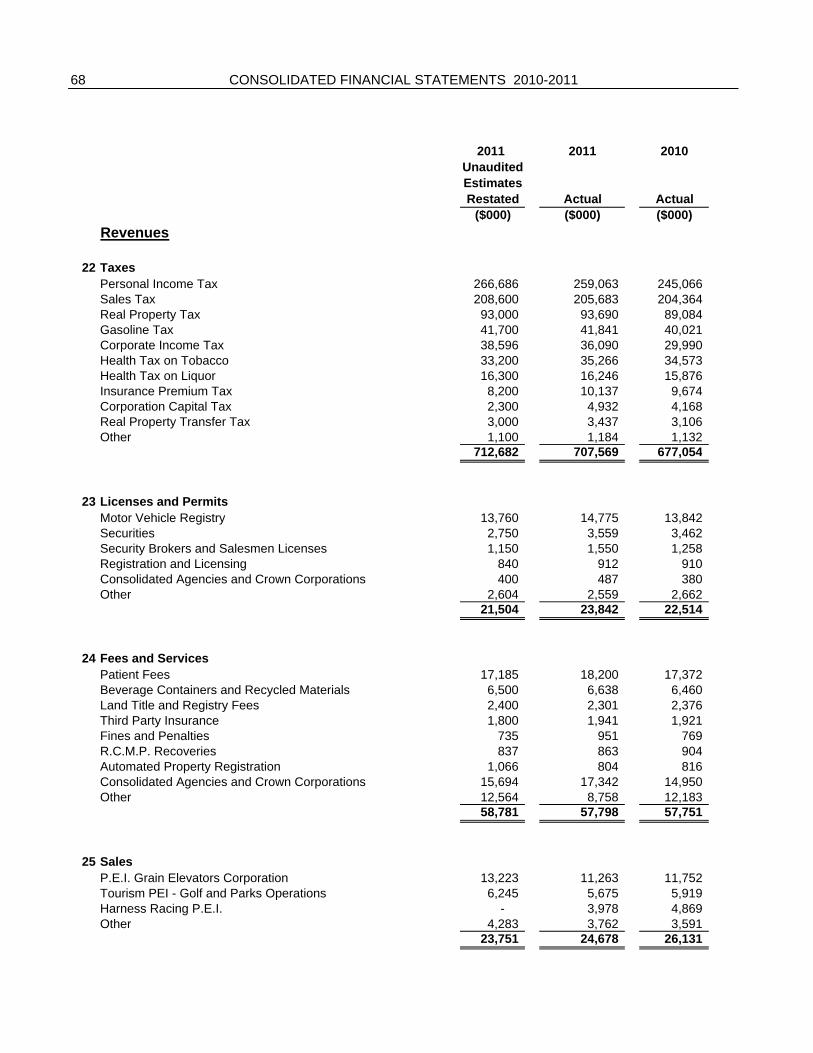
68
2011 2011 2010UnauditedEstimatesRestated Actual Actual
($000) ($000) ($000)Revenues
22 TaxesPersonal Income Tax 266,686 259,063 245,066 Sales Tax 208,600 205,683 204,364 Real Property Tax 93,000 93,690 89,084 Gasoline Tax 41,700 41,841 40,021 Corporate Income Tax 38,596 36,090 29,990 Health Tax on Tobacco 33,200 35,266 34,573 Health Tax on Liquor 16,300 16,246 15,876 Insurance Premium Tax 8,200 10,137 9,674 Corporation Capital Tax 2,300 4,932 4,168 Real Property Transfer Tax 3,000 3,437 3,106 Other 1,100 1,184 1,132
712,682 707,569 677,054
CONSOLIDATED FINANCIAL STATEMENTS 2010-2011
23 Licenses and PermitsMotor Vehicle Registry 13,760 14,775 13,842 Securities 2,750 3,559 3,462 Security Brokers and Salesmen Licenses 1,150 1,550 1,258 Registration and Licensing 840 912 910 Consolidated Agencies and Crown Corporations 400 487 380 Other 2,604 2,559 2,662
21,504 23,842 22,514
24 Fees and ServicesPatient Fees 17,185 18,200 17,372 Beverage Containers and Recycled Materials 6,500 6,638 6,460 Land Title and Registry Fees 2,400 2,301 2,376 Third Party Insurance 1,800 1,941 1,921 Fines and Penalties 735 951 769 R.C.M.P. Recoveries 837 863 904 Automated Property Registration 1,066 804 816 Consolidated Agencies and Crown Corporations 15,694 17,342 14,950 Other 12,564 8,758 12,183
58,781 57,798 57,751
25 SalesP.E.I. Grain Elevators Corporation 13,223 11,263 11,752 Tourism PEI - Golf and Parks Operations 6,245 5,675 5,919 Harness Racing P.E.I. - 3,978 4,869 Other 4,283 3,762 3,591
23,751 24,678 26,131
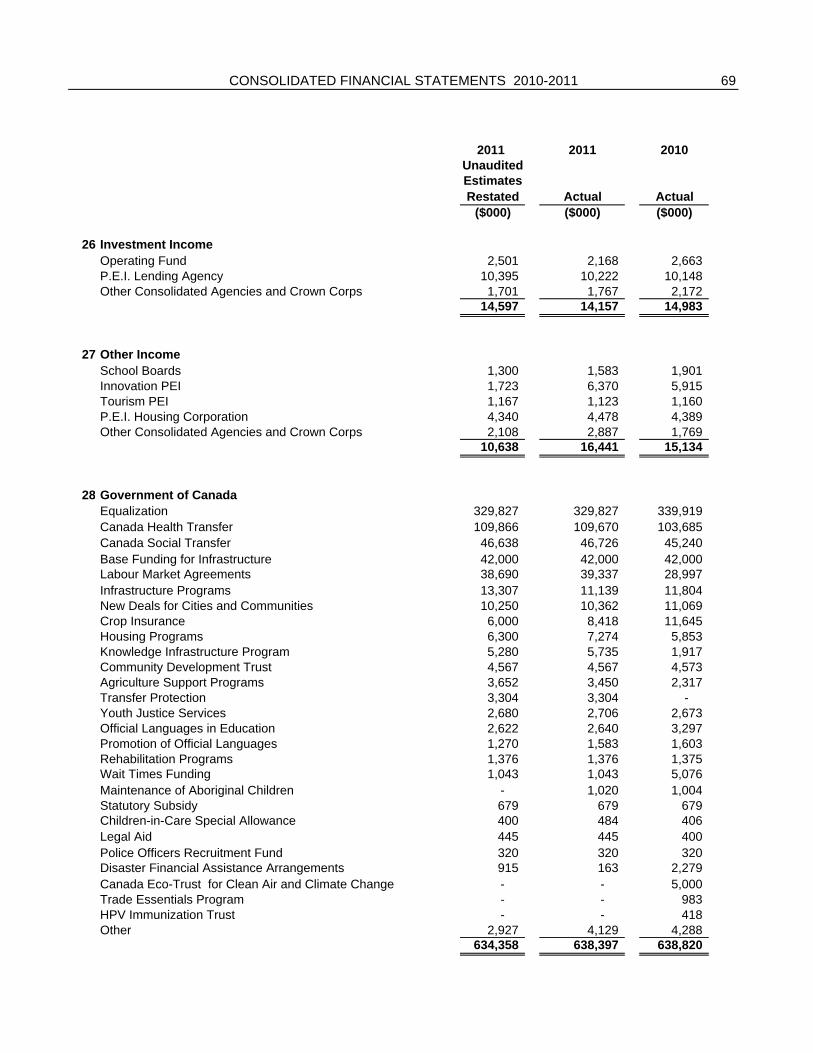
69
2011 2011 2010UnauditedEstimatesRestated Actual Actual
($000) ($000) ($000)
26 Investment IncomeOperating Fund 2,501 2,168 2,663 P.E.I. Lending Agency 10,395 10,222 10,148 Other Consolidated Agencies and Crown Corps 1,701 1,767 2,172
14,597 14,157 14,983
27 Other IncomeSchool Boards 1,300 1,583 1,901 Innovation PEI 1,723 6,370 5,915 Tourism PEI 1,167 1,123 1,160 P.E.I. Housing Corporation 4,340 4,478 4,389 Other Consolidated Agencies and Crown Corps 2,108 2,887 1,769
10,638 16,441 15,134
28 Government of Canada
CONSOLIDATED FINANCIAL STATEMENTS 2010-2011
28 Government of CanadaEqualization 329,827 329,827 339,919 Canada Health Transfer 109,866 109,670 103,685 Canada Social Transfer 46,638 46,726 45,240 Base Funding for Infrastructure 42,000 42,000 42,000 Labour Market Agreements 38,690 39,337 28,997 Infrastructure Programs 13,307 11,139 11,804 New Deals for Cities and Communities 10,250 10,362 11,069 Crop Insurance 6,000 8,418 11,645 Housing Programs 6,300 7,274 5,853 Knowledge Infrastructure Program 5,280 5,735 1,917 Community Development Trust 4,567 4,567 4,573 Agriculture Support Programs 3,652 3,450 2,317 Transfer Protection 3,304 3,304 - Youth Justice Services 2,680 2,706 2,673 Official Languages in Education 2,622 2,640 3,297 Promotion of Official Languages 1,270 1,583 1,603 Rehabilitation Programs 1,376 1,376 1,375 Wait Times Funding 1,043 1,043 5,076 Maintenance of Aboriginal Children - 1,020 1,004 Statutory Subsidy 679 679 679 Children-in-Care Special Allowance 400 484 406 Legal Aid 445 445 400 Police Officers Recruitment Fund 320 320 320 Disaster Financial Assistance Arrangements 915 163 2,279 Canada Eco-Trust for Clean Air and Climate Change - - 5,000 Trade Essentials Program - - 983 HPV Immunization Trust - - 418 Other 2,927 4,129 4,288
634,358 638,397 638,820
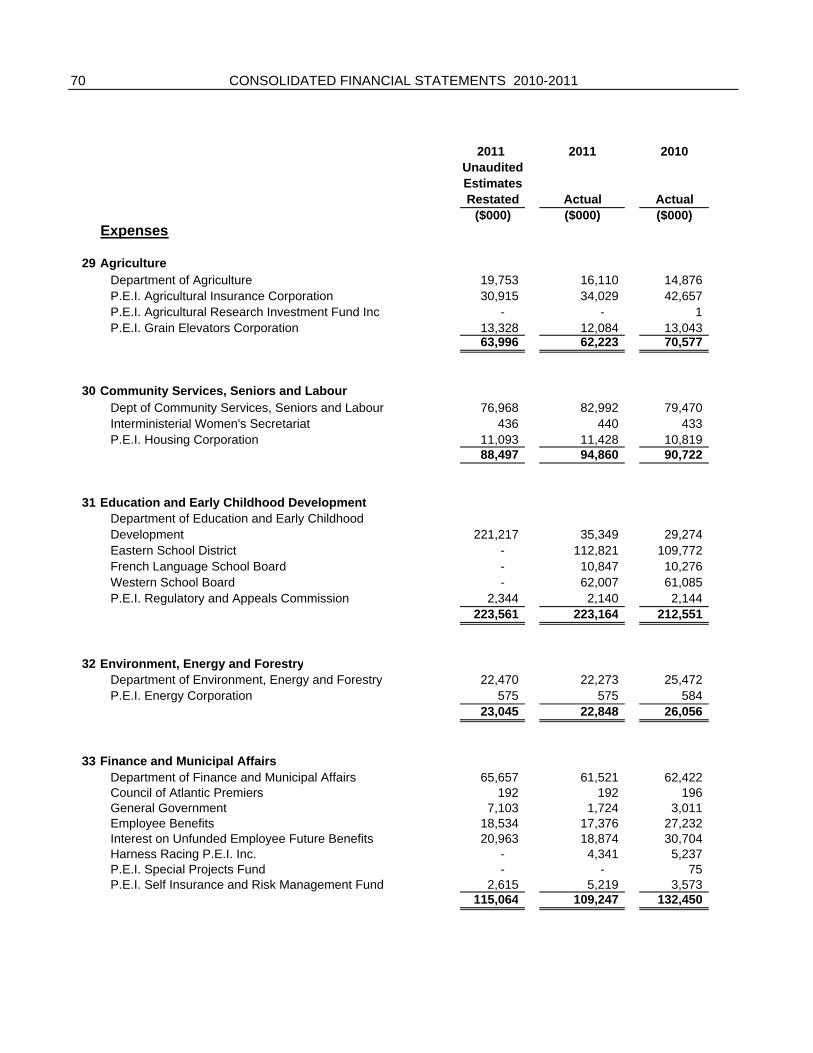
70
2011 2011 2010UnauditedEstimatesRestated Actual Actual
($000) ($000) ($000)Expenses
29 Agriculture Department of Agriculture 19,753 16,110 14,876 P.E.I. Agricultural Insurance Corporation 30,915 34,029 42,657 P.E.I. Agricultural Research Investment Fund Inc - - 1 P.E.I. Grain Elevators Corporation 13,328 12,084 13,043
63,996 62,223 70,577
30 Community Services, Seniors and Labour Dept of Community Services, Seniors and Labour 76,968 82,992 79,470 Interministerial Women's Secretariat 436 440 433 P.E.I. Housing Corporation 11,093 11,428 10,819
88,497 94,860 90,722
CONSOLIDATED FINANCIAL STATEMENTS 2010-2011
31 Education and Early Childhood Development Department of Education and Early Childhood Development 221,217 35,349 29,274 Eastern School District - 112,821 109,772 French Language School Board - 10,847 10,276 Western School Board - 62,007 61,085 P.E.I. Regulatory and Appeals Commission 2,344 2,140 2,144
223,561 223,164 212,551
32 Environment, Energy and Forestry Department of Environment, Energy and Forestry 22,470 22,273 25,472 P.E.I. Energy Corporation 575 575 584
23,045 22,848 26,056
33 Finance and Municipal Affairs Department of Finance and Municipal Affairs 65,657 61,521 62,422 Council of Atlantic Premiers 192 192 196 General Government 7,103 1,724 3,011 Employee Benefits 18,534 17,376 27,232 Interest on Unfunded Employee Future Benefits 20,963 18,874 30,704 Harness Racing P.E.I. Inc. - 4,341 5,237 P.E.I. Special Projects Fund - - 75 P.E.I. Self Insurance and Risk Management Fund 2,615 5,219 3,573
115,064 109,247 132,450
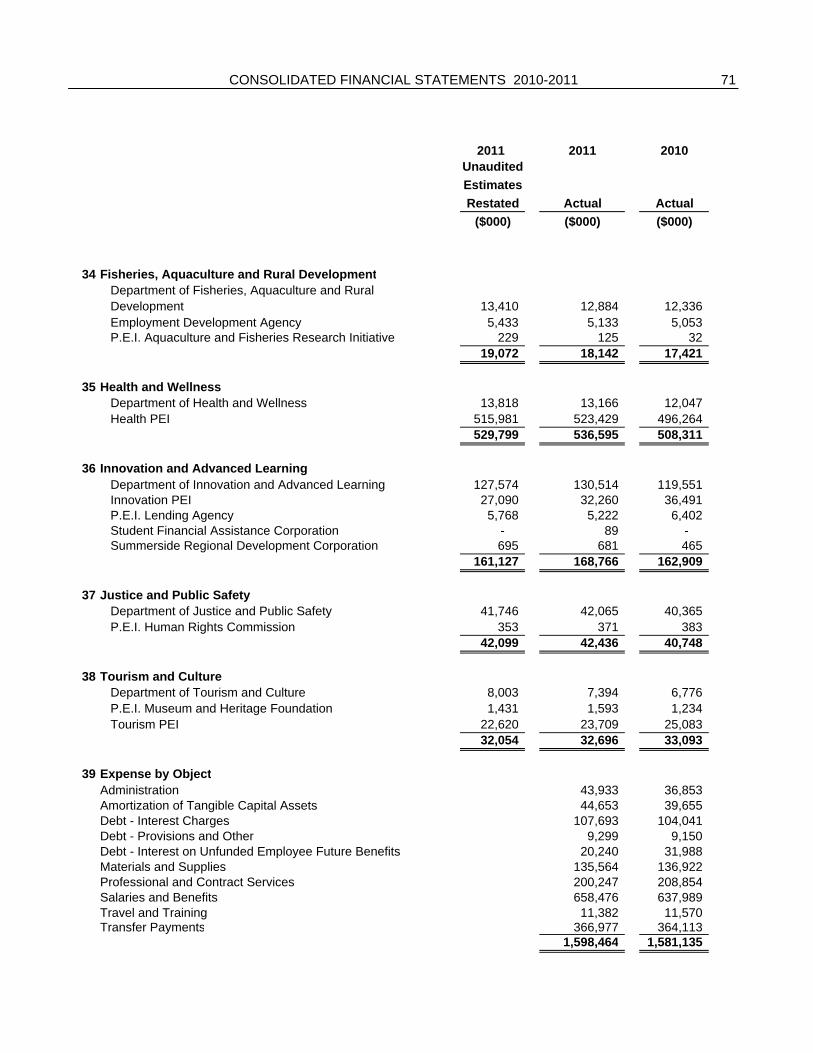
71
2011 2011 2010UnauditedEstimatesRestated Actual Actual
($000) ($000) ($000)
34 Fisheries, Aquaculture and Rural Development Department of Fisheries, Aquaculture and Rural Development 13,410 12,884 12,336 Employment Development Agency 5,433 5,133 5,053 P.E.I. Aquaculture and Fisheries Research Initiative 229 125 32
19,072 18,142 17,421
35 Health and Wellness Department of Health and Wellness 13,818 13,166 12,047 Health PEI 515,981 523,429 496,264
529,799 536,595 508,311
36 Innovation and Advanced Learning Department of Innovation and Advanced Learning 127,574 130,514 119,551
CONSOLIDATED FINANCIAL STATEMENTS 2010-2011
p g Innovation PEI 27,090 32,260 36,491 P.E.I. Lending Agency 5,768 5,222 6,402 Student Financial Assistance Corporation - 89 - Summerside Regional Development Corporation 695 681 465
161,127 168,766 162,909
37 Justice and Public Safety Department of Justice and Public Safety 41,746 42,065 40,365 P.E.I. Human Rights Commission 353 371 383
42,099 42,436 40,748
38 Tourism and Culture Department of Tourism and Culture 8,003 7,394 6,776 P.E.I. Museum and Heritage Foundation 1,431 1,593 1,234 Tourism PEI 22,620 23,709 25,083
32,054 32,696 33,093
39 Expense by ObjectAdministration 43,933 36,853 Amortization of Tangible Capital Assets 44,653 39,655 Debt - Interest Charges 107,693 104,041 Debt - Provisions and Other 9,299 9,150 Debt - Interest on Unfunded Employee Future Benefits 20,240 31,988 Materials and Supplies 135,564 136,922 Professional and Contract Services 200,247 208,854 Salaries and Benefits 658,476 637,989 Travel and Training 11,382 11,570 Transfer Payments 366,977 364,113
1,598,464 1,581,135
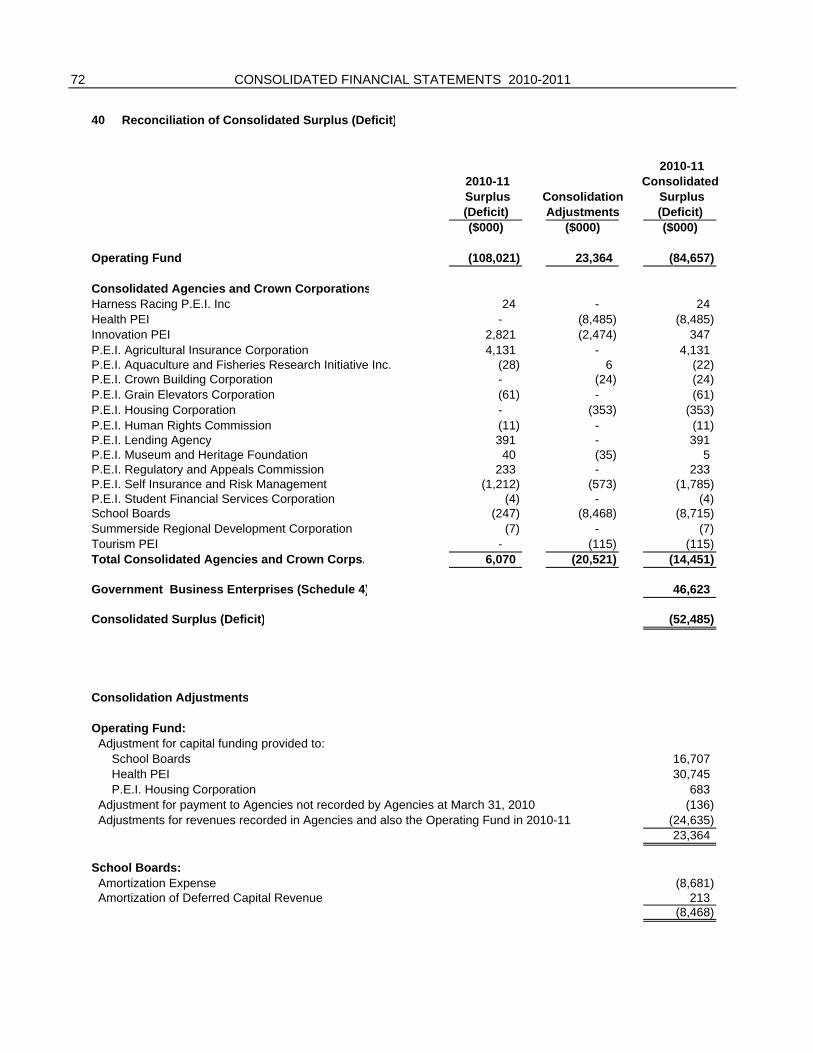
72
40 Reconciliation of Consolidated Surplus (Deficit)
2010-112010-11 ConsolidatedSurplus Consolidation Surplus(Deficit) Adjustments (Deficit)($000) ($000) ($000)
Operating Fund (108,021) 23,364 (84,657)
Consolidated Agencies and Crown CorporationsHarness Racing P.E.I. Inc 24 - 24 Health PEI - (8,485) (8,485) Innovation PEI 2,821 (2,474) 347 P.E.I. Agricultural Insurance Corporation 4,131 - 4,131 P.E.I. Aquaculture and Fisheries Research Initiative Inc. (28) 6 (22) P.E.I. Crown Building Corporation - (24) (24) P.E.I. Grain Elevators Corporation (61) - (61) P.E.I. Housing Corporation - (353) (353) P.E.I. Human Rights Commission (11) - (11) P.E.I. Lending Agency 391 - 391 P.E.I. Museum and Heritage Foundation 40 (35) 5 P.E.I. Regulatory and Appeals Commission 233 - 233 P.E.I. Self Insurance and Risk Management (1,212) (573) (1,785) P.E.I. Student Financial Services Corporation (4) - (4) School Boards (247) (8,468) (8,715) Summerside Regional Development Corporation (7) - (7) Tourism PEI - (115) (115) Total Consolidated Agencies and Crown Corps. 6,070 (20,521) (14,451)
Government Business Enterprises (Schedule 4) 46,623
Consolidated Surplus (Deficit) (52,485)
Consolidation Adjustments
Operating Fund: Adjustment for capital funding provided to: School Boards 16,707 Health PEI 30,745 P.E.I. Housing Corporation 683 Adjustment for payment to Agencies not recorded by Agencies at March 31, 2010 (136) Adjustments for revenues recorded in Agencies and also the Operating Fund in 2010-11 (24,635)
23,364
School Boards: Amortization Expense (8,681) Amortization of Deferred Capital Revenue 213
(8,468)
CONSOLIDATED FINANCIAL STATEMENTS 2010-2011
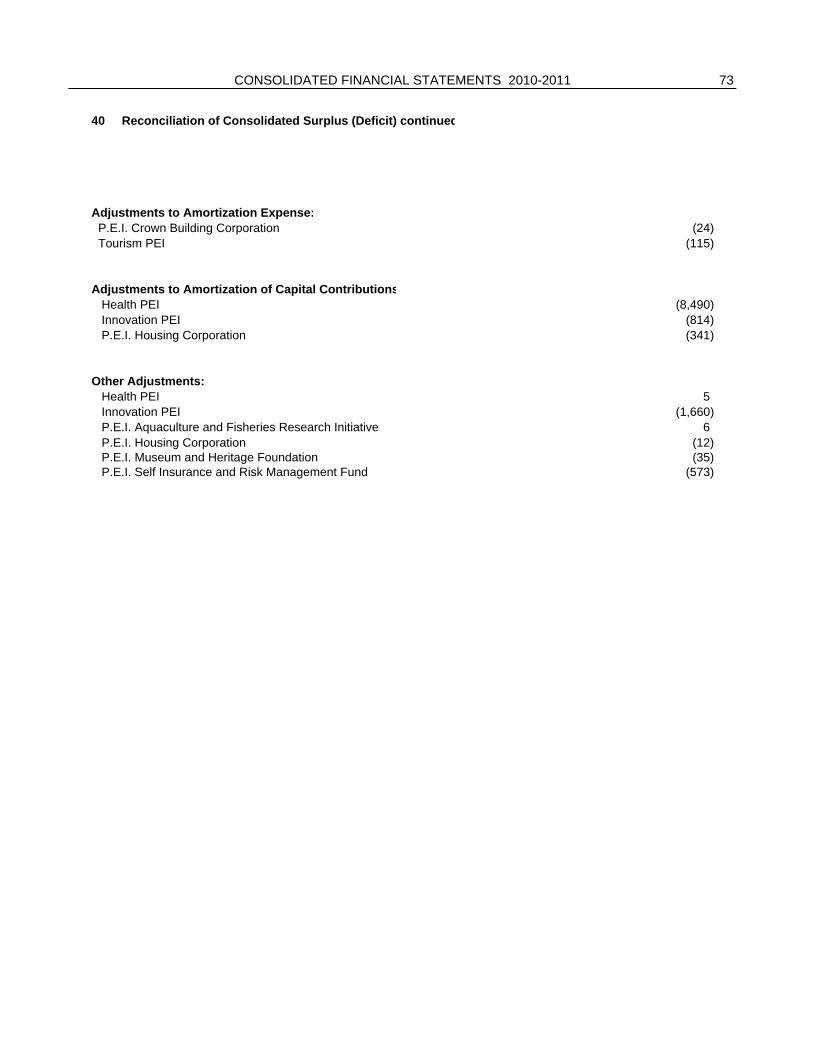
73
40 Reconciliation of Consolidated Surplus (Deficit) continued
Adjustments to Amortization Expense: P.E.I. Crown Building Corporation (24) Tourism PEI (115)
Adjustments to Amortization of Capital Contributions Health PEI (8,490) Innovation PEI (814) P.E.I. Housing Corporation (341)
Other Adjustments: Health PEI 5 Innovation PEI (1,660) P.E.I. Aquaculture and Fisheries Research Initiative 6 P.E.I. Housing Corporation (12) P.E.I. Museum and Heritage Foundation (35) P.E.I. Self Insurance and Risk Management Fund (573)
CONSOLIDATED FINANCIAL STATEMENTS 2010-2011
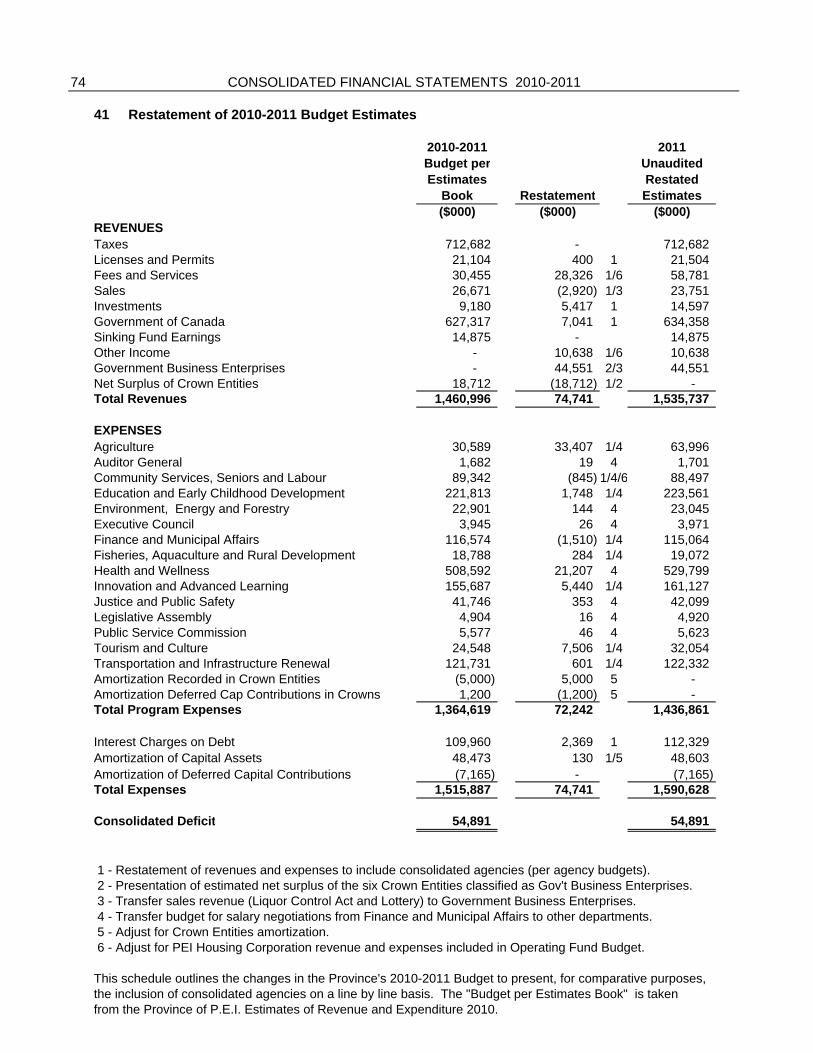
74
41 Restatement of 2010-2011 Budget Estimates
2010-2011 2011Budget per UnauditedEstimates Restated
Book Restatement Estimates($000) ($000) ($000)
REVENUESTaxes 712,682 - 712,682 Licenses and Permits 21,104 400 1 21,504 Fees and Services 30,455 28,326 1/6 58,781 Sales 26,671 (2,920) 1/3 23,751 Investments 9,180 5,417 1 14,597 Government of Canada 627,317 7,041 1 634,358 Sinking Fund Earnings 14,875 - 14,875 Other Income - 10,638 1/6 10,638 Government Business Enterprises - 44,551 2/3 44,551 Net Surplus of Crown Entities 18,712 (18,712) 1/2 - Total Revenues 1,460,996 74,741 1,535,737
EXPENSESAgriculture 30,589 33,407 1/4 63,996 Auditor General 1,682 19 4 1,701 Community Services, Seniors and Labour 89,342 (845) 1/4/6 88,497 Education and Early Childhood Development 221,813 1,748 1/4 223,561 Environment, Energy and Forestry 22,901 144 4 23,045 Executive Council 3,945 26 4 3,971 Finance and Municipal Affairs 116,574 (1,510) 1/4 115,064 Fisheries, Aquaculture and Rural Development 18,788 284 1/4 19,072 Health and Wellness 508,592 21,207 4 529,799 Innovation and Advanced Learning 155,687 5,440 1/4 161,127 Justice and Public Safety 41,746 353 4 42,099 Legislative Assembly 4,904 16 4 4,920 Public Service Commission 5,577 46 4 5,623 Tourism and Culture 24,548 7,506 1/4 32,054 Transportation and Infrastructure Renewal 121,731 601 1/4 122,332 Amortization Recorded in Crown Entities (5,000) 5,000 5 - Amortization Deferred Cap Contributions in Crowns 1,200 (1,200) 5 - Total Program Expenses 1,364,619 72,242 1,436,861
Interest Charges on Debt 109,960 2,369 1 112,329 Amortization of Capital Assets 48,473 130 1/5 48,603 Amortization of Deferred Capital Contributions (7,165) - (7,165) Total Expenses 1,515,887 74,741 1,590,628
Consolidated Deficit 54,891 54,891
1 - Restatement of revenues and expenses to include consolidated agencies (per agency budgets). 2 - Presentation of estimated net surplus of the six Crown Entities classified as Gov't Business Enterprises. 3 - Transfer sales revenue (Liquor Control Act and Lottery) to Government Business Enterprises. 4 - Transfer budget for salary negotiations from Finance and Municipal Affairs to other departments. 5 - Adjust for Crown Entities amortization. 6 - Adjust for PEI Housing Corporation revenue and expenses included in Operating Fund Budget.
This schedule outlines the changes in the Province's 2010-2011 Budget to present, for comparative purposes, the inclusion of consolidated agencies on a line by line basis. The "Budget per Estimates Book" is takenfrom the Province of P.E.I. Estimates of Revenue and Expenditure 2010.
CONSOLIDATED FINANCIAL STATEMENTS 2010-2011