psychometric analysis of residence and mooc assessmentspsychometric analysis of residence and mooc...
TRANSCRIPT
Paper ID #13809
Psychometric Analysis of Residence and MOOC Assessments
Dr. Eric Loken, Pennsylvania State University
Eric Loken is a Research Associate Professor at Penn State specializing in applied statistical analysis withan emphasis on education and health data. Funding for this work was supported by NSF grant GSE/RES1036731.
Zita Oravecz, Pennsylvania State University
Zita Oravecz is an assistant professor in the department of Human Development and Family Studies atPenn State University. Her research interests involve hierarchical Bayesian modeling, psychometrics,intensive longitudinal data, and latent variable modeling. She also focuses on individual differences (e.g.,in well-being, cognitive functioning) from a process modeling perspective.
Dr. Conrad Tucker, Pennsylvania State University, University Park
Dr. Tucker holds a joint appointment as Assistant Professor in Engineering Design and Industrial En-gineering at The Pennsylvania State University. He is also affiliate faculty in Computer Science andEngineering. He teaches Introduction to Engineering Design (EDSGN 100) at the undergraduate leveland developed and taught a graduate-level course titled Data Mining–Driven Design (EDSGN 561). Aspart of the Engineering Design Program’s ”Summers by Design” (SBD) program, Dr. Tucker supervisesstudents from Penn State during the summer semester in a two-week engineering design program at theEcole Centrale de Nantes in Nantes, France.
Dr. Tucker is the director of the Design Analysis Technology Advancement (D.A.T.A) Laboratory. Hisresearch interests are in formalizing system design processes under the paradigm of knowledge discovery,optimization, data mining, and informatics. His research interests include applications in complex sys-tems design and operation, product portfolio/family design, and sustainable system design optimizationin the areas of engineering education, energy generation systems, consumer electronics, environment, andnational security.
Mr. Fridolin Jakob Linder, Pennsylvania State University
Fridolin Linder is a graduate student in the Department of Political Science at Pennsylvania State Univer-sity. His work is supported by Pennsylvania State University and the National Science Foundation underan IGERT award # DGE-1144860, Big Data Social Science
c©American Society for Engineering Education, 2015
Page 26.1284.1

Psychometric Analysis of Residence and MOOC Assessment Data
Abstract
Undergraduate STEM programs are faced with the daunting challenge of managing instruction
and assessment for classes that enroll thousands of students per year, and the bulk of student
assessment is often determined by multiple choice tests. Instructors try to monitor the reliability
metrics and diagnostics for item quality, but rarely is there a more formal evaluation of the
psychometric properties of these assessments. College assessment strategies seem to be
dominated by a common-sense view of testing that is generally unconcerned about precision of
measurement. We see an opportunity to have an impact on undergraduate science instruction by
incorporating more rigorous measurement models for testing, and using them to assist
instructional goals and assessment. We apply item response theory to analyze tests from two
undergraduate STEM classes, a resident instruction physics class and a Massive Open Online
Course (MOOC) in geography. We evaluate whether the tests are equally informative across
levels of student proficiency, and we demonstrate how precision could be improved with
adaptive testing. We find that the measurement precision of multiple choice tests appears to be
greatest in the lower half of the class distribution, a property that has consequences for
assessment of mastery and for evaluating testing interventions.
Page 26.1284.2

Many undergraduate STEM (Science, Technology, Engineering and Mathematics) programs face
the daunting challenge of managing instruction and assessment for classes that enroll thousands
of students per semester. Although there has been considerable attention recently on
improvements in teaching methods for undergraduate STEM education, there has been relatively
little discussion of issues regarding assessments of student learning. A large university might
enroll thousands of students in introductory courses in calculus, chemistry, physics, statistics,
engineering, and biology, to name only a few standard classes that serve as the foundation for
entry to advanced studies in science and engineering. With the rise of MOOCs (Massive Open
Online Courses), class sizes an order of magnitude greater are becoming common. Due to
resource constraints, student assessment in these large settings is often carried out by multiple
choice testing.
It is not an exaggeration to say that large college science programs are functioning similarly to
large-scale testing organizations, only without any of the research and development and attention
to testing theory. Major testing organizations such as Educational Testing Services, Pearson, and
ACT develop and administer tests for a variety of purposes, from licensing exams, to academic
proficiency testing, to admissions testing. On the surface, these testing programs serve different
purposes, some to evaluate skills and knowledge, and some to rank applicants on aptitude, yet
they all share a common foundation in test theory and test development. The definition of
constructs and learning goals, the psychometric properties of scoring rules, and the validity of
claims and decisions based on the assessments must all be considered when designing a new
testing program and maintaining its operation.
Almost none of this happens in college classroom testing. Most instructors carefully construct
their assessments, and more conscientious ones monitor reliability metrics and diagnostics for
item quality, but rarely is there a more thorough evaluation of the psychometric properties of
college tests. Mislevy and Braun1 have pointed out that many educators and administrators
operate with a naïve theory of testing. Just as many undergraduate physics students need to
unlearn a naïve theory of mechanics and motion in order to solve more complex problems,
Mislevy and Braun argue that there is also a simplistic test theory built on false premises and
misapprehensions about the details of measurement. Examples of these misconceptions include
believing that a score is a score is a score and the test measures what it says at the top of the
page. These common sense intuitions about testing might work well for many simple purposes,
but as testing applications become more complex, these over simplifications begin to break
down.
The point seems especially relevant for large scale college STEM assessment where the testing
model really has not changed for half a century. A typical test will consist of some number of
multiple choice questions that are assumed to cover the learning goals and content of the class.
Page 26.1284.3
Students are scored with a sum score of the number of correct answers, and the items are viewed
essentially as survey items, where the relevant summary is the percent correct. This common
sense approach seems reasonable, and appears to have face validity, and in general works fine to
help evaluate students relative to the standards set by the instructors, and relative to their peers.
There are several limitations, however, of this common sense approach to testing. For one thing,
the intended object of measurement is the knowledge or proficiency of the students, and it is
basically an article of faith that the sum score of the individual items maps on to that construct
(which is why Mislevy and Braun say that in naïve test theory it is just assumed that the test
measures what it says at the top of the page). Connecting scores to student proficiency is all the
more difficult because students and questions are on different scales (the students are situated in
the total score distribution, and the items on a % correct metric), and these scales themselves are
not sample independent. Furthermore, there is no way to construct a map of the construct space,
to consider the significance of different patterns of answers that might lead to the same total, or
to provide ability dependent estimate of measurement precision (i.e. it is assumed that a score is
a score is a score). There is also no principled way to conduct personalized assessment
strategies that might optimize testing to specific student ability levels, or even to ensure the
fairness of computer testing from item pools. We are only aware of learning management
systems that sample randomly from pools of eligible items during computer based assessments.
That is, instructors delivering computer based tests might stratify the item pool by content
domain and maybe also their estimate of the question difficulty, but there is no mechanism to
ensure that students receive tests of equal difficulty when the items are selected.
We believe that the application of more rigorous measurement models to large scale college
testing could positively impact science education by increasing the awareness of instructors
about the properties of their assessments, and by improving the tools available to students. There
has been a tremendous amount of work on best practices for instruction in college courses, and
researchers have identified the value of formative assessments to help students and instructors
identify strengths and weaknesses and adjust instruction. We add to this discussion by
undertaking a psychometric analysis of classroom tests. In particular, we will focus on the
measurement precision when tests are analyzed using Item Response Theory (IRT), a non-linear
latent variable model that evaluates the student’s probability of responding to items correctly
conditional on ability level. A useful byproduct of IRT analysis is that measurement uncertainty
is quantified conditional on ability level, and it often reveals that precision is not uniform2.
In the classical test theory model (which is the general model for the vast majority of college
level assessments), the reliability of the test is defined as the proportion of score variance that is
attributable to “true-score” variance. The reliability of a test, then, as indexed by a Cronbach’s
alpha or KR-20, is considered a joint property of the test and the sample, and represented by a
single number that is not conditional on score level. Most university automated scoring
Page 26.1284.4

programs (and also those embedded in learning management systems for web-based
applications) will calculate reliability in this manner. A reliability of .8 is generally considered a
sign of good measurement. But simply summarizing the reliability with a single number masks
two very important facts: (1) the precision may vary considerably across the ability distribution,
and (2) different test questions provide more and less information at different points in the
ability distribution.
We believe these points are becoming increasingly relevant as testing becomes a larger issue in
college instruction. With questions about accountability and efficiency gaining in prominence,
and with a new interest in the possibility of differentiated instruction, we think it is a good time
to examine the status quo of classroom testing in large undergraduate classes. We do this by
analyzing testing data from two large college contexts. The first is a large undergraduate
introductory physics class covering mechanics with a calculus based curriculum. The second is a
Massively Open Online Course (a so-called MOOC) on geospatial reasoning. We will apply
IRT models to item level test data from the first midterm in each class. We will focus our
psychometric analysis on characterizing the variance in measurement precision and on
demonstrating the gains that could accrue from computer adaptive delivery of test content from
an expanded item pool.
Background on Psychometric Models
In the common three-parameter model (3PM), the probability p(Xij| θi; aj, bj, cj) of answering a
question correctly depends on the latent ability level θi of the ith
student on a one-dimensional
construct of interest, and the parameters aj, bj, and cj, for the jth
item.
(1)
The difficulty (or threshold) parameter bj is understood to be “on the same scale” as θ, allowing
for the matching of items and examinees. The discrimination (or slope) parameter aj determines
the rate of ascent from the lower asymptote to 1. Finally, cj determines the lower asymptote as θ
goes to negative infinity. For questions where there is no chance of guessing, setting cj = 0
yields the two-parameter logistic model (2PLM), whereas making the assumption that all
questions have the same aj yields the Rasch model (1PLM). Extensions to settings with multiple
response options or where θ is multidimensional are available, but we will focus only on the case
of dichotomous responses reflecting a unidimensional underlying construct.
If the question parameters are known, as is the case for a test composed of well-researched and
validated items, then estimation of student ability level is a straightforward single variable
problem3 . Similarly, if a sample of students with known ability estimates (θ) is available, then it
)(
)(
1)1(),,;|(
jij
jij
ba
ba
jjjjjiij
e
ecccbaXP
Page 26.1284.5
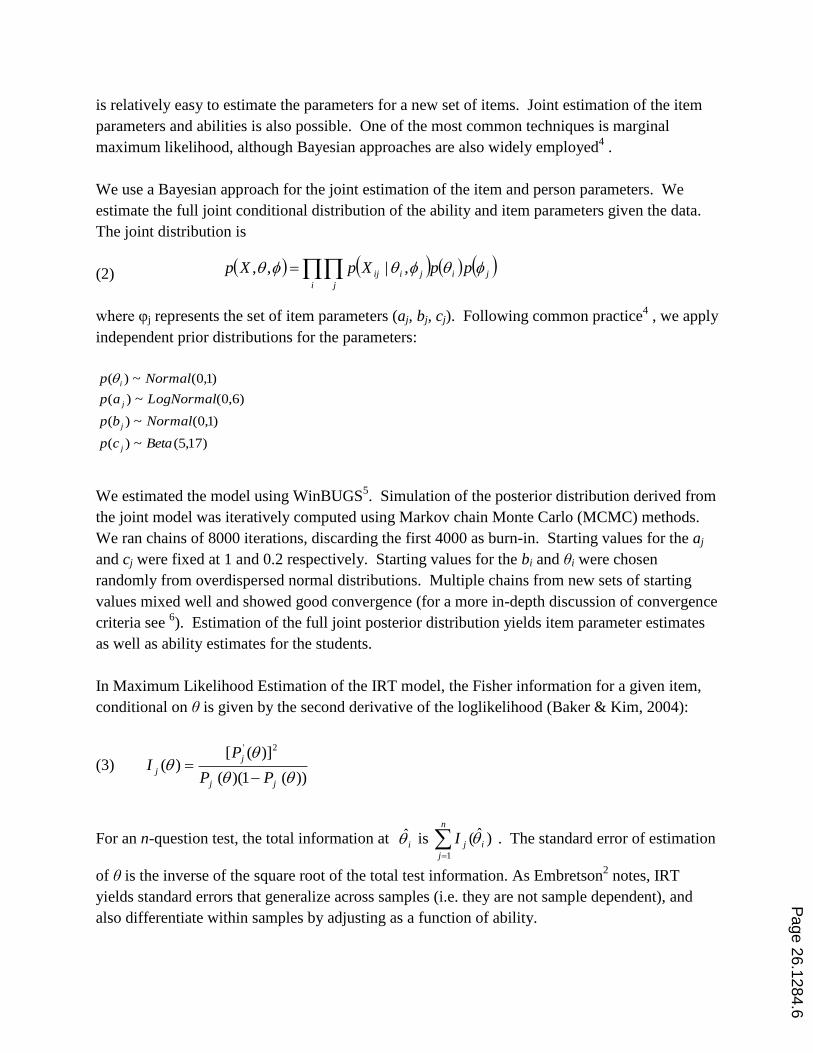
is relatively easy to estimate the parameters for a new set of items. Joint estimation of the item
parameters and abilities is also possible. One of the most common techniques is marginal
maximum likelihood, although Bayesian approaches are also widely employed4 .
We use a Bayesian approach for the joint estimation of the item and person parameters. We
estimate the full joint conditional distribution of the ability and item parameters given the data.
The joint distribution is
(2)
where φj represents the set of item parameters (aj, bj, cj). Following common practice4 , we apply
independent prior distributions for the parameters:
)17,5(~)(
)1,0(~)(
)6,0(~)(
)1,0(~)(
Betacp
Normalbp
LogNormalap
Normalp
j
j
j
i
We estimated the model using WinBUGS5. Simulation of the posterior distribution derived from
the joint model was iteratively computed using Markov chain Monte Carlo (MCMC) methods.
We ran chains of 8000 iterations, discarding the first 4000 as burn-in. Starting values for the aj
and cj were fixed at 1 and 0.2 respectively. Starting values for the bi and θi were chosen
randomly from overdispersed normal distributions. Multiple chains from new sets of starting
values mixed well and showed good convergence (for a more in-depth discussion of convergence
criteria see 6). Estimation of the full joint posterior distribution yields item parameter estimates
as well as ability estimates for the students.
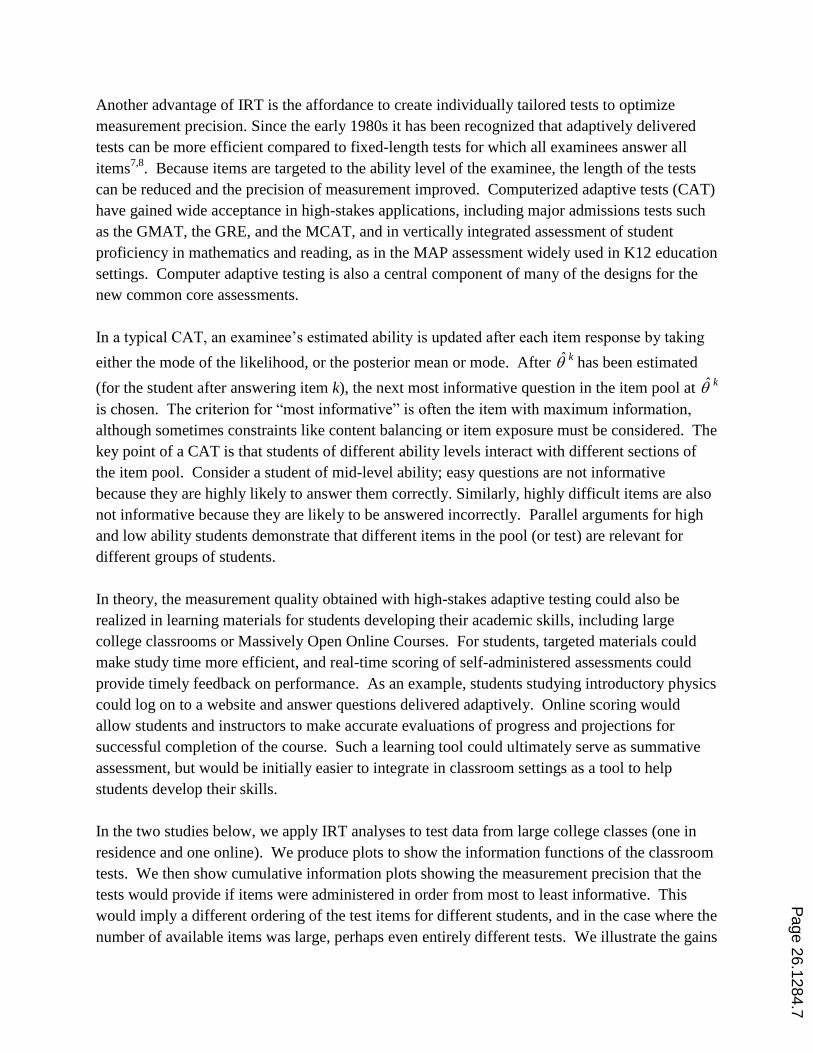
In Maximum Likelihood Estimation of the IRT model, the Fisher information for a given item,
conditional on θ is given by the second derivative of the loglikelihood (Baker & Kim, 2004):
(3) ))(1)((
)]([)(
2'
jj
j
jPP
PI
For an n-question test, the total information at i is )ˆ(1
i
n
j
jI
. The standard error of estimation
of θ is the inverse of the square root of the total test information. As Embretson2 notes, IRT
yields standard errors that generalize across samples (i.e. they are not sample dependent), and
also differentiate within samples by adjusting as a function of ability.
ji
i j
jiij ppXpXp ,|,,
Page 26.1284.6
Another advantage of IRT is the affordance to create individually tailored tests to optimize
measurement precision. Since the early 1980s it has been recognized that adaptively delivered
tests can be more efficient compared to fixed-length tests for which all examinees answer all
items7,8
. Because items are targeted to the ability level of the examinee, the length of the tests
can be reduced and the precision of measurement improved. Computerized adaptive tests (CAT)
have gained wide acceptance in high-stakes applications, including major admissions tests such
as the GMAT, the GRE, and the MCAT, and in vertically integrated assessment of student
proficiency in mathematics and reading, as in the MAP assessment widely used in K12 education
settings. Computer adaptive testing is also a central component of many of the designs for the
new common core assessments.
In a typical CAT, an examinee’s estimated ability is updated after each item response by taking
either the mode of the likelihood, or the posterior mean or mode. After k has been estimated
(for the student after answering item k), the next most informative question in the item pool at k
is chosen. The criterion for “most informative” is often the item with maximum information,
although sometimes constraints like content balancing or item exposure must be considered. The
key point of a CAT is that students of different ability levels interact with different sections of
the item pool. Consider a student of mid-level ability; easy questions are not informative
because they are highly likely to answer them correctly. Similarly, highly difficult items are also
not informative because they are likely to be answered incorrectly. Parallel arguments for high
and low ability students demonstrate that different items in the pool (or test) are relevant for
different groups of students.
In theory, the measurement quality obtained with high-stakes adaptive testing could also be
realized in learning materials for students developing their academic skills, including large
college classrooms or Massively Open Online Courses. For students, targeted materials could
make study time more efficient, and real-time scoring of self-administered assessments could
provide timely feedback on performance. As an example, students studying introductory physics
could log on to a website and answer questions delivered adaptively. Online scoring would
allow students and instructors to make accurate evaluations of progress and projections for
successful completion of the course. Such a learning tool could ultimately serve as summative
assessment, but would be initially easier to integrate in classroom settings as a tool to help
students develop their skills.
In the two studies below, we apply IRT analyses to test data from large college classes (one in
residence and one online). We produce plots to show the information functions of the classroom
tests. We then show cumulative information plots showing the measurement precision that the
tests would provide if items were administered in order from most to least informative. This
would imply a different ordering of the test items for different students, and in the case where the
number of available items was large, perhaps even entirely different tests. We illustrate the gains
Page 26.1284.7
in measurement precision for the same fixed number of test items by supposing that the available
pool of items was 5X the number on the actual class test.
Study 1 Residence Instruction Physics Class
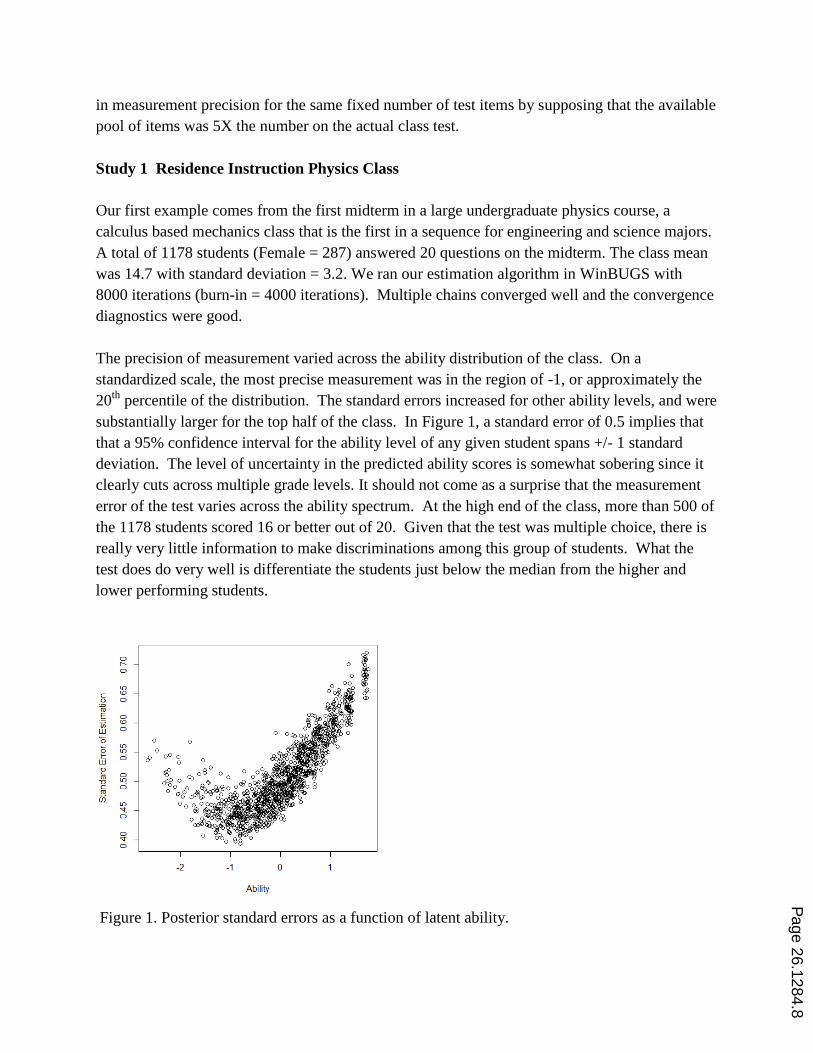
Our first example comes from the first midterm in a large undergraduate physics course, a
calculus based mechanics class that is the first in a sequence for engineering and science majors.
A total of 1178 students (Female = 287) answered 20 questions on the midterm. The class mean
was 14.7 with standard deviation = 3.2. We ran our estimation algorithm in WinBUGS with
8000 iterations (burn-in = 4000 iterations). Multiple chains converged well and the convergence
diagnostics were good.
The precision of measurement varied across the ability distribution of the class. On a
standardized scale, the most precise measurement was in the region of -1, or approximately the
20th
percentile of the distribution. The standard errors increased for other ability levels, and were
substantially larger for the top half of the class. In Figure 1, a standard error of 0.5 implies that
that a 95% confidence interval for the ability level of any given student spans +/- 1 standard
deviation. The level of uncertainty in the predicted ability scores is somewhat sobering since it
clearly cuts across multiple grade levels. It should not come as a surprise that the measurement
error of the test varies across the ability spectrum. At the high end of the class, more than 500 of
the 1178 students scored 16 or better out of 20. Given that the test was multiple choice, there is
really very little information to make discriminations among this group of students. What the
test does do very well is differentiate the students just below the median from the higher and
lower performing students.
Figure 1. Posterior standard errors as a function of latent ability.
Page 26.1284.8
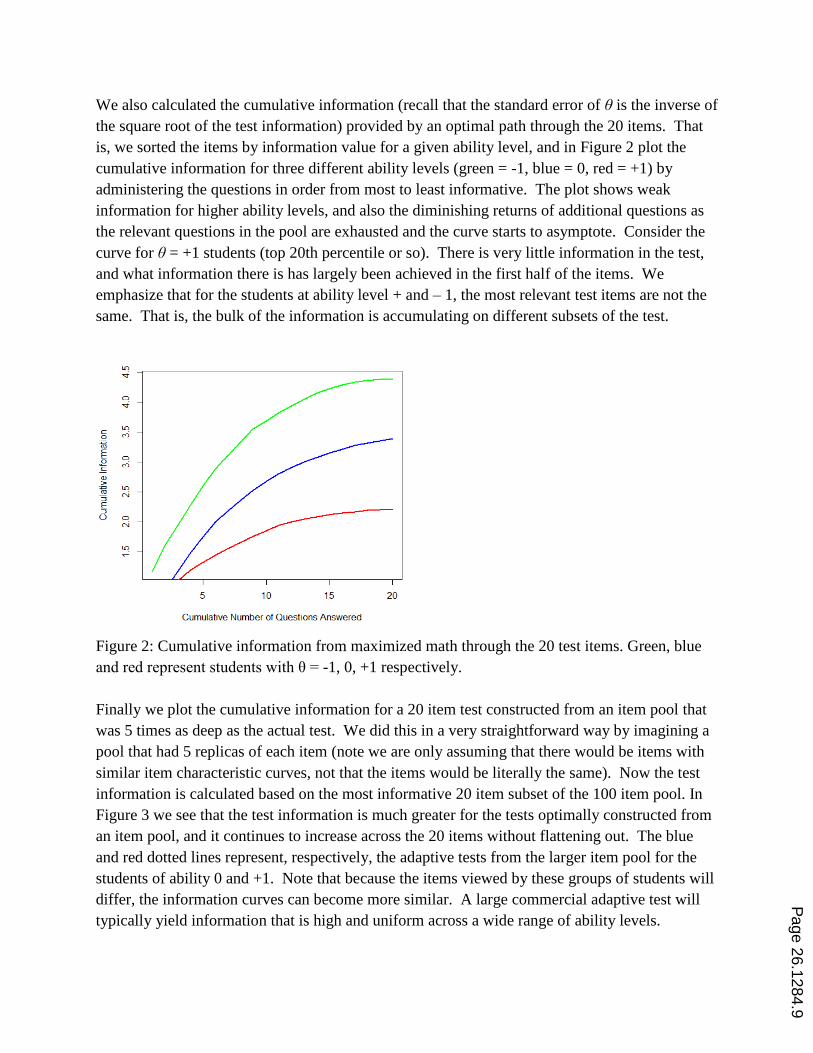
We also calculated the cumulative information (recall that the standard error of θ is the inverse of
the square root of the test information) provided by an optimal path through the 20 items. That
is, we sorted the items by information value for a given ability level, and in Figure 2 plot the
cumulative information for three different ability levels (green = -1, blue = 0, red = +1) by
administering the questions in order from most to least informative. The plot shows weak
information for higher ability levels, and also the diminishing returns of additional questions as
the relevant questions in the pool are exhausted and the curve starts to asymptote. Consider the
curve for θ = +1 students (top 20th percentile or so). There is very little information in the test,
and what information there is has largely been achieved in the first half of the items. We
emphasize that for the students at ability level + and – 1, the most relevant test items are not the
same. That is, the bulk of the information is accumulating on different subsets of the test.
Figure 2: Cumulative information from maximized math through the 20 test items. Green, blue
and red represent students with θ = -1, 0, +1 respectively.
Finally we plot the cumulative information for a 20 item test constructed from an item pool that
was 5 times as deep as the actual test. We did this in a very straightforward way by imagining a
pool that had 5 replicas of each item (note we are only assuming that there would be items with
similar item characteristic curves, not that the items would be literally the same). Now the test
information is calculated based on the most informative 20 item subset of the 100 item pool. In
Figure 3 we see that the test information is much greater for the tests optimally constructed from
an item pool, and it continues to increase across the 20 items without flattening out. The blue
and red dotted lines represent, respectively, the adaptive tests from the larger item pool for the
students of ability 0 and +1. Note that because the items viewed by these groups of students will
differ, the information curves can become more similar. A large commercial adaptive test will
typically yield information that is high and uniform across a wide range of ability levels.
Page 26.1284.9

Figure 3. Dotted lines represent cumulative information for an adaptive test based on an item
pool with 100 items similar to original 20. Blue and red solid curves represent the same functions
as drawn in Fig. 2.
In summary, based on the 20 item midterm, the estimation of student ability is quite noisy,
especially for the top half of the class. Although the test as a whole may explain variance across
the class distribution, there is very little to differentiate among the top 500 out 1178 students.
The information that does exist accumulates for different questions for different students. With
access to a larger pool of items, different paths could be constructed to yield more efficient
assessment strategies, either for individualized learning and formative assessment, or more
efficiently administered summative assessment.
Study 2 MOOC on Geography and Geospatial Reasoning
Our second example comes from a MOOC in geography. 5733 students attempted the first quiz
covering geospatial applications, such as definitions of GPS and GIS and geotagging, and
understanding what sorts of transformations of geospatial information can be represented in
maps. There were 17 items on the quiz; the mean was 11.7 and the standard deviation 3.6.
Students had the opportunity to resubmit answers after completing the quiz a first time. Here we
analyze only the first submissions.
In terms of test information, we see a very similar pattern to the residence physics class. Figure
4 shows that measurement is most precise in the lower half of the class distribution, and the
standard errors rise with ability level. The standard errors are somewhat smaller here than in
Study 1, despite the shorter test.
Page 26.1284.10
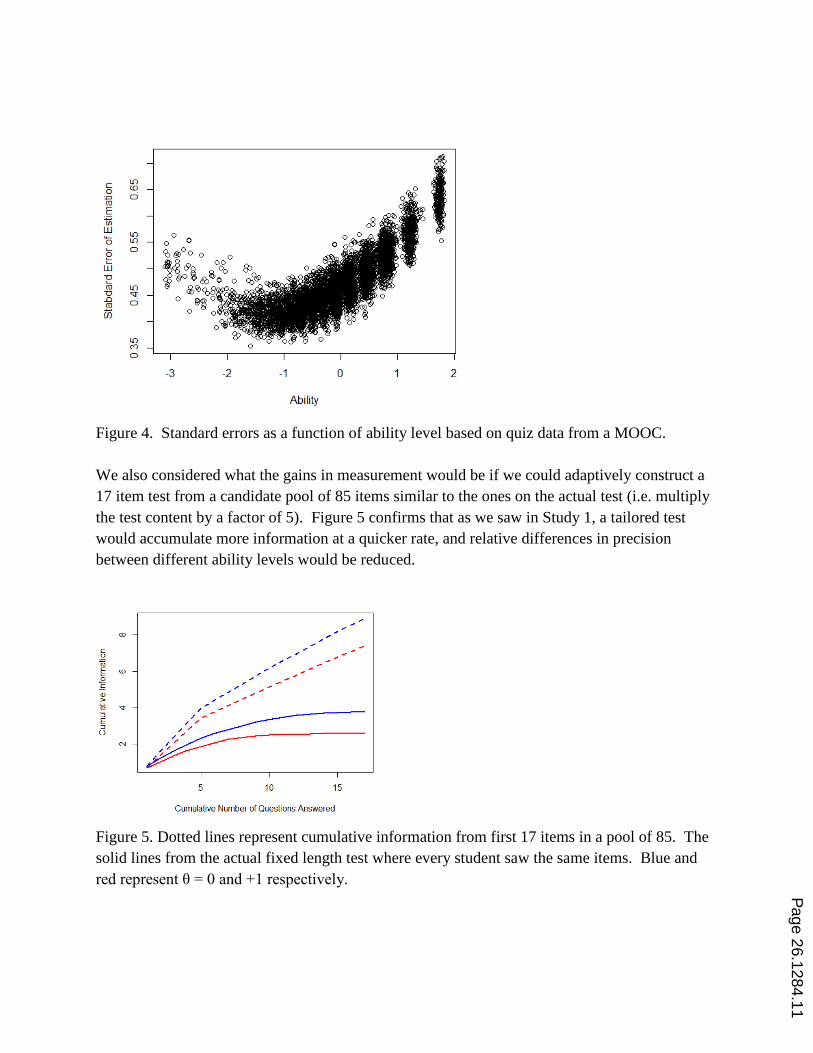
Figure 4. Standard errors as a function of ability level based on quiz data from a MOOC.
We also considered what the gains in measurement would be if we could adaptively construct a
17 item test from a candidate pool of 85 items similar to the ones on the actual test (i.e. multiply
the test content by a factor of 5). Figure 5 confirms that as we saw in Study 1, a tailored test
would accumulate more information at a quicker rate, and relative differences in precision
between different ability levels would be reduced.
Figure 5. Dotted lines represent cumulative information from first 17 items in a pool of 85. The
solid lines from the actual fixed length test where every student saw the same items. Blue and
red represent θ = 0 and +1 respectively.
Page 26.1284.11
Discussion
On any test, a score needs to be understood in the context of the pattern of responses by students.
When analyzing college assessments using IRT to put items and people on the same scale, we
saw similarities in the psychometric analyses for two large testing applications. Whether in a
largely unconstrained online context, such as a MOOC, or in the structured environment of a
residence based required physics course, multiple choice testing provided relatively weak
information for the upper half of the class distribution. Although both tests had good
conventional reliability, as measured by Cronbach’s alpha, it was clear that the tests were best at
discriminating between high and low performance.
The tests we analyzed were multiple choice with average item difficulty in the range of 0.75.
Many college courses give tests with means closer to 80% or 85%. In such cases the patterns we
have shown in these analyses are even more pronounced. The standard errors are even poorer,
and there is hardly any information relevant for the top half of the class.
At first blush it might seem that we are showing too much concern about the measurement in the
top half of the class. Indeed, it might be argued that the purpose of testing is to elicit evidence of
mastery, and the relative rank ordering of students is not the main concern. This is a reasonable
argument, and indeed criterion referenced tests have information curves that are highly
concentrated at the relevant level for mastery.
However, while we acknowledge that there is lots of room for debate on the philosophy of
assessment, the reality is that the weak information does present many problems. For one thing,
even if the explicit goal of the college test was to show evidence of mastery at a certain
threshold, it is unlikely that that threshold would be set at the 40th
percentile of the class.
Repeatedly answering easier questions is not the usual definition of mastery. Criterion
referenced tests should have information curves that are concentrated at the desired level of
mastery, and our analyses of these tests (and many others) have repeatedly shown that there are
relatively few questions that challenge students in the top half of the class. An IRT analysis can
show whether the test information is concentrated at an appropriate point, and it can also set a
scale for the criterion level itself that is independent of specific test form.
Test information is also relevant because class test scores are often the outcome metric for
evaluating the success of teaching interventions. If ability in the top half of the student
distribution is only measured to +/- .5 of a standard deviation, then the statistical power to detect
experimental effects will be low. Measureable change is sometimes defined as change greater
than 1 standard deviation. The poorer the measurement precision, the more difficult it is to
identify when change (learning!) has occurred.
Page 26.1284.12
The relatively weak measurement in these early midterms also presents another problem.
Although it is easy to show that students who do poorly on the first midterm have a poor
expectancy for success later on, what is less well diagnosed are the prospects of the 500 largely
undifferentiated students in the physics class. Only about 50% of them will finish the course
with a similar high level of performance. But because students in that group are so weakly
differentiated, there is little predictive information for future performance based on the first
midterm. Any opportunity for differentiated instruction or other interventions is hindered by a
lack of specific information from the early assessments.
The important insight is that the information value of the test items differs across the ability
distribution. The test items that differentiate relative performance between groups of students in
the high end of the distribution are not the same as those that differentiate between groups of
students at the lower end of the distribution. The relative representation of easy to difficult items
was on the order of 5:1 in the two tests analyzed here.
Given the differences across the ability distribution in the amount and source of information
provided by traditional college tests, we think that there is a role for adaptive learning and
assessment tools in large undergraduate STEM classes. At many institutions, instructors of
science and engineering classes are accumulating large databases of test and assignment items.
These could fruitfully be deployed as adaptive formative assessment tools. Adaptive tools could
increase and normalize the information we learn from student performance.
Consider a formative assessment tool where students interacted with a large database of
questions in order to self-assess their level of understanding. Given the information profile of
the tests analyzed in this paper, students could determine with decent resolution whether they
stood above or below average mastery. But given the profiles of these existing tests, students
who were above average would accumulate much less information concerning their specific level
of mastery. By contrast if the students were interacting with an adaptive algorithm assigning
questions based on the running ability level estimate, they would much more quickly establish
their relative level of mastery, and would encounter questions of a more appropriate challenge
level that would offer better resolution of their level.
Conclusion
We have shown that many college tests have information profiles that offer the greatest
measurement precision at lower levels of mastery. We point out that this is non-optimal for the
purpose of assessing higher levels of mastery, and we show that delivering tailored tests can
provide much more information about student learning. There is a need to raise awareness about
measurement precision in college testing. As Mislevy and Braun pointed out, one of the naïve
assumptions about testing is that a score is a score. Scores are measured with very different
Page 26.1284.13
levels of precision, and similar scores might reflect different underlying patterns of performance.
We advocate for more attention to the properties of testing in a higher education context. At
many traditional residence institutions, and especially in the new frontier of online education
(whether open or not), the issue of scale demands that we address the different dynamics of
learning progressions within a single ‘class’.
1. Mislevy, R. J., & Braun, H. I. (2003). Intuitive test theory. In Annual Dinner Meeting of the Princeton
Association for Computing Machinery (ACM) and Institute of Electrical and Electronics Engineers (IEEE)
Computer Society Chapters, Kingston, NJ, May (Vol. 22).
2. Embretson, S. E. (1996b). The new rules of measurement. Psychological Assessment, 8(4), 341-349.
3. Mislevy, R.J., & Bock, R. (1982). Adaptive EAP estimation of ability in a microcomputer environment. Applied
Psychological Measurement, 6, 431-444.
4. Baker, F.B., & Kim, S. (2004). Item Response Theory: Parameter Estimation Techniques, 2nd Edition. New
York: Marcel Dekker, Inc.
5. Spiegelhalter, D.J., Thomas, A., Best, N.G., Lunn, D. (2004). WinBUGS Version 2.0 Users Manual. MRC
Biostatistics Unit, Cambridge. URL http://mathstat.helsinki.fi/openbugs/.
6. Gelman, A., & Rubin, D.B. (1992). Inference from iterative simulation using multiple sequences. Statistical
Science, 7, 457-511.
7. Weiss, D. J. (1985). Adaptive testing by computer. Journal of Consulting and Clinical Psychology, 53(6), 774-
789.
8. Lord, F. M. (1983). Unbiased estimators of ability parameters, of their variance, and of their parallel-forms
reliability. Psychometrika, 48(2), 233-245.
Page 26.1284.14