psychological investigations
TRANSCRIPT
Psychological Investigations
G541 Revision
www.holah.co.uk/page/investigations
www.psychblog.co.uk/powerpoints

The Exam!
• The exam is 1 hour long and you will have to answer three questions.
• This unit is 30% of your total AS psychology - paper marked out of 60.
• Although you will have to learn four sections for this paper, you will only be asked questions on three of the sections.
Experiments
Correlations
Observations
Self-ReportsYou will be asked questions about:
•the piece of research including strengths and weaknesses. •the data produced by the research. •to design your own research •the strengths and weaknesses of this proposed research.

EXPERIMENTSPsychological Investigations

Experiments
Three types of experiments:
• Laboratory experiments – Highly controlled / artificial
• Field experiments– Controlled variables in a natural environment
• Quasi (natural) experiments– We have no control over the independent
variable – it’s ‘naturally’ occurring (eg Gender)
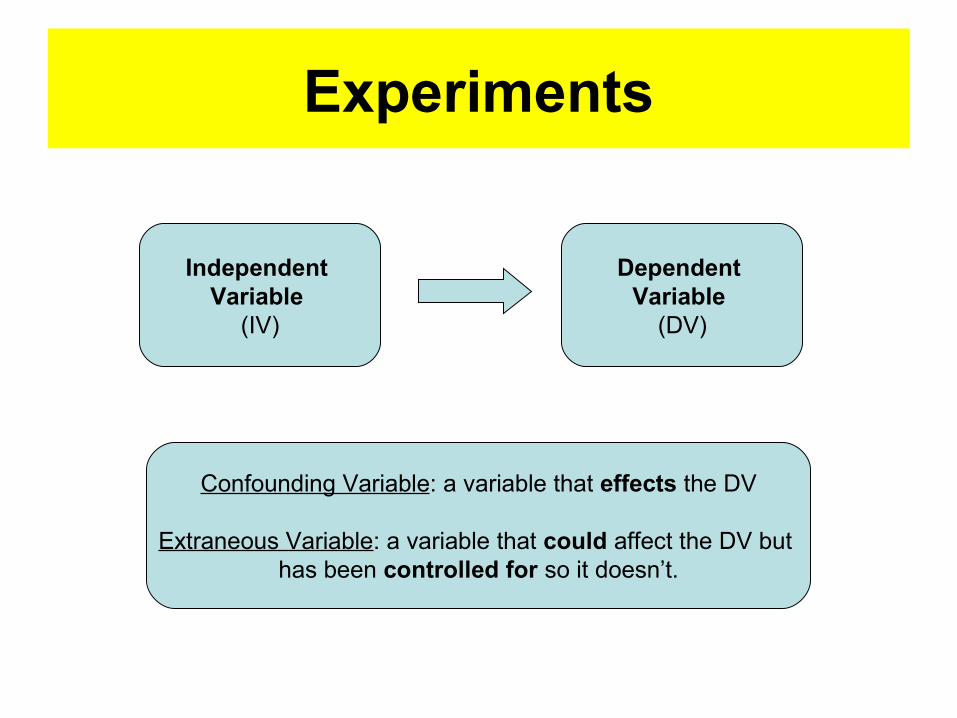
Experiments
Independent Variable
(IV)
Dependent Variable
(DV)
Confounding Variable: a variable that effects the DV
Extraneous Variable: a variable that could affect the DV but has been controlled for so it doesn’t.

Experiments
Extraneous Variables
Participant Variables
• Independent Measures = Individual Differences
Situational Variables
• Any feature of the experiment that could influence a participants behaviour
Single Blind – Double Blind – Control Groups

Experiments
• Independent Measures
• Participants are only in one condition.
Repeated Measures• The same participants
repeat the two conditions
Condition 1 Condition 2Condition 1 Condition 2
Counter balancing – alter order of Pp’s
Experiments
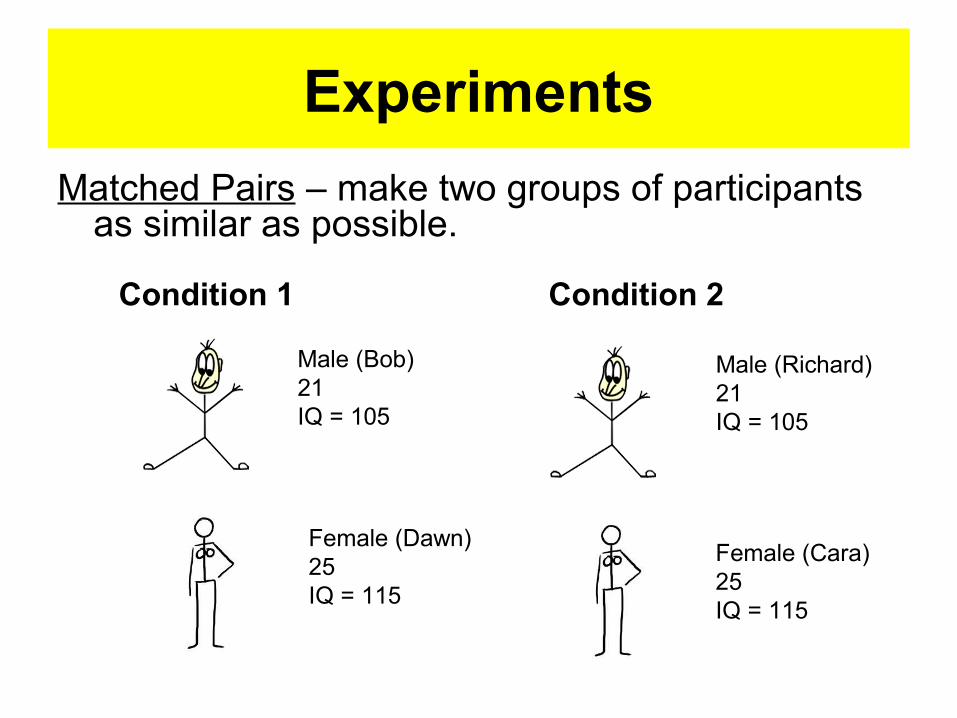
Matched Pairs – make two groups of participants as similar as possible.
Condition 1 Condition 2
Male (Bob)21IQ = 105
Male (Richard)21IQ = 105
Female (Dawn)25IQ = 115
Female (Cara)25IQ = 115
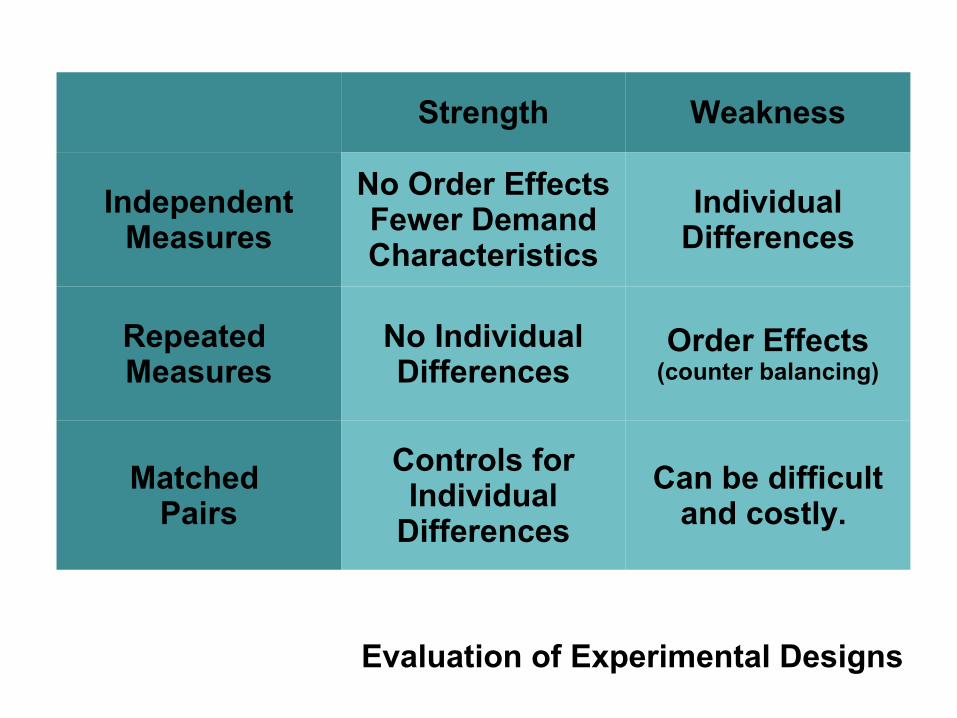
Strength Weakness
Independent Measures
No Order Effects Fewer Demand Characteristics
Individual Differences
Repeated Measures
No Individual Differences
Order Effects(counter balancing)
Matched Pairs
Controls for Individual
Differences
Can be difficult and costly.
Evaluation of Experimental Designs
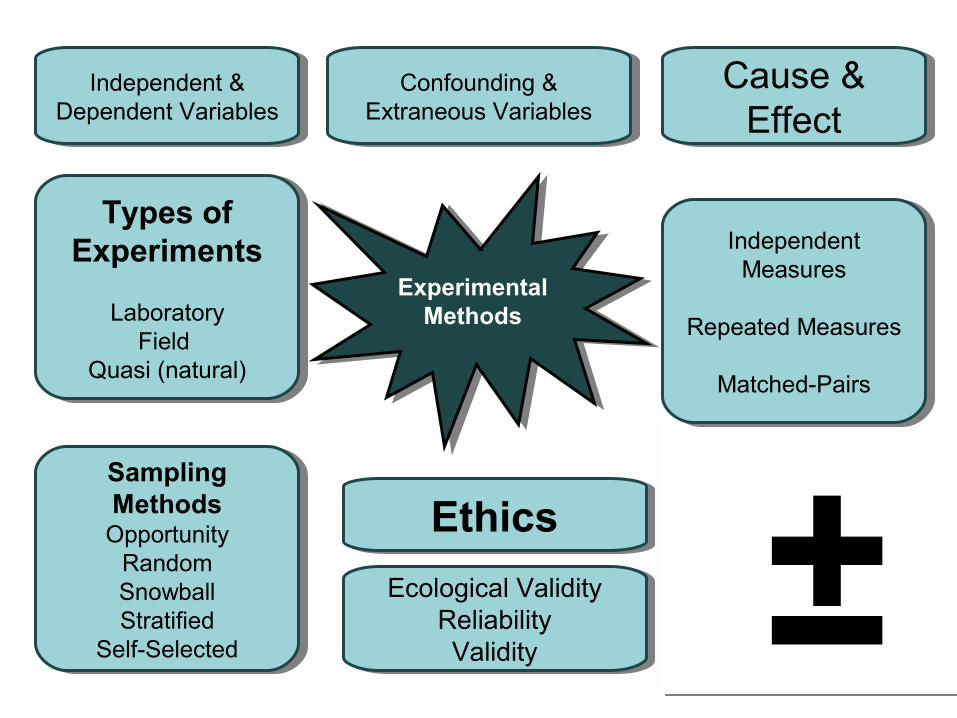
Experimental Methods
Experimental Methods
±±
Independent & Dependent Variables
Independent & Dependent Variables
Confounding & Extraneous Variables
Confounding & Extraneous Variables
Cause & Effect
Cause & Effect
Types of Experiments
LaboratoryField
Quasi (natural)
Types of Experiments
LaboratoryField
Quasi (natural)
Independent Measures
Repeated Measures
Matched-Pairs
Independent Measures
Repeated Measures
Matched-Pairs
Sampling Methods
OpportunityRandomSnowballStratified
Self-Selected
Sampling Methods
OpportunityRandomSnowballStratified
Self-Selected
EthicsEthics
Ecological ValidityReliabilityValidity
Ecological ValidityReliabilityValidity
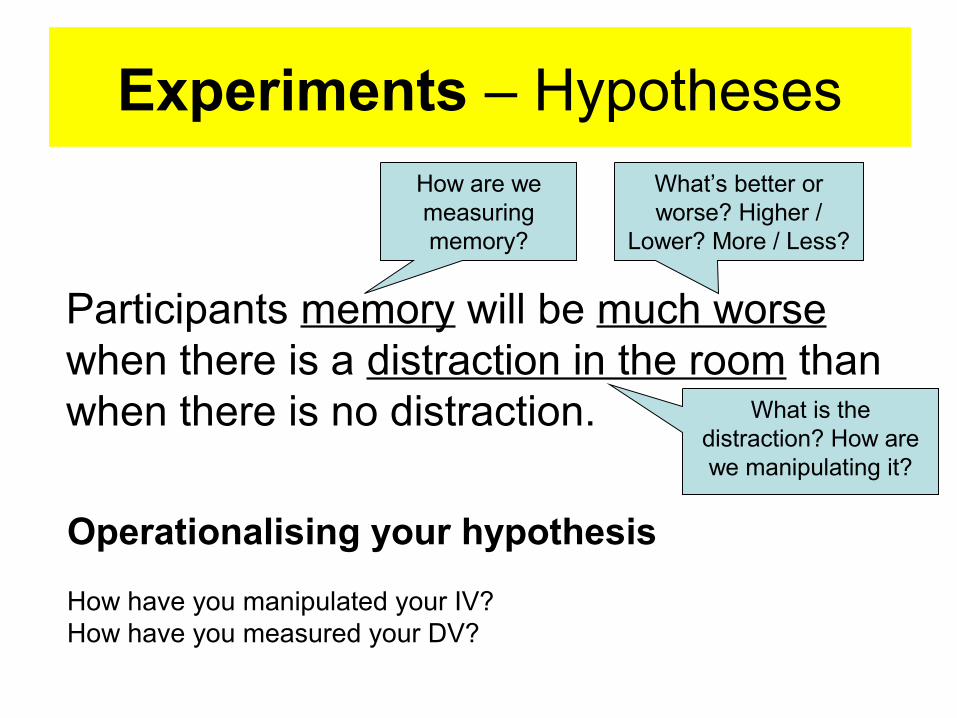
Experiments – Hypotheses
Participants memory will be much worse when there is a distraction in the room than when there is no distraction.
Participants memory will be much worse when there is a distraction in the room than when there is no distraction.
How are we measuring memory?
What’s better or worse? Higher /
Lower? More / Less?
What is the distraction? How are we manipulating it?
Operationalising your hypothesis
How have you manipulated your IV?How have you measured your DV?

Experiments – Hypotheses
Participants memory will be much worse when there is a distraction in the room than when there is no distraction.
Participants will remember significantly more words from a list of 20 presented for 60 seconds when they are in a room with no distractions than participants who are in a room where rock music is playing in the background.

Experiments – Hypotheses
Participants who [do something] will be significantly [faster/better/quicker etc] at [something] than participants who [do something else].
There will be no significant difference between participants who [do something] and those who [do something else]. Any difference will be down to chance.
Alte
rnat
ive
Nul
l

Experiments – Hypotheses
Participants who [do something] will be significantly [faster/better/quicker etc] at [something] than participants who [do something else].
There will be a significant difference between participants who [do something] and those who [do something else].
1Tailed
2Tailed
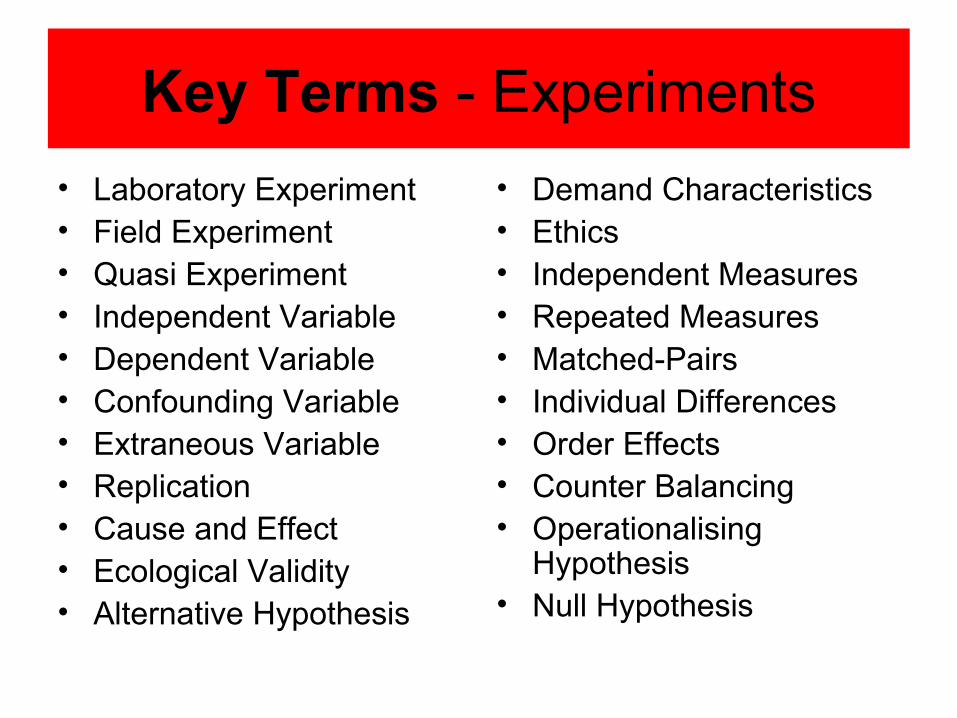
Key Terms - Experiments
• Laboratory Experiment• Field Experiment• Quasi Experiment• Independent Variable• Dependent Variable• Confounding Variable• Extraneous Variable• Replication• Cause and Effect• Ecological Validity• Alternative Hypothesis
• Demand Characteristics• Ethics• Independent Measures• Repeated Measures• Matched-Pairs• Individual Differences• Order Effects• Counter Balancing• Operationalising
Hypothesis• Null Hypothesis

CORRELATIONS
Psychological Investigations

Correlation
• Positive Correlation• Negative Correlation• Zero Correlation
Can’t infer causation – only relationships!
Correlation Coefficients
+1.0 Perfect Positive
+0.8 Strong
+0.2 Weak
0 Zero
-0.2 Weak
-0.8 Strong
-1.0 Perfect Negative

Correlation – Hypotheses
There will be a significant [direction] correlation between [variable 1] (measured by [something]) and [variable 2] (measured by [something])
There will be no significant correlation between [variable 1] (measured by [something]) and [variable 2] (measured by [something])
Alte
rnat
ive.
Null

Correlation – Hypotheses
There will be a significant [direction] correlation between [variable 1] (measured by [something]) and [variable 2] (measured by [something])
There will be a significant correlation between [variable 1] (measured by [something]) and [variable 2] (measured by [something])
1Tailed
2Tailed
No Direction

Data Analysis
Descriptive Statistics
• Summary of data to illustrate patterns and relationships – BUT can’t infer conclusions
Inferential Statistics
• Statistical tests that allow us to make conclusions in relation to our hypothesis.
eg. Mann-Whitney or Spearman’s Rho.

Data AnalysisScattergram to show the
Correlation between variable 1 and variable 2
Titles are VERY important. Title your axis, the integers and give the graph a title.

Data Analysis
Descriptive Statistics
• Summary of data to illustrate patterns and relationships – BUT can’t infer conclusions
Inferential Statistics
• Statistical tests that allow us to make conclusions in relation to our hypothesis.
eg. Mann-Whitney or Spearman’s Rho.

Data AnalysisNominal - measure of central tendency: modeData in categories (finished, fell, started)
Ordinal - measure of central tendency: median Data which are ranked or in order (1st 2nd 3rd)
Interval - measure of central tendency: meanPrecise and measured using units of equal
intervals (1m54s, 1m59s, 2m03s)
Measure of dispersion = range (Highest – Lowest)

Key Terms - Correlation
• Positive Correlation• Negative Correlation• Zero Correlation• Causation• Correlation
Coefficient • Operationalise
Variables• Hypothesis
• One-tailed Hypothesis• Two-tailed Hypothesis• Alternate Hypothesis• Null Hypothesis• Descriptive Statistics• Inferential Statistics • Scattergram• Cause-and-effect

SELF-REPORTSPsychological Investigations
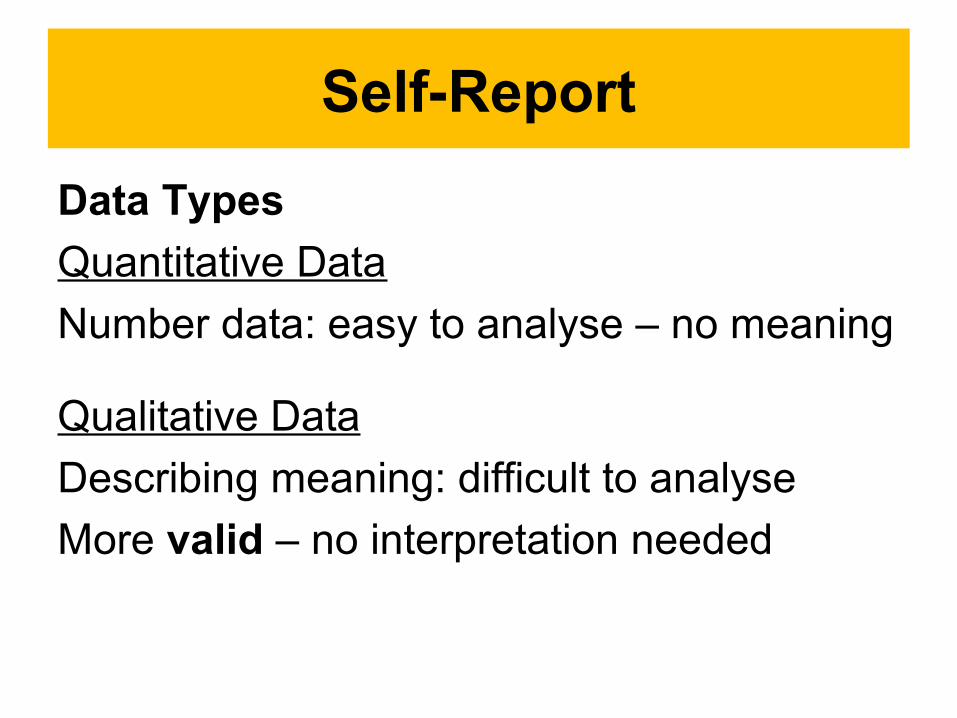
Self-Report
Data Types
Quantitative Data
Number data: easy to analyse – no meaning
Qualitative Data
Describing meaning: difficult to analyse
More valid – no interpretation needed

Self-Report
Questionnaires • Open Questions = Qualitative Data• Closed Questions = Quantitative Data
– Fixed Choice (yes / no)
– Rating Scales (Likert-type Scales)
• Social Desirability & fibbing • Response rates & leading
questions
Types of SRHand Out
Face-to-facePhone
Email / InternetPostal

Self-Report
Interviews• Structured / Unstructured Interviews• Demand Characteristics / Social Desirability
Reliability – how consistent are the findings
Validity – does the question measure what is claims to measure?
Questionnaires: Split-Half MethodInterviews: Replicate them
Ask OPEN questions – more validConduct an observation of behaviour
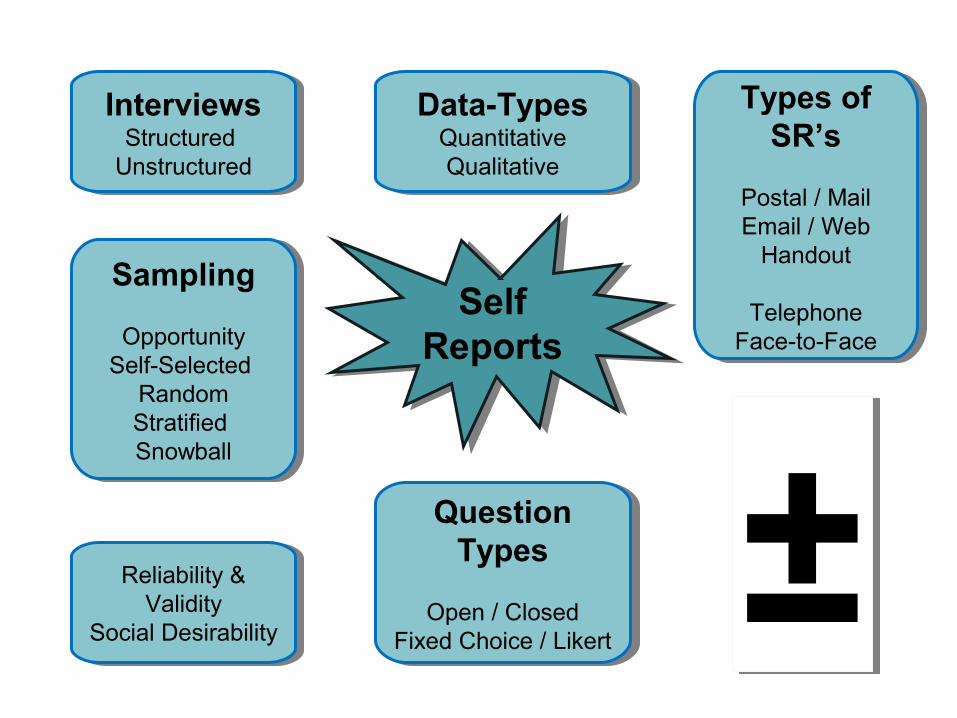
±±Self
ReportsSelf
Reports
InterviewsStructured
Unstructured
InterviewsStructured
Unstructured
Data-TypesQuantitativeQualitative
Data-TypesQuantitativeQualitative
Types of SR’s
Postal / MailEmail / Web
Handout
TelephoneFace-to-Face
Types of SR’s
Postal / MailEmail / Web
Handout
TelephoneFace-to-Face
Sampling
OpportunitySelf-Selected
RandomStratified Snowball
Sampling
OpportunitySelf-Selected
RandomStratified Snowball
Reliability &Validity
Social Desirability
Reliability &Validity
Social Desirability
Question Types
Open / ClosedFixed Choice / Likert
Question Types
Open / ClosedFixed Choice / Likert

Sampling
General Population
Sample
Representative Sample Generalisations
Sampling Techniques

Sampling
Opportunity Sample
• People who are there at the time.
• Quick / Cheap / Easy• Not representative
Random Sample
• Each person in the GP has an equal chance of being chosen.
• Expensive and time consuming.
• Representative sample

Sampling
Self-Selected
• Participants volunteer to be in the sample following advert etc.
• Quick / Cheap / Easy
• Not representative
What kind of person volunteers for a psychology experiment?
Snowball Sampling
• One person tells others who tell others …
• Allows us to collect -difficult to locate people
• Time consuming
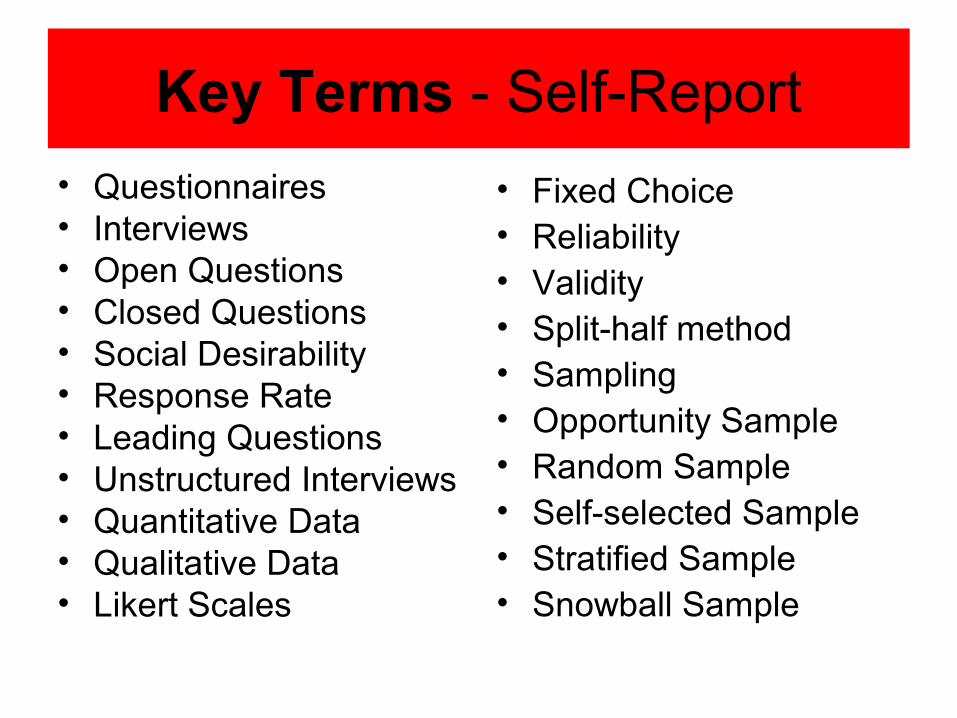
Key Terms - Self-Report
• Questionnaires• Interviews• Open Questions• Closed Questions• Social Desirability • Response Rate• Leading Questions• Unstructured Interviews• Quantitative Data• Qualitative Data• Likert Scales
• Fixed Choice• Reliability • Validity• Split-half method• Sampling• Opportunity Sample• Random Sample• Self-selected Sample• Stratified Sample• Snowball Sample
OBSERVATIONSPsychological Investigations
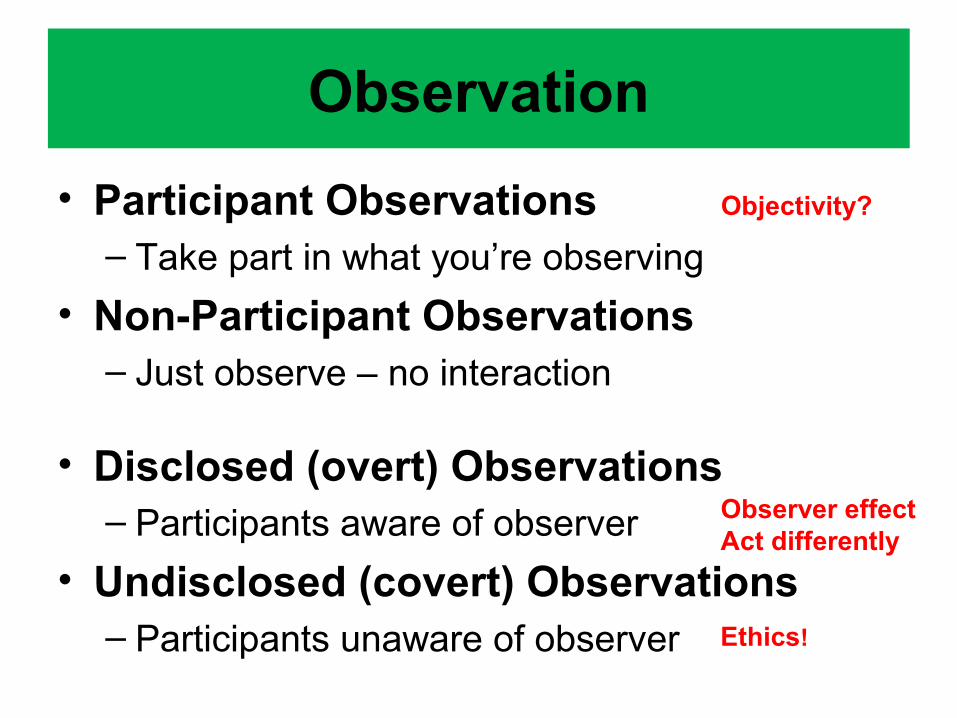
Observation
• Participant Observations– Take part in what you’re observing
• Non-Participant Observations– Just observe – no interaction
• Disclosed (overt) Observations– Participants aware of observer
• Undisclosed (covert) Observations– Participants unaware of observer Ethics!
Observer effectAct differently
Objectivity?

Observation
• Structured Observation– Coding scheme is used to record behaviour– Quantitative data collected
• Unstructured Observation– Researchers just record what’s going on– Qualitative data collected (usually)
• Controlled Observations– Researchers manipulate some variables
Event Sampling
Time Sampling
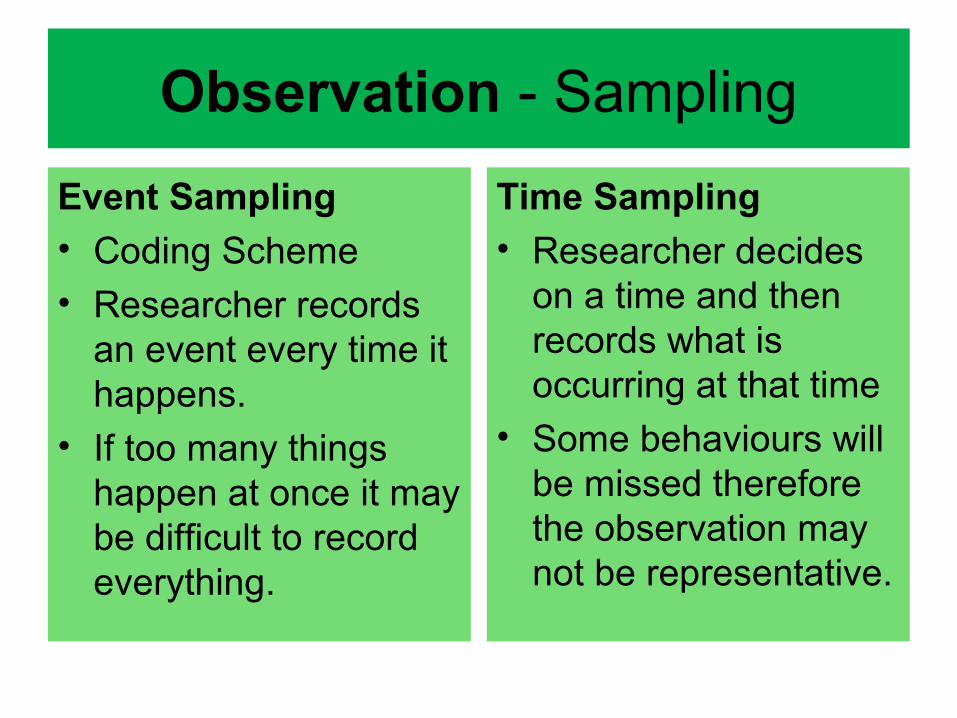
Observation - Sampling
Event Sampling• Coding Scheme• Researcher records
an event every time it happens.
• If too many things happen at once it may be difficult to record everything.
Time Sampling• Researcher decides
on a time and then records what is occurring at that time
• Some behaviours will be missed therefore the observation may not be representative.

Observation
Reliability
• Difficult to replicate observation – confounding variables.
• Check consistency within observations with inter-rater reliability (≥ 0.8)
• Improve reliability by using good coding scheme
Validity
• If participants know = low validity
• Observer bias = low validity
• Improve by using wider categories or single-blind technique
• Check validity by asking participants – self-report
Ethics
• Consent• Withdrawal• Debriefing • Deception• Confidentiality• Observation • Protection
• Advice• Colleagues

Key Terms - Observation
• Ecological Validity• Non-participant Obs. • Participant Obs.
• Undisclosed (covert)
• Disclosed (overt)• Structured • Unstructured
• Coding Scheme
• Controlled Observation
• Event Sampling• Time Sampling• Reliability • Inter-rater Reliability• Validity• Categories• Ethics• Quantitative Data• Qualitative Data