psg group - sharedata · psg capital is the corporate finance arm of psg group. it is a...
TRANSCRIPT
AnnuAl RepoRt
2010
PS
G G
RO
UP
An
nu
Al
Re
po
Rt
2010

PSG GROUP
Annual Report
2010

ii
Published on behalf of the PSG Group byGREYMATTER & F INCH
15 Quantum Street, Techno Park, StellenboschWebsite: www.greymatterfinch.com
Printed in South Africa by INTERPAK BOOKS
Website: www.interpakbooks.co.za
iii
Chairman’s letter 1
Group structure 8
Board of directors 10
Review of operations 11
Stock exchange performance 18
Our track record 18
Value added statement 20
Group employee statistics 21
Corporate governance 22
PSG Group Limited
– Annual f inancial statements 24
– Notice of annual general meeting 99
– Form of proxy Attached
PSG Financial Services Limited
– Annual f inancial statements 106
– Notice of annual general meeting 128
Administration 132
Shareholders’ diary 132
Contents

PSG GrouP Limited AnnuAL rePort 2010
1
Chairman’s letter
Cents per share 2010 2009 2008 2007 2006 2005
Recurring headline earnings 207,4 174,3 131,6 75,2 62,8 60,3
Change year-on-year 19% 33% 75% 20% 4%
Non-recurring items 41,8 (109,0) 163,5 444,1 289,0 29,7
Reportable headline earnings 249,2 65,3 295,1 519,3 351,8 90,0
Change year-on-year 282% (78%) (43%) 48% 291%
Who are we?
PSG is an investment group consisting of some 40 underlying companies, employing more than 39 000 people with a salary bill in excess of R6 billion. The tax paid by employees and group companies exceeded R2,5 billion, which could have funded the building of 83 000 RDP houses in the past year. That is the extent of this group’s influence and contribution to the wider South African economy.
Although we may appear to have a complex group structure, management has defined six units:
• Capitec Bank (banking) • PSG Konsult (wealth planning and stock broking)• PSG Fund Management (asset management)• PSG Corporate, incl. PSG Capital (treasury services
and corporate finance) • Zeder Investments (investments in agricultural,
food and beverage sectors)• Paladin Capital (investments in sectors other than
agriculture, food and beverages)
Our main objectives
• Grow the company for all stakeholders• Provide shareholders with an attractive return
on their money invested through a combination of share price appreciation and the payment of dividends
How have we performed?
• In the spirit of consistent, clear and unambiguous communication to stakeholders, PSG introduced the recurring headline earnings concept as the predominant measure of the group’s financial performance a few years ago. At the time, recurring headline earnings was defined as reportable headline earnings in terms of accounting standards, excluding any marked-to-market movements and one-off items.
During the past year we revisited and fine-tuned this methodology by now measuring recurring headline earnings on a see-through basis throughout the group. PSG’s recurring headline earnings is the sum of its effective interest in that of each of its underlying investees, regardless of its percentage shareholding. The result is that investments in which PSG or an investee holds less than 20% and is not allowed to equity account in terms of accounting standards, are now included in the calculation of our consolidated recurring headline earnings. This provides management and investors with a more realistic and simple way of evaluating PSG’s financial performance.
recurring headline earnings per share increased from 60,3 cents in 2005 to 207,4 cents in 2010, a compounded annual growth rate (CAGR) of 28%.
PSG GrouP Limited AnnuAL rePort 2010
2
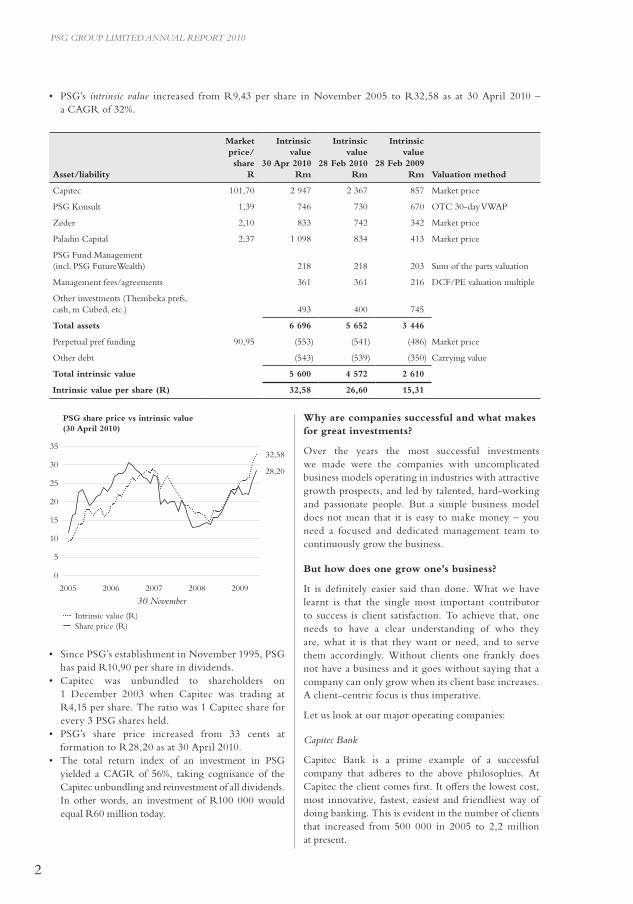
• PSG’s intrinsic value increased from R9,43 per share in November 2005 to R32,58 as at 30 April 2010 – a CAGR of 32%.
Asset/liability
Market price/
share R
Intrinsic value
30 Apr 2010Rm
Intrinsic value
28 Feb 2010Rm
Intrinsic value
28 Feb 2009Rm Valuation method
Capitec 101,70 2 947 2 367 857 Market price
PSG Konsult 1,39 746 730 670 OTC 30-day VWAP
Zeder 2,10 833 742 342 Market price
Paladin Capital 2,37 1 098 834 413 Market price
PSG Fund Management (incl. PSG FutureWealth) 218 218 203 Sum of the parts valuation
Management fees/agreements 361 361 216 DCF/PE valuation multiple
Other investments (Thembeka prefs, cash, m Cubed, etc.) 493 400 745
Total assets 6 696 5 652 3 446
Perpetual pref funding 90,95 (553) (541) (486) Market price
Other debt (543) (539) (350) Carrying value
Total intrinsic value 5 600 4 572 2 610
Intrinsic value per share (R) 32,58 26,60 15,31
• Since PSG’s establishment in November 1995, PSG has paid R10,90 per share in dividends.
• Capitec was unbundled to shareholders on 1 December 2003 when Capitec was trading at R4,15 per share. The ratio was 1 Capitec share for every 3 PSG shares held.
• PSG’s share price increased from 33 cents at formation to R28,20 as at 30 April 2010.
• The total return index of an investment in PSG yielded a CAGR of 56%, taking cognisance of the Capitec unbundling and reinvestment of all dividends. In other words, an investment of R100 000 would equal R60 million today.
Why are companies successful and what makes for great investments?
Over the years the most successful investments we made were the companies with uncomplicated business models operating in industries with attractive growth prospects, and led by talented, hard-working and passionate people. But a simple business model does not mean that it is easy to make money – you need a focused and dedicated management team to continuously grow the business.
But how does one grow one’s business?
It is definitely easier said than done. What we have learnt is that the single most important contributor to success is client satisfaction. To achieve that, one needs to have a clear understanding of who they are, what it is that they want or need, and to serve them accordingly. Without clients one frankly does not have a business and it goes without saying that a company can only grow when its client base increases. A client-centric focus is thus imperative.
Let us look at our major operating companies:
Capitec Bank
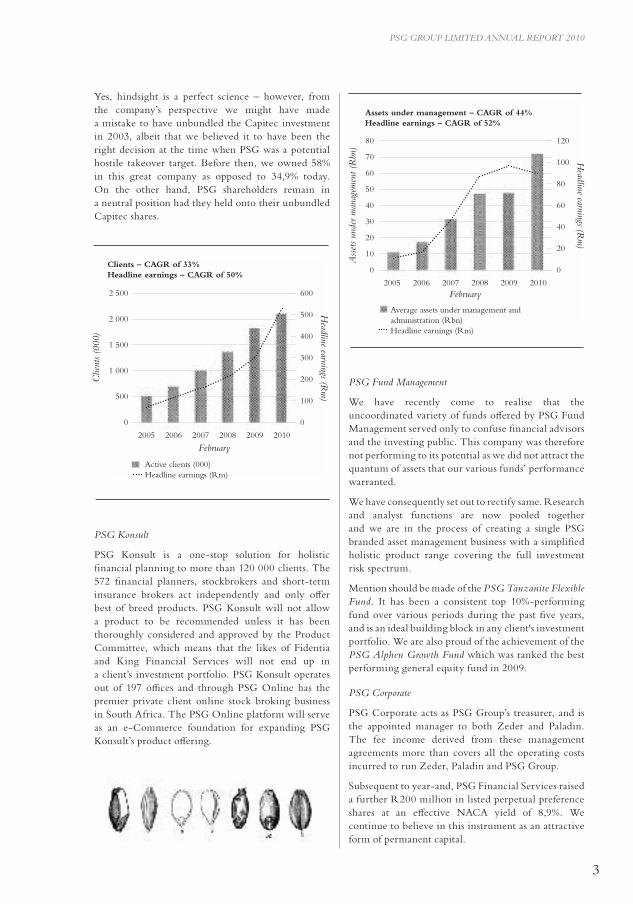
Capitec Bank is a prime example of a successful company that adheres to the above philosophies. At Capitec the client comes first. It offers the lowest cost, most innovative, fastest, easiest and friendliest way of doing banking. This is evident in the number of clients that increased from 500 000 in 2005 to 2,2 million at present.
Intrinsic value (R) Share price (R)
30 november
PSG share price vs intrinsic value(30 April 2010)
2005 2006 2007 2008 2009
35
30
25
20
15
10
5
0
32,58
28,20
PSG GrouP Limited AnnuAL rePort 2010
3
Yes, hindsight is a perfect science – however, from the company’s perspective we might have made a mistake to have unbundled the Capitec investment in 2003, albeit that we believed it to have been the right decision at the time when PSG was a potential hostile takeover target. Before then, we owned 58% in this great company as opposed to 34,9% today. On the other hand, PSG shareholders remain in a neutral position had they held onto their unbundled Capitec shares.
PSG Fund management
We have recently come to realise that the uncoordinated variety of funds offered by PSG Fund Management served only to confuse financial advisors and the investing public. This company was therefore not performing to its potential as we did not attract the quantum of assets that our various funds’ performance warranted.
We have consequently set out to rectify same. Research and analyst functions are now pooled together and we are in the process of creating a single PSG branded asset management business with a simplified holistic product range covering the full investment risk spectrum.
Mention should be made of the PSG tanzanite Flexible Fund. It has been a consistent top 10%-performing fund over various periods during the past five years, and is an ideal building block in any client's investment portfolio. We are also proud of the achievement of the PSG Alphen Growth Fund which was ranked the best performing general equity fund in 2009.
PSG Corporate
PSG Corporate acts as PSG Group’s treasurer, and is the appointed manager to both Zeder and Paladin. The fee income derived from these management agreements more than covers all the operating costs incurred to run Zeder, Paladin and PSG Group.
Subsequent to year-and, PSG Financial Services raised a further R200 million in listed perpetual preference shares at an effective NACA yield of 8,9%. We continue to believe in this instrument as an attractive form of permanent capital.
PSG Konsult
PSG Konsult is a one-stop solution for holistic financial planning to more than 120 000 clients. The 572 financial planners, stockbrokers and short-term insurance brokers act independently and only offer best of breed products. PSG Konsult will not allow a product to be recommended unless it has been thoroughly considered and approved by the Product Committee, which means that the likes of Fidentia and King Financial Services will not end up in a client’s investment portfolio. PSG Konsult operates out of 197 offices and through PSG Online has the premier private client online stock broking business in South Africa. The PSG Online platform will serve as an e-Commerce foundation for expanding PSG Konsult’s product offering.
Clie
nts
(000
)
Active clients (000) Headline earnings (Rm)
Clients – CAGR of 33%Headline earnings – CAGR of 50%
Headline earnings (r
m)
2005
February20102006 2007 2008 2009
2 500 600
500
400
300
200
100
0
2 000
1 500
1 000
500
0
Ass
ets
unde
r man
agem
ent (
rbn
)
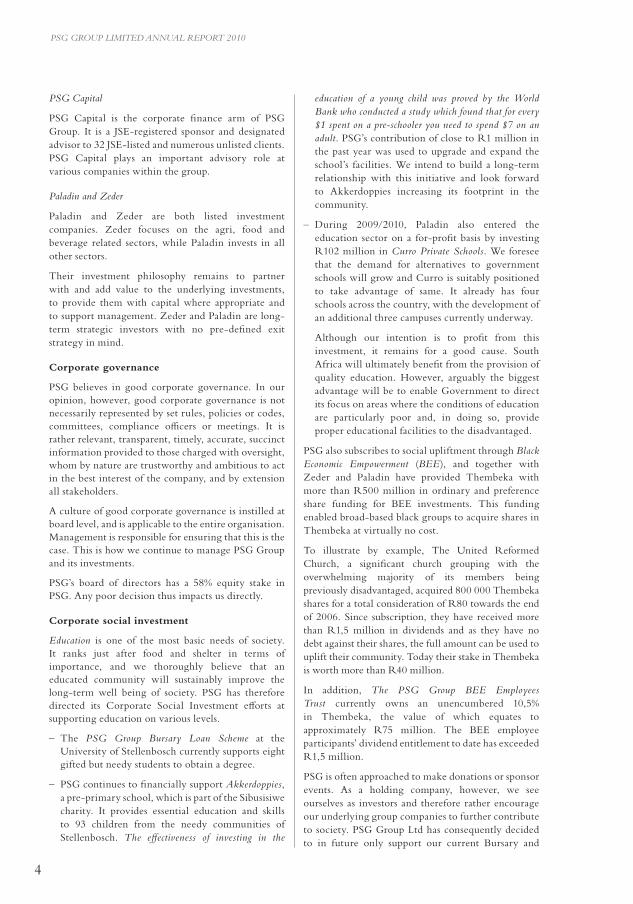
Average assets under management and administration (Rbn)
Headline earnings (Rm)
Assets under management – CAGR of 44% Headline earnings – CAGR of 52%
Headline earnings (r
m)
2005 20102006 2007 2008 2009
80
70
60
50
40
30
20
10
120
100
80
60
40
20
00
February
PSG GrouP Limited AnnuAL rePort 2010
4
PSG Capital
PSG Capital is the corporate finance arm of PSG Group. It is a JSE-registered sponsor and designated advisor to 32 JSE-listed and numerous unlisted clients. PSG Capital plays an important advisory role at various companies within the group.
Paladin and Zeder
Paladin and Zeder are both listed investment companies. Zeder focuses on the agri, food and beverage related sectors, while Paladin invests in all other sectors.
Their investment philosophy remains to partner with and add value to the underlying investments, to provide them with capital where appropriate and to support management. Zeder and Paladin are long-term strategic investors with no pre-defined exit strategy in mind.
Corporate governance
PSG believes in good corporate governance. In our opinion, however, good corporate governance is not necessarily represented by set rules, policies or codes, committees, compliance officers or meetings. It is rather relevant, transparent, timely, accurate, succinct information provided to those charged with oversight, whom by nature are trustworthy and ambitious to act in the best interest of the company, and by extension all stakeholders.
A culture of good corporate governance is instilled at board level, and is applicable to the entire organisation. Management is responsible for ensuring that this is the case. This is how we continue to manage PSG Group and its investments.
PSG’s board of directors has a 58% equity stake in PSG. Any poor decision thus impacts us directly.
Corporate social investment
education is one of the most basic needs of society. It ranks just after food and shelter in terms of importance, and we thoroughly believe that an educated community will sustainably improve the long-term well being of society. PSG has therefore directed its Corporate Social Investment efforts at supporting education on various levels.
– The PSG Group Bursary Loan Scheme at the University of Stellenbosch currently supports eight gifted but needy students to obtain a degree.
– PSG continues to financially support Akkerdoppies, a pre-primary school, which is part of the Sibusisiwe charity. It provides essential education and skills to 93 children from the needy communities of Stellenbosch. the effectiveness of investing in the
education of a young child was proved by the World Bank who conducted a study which found that for every $1 spent on a pre-schooler you need to spend $7 on an adult. PSG’s contribution of close to R1 million in the past year was used to upgrade and expand the school’s facilities. We intend to build a long-term relationship with this initiative and look forward to Akkerdoppies increasing its footprint in the community.
– During 2009/2010, Paladin also entered the education sector on a for-profit basis by investing R102 million in Curro Private Schools. We foresee that the demand for alternatives to government schools will grow and Curro is suitably positioned to take advantage of same. It already has four schools across the country, with the development of an additional three campuses currently underway.
Although our intention is to profit from this investment, it remains for a good cause. South Africa will ultimately benefit from the provision of quality education. However, arguably the biggest advantage will be to enable Government to direct its focus on areas where the conditions of education are particularly poor and, in doing so, provide proper educational facilities to the disadvantaged.
PSG also subscribes to social upliftment through Black economic empowerment (Bee ), and together with Zeder and Paladin have provided Thembeka with more than R500 million in ordinary and preference share funding for BEE investments. This funding enabled broad-based black groups to acquire shares in Thembeka at virtually no cost.
To illustrate by example, The United Reformed Church, a significant church grouping with the overwhelming majority of its members being previously disadvantaged, acquired 800 000 Thembeka shares for a total consideration of R80 towards the end of 2006. Since subscription, they have received more than R1,5 million in dividends and as they have no debt against their shares, the full amount can be used to uplift their community. Today their stake in Thembeka is worth more than R40 million.
In addition, the PSG Group Bee employees trust currently owns an unencumbered 10,5% in Thembeka, the value of which equates to approximately R75 million. The BEE employee participants’ dividend entitlement to date has exceeded R1,5 million.
PSG is often approached to make donations or sponsor events. As a holding company, however, we see ourselves as investors and therefore rather encourage our underlying group companies to further contribute to society. PSG Group Ltd has consequently decided to in future only support our current Bursary and
PSG GrouP Limited AnnuAL rePort 2010
5
Pre-School projects, and to provide BEE funding to Thembeka. Our formal donation/sponsorship policy can be viewed at www.psggroup.co.za.
How is PSG positioned and where will the growth come from?
We held a PSG Growth Conference in February this year, and I am happy to report that the majority of our companies throughout the group are well poised for growth.
Capitec
Capitec’s extended advertising campaign has made South Africans aware of the compelling alternative value-for-money banking service offering that has its roots in the lower market segment, but is rapidly gaining market share in the middle to higher income market. A quote from Bernardo Trujillo: “Rich people love low prices, poor people need them”.
Capitec was recently nominated as one of the “Great Brands of Tomorrow” by renowned Swiss-based financial services group, Credit Suisse. It is the only brand from Africa to be nominated and finds itself in the company of Facebook, Apple, Polo, Swatch, Hyundai, Mahindra, and Amazon.com.
Although Capitec has grown exponentially over the past years, its market share remains relatively small. With its introduction of longer term loans and intention to also target the middle to higher income market, we believe this company will continue to grow in the years to come.
Zeder
Food will forever remain the most basic human need. Zeder’s focus remains to acquire assets in this sector at lower price-earnings multiples and price-to-book values of below one. Warren Buffett always refers to a “margin of safety” when investing at compelling multiples – this is what I understand it to be.
Paladin
We believe the growth potential in the education sector to be enormous. However, Paladin also has stakes in other companies that offer growth prospects. A point in case is CIC, an agency business for fast moving consumer goods like Colgate-Palmolive and Diageo (Heineken, Johnny Walker). It specifically has a strong presence in South Africa’s neighbouring countries.
Furthermore BEE will remain a prominent factor when doing business in South Africa. We believe the requirements and monitoring thereof will only become stricter in the coming years. Thembeka Capital is a qualifying BEE company in which Paladin owns a 49% interest. This company will surely benefit from BEE investment opportunities. Thembeka currently has assets of more than R1 billion.
PSG Konsult and PSG Fund management
The recovery in the financial markets has already seen both PSG Konsult and PSG Fund Management benefiting from same. PSG Konsult is working on organic and acquisitive initiatives which should see the company increase in size and profitability. The aforementioned restructuring of PSG Fund Management should in time result in an increase in assets and performance.
General
Our focus remains to grow both PSG’s recurring headline earnings and intrinsic value per share. In order to do so, we shall continue to invest in assets and sectors that offer attractive growth prospects and returns.
We remain devoted to the continued success of PSG.
PSG GrouP Limited AnnuAL rePort 2010
6
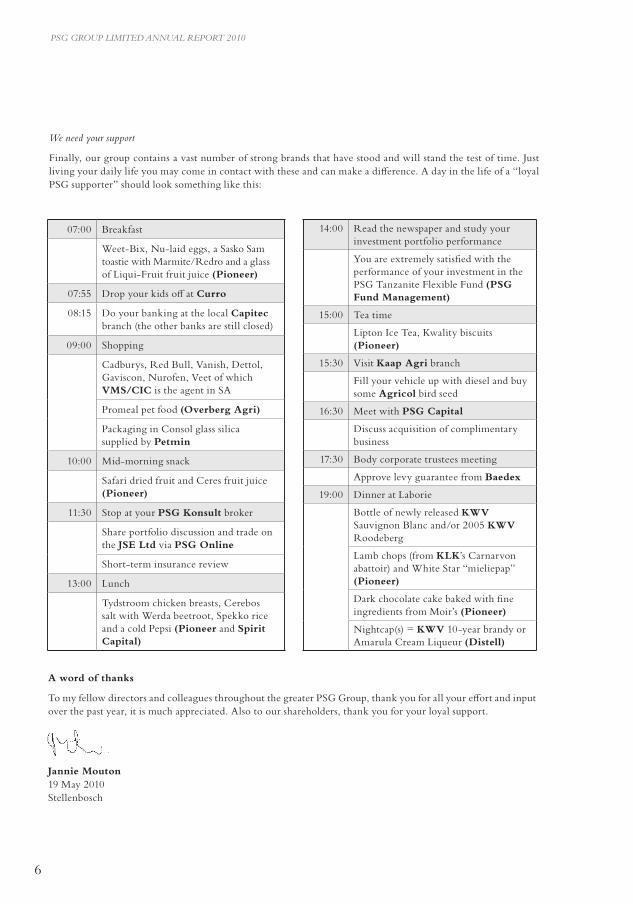
We need your support
Finally, our group contains a vast number of strong brands that have stood and will stand the test of time. Just living your daily life you may come in contact with these and can make a difference. A day in the life of a “loyal PSG supporter” should look something like this:
A word of thanks
To my fellow directors and colleagues throughout the greater PSG Group, thank you for all your effort and input over the past year, it is much appreciated. Also to our shareholders, thank you for your loyal support.
Jannie Mouton19 May 2010Stellenbosch
07:00 Breakfast
Weet-Bix, Nu-laid eggs, a Sasko Sam toastie with Marmite/Redro and a glass of Liqui-Fruit fruit juice (Pioneer)
07:55 Drop your kids off at Curro
08:15 Do your banking at the local Capitec branch (the other banks are still closed)
09:00 Shopping
Cadburys, Red Bull, Vanish, Dettol, Gaviscon, Nurofen, Veet of which VMS/CIC is the agent in SA
Promeal pet food (Overberg Agri)
Packaging in Consol glass silica supplied by Petmin
10:00 Mid-morning snack
Safari dried fruit and Ceres fruit juice (Pioneer)
11:30 Stop at your PSG Konsult broker
Share portfolio discussion and trade on the JSE Ltd via PSG Online
Short-term insurance review
13:00 Lunch
Tydstroom chicken breasts, Cerebos salt with Werda beetroot, Spekko rice and a cold Pepsi (Pioneer and Spirit Capital)
14:00 Read the newspaper and study your investment portfolio performance
You are extremely satisfied with the performance of your investment in the PSG Tanzanite Flexible Fund (PSG Fund Management)
15:00 Tea time
Lipton Ice Tea, Kwality biscuits (Pioneer)
15:30 Visit Kaap Agri branch
Fill your vehicle up with diesel and buy some Agricol bird seed
16:30 Meet with PSG Capital
Discuss acquisition of complimentary business
17:30 Body corporate trustees meeting
Approve levy guarantee from Baedex
19:00 Dinner at Laborie
Bottle of newly released KWV Sauvignon Blanc and/or 2005 KWV Roodeberg
Lamb chops (from KLK’s Carnarvon abattoir) and White Star “mieliepap” (Pioneer)
Dark chocolate cake baked with fine ingredients from Moir’s (Pioneer)
Nightcap(s) = KWV 10-year brandy or Amarula Cream Liqueur (Distell)
PSG GrouP Limited AnnuAL rePort 2010
7
Annual general meetings (AGMs) and investor presentations
You are invited to our PSG Group Investor Day on which the various AGMs will be held and presentations made by our group companies on 18 June 2010 at Webersburg, Annandale Road, Stellenbosch.
The timetable is as follows:
08:45 PSG Financial Services Ltd
09:00 PSG Fund Management Group (Pty) Ltd
09:30 PSG Konsult Ltd
10:00 Zeder Investments Ltd
10:30 Tea
11:00 Thembeka Capital Ltd
11:30 Paladin Capital Ltd
12:00 PSG Group Ltd
Lunch will be served after the PSG Group Ltd presentation. Kindly confirm your attendance with Sharon October at: E-mail: [email protected] Fax: 021 887 9619 Telephone: 021 887 9602
Notice
88
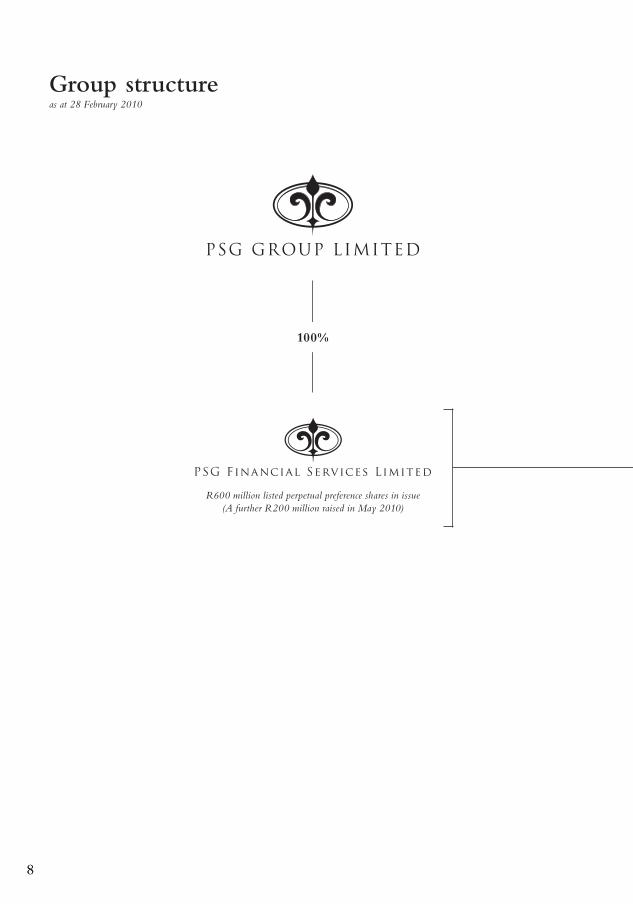
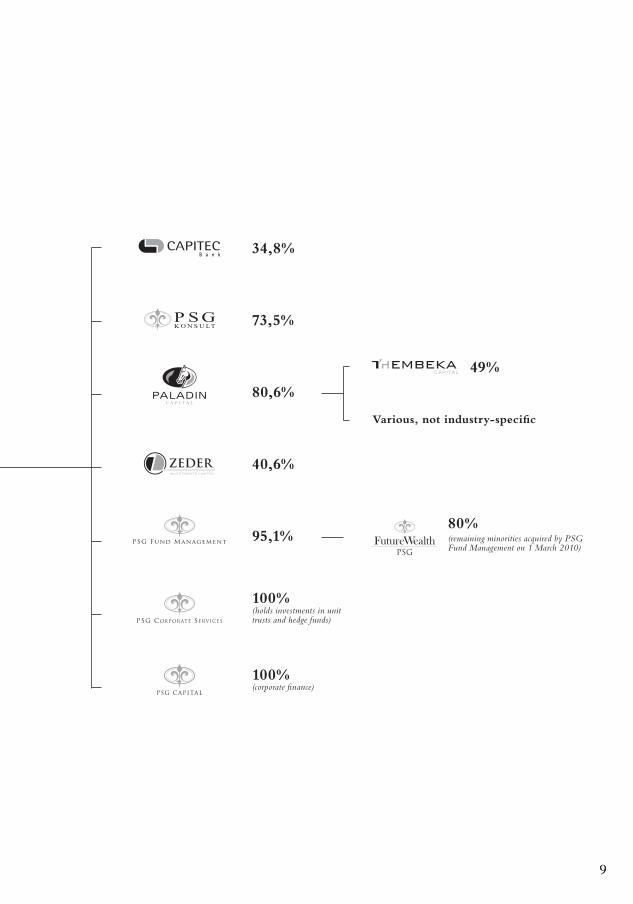
Group structureas at 28 February 2010
r600 million listed perpetual preference shares in issue(A further r200 million raised in may 2010)
100%
99
34,8%
73,5%
80,6%
40,6%
95,1%
100%(holds investments in unit trusts and hedge funds)
100% (corporate finance)
49%
Various, not industry-specific
80% (remaining minorities acquired by PSG Fund management on 1 march 2010)

PSG GrouP Limited AnnuAL rePort 2010
10
Board of directorsThe boards of directors of PSG Group Limited and PSG Financial Services Limited are identical.
1 member of audit and risk committee 2 member of remuneration committee
ExEcutivE DirEctors
JF (Jannie) Mouton (63) BCom (Hons), CA(SA), AEPexecutive chairman
WL (Wynand) Greeff (40) BCompt (Hons), CA(SA)Financial director
PJ (Piet) Mouton (33) BCom (Mathematics)
NoN-ExEcutivE DirEctors
ZL (KK) Combi (58) Diploma in Public Relations executive chairman – thembeka Capital Ltd
JA ( Johan) Holtzhausen (39)BIuris, LLB, HDip Tax managing director – PSG Capital (Pty) Ltd
JJ ( Jan) Mouton (35)BAcc (Hons), CA(SA), MPhil (Cantab) manager – PSG tanzanite Flexible Fund
CA (Chris) Otto (60)2
BCom, LLB director of companies
W (Willem) Theron (58)BCompt (Hons), CA(SA) managing director – PSG Konsult Ltd
iNDEpENDENt NoN- ExEcutivE DirEctors
L van A (Kleintjie) Bellingan (64)1, 2
BCom, LLB, CA(SA) entrepreneur
PE (Patrick) Burton (57)1, 2
BCom (Hons), PG Dip Tax Financial director – Snoek Wholesalers (Pty) Ltd
J de V (Jaap) du Toit (56)1
BAcc, CA(SA), CFA director of companies
MM (Thys) du Toit (51)2
BSc, MBA managing director – rootstock investment management (Pty) Ltd
MJ (Markus) Jooste (49)2
BAcc, CA(SA) managing director – Steinhoff international Holdings Ltd
CH (Christo) Wiese (68)2
BA, LLB, DCom (h.c.) director of companies

Review of operations
PSG GrouP Limited AnnuAL rePort 2010
12
Review of operationsRECURRInG HEADLInE EARnInGS
Headline earningsNumber of shares
28 Feb2010
m
Net asset value
28 Feb2010rm
28 Feb2009Rm
28 Feb2010rm
28 Feb2009Rm
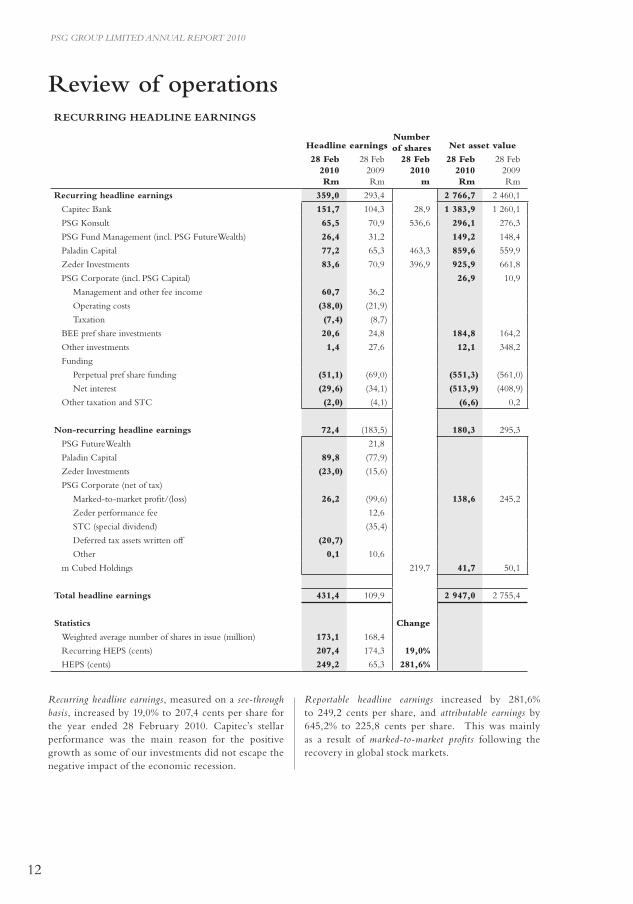
Recurring headline earnings 359,0 293,4 2 766,7 2 460,1
Capitec Bank 151,7 104,3 28,9 1 383,9 1 260,1
PSG Konsult 65,5 70,9 536,6 296,1 276,3
PSG Fund Management (incl. PSG FutureWealth) 26,4 31,2 149,2 148,4
Paladin Capital 77,2 65,3 463,3 859,6 559,9
Zeder Investments 83,6 70,9 396,9 925,9 661,8
PSG Corporate (incl. PSG Capital) 26,9 10,9
Management and other fee income 60,7 36,2
Operating costs (38,0) (21,9)
Taxation (7,4) (8,7)
BEE pref share investments 20,6 24,8 184,8 164,2
Other investments 1,4 27,6 12,1 348,2
Funding
Perpetual pref share funding (51,1) (69,0) (551,3) (561,0)
Net interest (29,6) (34,1) (513,9) (408,9)
Other taxation and STC (2,0) (4,1) (6,6) 0,2
non-recurring headline earnings 72,4 (183,5) 180,3 295,3
PSG FutureWealth 21,8
Paladin Capital 89,8 (77,9)
Zeder Investments (23,0) (15,6)
PSG Corporate (net of tax)
Marked-to-market profit/(loss) 26,2 (99,6) 138,6 245,2
Zeder performance fee 12,6
STC (special dividend) (35,4)
Deferred tax assets written off (20,7)
Other 0,1 10,6
m Cubed Holdings 219,7 41,7 50,1
Total headline earnings 431,4 109,9 2 947,0 2 755,4
Statistics change
Weighted average number of shares in issue (million) 173,1 168,4
Recurring HEPS (cents) 207,4 174,3 19,0%
HEPS (cents) 249,2 65,3 281,6%
recurring headline earnings, measured on a see-through basis, increased by 19,0% to 207,4 cents per share for the year ended 28 February 2010. Capitec’s stellar performance was the main reason for the positive growth as some of our investments did not escape the negative impact of the economic recession.
reportable headline earnings increased by 281,6% to 249,2 cents per share, and attributable earnings by 645,2% to 225,8 cents per share. This was mainly as a result of marked-to-market profits following the recovery in global stock markets.
PSG GrouP Limited AnnuAL rePort 2010
13
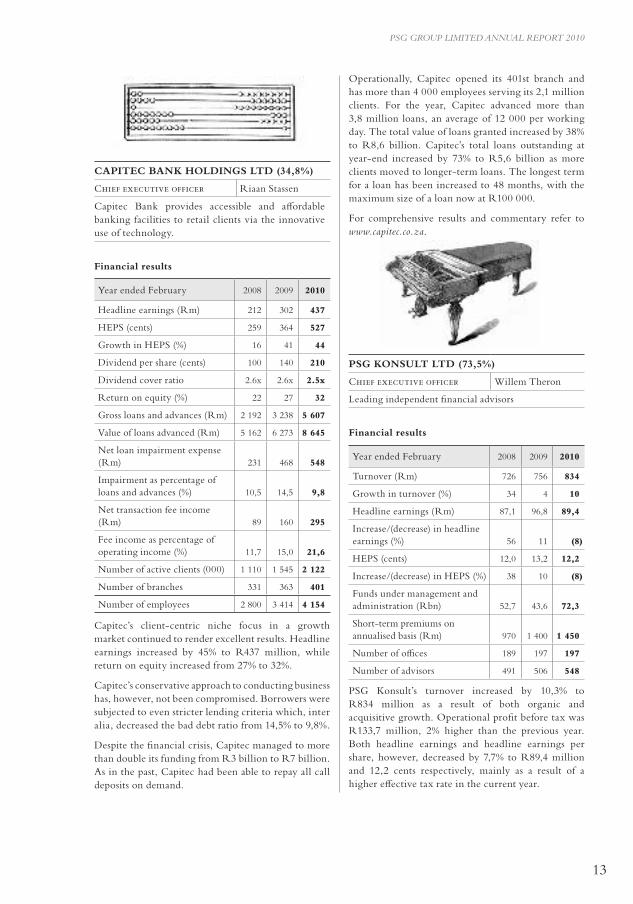
CAPITEC BAnK HOLDInGS LTD (34,8%)
Chief executive officer Riaan Stassen
Capitec Bank provides accessible and affordable banking facilities to retail clients via the innovative use of technology.
Financial results
Year ended February 2008 2009 2010
Headline earnings (Rm) 212 302 437
HEPS (cents) 259 364 527
Growth in HEPS (%) 16 41 44
Dividend per share (cents) 100 140 210
Dividend cover ratio 2.6x 2.6x 2.5x
Return on equity (%) 22 27 32
Gross loans and advances (Rm) 2 192 3 238 5 607
Value of loans advanced (Rm) 5 162 6 273 8 645
Net loan impairment expense (Rm) 231 468 548
Impairment as percentage of loans and advances (%) 10,5 14,5 9,8
Net transaction fee income (Rm) 89 160 295
Fee income as percentage of operating income (%) 11,7 15,0 21,6
Number of active clients (000) 1 110 1 545 2 122
Number of branches 331 363 401
Number of employees 2 800 3 414 4 154
Capitec’s client-centric niche focus in a growth market continued to render excellent results. Headline earnings increased by 45% to R437 million, while return on equity increased from 27% to 32%.
Capitec’s conservative approach to conducting business has, however, not been compromised. Borrowers were subjected to even stricter lending criteria which, inter alia, decreased the bad debt ratio from 14,5% to 9,8%.
Despite the financial crisis, Capitec managed to more than double its funding from R3 billion to R7 billion. As in the past, Capitec had been able to repay all call deposits on demand.
Operationally, Capitec opened its 401st branch and has more than 4 000 employees serving its 2,1 million clients. For the year, Capitec advanced more than 3,8 million loans, an average of 12 000 per working day. The total value of loans granted increased by 38% to R8,6 billion. Capitec’s total loans outstanding at year-end increased by 73% to R5,6 billion as more clients moved to longer-term loans. The longest term for a loan has been increased to 48 months, with the maximum size of a loan now at R100 000.
For comprehensive results and commentary refer to www.capitec.co.za.
PSG KOnSULT LTD (73,5%)
Chief executive officer Willem Theron
Leading independent financial advisors
Financial results
Year ended February 2008 2009 2010
Turnover (Rm) 726 756 834
Growth in turnover (%) 34 4 10
Headline earnings (Rm) 87,1 96,8 89,4
Increase/(decrease) in headline earnings (%) 56 11 (8)
HEPS (cents) 12,0 13,2 12,2
Increase/(decrease) in HEPS (%) 38 10 (8)
Funds under management and administration (Rbn) 52,7 43,6 72,3
Short-term premiums on annualised basis (Rm) 970 1 400 1 450
Number of offices 189 197 197
Number of advisors 491 506 548
PSG Konsult’s turnover increased by 10,3% to R834 million as a result of both organic and acquisitive growth. Operational profit before tax was R133,7 million, 2% higher than the previous year. Both headline earnings and headline earnings per share, however, decreased by 7,7% to R89,4 million and 12,2 cents respectively, mainly as a result of a higher effective tax rate in the current year.
PSG GrouP Limited AnnuAL rePort 2010
14
PSG FUnD MAnAGEMEnT GROUP (PTy) LTD (95,1%) incorporating PSG FUTUREWEALTH LTD (80%)
Chairman Jaap du Toit
Local and offshore investment platform and asset management
PSG Fund Management’s operations incorporate the traditional PSG Fund management business consisting of local and offshore collective investments, asset management, hedge funds and prime broking, and as from March 2009 PSG FutureWealth, an investment life company specialising in investment products such as secured investments, retirement annuities, preservation funds and living annuities.
Financial results
Year ended February 2008 2009 2010
recurring headline earnings (Rm)
– PSG Fund Management 24,7 18,0 14,5
– PSG FutureWealth (100%) 11,1 14,6 16,6
Consolidated recurring headline earnings (including 80% of PSG FutureWealth) (Rm) 33,6 29,1 27,8
Funds under administration (Rbn) 20,5 20,4 23,4
Funds under management (Rbn) 9,3 9,7 11,9
On a comparable basis PSG Fund Management’s recurring headline earnings decreased by 4,5% to R27,8 million. The challenging investment environment, particularly during the first half of the financial year, impacted negatively on the traditional PSG Fund Management business.
Notwithstanding the challenging investment environment, assets under administration increased by 14% to R23,4 billion. Local collective investments had net inflows of R2,1 billion, up from R558 million in the previous financial year. Managed assets increased by 22% to R11,9 billion, which included a net inflow of R747 million, with the balance attributed to stronger equity markets.
Improved market conditions saw headline earnings increasing from R39,5 million for the first half of the financial year to R49,9 million in the second half. Funds under administration increased to R72,3 billion (2009: R43,6 billion), mainly as a result of the acquisition of the T-Sec client base and the market recovery in the latter part of the financial year. Short-term premiums administered on an annualised basis remained in line with the prior year at R1 450 million.
Effective 1 March 2010, PSG Online Securities acquired 100% of PSG Prime, resulting in all the group’s stock broking activities now being housed under PSG Konsult.
PSG Konsult Nhluvuko, a BEE initiative aimed at the corporate market, is now fully operational and was profitable for the financial year under review. As from May 2010, this company will be known as PSG Konsult Corporate.
Industry
Although the markets have recovered and the sentiment is more positive than a year ago, the financial services sector is undergoing structural changes following the global financial crisis, which could impact our business going forward.
It is imperative for PSG Konsult to remain focused on its clients’ needs. One cannot afford to succumb to the temptation to react to short-term fluctuations when a long-term strategy is essential for sound investment and financial planning.
Locally, higher electricity and fuel prices coupled with lower salary increases are likely to place clients under financial pressure. History has showed that the collection of short-term insurance premiums usually dwindles under such circumstances. Our advisors will always assist clients to structure their short-term insurance portfolios with available financial resources in mind.
Prospects
Through the increased number of advisors, PSG Konsult will focus on servicing its clients on a personal basis, with a long-term view to maintain and enhance their wealth.
The demand for online financial services is on the rise. PSG online is suitably positioned and is continuously enhancing its product offering to cater for the whole spectrum of financial needs.
For comprehensive results and commentary refer to www.psgkonsult.co.za.
PSG GrouP Limited AnnuAL rePort 2010
15
PALADIn CAPITAL LTD (80,6%)
Chief executive officer Francois Swart
Dedicated investment company
Our business model
Paladin, PSG Group’s investment company in sectors other than agriculture, food and beverages, listed on the JSE in September 2009 and raised R150 million by means of a renounceable rights issue to PSG shareholders shortly thereafter. PSG invested R52,2 million.
Paladin invests in businesses that are easily understood, have strong sustainable cash flows, where management are large shareholders and where Paladin’s share of profit after tax is greater than R10 million. It is strategically involved in its investee companies and actively partners with management to advance the businesses to the next level. Paladin currently has 13 investments across a number of industries.
Financial results
Year ended February 2008 2009 2010
recurring headline earnings (Rm) 62,8 78,2 95,5
recurring HEPS (cents) 18,7 20,0 19,3
Headline earnings/(loss) (Rm) 75,4 (18,0) 217,3
HEPS (cents) 22,5 (4,6) 43,9
Net intrinsic value (Rm) 486 1 167
Intrinsic value per share (cents) 123 203
Paladin’s recurring headline earnings increased by 22,1% to R95,5 million. This is predominantly due to an increase in earnings from investee companies and the first time inclusion of Petmin’s results. Paladin’s reportable headline earnings increased to R217,3 million as opposed to an R18 million loss in the prior year. This increase is mainly as a result of marked-to-market profits incurred in Thembeka’s investment portfolio of listed shares in the JSE Ltd, PSG Group and Capitec.
Effective 1 September 2009, PSG, as manager of Paladin, earns a management fee based on 1% of the market capitalisation of Paladin and a performance fee representing 10% of the growth in the return for shareholders (increase in share price and dividends paid). The 2010 management fee before tax amounted to R4,6 million with the maiden performance fee, if applicable, only payable at 28 February 2011.
Corporate action
Significant investments made by Paladin during the past year included 50% in Curro, a private school group for R50 million, 9,4% in Petmin (previously owned by PSG) by means of a share swap for a consideration of R92 million, 20,4% in Spirit Capital, a leveraged buy-out specialist, and the acquisition of an additional 17,5% stake in Topfix increasing its interest to 28,2%. Paladin also disposed of its interests in Mainfin for R17,4 million and Axon for R4 million.
Our investment portfolio
Industry/Company Description
% Held
Investment companies
Thembeka BEE investment company 49%
Spirit Leveraged buy-outs 20%
Services
CIC FMCG 50%
IQuad Outsourcing services 43%
African Unity Life and related insurance 43%
Mining, construction and related services
Precrete Mine safety and support services 22%
Petmin Diversified miner 9%
Erbacon Construction 22%
Top Fix Construction support services 28%
Manufacturing
GRW Tank manufacturer 40%
Lesotho Milling Milling 25%
Protea Gietery Non-ferrous foundry 50%
Education
Curro Private school education 50%
The future
Effective 1 March 2010, PSG Fund Management acquired the remaining 20% minority interests in PSG FutureWealth and in the process formed a combined product licencing platform called PSG Wealth.
Also effective 1 March 2010, PSG Fund Management’s asset management capabilities were combined. Research and analyst functions are now pooled together and we are in the process of creating a single PSG branded asset management business with a simplified holistic product range covering the full investment risk spectrum.
PSG GrouP Limited AnnuAL rePort 2010
16
Prospects
The investee companies are well capitalised and positioned to grow their businesses and market share in their respective industries. Paladin will continue to add value to its investee companies through active input on a strategic and operational level.
Paladin has initiated the following since year-end:
• Raised R100 million by means of a five-year, fixed rate preference share with dividend and capital payable on maturity.
• Purchased an additional 26% interest for a controlling stake in Curro (subject to regulatory approval) for a total consideration of R52 million.
For comprehensive results and commentary refer to www.paladincapital.co.za.
ZEDER InVESTMEnTS LTD (40,6%)
Chief executive officer Antonie Jacobs
Agricultural, food and beverage investment company
Zeder is a JSE-listed investment company in the agricultural, food and beverage sectors. It successfully concluded a rights issue, underwritten by PSG, in terms of which R495 million was raised at R1,35 per share in June 2009. PSG invested R211,6 million.
Financial results
Year ended February 2008 2009 2010
Headline earnings (Rm) 206,5 153,4 152,0
recurring headline earnings (Rm) 122,4 196,0 208,1
HEPS (cents) 35,4 25,2 17,3
recurring HEPS (cents) 21,0 32,2 23,6
Intrinsic value per share (cents) 224 192 211
Dividend per share (cents) 5,0 7,0 4,0
recurring headline earnings increased by 6,2% to R208,1 million, while recurring headline earnings per share decreased by 26,7% to 23,6 cents. reportable
headline earnings per share decreased by 31,3% to 17,3 cents. The main reasons for the decrease are:
• The majority of the cash raised in terms of the aforementioned rights issue was only invested in the latter part of the financial year;
• A reduced effective interest in Distell coupled with a significantly lower return on the investment in KWV’s own operational business;
• Disappointing results from MGK; and• A R350 million non-recurring provision by Pioneer
Foods for its potential fine to the Competition Commission, of which Zeder’s effective share amounted to R43,9 million. Without this provision Zeder’s headline earnings would have amounted to 22,2 cents per share.
PSG, as manager of Zeder, earns a 2% management fee based on the net asset value (excluding cash) of the group, and 0,15% on the company’s cash. The 2010 management fee before tax amounted to R36,3 million (2009: R31,2 million). In the prior year PSG also earned a performance fee of R17,5 million.
Portfolio
Zeder’s current portfolio of some R2,2 billion comprises agri, food and beverage related investments in 13 companies, of which Kaap Agri, Capevin and KWV represent almost 80%.
Kaap Agri Ltd 41,3%
KWV Holdings Ltd 31,3%
Capevin Holdings Ltd 37,0%
Suidwes Investments Ltd 18,4%
OVK Operations Ltd 9,2%
NWK Ltd 7,4%
MGK Business Investments Ltd 26,7%
Agricol Holdings Ltd 20,3%
KLK Ltd 10,0%
Tuinroete Agri Ltd 10,0%
BKB Ltd 3,7%
Capespan Group Ltd 14,6%
Prospects
Zeder’s current cash of R120 million, together with an existing R300 million funding facility, will provide it with sufficient capital to pursue attractive identified investment opportunities.
For comprehensive results and commentary refer to www.zeder.co.za
PSG GrouP Limited AnnuAL rePort 2010
17
The global financial crisis saw a market in which liquidity dried up, with limited access to funding resources. At the time, the PSG Exco believed it to be prudent to raise capital and loan funding at a PSG Group level in order to selectively provide subsidiary companies with capital for investment purposes in the form of equity and/or short-term bridging facilities. The majority of the following cash was raised during the first half of the past financial year:
• R200 million by means of a 4-year preference share; and
• R119,9 million through the issue of 7,7 million PSG Group shares to strategic shareholders at market price.
However, market circumstances have definitely improved since and all our investee companies are in a sound financial and cash position. Coupled with a PSG share price trading at an attractive discount to intrinsic value, the PSG Exco made a decision to invest excess cash in PSG by repurchasing 6,4 million of its own shares for a consideration of R140,9 million during January and February 2010 – this transaction will have a positive effect on both recurring headline earnings and intrinsic value per share.
The net increase in the listed share prices of our strategic and non-strategic investments accounted for the non-recurring marked-to-market profits achieved during the year under review.
Prospects
We will continue to invest in assets and sectors that offer attractive growth prospects and returns.
PSG CAPITAL (100%)
Chief executive officer Johan Holtzhausen
Corporate finance advisory services
PSG Capital is the corporate finance arm of PSG Group. It is a JSE-registered sponsor and designated advisor. PSG Capital advises on mergers and acquisitions, listings, restructurings, capital raisings and BEE transactions, and performs valuations and fair and reasonable opinions. It currently has 32 JSE-listed and numerous unlisted clients.
PSG CORPORATE (100%)
PSG Corporate acts as PSG Group treasurer, allocates capital and determines and monitors the group’s gearing. It is also the appointed manager to both Zeder and Paladin.
PSG GrouP Limited AnnuAL rePort 2010
18
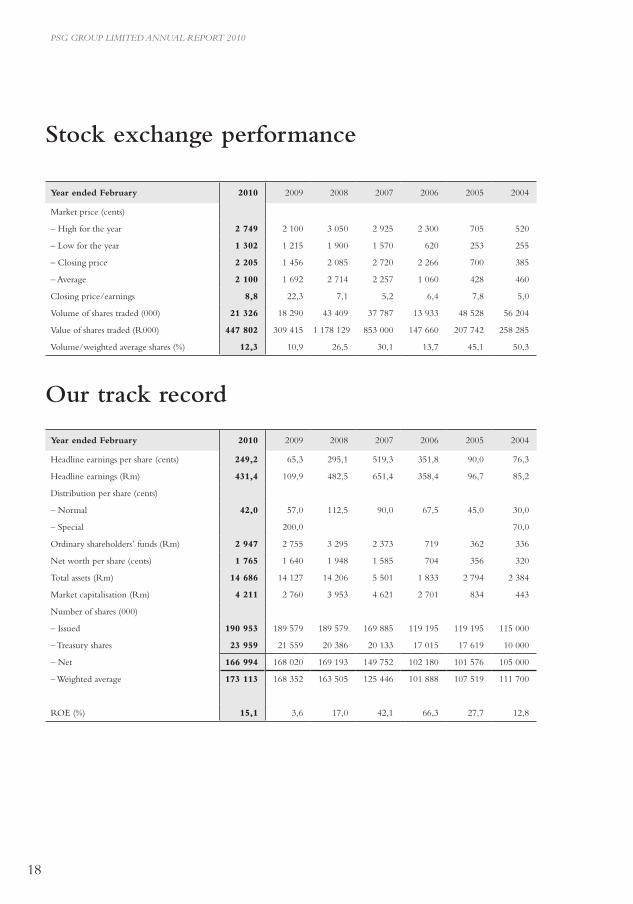
Stock exchange performance
year ended February 2010 2009 2008 2007 2006 2005 2004 2003 2002 2001 2000 1999 1998 1997 1996
Market price (cents)
– High for the year 2 749 2 100 3 050 2 925 2 300 705 520 650 885 986 1 585 1 900 1 550 510 300
– Low for the year 1 302 1 215 1 900 1 570 620 253 255 375 440 527 800 495 445 210 20
– Closing price 2 205 1 456 2 085 2 720 2 266 700 385 520 476 660 1 000 1 170 1 530 470 225
– Average 2 100 1 692 2 714 2 257 1 060 428 460 512 675 685 1 114 1 172 966 401 78
Closing price/earnings 8,8 22,3 7,1 5,2 6,4 7,8 5,0 7,4 3,4 4,4 8,3 13,6 32,3 17,9 16,4
Volume of shares traded (000) 21 326 18 290 43 409 37 787 13 933 48 528 56 204 42 636 47 775 49 009 45 265 30 219 23 443 14 120 22 210
Value of shares traded (R000) 447 802 309 415 1 178 129 853 000 147 660 207 742 258 285 218 168 322 493 335 512 504 273 354 050 226 564 56 557 17 238
Volume/weighted average shares (%) 12,3 10,9 26,5 30,1 13,7 45,1 50,3 35,5 38,5 36,8 33,1 31,7 32,2 35,7 101,8
Our track record
year ended February 2010 2009 2008 2007 2006 2005 2004 2003 2002 2001 2000 1999 1998 1997 1996
Headline earnings per share (cents) 249,2 65,3 295,1 519,3 351,8 90,0 76,3 70,7 141,0 150,3 120,6 85,9 47,3 25,5 14,4
Headline earnings (Rm) 431,4 109,9 482,5 651,4 358,4 96,7 85,2 84,8 175,2 200,2 164,7 82,0 34,5 10,1 3,1
Distribution per share (cents)
– Normal 42,0 57,0 112,5 90,0 67,5 45,0 30,0 20,0 50,0 45,0 36,0 25,0
– Special 200,0 70,0 200,0
Ordinary shareholders’ funds (Rm) 2 947 2 755 3 295 2 373 719 362 336 993 1 218 1 141 1 085 638 535 78 7
Net worth per share (cents) 1 765 1 640 1 948 1 585 704 356 320 828 1 015 899 778 669 617 147 34
Total assets (Rm) 14 686 14 127 14 206 5 501 1 833 2 794 2 384 2 594 4 477 3 416 3 474 2 543 1 258 233 25
Market capitalisation (Rm) 4 211 2 760 3 953 4 621 2 701 834 443 624 571 838 1 395 1 117 1 325 249 49
Number of shares (000)
– Issued 190 953 189 579 189 579 169 885 119 195 119 195 115 000 120 000 120 000 126 900 139 500 95 445 86 611 52 930 21 818
– Treasury shares 23 959 21 559 20 386 20 133 17 015 17 619 10 000
– Net 166 994 168 020 169 193 149 752 102 180 101 576 105 000 120 000 120 000 126 900 139 500 95 445 86 611 52 930 21 818
– Weighted average 173 113 168 352 163 505 125 446 101 888 107 519 111 700 120 000 124 204 133 200 136 613 95 445 72 869 39 588 21 818
ROE (%) 15,1 3,6 17,0 42,1 66,3 27,7 12,8 7,7 14,9 18,0 19,1 14,0 11,3 23,8 88,6
PSG GrouP Limited AnnuAL rePort 2010
19
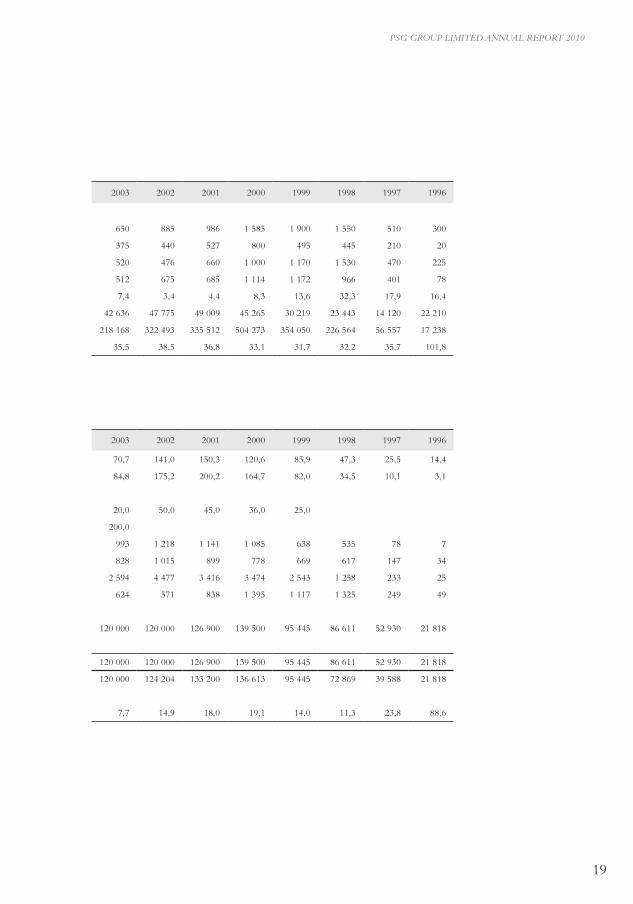
year ended February 2010 2009 2008 2007 2006 2005 2004 2003 2002 2001 2000 1999 1998 1997 1996
Market price (cents)
– High for the year 2 749 2 100 3 050 2 925 2 300 705 520 650 885 986 1 585 1 900 1 550 510 300
– Low for the year 1 302 1 215 1 900 1 570 620 253 255 375 440 527 800 495 445 210 20
– Closing price 2 205 1 456 2 085 2 720 2 266 700 385 520 476 660 1 000 1 170 1 530 470 225
– Average 2 100 1 692 2 714 2 257 1 060 428 460 512 675 685 1 114 1 172 966 401 78
Closing price/earnings 8,8 22,3 7,1 5,2 6,4 7,8 5,0 7,4 3,4 4,4 8,3 13,6 32,3 17,9 16,4
Volume of shares traded (000) 21 326 18 290 43 409 37 787 13 933 48 528 56 204 42 636 47 775 49 009 45 265 30 219 23 443 14 120 22 210
Value of shares traded (R000) 447 802 309 415 1 178 129 853 000 147 660 207 742 258 285 218 168 322 493 335 512 504 273 354 050 226 564 56 557 17 238
Volume/weighted average shares (%) 12,3 10,9 26,5 30,1 13,7 45,1 50,3 35,5 38,5 36,8 33,1 31,7 32,2 35,7 101,8
Our track record
year ended February 2010 2009 2008 2007 2006 2005 2004 2003 2002 2001 2000 1999 1998 1997 1996
Headline earnings per share (cents) 249,2 65,3 295,1 519,3 351,8 90,0 76,3 70,7 141,0 150,3 120,6 85,9 47,3 25,5 14,4
Headline earnings (Rm) 431,4 109,9 482,5 651,4 358,4 96,7 85,2 84,8 175,2 200,2 164,7 82,0 34,5 10,1 3,1
Distribution per share (cents)
– Normal 42,0 57,0 112,5 90,0 67,5 45,0 30,0 20,0 50,0 45,0 36,0 25,0
– Special 200,0 70,0 200,0
Ordinary shareholders’ funds (Rm) 2 947 2 755 3 295 2 373 719 362 336 993 1 218 1 141 1 085 638 535 78 7
Net worth per share (cents) 1 765 1 640 1 948 1 585 704 356 320 828 1 015 899 778 669 617 147 34
Total assets (Rm) 14 686 14 127 14 206 5 501 1 833 2 794 2 384 2 594 4 477 3 416 3 474 2 543 1 258 233 25
Market capitalisation (Rm) 4 211 2 760 3 953 4 621 2 701 834 443 624 571 838 1 395 1 117 1 325 249 49
Number of shares (000)
– Issued 190 953 189 579 189 579 169 885 119 195 119 195 115 000 120 000 120 000 126 900 139 500 95 445 86 611 52 930 21 818
– Treasury shares 23 959 21 559 20 386 20 133 17 015 17 619 10 000
– Net 166 994 168 020 169 193 149 752 102 180 101 576 105 000 120 000 120 000 126 900 139 500 95 445 86 611 52 930 21 818
– Weighted average 173 113 168 352 163 505 125 446 101 888 107 519 111 700 120 000 124 204 133 200 136 613 95 445 72 869 39 588 21 818
ROE (%) 15,1 3,6 17,0 42,1 66,3 27,7 12,8 7,7 14,9 18,0 19,1 14,0 11,3 23,8 88,6
PSG GrouP Limited AnnuAL rePort 2010
20
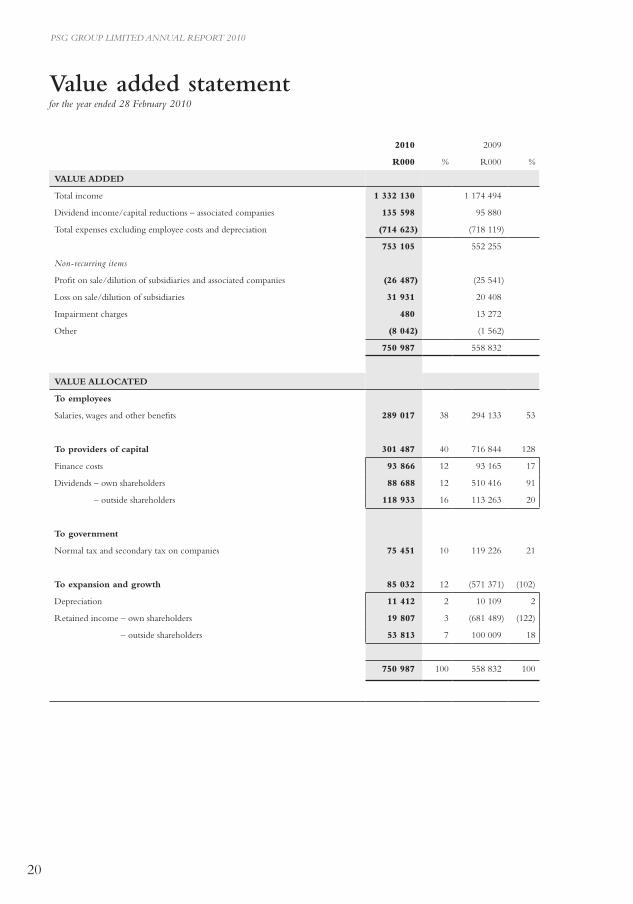
Value added statementfor the year ended 28 February 2010
2010 2009
r000 % R000 %
VALUE ADDED
Total income 1 332 130 1 174 494
Dividend income/capital reductions – associated companies 135 598 95 880
Total expenses excluding employee costs and depreciation (714 623) (718 119)
753 105 552 255
non-recurring items
Profit on sale/dilution of subsidiaries and associated companies (26 487) (25 541)
Loss on sale/dilution of subsidiaries 31 931 20 408
Impairment charges 480 13 272
Other (8 042) (1 562)
750 987 558 832
VALUE ALLOCATED
To employees
Salaries, wages and other benefits 289 017 38 294 133 53
To providers of capital 301 487 40 716 844 128
Finance costs 93 866 12 93 165 17
Dividends – own shareholders 88 688 12 510 416 91
– outside shareholders 118 933 16 113 263 20
To government
Normal tax and secondary tax on companies 75 451 10 119 226 21
To expansion and growth 85 032 12 (571 371) (102)
Depreciation 11 412 2 10 109 2
Retained income – own shareholders 19 807 3 (681 489) (122)
– outside shareholders 53 813 7 100 009 18
750 987 100 558 832 100
PSG GrouP Limited AnnuAL rePort 2010
21
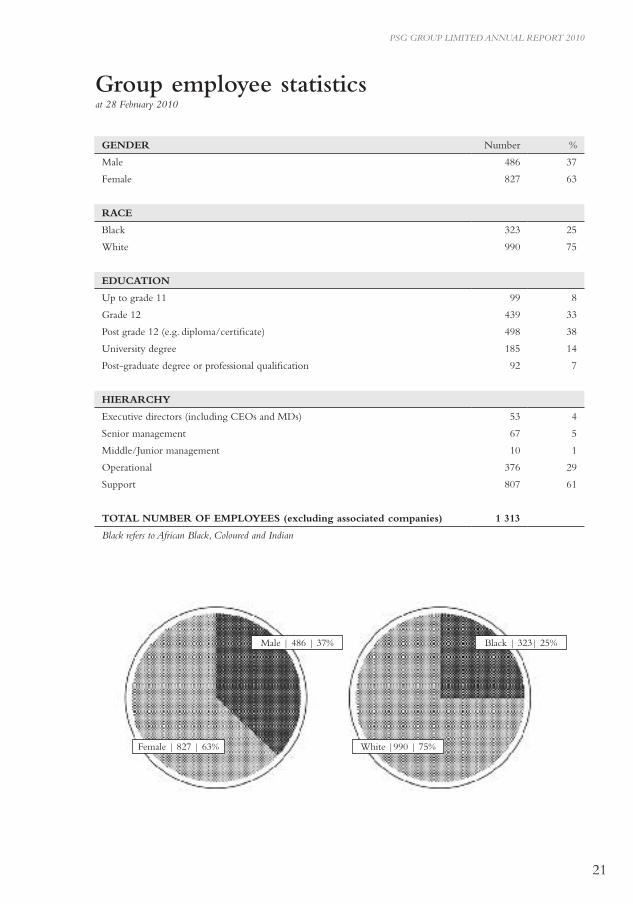
Group employee statisticsat 28 February 2010
GEnDER Number %
Male 486 37
Female 827 63
RACE
Black 323 25
White 990 75
EDUCATIOn
Up to grade 11 99 8
Grade 12 439 33
Post grade 12 (e.g. diploma/certificate) 498 38
University degree 185 14
Post-graduate degree or professional qualification 92 7
HIERARCHy
Executive directors (including CEOs and MDs) 53 4
Senior management 67 5
Middle/Junior management 10 1
Operational 376 29
Support 807 61
TOTAL nUMBER OF EMPLOyEES (excluding associated companies) 1 313
Black refers to African Black, Coloured and indian
Male | 486 | 37%
Female | 827 | 63%
Black | 323| 25%
White |990 | 75%
PSG GrouP Limited AnnuAL rePort 2010
22
The major operating subsidiaries and associated companies all operate on similar principles.
REMUnERATIOn COMMITTEE
The remuneration committee comprises mainly independent non-executive directors, being Messrs MJ Jooste (chairman), L van A Bellingan, PE Burton, MM du Toit and CH Wiese, as well as Mr CA Otto, a non-executive director. The committee met once during the past year, and a quorum was present.
The committee is chaired by an independent non-executive. Each major group subsidiary has its own remuneration committee chaired by Mr CA Otto.
This committee operates according to a board-approved charter and is primarily responsible for overseeing the remuneration and incentives of the executive directors as well as providing strategic guidance to the other remuneration committees in the group. It takes cognisance of both local and international best remuneration practices in order to ensure that such total remuneration is fair and reasonable to both the employee and the company.
AUDIT AnD RISK COMMITTEE
A report by the PSG Group Ltd Audit and Risk Committee has been provided on page 25 of this annual report.
EXECUTIVE DIRECTORS’ REMUnERATIOn
The remuneration of the executive directors of PSG Group is dealt with in the directors’ report.
RISK MAnAGEMEnT AnD InTERnAL COnTROL
The board acknowledges that it is accountable for the process of risk management and the system of internal control of the group.
The group operates in a highly regulated environment. Compliance officers have been appointed at each of the group’s key operating subsidiary and associated company levels for ensuring adherence to the various Acts and Codes that govern the day-to-day operations.
Each group company has its own board of directors responsible for the management, including risk management and internal control, of that company and its business. Detailed risk management plans have been implemented, thereby ensuring that all significant business risks, including operational risk, are identified and appropriately managed.
The PSG Group is committed to the principles of transparency, integrity and accountability as also advocated in the King Report on Corporate Governance. Accordingly PSG Group’s corporate governance policies have in all respects been appropriately applied during the period under review.
The group’s major subsidiaries and associated companies are similarly committed having, inter alia, their own audit, risk and remuneration committees.
BOARD OF DIRECTORS
Details of PSG Group’s directors are provided on page 10 of this annual report.
The board met four times during the past year and had close to a 100% attendance.
Executive directors do not have service contracts and may not be appointed for a period exceeding five years. Where appropriate, the chief executives and executive directors of subsidiary companies have entered into service contracts with that subsidiary.
PSG Group is a financial services company with little day-to-day operations and has not filled the office of CEO. There is a clear division of responsibilities at board level to ensure a balance of power and authority, such that no one individual has unfettered powers of decision making. Mr JF Mouton fills the role of executive chairman. The appointment of directors is formal and transparent and is considered to be a matter for the board as a whole. All the directors are shareholders in the company.
The board’s key roles and responsibilities are:
• Promoting the interests of stakeholders• Formulation and approval of strategy• Retaining effective control• Ultimate accountability and responsibility for the
performance and affairs of the company
The board has appointed the following committees to assist it in the performance of its duties:
• Executive committee• Remuneration committee• Audit and risk committee
EXECUTIVE COMMITTEE
The PSG Executive Committee (“Exco”) comprises Messrs JF Mouton (chairman), CA Otto (non-executive), J de V du Toit (non-executive), WL Greeff, PJ Mouton, JA Holtzhausen and B van der Linde. This committee meets regularly, at least twice a month, and is primarily responsible for the allocation and investing of the group’s resources, including capital.
Corporate governance
PSG GrouP Limited AnnuAL rePort 2010
23
to make the best use of the human capital we have available.
All employees are encouraged and motivated to better themselves through training and study. Training programmes initiated by companies in the group are regarded as an essential element of PSG Group’s investment in human capital.
Employee participation
In order to retain and attract entrepreneurs, the group has a philosophy of encouraging management and key employees in the group to acquire a meaningful interest in the group and/or in its underlying businesses. A significant percentage of employees are shareholders in the company, participants in the share incentive schemes and shareholders in subsidiary and associated companies. Employees are co-owners of the business and are treated as such, with transparent communication a priority.
Employment equity
The group is a New South Africa company and is representative of all the people in South Africa. PSG Group subscribes to the principle of equal opportunity. Group companies have set their own targets and specific action plans.
Ethics
PSG Group’s code of ethics commits the group to maintaining high ethical and moral codes of conduct in its professional and social dealings. This is ingrained in the culture of the group.
Products and product development
PSG Group acts as investor for own account, as financier and finance conduit for the group. Group companies develop their own specialist product ranges such as insurance, investment, broking, multi- management, financial training, asset management and investor support products.
The group also provides legal, financial and regulatory support and advice to listed and non-listed clients.
Distribution
In the main, each company has its own distribution channel. These channels are based on one-to-one, one-to-many, internet, or professional intermediary network according to its products and client profile.
A meaningful volume of cross-selling into the various client bases is already taking place and continues to be a priority for growth.
Financial Sector Charter
The group endorses the principles of the Financial Sector Charter and the implementation enjoys the attention of senior management in the group.
The group audit and risk committee assists the board in discharging the responsibilities and monitors the advice given by the operating companies’ audit or finance committees to the respective boards.
InTERnAL AUDIT
On the recommendation of the audit and risk committee the board has decided not to establish an internal audit function at group level. Where appropriate, subsidiary and associated companies have their own internal audit departments.
SUSTAInABILITy
Stakeholder relations
PSG Group subscribes to the principles of objective, honest, timeous, balanced, relevant and understandable communication of financial and non-financial information to stakeholders.
The group acknowledges the task and responsibility of regulators, and our relationships with them are maintained in a businesslike manner - frank, open and with mutual respect.
Safety, health and environment
PSG Group is committed to ensuring that employees work in a safe, healthy and clean environment. Our activities do not have an adverse effect on the environment.
The group recognises that South Africa is facing an HIV/Aids epidemic of considerable proportions. Although our healthcare system will bear (and is already bearing) the initial brunt of the epidemic, there is little doubt that it is affecting every aspect of our society. We encourage all our people to act responsibly at all times.
Social responsibility
PSG’s social responsibility areas of endeavour are socio-economic, the youth and education in a wide sense. The long-term aim is to make a contribution to the advancement of stability in South Africa. Education is one of the most basic needs of society. We thoroughly believe that an educated community will sustainably improve the long-term well being of society. PSG has therefore directed its Corporate Social Investment efforts at supporting education on various levels. PSG also subscribes to social upliftment through Black Economic Empowerment (BEE), and supports same having invested in various BEE initiatives. PSG furthermore pays all its taxes regularly and encourages government to spend its receipts responsibly.
Refer to the Chairman’s Letter for more details regarding PSG’s Corporate Social Investments.
Human resources
PSG Group regards its people as the most important element of its business. It is therefore important
24
PSG GROUP LIMITED ANNUAL REPORT 2010
Annual financial statementsPSG Group Limited
Report of the audit and risk committee 25
Approval of annual financial statements 25
Report of the independent auditor 26
Declaration by the company secretary 26
Directors’ report 27
Statements of financial position 32
Income statements 33
Statements of comprehensive income 34
Statements of changes in equity 35
Statements of cash flows 37
Accounting policies 38
Notes to the annual financial statements 53
Annexure A – Investments
• Interest in subsidiaries 95
• Investment in associated companies 95
• Financial information in respect of principal
associated companies 96
Annexure B – Segment report 97
Annexure C – Share analysis 98
Contents
25
PSG GROUP LIMITED ANNUAL REPORT 2010
Approval of annual financial statementsThe directors are responsible for the maintenance of adequate accounting records and to prepare annual financial statements that fairly represent the state of affairs and the results of the group. The external auditor is responsible for independently auditing and reporting on the fair presentation of these annual financial statements. Management fulfils this responsibility primarily by establishing and maintaining accounting systems and practices adequately supported by internal accounting controls. Such controls provide assurance that the group’s assets are safeguarded, that transactions are executed in accordance with management’s authorisations and that the financial records are reliable. The annual financial statements are prepared in accordance with International Financial Reporting Standards (IFRS) and incorporate full and reasonable disclosure. Appropriate and recognised accounting policies are consistently applied.
The audit and risk committee of the group meets regularly with the external auditor, as well as senior management, to evaluate matters concerning accounting policies, internal control, auditing and financial reporting. The external auditor
has unrestricted access to all records, assets and personnel as well as to the audit and risk committee.
The financial statements are prepared on the going concern basis, since the directors have every reason to believe that the group has adequate resources to continue for the foreseeable future.
The financial statements set out on pages 27 to 98 were approved by the board of directors of PSG Group Ltd and are signed on its behalf by:
JF Mouton WL GreeffChairman Financial director
19 May 2010Stellenbosch
Report of the audit and risk committeeThe PSG Group Ltd Audit and Risk Committee (“the committee”) comprises Messrs J de V du Toit (chairman), L van A Bellingan and PE Burton. All the members are independent non-executive directors. The committee met twice during the past year and had a 100% attendance.
The committee reports that it has considered the matters set out in section 270A(5) of the Companies Act, 61 of 1973, as amended by the Corporate Laws Amendment Act, and is satisfied with the independence and objectivity of the external auditor, PricewaterhouseCoopers Inc. The committee has considered and recommended the fees payable to the external auditor and is satisfied with the extent of non-audit related services performed.
This committee also acted as the statutory audit committee of those public company subsidiaries that are legally required to have such a committee.
As required by JSE Listings Requirement 3.84(i), the committee has satisfied itself that the group financial director has appropriate expertise and experience.
Based on the information and explanations given by management and discussions with the independent external auditor regarding the results of their audit, the committee is satisfied that there was no material breakdown in the internal accounting controls during the financial year under review.
The committee has evaluated the financial statements of PSG Group Ltd and the group for the year ended 28 February 2010 and, based on the information provided to the committee, considers that the group complies, in all material respects, with the requirements of the Companies Act, 61 of 1973, as amended, and International Financial Reporting Standards (IFRS).
J de V du ToitChairman 19 May 2010
26
PSG GROUP LIMITED ANNUAL REPORT 2010
Report of the independent auditorto the members of PSG Group Ltd
Declaration by the company secretary
We declare that, to the best of our knowledge, the company has lodged with the Registrar all such returns as are required of a public company in terms of the Companies Act and that all such returns are true, correct and up to date.
PSG Corporate Services (Pty) LtdPer CJ SiertsemaCompany secretary
19 May 2010 Stellenbosch
We have audited the group annual financial statements and annual financial statements of PSG Group Ltd, which comprise the consolidated and separate statements of financial position as at 28 February 2010, and the consolidated and separate income statements, statements of comprehensive income, changes in equity and cash flows for the year then ended, and a summary of significant accounting policies and other explanatory notes, and the directors’ report, as set out on pages 27 to 98.
Directors’ responsibility for the financial statementsThe company’s directors are responsible for the preparation and fair presentation of these financial statements in accordance with International Financial Reporting Standards and in the manner required by the Companies Act of South Africa. This responsibility includes: designing, implementing and maintaining internal control relevant to the preparation and fair presentation of financial statements that are free from material misstatement, whether due to fraud or error; selecting and applying appropriate accounting policies; and making accounting estimates that are reasonable in the circumstances.
Auditor’s responsibilityOur responsibility is to express an opinion on these financial statements based on our audit. We conducted our audit in accordance with International Standards on Auditing. Those standards require that we comply with ethical requirements and plan and perform the audit to obtain reasonable assurance whether the financial statements are free from material misstatement.
An audit involves performing procedures to obtain audit evidence about the amounts and disclosures in the financial statements. The procedures selected depend on the auditor’s judgement, including the assessment of the risks of material
misstatement of the financial statements, whether due to fraud or error. In making those risk assessments, the auditor considers internal control relevant to the entity’s preparation and fair presentation of the financial statements in order to design audit procedures that are appropriate in the circumstances, but not for the purpose of expressing an opinion on the effectiveness of the entity’s internal control. An audit also includes evaluating the appropriateness of accounting policies used and the reasonableness of accounting estimates made by management, as well as evaluating the overall presentation of the financial statements.
We believe that the audit evidence we have obtained is sufficient and appropriate to provide a basis for our audit opinion.
OpinionIn our opinion, the financial statements present fairly, in all material respects, the consolidated and separate financial position of PSG Group Ltd as at 28 February 2010, and its consolidated and separate financial performance and its consolidated and separate cash flows for the year then ended in accordance with International Financial Reporting Standards and in the manner required by the Companies Act of South Africa.
PricewaterhouseCoopers Inc. Director: HD NelRegistered auditor
19 May 2010 Cape Town
27
PSG GROUP LIMITED ANNUAL REPORT 2010
Directors’ report
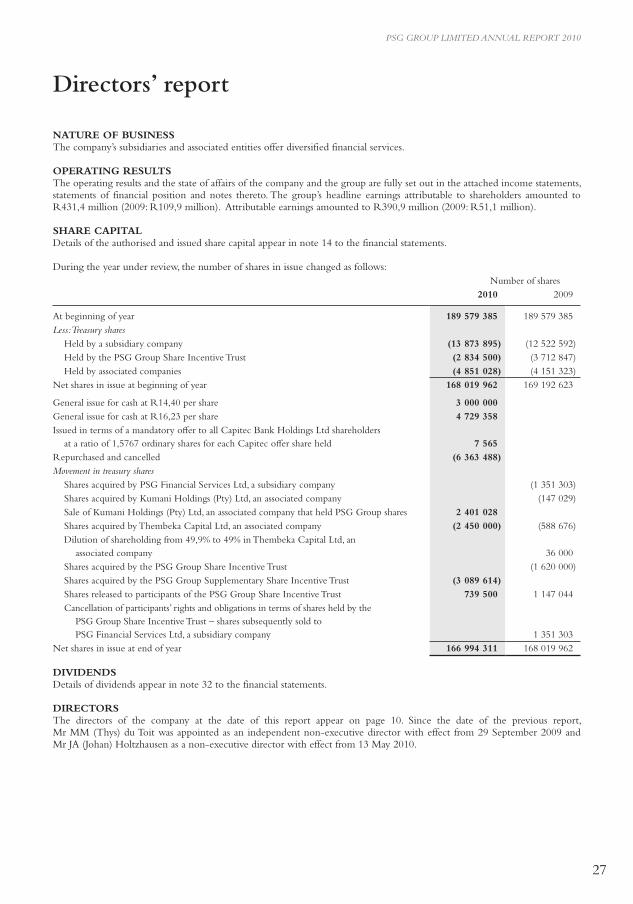
NATURE OF BUSINESSThe company’s subsidiaries and associated entities offer diversified financial services.
OPERATING RESULTSThe operating results and the state of affairs of the company and the group are fully set out in the attached income statements, statements of financial position and notes thereto. The group’s headline earnings attributable to shareholders amounted to R431,4 million (2009: R109,9 million). Attributable earnings amounted to R390,9 million (2009: R51,1 million).
SHARE CAPITALDetails of the authorised and issued share capital appear in note 14 to the financial statements.
During the year under review, the number of shares in issue changed as follows: Number of shares
2010 2009
At beginning of year 189 579 385 189 579 385Less: Treasury shares
Held by a subsidiary company (13 873 895) (12 522 592)Held by the PSG Group Share Incentive Trust (2 834 500) (3 712 847)Held by associated companies (4 851 028) (4 151 323)
Net shares in issue at beginning of year 168 019 962 169 192 623
General issue for cash at R14,40 per share 3 000 000General issue for cash at R16,23 per share 4 729 358Issued in terms of a mandatory offer to all Capitec Bank Holdings Ltd shareholders
at a ratio of 1,5767 ordinary shares for each Capitec offer share held 7 565Repurchased and cancelled (6 363 488)Movement in treasury shares
Shares acquired by PSG Financial Services Ltd, a subsidiary company (1 351 303)Shares acquired by Kumani Holdings (Pty) Ltd, an associated company (147 029)Sale of Kumani Holdings (Pty) Ltd, an associated company that held PSG Group shares 2 401 028Shares acquired by Thembeka Capital Ltd, an associated company (2 450 000) (588 676)Dilution of shareholding from 49,9% to 49% in Thembeka Capital Ltd, an
associated company 36 000Shares acquired by the PSG Group Share Incentive Trust (1 620 000)Shares acquired by the PSG Group Supplementary Share Incentive Trust (3 089 614)Shares released to participants of the PSG Group Share Incentive Trust 739 500 1 147 044Cancellation of participants’ rights and obligations in terms of shares held by the
PSG Group Share Incentive Trust – shares subsequently sold to PSG Financial Services Ltd, a subsidiary company 1 351 303
Net shares in issue at end of year 166 994 311 168 019 962
DIVIDENDSDetails of dividends appear in note 32 to the financial statements.
DIRECTORSThe directors of the company at the date of this report appear on page 10. Since the date of the previous report, Mr MM (Thys) du Toit was appointed as an independent non-executive director with effect from 29 September 2009 and Mr JA (Johan) Holtzhausen as a non-executive director with effect from 13 May 2010.
28
PSG GROUP LIMITED ANNUAL REPORT 2010
Directors’ reportcontinued
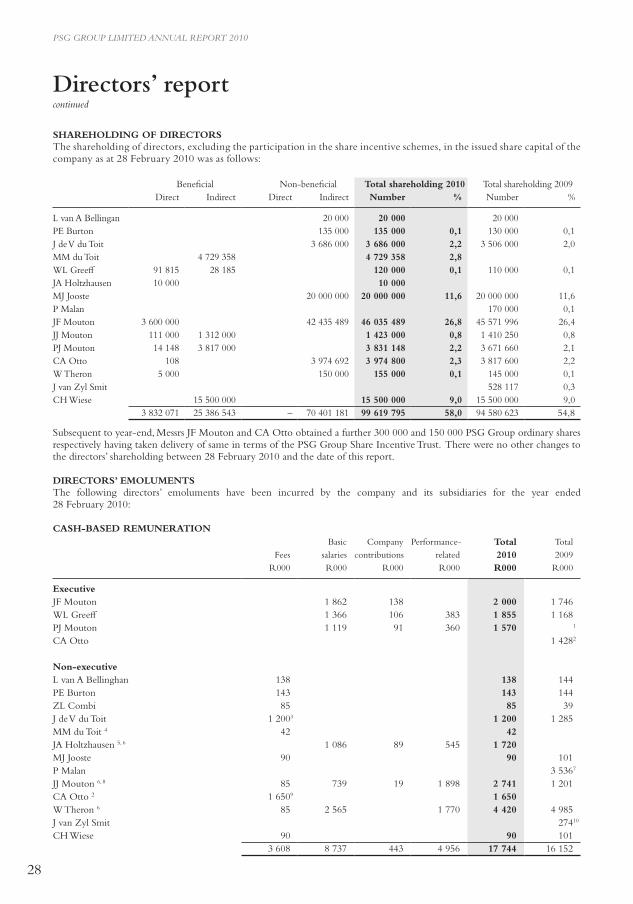
SHAREHOLDING OF DIRECTORSThe shareholding of directors, excluding the participation in the share incentive schemes, in the issued share capital of the company as at 28 February 2010 was as follows:
Beneficial Non-beneficial Total shareholding 2010 Total shareholding 2009Direct Indirect Direct Indirect Number % Number %
L van A Bellingan 20 000 20 000 20 000 PE Burton 135 000 135 000 0,1 130 000 0,1 J de V du Toit 3 686 000 3 686 000 2,2 3 506 000 2,0 MM du Toit 4 729 358 4 729 358 2,8 WL Greeff 91 815 28 185 120 000 0,1 110 000 0,1 JA Holtzhausen 10 000 10 000 MJ Jooste 20 000 000 20 000 000 11,6 20 000 000 11,6 P Malan 170 000 0,1 JF Mouton 3 600 000 42 435 489 46 035 489 26,8 45 571 996 26,4 JJ Mouton 111 000 1 312 000 1 423 000 0,8 1 410 250 0,8 PJ Mouton 14 148 3 817 000 3 831 148 2,2 3 671 660 2,1 CA Otto 108 3 974 692 3 974 800 2,3 3 817 600 2,2 W Theron 5 000 150 000 155 000 0,1 145 000 0,1 J van Zyl Smit 528 117 0,3 CH Wiese 15 500 000 15 500 000 9,0 15 500 000 9,0
3 832 071 25 386 543 – 70 401 181 99 619 795 58,0 94 580 623 54,8
Subsequent to year-end, Messrs JF Mouton and CA Otto obtained a further 300 000 and 150 000 PSG Group ordinary shares respectively having taken delivery of same in terms of the PSG Group Share Incentive Trust. There were no other changes to the directors’ shareholding between 28 February 2010 and the date of this report.
DIRECTORS’ EMOLUMENTSThe following directors’ emoluments have been incurred by the company and its subsidiaries for the year ended 28 February 2010:
CASH-BASED REMUNERATION Basic Company Performance- Total Total
Fees salaries contributions related 2010 2009R000 R000 R000 R000 R000 R000
ExecutiveJF Mouton 1 862 138 2 000 1 746 WL Greeff 1 366 106 383 1 855 1 168 PJ Mouton 1 119 91 360 1 570 1
CA Otto 1 4282
Non-executiveL van A Bellinghan 138 138 144 PE Burton 143 143 144 ZL Combi 85 85 39 J de V du Toit 1 2003 1 200 1 285 MM du Toit 4 42 42 JA Holtzhausen 5, 6 1 086 89 545 1 720 MJ Jooste 90 90 101 P Malan 3 5367
JJ Mouton 6, 8 85 739 19 1 898 2 741 1 201CA Otto 2 1 6509 1 650 W Theron 6 85 2 565 1 770 4 420 4 985 J van Zyl Smit 27410
CH Wiese 90 90 101 3 608 8 737 443 4 956 17 744 16 152
29
PSG GROUP LIMITED ANNUAL REPORT 2010
Directors’ reportcontinued
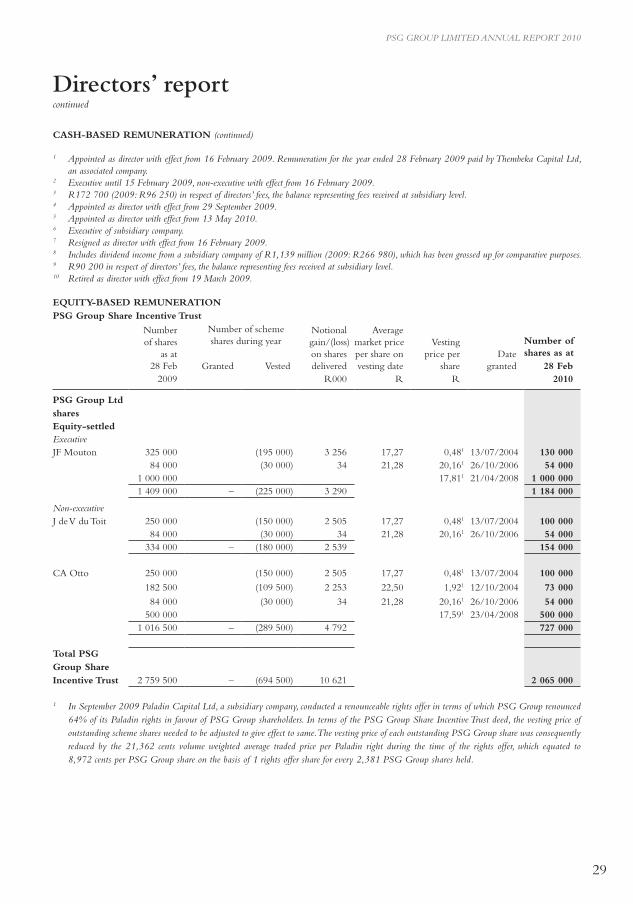
CASH-BASED REMUNERATION (continued) 1 Appointed as director with effect from 16 February 2009. Remuneration for the year ended 28 February 2009 paid by Thembeka Capital Ltd,
an associated company.2 Executive until 15 February 2009, non-executive with effect from 16 February 2009.3 R172 700 (2009: R96 250) in respect of directors’ fees, the balance representing fees received at subsidiary level.4 Appointed as director with effect from 29 September 2009.5 Appointed as director with effect from 13 May 2010.6 Executive of subsidiary company.7 Resigned as director with effect from 16 February 2009.8 Includes dividend income from a subsidiary company of R1,139 million (2009: R266 980), which has been grossed up for comparative purposes.9 R90 200 in respect of directors’ fees, the balance representing fees received at subsidiary level.10 Retired as director with effect from 19 March 2009.
EQUITY-BASED REMUNERATION PSG Group Share Incentive Trust
Numberof shares
as at28 Feb
Number of scheme shares during year
Notionalgain/(loss)on sharesdelivered
Averagemarket priceper share onvesting date
Vesting price per
shareDate
granted
Number ofshares as at
28 FebGranted Vested2009 R000 R R 2010
PSG Group Ltd sharesEquity-settledExecutiveJF Mouton 325 000 (195 000) 3 256 17,27 0,481 13/07/2004 130 000
84 000 (30 000) 34 21,28 20,161 26/10/2006 54 000 1 000 000 17,811 21/04/2008 1 000 000 1 409 000 – (225 000) 3 290 1 184 000
Non-executiveJ de V du Toit 250 000 (150 000) 2 505 17,27 0,481 13/07/2004 100 000
84 000 (30 000) 34 21,28 20,161 26/10/2006 54 000 334 000 – (180 000) 2 539 154 000
CA Otto 250 000 (150 000) 2 505 17,27 0,481 13/07/2004 100 000
182 500 (109 500) 2 253 22,50 1,921 12/10/2004 73 000
84 000 (30 000) 34 21,28 20,161 26/10/2006 54 000 500 000 17,591 23/04/2008 500 000
1 016 500 – (289 500) 4 792 727 000
Total PSG Group Share Incentive Trust
2 759 500 – (694 500) 10 621 2 065 000
1 In September 2009 Paladin Capital Ltd, a subsidiary company, conducted a renounceable rights offer in terms of which PSG Group renounced 64% of its Paladin rights in favour of PSG Group shareholders. In terms of the PSG Group Share Incentive Trust deed, the vesting price of outstanding scheme shares needed to be adjusted to give effect to same. The vesting price of each outstanding PSG Group share was consequently reduced by the 21,362 cents volume weighted average traded price per Paladin right during the time of the rights offer, which equated to 8,972 cents per PSG Group share on the basis of 1 rights offer share for every 2,381 PSG Group shares held.
30
PSG GROUP LIMITED ANNUAL REPORT 2010
Directors’ reportcontinued
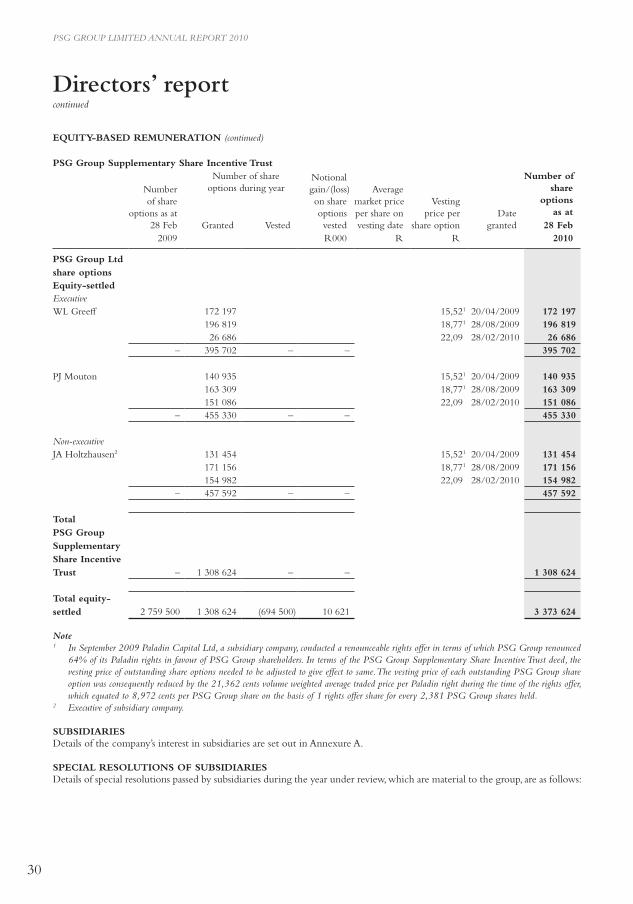
EQUITY-BASED REMUNERATION (continued)
PSG Group Supplementary Share Incentive Trust
Numberof share
options as at28 Feb
Number of share options during year
Notionalgain/(loss)on share options
vested
Averagemarket priceper share onvesting date
Vesting price per
share optionDate
granted
Number ofshare
options as at
28 FebGranted Vested2009 R000 R R 2010
PSG Group Ltd share optionsEquity-settledExecutiveWL Greeff 172 197 15,521 20/04/2009 172 197
196 819 18,771 28/08/2009 196 819 26 686 22,09 28/02/2010 26 686
– 395 702 – – 395 702
PJ Mouton 140 935 15,521 20/04/2009 140 935 163 309 18,771 28/08/2009 163 309 151 086 22,09 28/02/2010 151 086
– 455 330 – – 455 330
Non-executiveJA Holtzhausen2 131 454 15,521 20/04/2009 131 454
171 156 18,771 28/08/2009 171 156 154 982 22,09 28/02/2010 154 982
– 457 592 – – 457 592
Total PSG Group Supplementary Share Incentive Trust – 1 308 624 – – 1 308 624
Total equity-settled 2 759 500 1 308 624 (694 500) 10 621 3 373 624
Note1 In September 2009 Paladin Capital Ltd, a subsidiary company, conducted a renounceable rights offer in terms of which PSG Group renounced
64% of its Paladin rights in favour of PSG Group shareholders. In terms of the PSG Group Supplementary Share Incentive Trust deed, the vesting price of outstanding share options needed to be adjusted to give effect to same. The vesting price of each outstanding PSG Group share option was consequently reduced by the 21,362 cents volume weighted average traded price per Paladin right during the time of the rights offer, which equated to 8,972 cents per PSG Group share on the basis of 1 rights offer share for every 2,381 PSG Group shares held.
2 Executive of subsidiary company.
SUBSIDIARIESDetails of the company’s interest in subsidiaries are set out in Annexure A.
SPECIAL RESOLUTIONS OF SUBSIDIARIESDetails of special resolutions passed by subsidiaries during the year under review, which are material to the group, are as follows:
31
PSG GROUP LIMITED ANNUAL REPORT 2010
PSG Financial Services LtdThe company be authorised to repurchase its own issued shares, upon such terms and conditions as the directors of the company may determine, but subject to the provisions of section 85 to 88 of the Companies Act, the Articles of Association of the company, the Listings Requirements of the JSE Ltd and the requirements of any other stock exchange on which the shares of the company may be quoted or listed.
The company approved the acquisition by itself and/or any subsidiary of the company of shares issued by such subsidiary and/or by the company and/or by its holding company upon such terms and conditions that the directors of PSG Group Ltd may determine, but subject to the provisions of section 85 to 89 of the Companies Act, the Articles of Association of the company, the Listings Requirements of the JSE Ltd (if listed) and the requirements of any other stock exchange on which the shares of the acquiree company may be quoted or listed.
Paladin Capital LtdThe company changed its name to 35 Kerk Street Investments Ltd.
The company be authorised to repurchase all of the shares issued by the company to the shareholders of Mainfin (Pty) Ltd, the participants of the Paladin Capital Ltd Share Incentive Scheme and all shareholders of the company other than PSG Financial Services Ltd, subject to the provisions of section 85 to section 88 of the Companies Act and the Articles of Association of the company.
The company be authorised to repurchase any of the shares issued by the company, upon such terms and conditions and in such amounts as the directors of the company may determine from time to time, but subject to the provisions of section 85 to 88 of the Companies Act, the Articles of Association of the company and the Listings Requirements of the JSE Ltd.
The company approved, as a general approval, and authorised the acquisition by any subsidiary of the company of shares issued by such subsidiary and/or by the company, upon such terms and conditions and in such amount as the directors of such subsidiary(ies) may determine, but subject to the provisions of section 85 to 89 of the Companies Act, the Articles of Association of the company and the Listings Requirements of the JSE Ltd (if applicable).
Zeder Investments LtdThe company be authorised to repurchase its own issued shares, upon such terms and conditions as the directors of the company may determine, but subject to the provisions of section 85 to 88 of the Companies Act, the Articles of Association of the company, the Listings Requirements of the JSE Ltd and the requirements of any other stock exchange on which the shares of the company may be quoted or listed.
The company approved, as a general approval, and authorised the acquisition by any subsidiary of the company of shares issued by such subsidiary and/or by the company, upon such terms and conditions and in such amount as the directors of such subsidiary(ies) may determine, but subject to the provisions of section 85 to 89 of the Companies Act, the Articles of Association of the company, the Listings Requirements of the JSE Ltd (if listed) and the requirements of any other stock exchange on which the shares of the acquiree company may be quoted or listed.
PSG Konsult LtdThe company be authorised until the next annual general meeting to repurchase any of the shares issued by the company upon such terms and conditions as the directors may determine, but subject to the provisions of section 85 to 88 of the Companies Act.
PSG Fund Management Group (Pty) LtdThe company authorised the subdivision of its existing authorised shares from 1 000 000 ordinary par value shares of R0,01 each to 1 000 000 000 ordinary par value shares of R0,00001 each.
Subject to the passing of the special resolution above, the company authorised the subdivision of its existing issued shares, being 16 262 ordinary par value shares of R0,01 each, into 16 362 000 ordinary par value shares of R0,00001 each.
SECRETARYThe secretary of the company is PSG Corporate Services (Pty) Ltd. The business and postal addresses are shown on page 132.
Directors’ reportcontinued
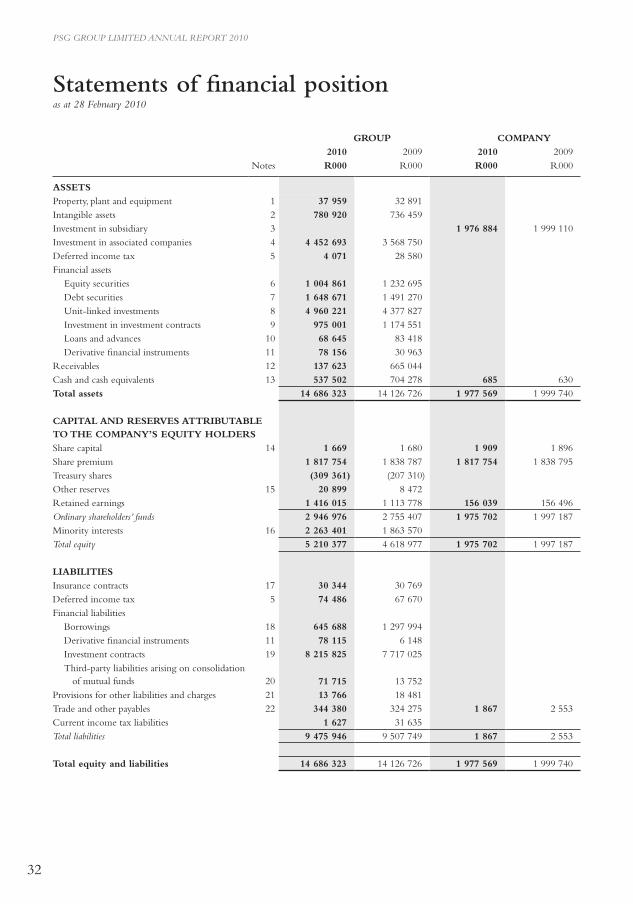
32
PSG GROUP LIMITED ANNUAL REPORT 2010
Statements of financial positionas at 28 February 2010
GROUP COMPANY2010 2009 2010 2009
Notes R000 R000 R000 R000
ASSETSProperty, plant and equipment 1 37 959 32 891 Intangible assets 2 780 920 736 459 Investment in subsidiary 3 1 976 884 1 999 110 Investment in associated companies 4 4 452 693 3 568 750 Deferred income tax 5 4 071 28 580 Financial assets
Equity securities 6 1 004 861 1 232 695 Debt securities 7 1 648 671 1 491 270 Unit-linked investments 8 4 960 221 4 377 827 Investment in investment contracts 9 975 001 1 174 551 Loans and advances 10 68 645 83 418 Derivative financial instruments 11 78 156 30 963
Receivables 12 137 623 665 044 Cash and cash equivalents 13 537 502 704 278 685 630 Total assets 14 686 323 14 126 726 1 977 569 1 999 740
CAPITAL AND RESERVES ATTRIBUTABLE TO THE COMPANY’S EQUITY HOLDERSShare capital 14 1 669 1 680 1 909 1 896 Share premium 1 817 754 1 838 787 1 817 754 1 838 795 Treasury shares (309 361) (207 310)Other reserves 15 20 899 8 472 Retained earnings 1 416 015 1 113 778 156 039 156 496 Ordinary shareholders’ funds 2 946 976 2 755 407 1 975 702 1 997 187 Minority interests 16 2 263 401 1 863 570 Total equity 5 210 377 4 618 977 1 975 702 1 997 187
LIABILITIESInsurance contracts 17 30 344 30 769 Deferred income tax 5 74 486 67 670 Financial liabilities
Borrowings 18 645 688 1 297 994 Derivative financial instruments 11 78 115 6 148 Investment contracts 19 8 215 825 7 717 025 Third-party liabilities arising on consolidation of mutual funds 20 71 715 13 752
Provisions for other liabilities and charges 21 13 766 18 481 Trade and other payables 22 344 380 324 275 1 867 2 553 Current income tax liabilities 1 627 31 635 Total liabilities 9 475 946 9 507 749 1 867 2 553
Total equity and liabilities 14 686 323 14 126 726 1 977 569 1 999 740
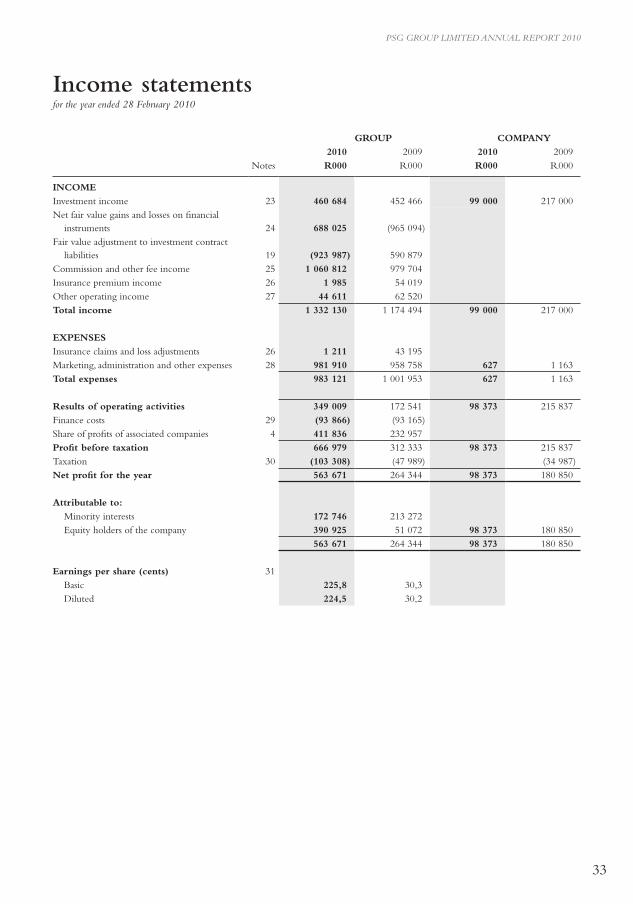
33
PSG GROUP LIMITED ANNUAL REPORT 2010
Income statementsfor the year ended 28 February 2010
GROUP COMPANY2010 2009 2010 2009
Notes R000 R000 R000 R000
INCOMEInvestment income 23 460 684 452 466 99 000 217 000 Net fair value gains and losses on financial
instruments 24 688 025 (965 094) Fair value adjustment to investment contract
liabilities 19 (923 987) 590 879 Commission and other fee income 25 1 060 812 979 704 Insurance premium income 26 1 985 54 019 Other operating income 27 44 611 62 520 Total income 1 332 130 1 174 494 99 000 217 000
ExPENSESInsurance claims and loss adjustments 26 1 211 43 195 Marketing, administration and other expenses 28 981 910 958 758 627 1 163 Total expenses 983 121 1 001 953 627 1 163
Results of operating activities 349 009 172 541 98 373 215 837 Finance costs 29 (93 866) (93 165) Share of profits of associated companies 4 411 836 232 957 Profit before taxation 666 979 312 333 98 373 215 837 Taxation 30 (103 308) (47 989) (34 987) Net profit for the year 563 671 264 344 98 373 180 850
Attributable to:Minority interests 172 746 213 272 Equity holders of the company 390 925 51 072 98 373 180 850
563 671 264 344 98 373 180 850
Earnings per share (cents) 31Basic 225,8 30,3 Diluted 224,5 30,2
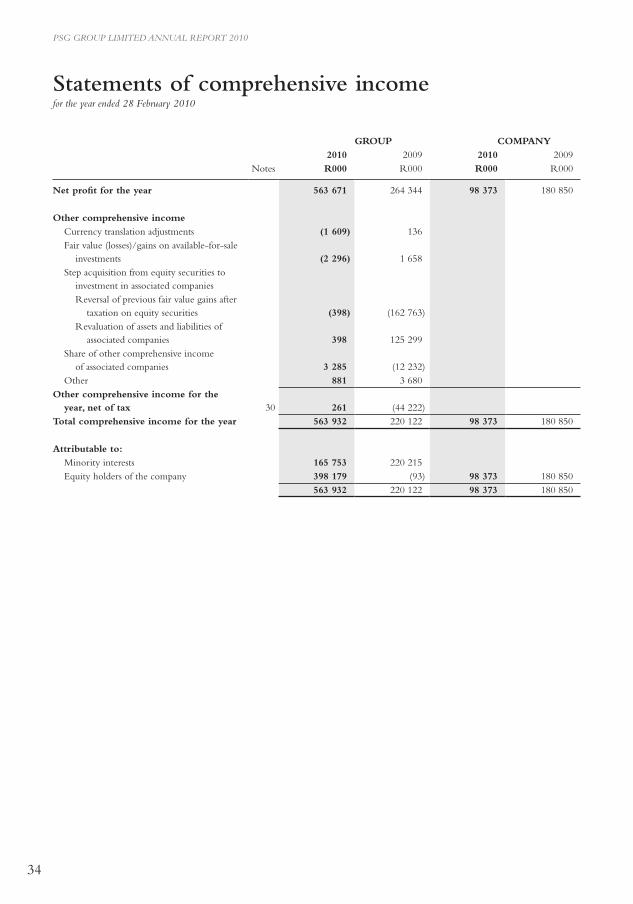
34
PSG GROUP LIMITED ANNUAL REPORT 2010
Statements of comprehensive incomefor the year ended 28 February 2010
GROUP COMPANY2010 2009 2010 2009
Notes R000 R000 R000 R000
Net profit for the year 563 671 264 344 98 373 180 850
Other comprehensive incomeCurrency translation adjustments (1 609) 136 Fair value (losses)/gains on available-for-sale
investments (2 296) 1 658 Step acquisition from equity securities to
investment in associated companiesReversal of previous fair value gains after
taxation on equity securities (398) (162 763)Revaluation of assets and liabilities of
associated companies
398 125 299 Share of other comprehensive income
of associated companies 3 285 (12 232)Other 881 3 680
Other comprehensive income for the year, net of tax 30 261 (44 222)
Total comprehensive income for the year 563 932 220 122 98 373 180 850
Attributable to:Minority interests 165 753 220 215 Equity holders of the company 398 179 (93) 98 373 180 850
563 932 220 122 98 373 180 850
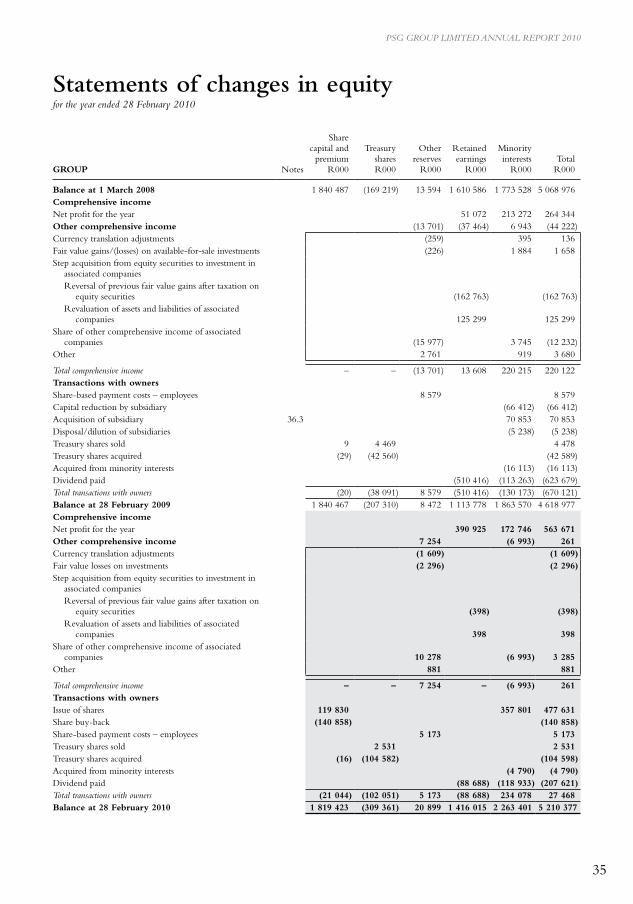
35
PSG GROUP LIMITED ANNUAL REPORT 2010
Statements of changes in equityfor the year ended 28 February 2010
GROUP Notes
Share capital and
premiumR000
TreasurysharesR000
Otherreserves
R000
Retainedearnings
R000
Minorityinterests
R000Total
R000
Balance at 1 March 2008 1 840 487 (169 219) 13 594 1 610 586 1 773 528 5 068 976 Comprehensive incomeNet profit for the year 51 072 213 272 264 344 Other comprehensive income (13 701) (37 464) 6 943 (44 222)Currency translation adjustments (259) 395 136 Fair value gains/(losses) on available-for-sale investments (226) 1 884 1 658 Step acquisition from equity securities to investment in
associated companiesReversal of previous fair value gains after taxation on
equity securities (162 763) (162 763)Revaluation of assets and liabilities of associated
companies 125 299 125 299Share of other comprehensive income of associated
companies (15 977) 3 745 (12 232)Other 2 761 919 3 680
Total comprehensive income – – (13 701) 13 608 220 215 220 122 Transactions with ownersShare-based payment costs – employees 8 579 8 579 Capital reduction by subsidiary (66 412) (66 412) Acquisition of subsidiary 36.3 70 853 70 853 Disposal/dilution of subsidiaries (5 238) (5 238) Treasury shares sold 9 4 469 4 478 Treasury shares acquired (29) (42 560) (42 589) Acquired from minority interests (16 113) (16 113) Dividend paid (510 416) (113 263) (623 679) Total transactions with owners (20) (38 091) 8 579 (510 416) (130 173) (670 121) Balance at 28 February 2009 1 840 467 (207 310) 8 472 1 113 778 1 863 570 4 618 977 Comprehensive incomeNet profit for the year 390 925 172 746 563 671 Other comprehensive income 7 254 (6 993) 261Currency translation adjustments (1 609) (1 609) Fair value losses on investments (2 296) (2 296) Step acquisition from equity securities to investment in
associated companiesReversal of previous fair value gains after taxation on
equity securities (398) (398)Revaluation of assets and liabilities of associated
companies 398 398Share of other comprehensive income of associated
companies 10 278 (6 993) 3 285Other 881 881
Total comprehensive income – – 7 254 – (6 993) 261 Transactions with ownersIssue of shares 119 830 357 801 477 631 Share buy-back (140 858) (140 858) Share-based payment costs – employees 5 173 5 173 Treasury shares sold 2 531 2 531 Treasury shares acquired (16) (104 582) (104 598) Acquired from minority interests (4 790) (4 790) Dividend paid (88 688) (118 933) (207 621) Total transactions with owners (21 044) (102 051) 5 173 (88 688) 234 078 27 468 Balance at 28 February 2010 1 819 423 (309 361) 20 899 1 416 015 2 263 401 5 210 377
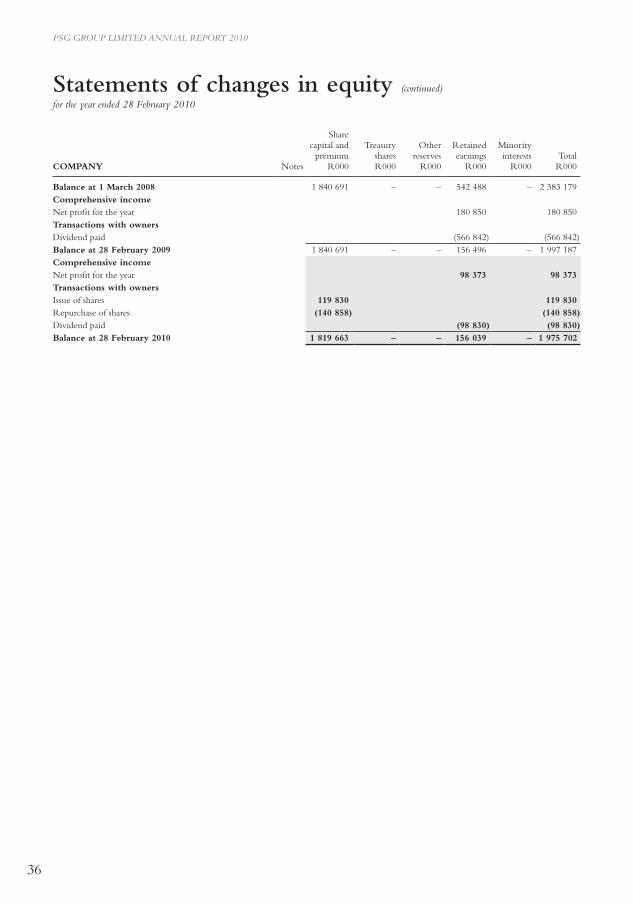
36
PSG GROUP LIMITED ANNUAL REPORT 2010
COMPANY Notes
Share capital and
premiumR000
TreasurysharesR000
Otherreserves
R000
Retained earnings
R000
Minority interests
R000Total
R000
Balance at 1 March 2008 1 840 691 – – 542 488 – 2 383 179 Comprehensive incomeNet profit for the year 180 850 180 850 Transactions with ownersDividend paid (566 842) (566 842) Balance at 28 February 2009 1 840 691 – – 156 496 – 1 997 187 Comprehensive incomeNet profit for the year 98 373 98 373 Transactions with ownersIssue of shares 119 830 119 830 Repurchase of shares (140 858) (140 858) Dividend paid (98 830) (98 830) Balance at 28 February 2010 1 819 663 – – 156 039 – 1 975 702
Statements of changes in equity (continued)
for the year ended 28 February 2010
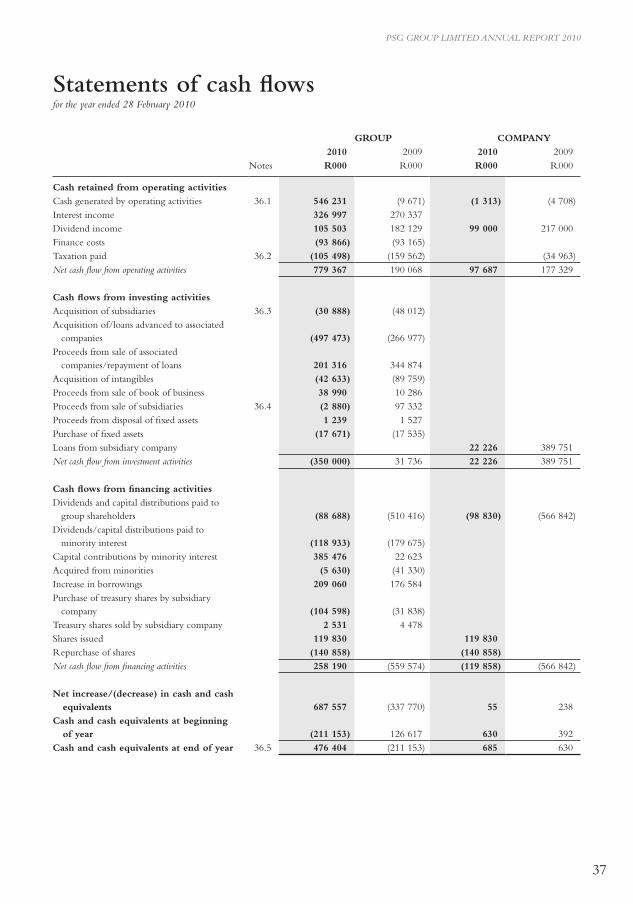
37
PSG GROUP LIMITED ANNUAL REPORT 2010
Statements of cash flowsfor the year ended 28 February 2010
GROUP COMPANY 2010 2009 2010 2009
Notes R000 R000 R000 R000
Cash retained from operating activitiesCash generated by operating activities 36.1 546 231 (9 671) (1 313) (4 708)Interest income 326 997 270 337 Dividend income 105 503 182 129 99 000 217 000 Finance costs (93 866) (93 165)Taxation paid 36.2 (105 498) (159 562) (34 963)Net cash flow from operating activities 779 367 190 068 97 687 177 329
Cash flows from investing activitiesAcquisition of subsidiaries 36.3 (30 888) (48 012) Acquisition of/loans advanced to associated companies (497 473)
(266 977)
Proceeds from sale of associated companies/repayment of loans 201 316 344 874 Acquisition of intangibles (42 633) (89 759) Proceeds from sale of book of business 38 990 10 286 Proceeds from sale of subsidiaries 36.4 (2 880) 97 332 Proceeds from disposal of fixed assets 1 239 1 527 Purchase of fixed assets (17 671) (17 535) Loans from subsidiary company 22 226 389 751 Net cash flow from investment activities (350 000) 31 736 22 226 389 751
Cash flows from financing activitiesDividends and capital distributions paid to group shareholders (88 688) (510 416) (98 830) (566 842)Dividends/capital distributions paid to minority interest (118 933) (179 675)Capital contributions by minority interest 385 476 22 623 Acquired from minorities (5 630) (41 330)Increase in borrowings 209 060 176 584 Purchase of treasury shares by subsidiary company (104 598) (31 838) Treasury shares sold by subsidiary company 2 531 4 478 Shares issued 119 830 119 830 Repurchase of shares (140 858) (140 858)Net cash flow from financing activities 258 190 (559 574) (119 858) (566 842)
Net increase/(decrease) in cash and cash equivalents 687 557 (337 770) 55 238 Cash and cash equivalents at beginning of year (211 153) 126 617 630 392 Cash and cash equivalents at end of year 36.5 476 404 (211 153) 685 630
38
PSG GROUP LIMITED ANNUAL REPORT 2010
Accounting policies
The principal accounting policies applied in the preparation of these consolidated financial statements are set out below. These policies have been consistently applied to all the years presented.
BASIS OF PREPARATION
The consolidated and company financial statements of PSG Group Ltd have been prepared in accordance with International Financial Reporting Standards (IFRS) and the manner required by the Companies Act of South Africa. The financial statements have been prepared under the historical cost convention, as modified by the revaluation of available-for-sale financial assets, and financial assets and financial liabilities (including derivative instruments) at fair value through profit or loss.
The preparation of financial statements in conformity with IFRS requires the use of certain critical accounting estimates. It also requires management to exercise its judgement in the process of applying the company’s accounting policies. The areas involving a higher degree of judgement or complexity, or areas where assumptions and estimates are significant to the consolidated financial statements, are disclosed further on in the accounting policies.
STANDARDS, INTERPRETATIONS AND AMENDMENTS TO PUBLISHED STANDARDS THAT ARE
EFFECTIVE FOR THE FIRST TIME IN 2010
New and amended standards adopted by the group
• IFRS 8 – Operating Segments (effective January 2009) IFRS 8 requires an entity to adopt the ‘management approach’ to reporting on the financial performance of its operating segments.
The standard sets out requirements for disclosure of information about an entity’s operating segments and also about the entity’s products and services, the geographical areas in which it operates, and its major customers. The disclosure should enable users of its financial statements to evaluate the nature and financial effects of the business activities in which it engages and the economic environments in which it operates. The group expanded its disclosure on the reportable segments from three to six segments as disclosed in Annexure B. Comparative information has been re-presented.
• IAS 1 Revised – Presentation of Financial Statements (effective January 2009) The revised standard prohibits the presentation of items of income and expenses (that is, ‘non-owner changes in equity’) in the
statement of changes in equity, requiring ‘non-owner changes in equity’ to be presented separately from owner changes in equity in a statement of comprehensive income. As a result the group presents in the statement of changes in equity all owner changes in equity, whereas all non-owner changes in equity are presented in the statement of comprehensive income. Comparative information has been re-presented so that it also is in conformity with the revised standard. The change in accounting policy only impacts on presentation aspects.
• IAS 23 Revised – Borrowing Costs (effective January 2009) In respect of borrowing costs relating to qualifying assets for which the commencement date for capitalisation is on or after
1 March 2009, the group capitalises borrowing costs directly attributable to the acquisition, construction or production of a qualifying asset as part of the cost of that asset. In accordance with the transition provisions of the standard; comparative figures have not been restated. The change in accounting policy had no material impact on the group’s financial statements.
• Amendment to IAS 27 – Consolidated and Separate Financial Statements: Cost of an Investment in a Subsidiary, Joint Controlled Entity or Associate (effective January 2009)
The amendment removed the definition of the cost method from IAS 27 and replaced it with a requirement to present dividends as income in the separate financial statements of the investor. The group adopted the amendment prospectively from 1 March 2009. The change in accounting policy had no material impact on the group’s financial statements.
• Amendment to IFRS 2 – Share-based Payment Vesting Conditions and Cancellations (effective January 2009) The amendment deals with vesting conditions and cancellations. It clarifies that vesting conditions are service conditions and
performance conditions only. Other features of a share-based payment are not vesting conditions. These features would need to be included in the grant date fair value for transactions with employees and others providing similar services; they would not impact the number of awards expected to vest or valuation thereof subsequent to grant date. All cancellations, whether by the entity or by other parties, should receive the same accounting treatment. The group and company have adopted IFRS 2 (amendment) from 1 March 2009. The amendment does not have a material impact on the group or company’s financial statements.

39
PSG GROUP LIMITED ANNUAL REPORT 2010
• Amendments to IFRS 7 Financial Instruments: Disclosures – Improving Disclosures about Financial Instruments (effective January 2009)
The amendment requires enhanced disclosures about fair value measurement and liquidity risk. In particular, the amendment requires disclosure of fair value measurements by level of a fair value measurement hierarchy. The change in accounting policy only results in additional disclosures.
New and amended standards not currently relevant to the group’s operations
• Amendment to IAS 32 Financial Instruments – Presentation and IAS 1 Presentation of Financial Statements – Puttable Financial Instruments and Obligations Arising on Liquidation (effective January 2009)
• IFRIC 13 Customer Loyalty Programmes (effective July 2008)• IFRIC 15 Agreements for the Construction of Real Estate (effective January 2009)• IFRIC 16 Hedges of a Net Investment in a Foreign Operation (effective October 2008)• AC 503 Revised – Accounting for Black Economic Empowerment Transactions (effective January 2009)
The implications of these statements have no impact on measurements of assets and liabilities or disclosures in the current or prior years.
STANDARDS, INTERPRETATIONS AND AMENDMENTS TO PUBLISHED STANDARDS THAT ARE NOT
YET EFFECTIVE
Certain new standards, amendments and interpretations to existing standards have been published that are mandatory for the group’s accounting periods beginning on or after 1 March 2010 or later periods, but which the group has not early adopted are as follows:
• IFRS 3 Revised – Business Combinations (effective July 2009) The revised standard continues to apply the acquisition method to business combinations, with some significant changes. For
example, all payments to purchase a business are to be recorded at fair value at the acquisition date, with contingent payments classified as debt subsequently re-measured through the income statement. There is a choice on an acquisition-by-acquisition basis to measure the non-controlling interest in the acquiree at fair value or at the non-controlling interest’s proportionate share of the acquiree’s net assets. All acquisition-related costs should be expensed. The group will apply IFRS 3 (revised) prospectively to all business combinations from 1 March 2010.
• IAS 27 Revised – Consolidated and Separate Financial Statements (effective July 2009) The revised standard requires the effects of all transactions with non-controlling interests to be recorded in equity if there is no
change in control and these transactions will no longer result in goodwill or gains and losses. The standard also specifies the accounting when control is lost. Any remaining interest in the entity is remeasured to fair value, and a gain or loss is recognised in profit or loss. The group will apply IAS 27 (revised) prospectively to transactions with non-controlling interests from 1 March 2010. This will result in a change in accounting policy, since the group currently treats minorities as parties external to the group and subsequent to the revision will treat minorities as equity holders.
• IFRIC 17 Distribution of Non-cash Assets to Owners (effective July 2009) This interpretation provides guidance on accounting for arrangements whereby an entity distributes non-cash assets to shareholders
either as a distribution of reserves or as dividends. IFRS 5 has also been amended to require that assets are classified as held for distribution only when they are available for distribution in their present condition and the distribution is highly probable. The group and company will apply IFRIC 17 from 1 March 2010.
• Amendments to IFRS 2 – Group Cash-settled Share-based Payment Transactions (effective January 2010) The amendment clarifies the accounting for group cash-settled share-based payment transactions. The entity receiving the goods or
services shall measure the share-based payment transaction as equity-settled only when the awards granted are its own equity instruments, or the entity has no obligation to settle the share-based payment transaction. The entity settling a share-based payment transaction when another entity in the group receives the goods or services recognises the transaction as equity-settled only if it is settled in its own equity instruments. In all other cases, the transaction is accounted for as cash-settled. The group will apply the amendments to IFRS 2 prospectively from 1 March 2010.
• IFRS 9 – Financial Instruments (effective January 2013) The new standard improves and simplifies the approach for classification and measurement of financial assets compared with the
requirements of IAS 39. IFRS 9 applies a consistent approach to classifying financial assets and replaces the numerous categories of
Accounting policiescontinued
40
PSG GROUP LIMITED ANNUAL REPORT 2010
Accounting policiescontinued
financial assets in IAS 39, each of which had its own classification criteria. IFRS 9 also results in one impairment method, replacing the numerous impairment methods in IAS 39 that arise from the different classification categories.
Management is in the process of assessing the impact of these amendments and standards on the reported results of the group and the company.
Standards, amendments and interpretations to existing standards that are not yet effective or not relevant to the group’s operations, are as follows:
• IFRIC 18 Transfers of Assets from Customers (effective July 2009)• IFRIC 19 Extinguishing Financial Liabilities with Equity Instruments (effective July 2010)• Amendment to IFRIC 9 – Reassessment of Embedded Derivatives and IAS 39 – Financial Instruments: Recognition and
Measurement (effective July 2009)• AC 504 – IAS 19 (AC 116) – The Limit on a Defined Benefit Asset, Minimum Funding Requirements and their Interaction in the
South African Pension Fund Environment (effective April 2009)• Amendments to IAS 32 Classification of Rights Issues (effective February 2010)• Amendments to IAS 39 Financial Instruments: Recognition and Measurement Eligible Hedged Items (effective July 2009)• Amendments to IAS 24 Related Party Disclosures (effective January 2011)
GROUP FINANCIAL STATEMENTS
The group annual financial statements comprise those of the company, its subsidiaries, associated companies and the share incentive trusts (“share trusts”).
Subsidiaries
Subsidiaries are all entities (including special-purpose entities and collective investment schemes) over which the group has the power to govern the financial and operating policies generally accompanying a shareholding of more than one half of the voting rights. The existence and effect of potential voting rights that are currently exercisable or convertible are considered when assessing whether the group controls another entity. Subsidiaries are fully consolidated from the date on which control is transferred to the group and are no longer consolidated from the date on which control ceases.
The group uses the purchase method of accounting to account for the acquisition of subsidiaries. The cost of an acquisition is measured, as the fair value of the assets given, equity instruments issued and liabilities incurred or assumed at the date of exchange, plus costs directly attributable to the acquisition. Identifiable assets acquired and liabilities and contingent liabilities assumed in a business combination are measured initially at their fair values at the acquisition date, irrespective of the extent of any minority interest. The excess of the cost of acquisition over the fair value of the group’s share of the identifiable net assets acquired is recorded as goodwill (see note 2). If the cost of acquisition is less than the fair value of the net assets of the subsidiary acquired, the difference is recognised directly in the income statement.
If the initial accounting for business combinations has been determined provisionally, then adjustments to these values resulting from the emergence of new information within 12 months after the acquisition date are made against goodwill. In addition, the cost of the business combination and, subsequently, goodwill is adjusted for changes in the estimated value of contingent considerations in respect of the business combination when they arise.
Intra-group transactions, balances and unrealised gains on intra-group transactions are eliminated. Unrealised losses are also eliminated but considered an impairment indicator of the asset transferred.
Shares in the company held by the share trusts have been consolidated into the financial results of the group, as the group has effective control over these shares.
41
PSG GROUP LIMITED ANNUAL REPORT 2010
Accounting policiescontinued
Investment in subsidiaries in the company financials are carried at cost less provision for impairment.
Mutual funds
Mutual funds, in which the group has greater than 50% economic interest resulting in effective control, are consolidated. The consolidation principles applied are consistent with those applied to consolidated subsidiary companies.
Transactions with minorities
The group applies a policy of treating transactions with minority interests as transactions with parties external to the group. Disposals to minority interests result in gains and losses for the group that are recorded in the income statement. Purchases from, minority interests result in goodwill, being the difference between any consideration paid and the relevant share acquired of the carrying value of net assets of the subsidiary.
Associated companies
Associated companies are all entities over which the group has significant influence but not control, generally accompanying a shareholding of between 20% and 50% of the voting rights. Investments in associated companies are accounted for by the equity method of accounting and are initially recognised at cost. The group’s investment in associated companies includes goodwill (net of any accumulated impairment loss) identified on acquisition (see note 4).
The results of associated companies are accounted for according to the equity method, based on their most recent audited financial statements or latest management information. Equity accounting involves recognising the group’s share of its associated companies’ post-acquisition profits or losses in the income statement, and its share of post-acquisition movements in other comprehensive income, in the statement of comprehensive income. The cumulative post-acquisition movements are adjusted against the carrying amount of the investment. When the group’s share of losses in an associated company equals or exceeds its interest in the associated company, including any other unsecured receivables, the group does not recognise further losses, unless it has incurred obligations or made payments on behalf of the associated company.
Unrealised gains on transactions between the group and its associated companies are eliminated to the extent of the group’s interest in the associated companies. Unrealised losses are also eliminated unless the transaction provides evidence of an impairment of the asset transferred. Cross-holdings between the group and its associates are eliminated in accordance with normal consolidation procedure. Associates’ accounting policies have been changed where necessary to ensure consistency with the policies adopted by the group.
Dilution gains and losses arising in investment in associated companies are recognised in the income statement.
For step acquisitions of investment in associated companies the carrying value of pre-associate investments are restated to cost through other comprehensive income. The pre-associate interest in identifiable net assets is also stepped up to fair value through other comprehensive income. Goodwill is calculated at each stage of step acquisition. The step acquisition investment in associated companies is initially carried at fair value of the group’s share of net assets plus goodwill arising from each stage of step acquisition.
Certain associated companies have year-ends that differ from that of the group. In such circumstances, the results of certain unlisted companies are accounted for from the latest published information and management accounts as at year-end, respectively.
Loans and preference shares to associated companies are disclosed as part of the carrying amount of the investment.
SEGMENT REPORTING
Operating segments are reported in a manner consistent with the internal reporting provided to the chief operating decision-maker. The chief operating decision-maker, who is responsible for allocating resources and assessing performance of the operating segments, has been identified as the executive committee that makes strategic decisions.
42
PSG GROUP LIMITED ANNUAL REPORT 2010
Accounting policiescontinued
FOREIGN CURRENCY TRANSLATION
Functional and presentation currency
Items included in the financial statements of each of the company entities are measured using the currency of the primary economic environment in which the entity operates (the “functional currency”).
The consolidated financial statements are presented in South African rand, which is the company’s functional and presentation currency.
Transactions and balances
Foreign currency transactions are translated into the functional currency using the exchange rates prevailing at the dates of the transactions. Foreign exchange gains and losses resulting from the settlement of such transactions and from the translation at year-end exchange rates of monetary assets and liabilities denominated in foreign currencies are recognised in the income statement.
Translation differences on non-monetary financial assets and liabilities are reported as part of the fair value gain or loss. Translation differences on non-monetary financial assets and liabilities such as equities held at fair value through profit or loss are recognised in profit or loss as part of the fair value gain or loss. Translation differences on non-monetary financial assets such as equities classified as available- for-sale are recognised in the statement of comprehensive income and included in the fair value reserve in equity.
Group companies
The results and financial position of all the group entities (none of which has the currency of a hyperinflationary economy) that have a functional currency different from the presentation currency are translated into the presentation currency as follows:
• Assets and liabilities are translated at the closing rate at the date of the statement of financial position.• Income and expenses are translated at average exchange rates (unless this average is not a reasonable approximation of the
cumulative effect of the rates prevailing on the transaction dates, in which case income and expenses are translated at the dates of the transactions).
• All resulting exchange differences are recognised in the statement of comprehensive income and as a separate component of equity.
Goodwill and fair value adjustments arising on the acquisition of a foreign entity are treated as the foreign entity’s assets and liabilities and are translated at the closing rate.
PROPERTY, PLANT AND EQUIPMENT
Property, plant and equipment are stated at historical cost less accumulated depreciation and impairment. Cost includes expenditure that is directly attributable to the acquisition of the items.
Subsequent costs are included in the asset’s carrying amount or recognised as a separate asset, as appropriate, only when it is probable that future economic benefits associated with the item will flow to the group and the cost of the item can be measured reliably. All other repairs and maintenance are charged to the income statement during the financial period in which they are incurred.
Depreciation is calculated on the straight-line method at rates considered appropriate to reduce book values to estimated residual values over the useful lives of the assets, as follows:Buildings 25 yearsMotor vehicles 5 yearsPlant 15 yearsOffice equipment 5 yearsComputer equipment 3 years
Land is not depreciated. The assets’ residual values and useful lives are reviewed, and adjusted if appropriate, at each statement of financial position date.
43
PSG GROUP LIMITED ANNUAL REPORT 2010
Accounting policiescontinued
An asset’s carrying amount is written down immediately to its recoverable amount if the asset’s carrying amount is greater than its estimated recoverable amount.
Gains and losses on disposals are determined by comparing proceeds with carrying amount. These are included in the income statement.
INTANGIBLE ASSETS
Goodwill
Goodwill represents the excess of the cost of an acquisition over the fair value of the group’s share of the net identifiable assets of the acquired subsidiary/associated company undertaking at the date of acquisition. Goodwill is reported in the statement of financial position as an intangible asset. Goodwill on acquisition of associated companies is included in investments in associated companies. Goodwill is tested annually for impairment and is carried at cost less accumulated impairment losses. Impairment losses on goodwill are not reversed. Gains and losses on the disposal of an entity include the carrying amount of goodwill relating to the entity sold.
Goodwill is allocated to cash-generating units for the purpose of impairment testing. The allocation is made to those cash-generating units or groups of cash-generating units that are expected to benefit from the business combination in which the goodwill arose. The groups of cash-generating units are not larger than operating segments.
An excess of acquirer’s interest in the net fair value of acquiree’s identifiable assets, liabilities and contingent liabilities arises where the net assets of a subsidiary at the date of acquisition, fairly valued, exceed the cost of the acquisition. This excess arising on acquisitions is taken directly to income.
Trademarks
Acquired patents and trademarks are shown at cost less accumulated amortisation and impairment. Amortisation is calculated using the straight-line method over their estimated useful lives, which varies from 5 to 20 years and is reassessed annually. The carrying amount of each cash-generating unit is reviewed for impairment when an impairment indicator is identified.
Customer lists
Acquired customer lists are shown at cost less accumulated amortisation and impairment. Amortisation is calculated using the straight-line method over their estimated useful lives ranging between 5 and 20 years, which reflect the expected life of the book of business acquired. The carrying amount is reviewed for impairment when an impairment indicator is identified.
Deferred acquisition costs
Commissions, fees and other incremental costs that vary with and are related to securing new contracts and renewing existing contracts are capitalised as deferred acquisition cost (DAC), an intangible asset. All other costs are recognised as expenses when incurred. The DAC is subsequently amortised over the expected life of the contracts.
An impairment test is conducted annually at reporting date on the DAC balance to ensure that the amount will be recovered from future revenue generated by the applicable remaining investment management contracts.
Computer software
Costs associated with developing or maintaining computer software programmes are recognised as an expense as incurred. Costs that are directly associated with identifiable and unique software products controlled by the group and that will probably generate economic benefits exceeding costs beyond one year, are recognised as intangible assets. Direct costs include staff costs of the software development team and an appropriate portion of relevant overheads.
Expenditure that enhances or extends the performance of computer software programmes beyond their original specifications is recognised as capital improvement and added to the original cost of the software. Computer software development costs recognised as assets are amortised using the straight-line method over their useful lives not exceeding a period of two years. Expenditure to acquire trademarks and licences is capitalised and amortised using the straight-line method over their useful lives not exceeding a period of two years.
44
PSG GROUP LIMITED ANNUAL REPORT 2010
Accounting policiescontinued
IMPAIRMENT OF NON-FINANCIAL ASSETS
Assets that have an indefinite useful life are not subject to amortisation and are tested annually for impairment. Assets that are subject to amortisation are tested for impairment whenever events or changes in circumstances indicate that the carrying amount may not be recoverable. An impairment loss is recognised for the amount by which the asset’s carrying amount exceeds its recoverable amount. The recoverable amount is the higher of an asset’s fair value less costs to sell and value in use. For the purposes of assessing impairment, assets are grouped at the lowest levels for which there are separately identifiable cash flows (cash-generating units). Non-financial assets other than goodwill that suffered an impairment are reviewed for possible reversal of the impairment at each reporting date.
FINANCIAL INSTRUMENTS
Financial instruments recognised on the statement of financial position include financial assets, receivables, cash and cash equivalents, financial liabilities and trade and other payables. The particular recognition methods adopted are disclosed in the individual policy statements associated with each item.
OFFSETTING FINANCIAL INSTRUMENTS
Financial assets and liabilities are offset and the net amount reported in the statement of financial position only when there is a legally enforceable right to offset the recognised amounts and there is an intention to settle on a net basis, or to realise the asset and settle the liability simultaneously.
FINANCIAL ASSETS
The group classifies its financial assets into the following categories: financial assets at fair value through profit or loss, held-to-maturity financial assets, available-for-sale financial assets and loans and advances. The classification depends on the purpose for which the financial assets were acquired. Management determines the classification of its financial assets at initial recognition.
Financial assets at fair value through profit or loss
This category has two subcategories: financial assets held for trading, and those designated at fair value through profit or loss at inception. A financial asset is classified in this category if acquired principally for the purpose of selling in the short term or if so designated by management. Financial assets designated at fair value through profit or loss at inception are those that are managed and whose performance is evaluated on a fair value basis. Information about these financial assets is provided internally on a fair value basis to the group’s key management personnel. Derivatives are categorised as held for trading.
Financial assets designated as at fair value through profit or loss at inception relating to the group’s linked insurance company, PSG FutureWealth, are those that are held in internal funds to match insurance and investment contract liabilities that are linked to the changes in fair value of these assets. The designation of these assets to be at fair value through profit or loss eliminates or significantly reduces a measurement or recognition inconsistency that would otherwise arise from measuring assets or liabilities or recognising the gains and losses on them on different bases.
Held-to-maturity financial assets
Held-to-maturity financial assets are non-derivative financial assets with fixed or determinable payments and fixed maturities – other than those that meet the definition of loans and advances – that the group’s management has the positive intention and ability to hold to maturity.
Loans and advances
Loans and advances are non-derivative financial assets with fixed or determinable payments that are not quoted in an active market other than those that the group intends to sell in the short term. Loans and advances are carried at amortised cost using the effective-interest method. Specific provisions are made against identified doubtful advances.
Available-for-sale financial assets
Available-for-sale financial assets are non-derivative financial assets that are either designated in this category or not classified in any of the other categories.
45
PSG GROUP LIMITED ANNUAL REPORT 2010
Accounting policiescontinued
Recognition and measurement of financial assets
Purchases and sales of financial assets are recognised on trade date – the date on which the group commits to purchase or sell the asset. Financial assets not carried at fair value through profit or loss, are initially recognised at fair value plus transaction costs that are directly attributable to their acquisition. Financial assets carried at fair value through profit or loss are initially recognised at fair value and transaction costs are expensed in the income statement. Financial assets are derecognised when the rights to receive cash flows from the financial assets have expired or have been transferred and the group has transferred substantially all risks and rewards of ownership.
Available-for-sale financial assets and financial assets at fair value through profit or loss are subsequently carried at fair value. Realised and unrealised gains and losses arising from changes in the fair value of the ‘financial assets at fair value through profit or loss’ category are included in the income statement in the period in which they arise. Unrealised gains and losses arising from changes in the fair value of non-monetary securities classified as available-for-sale are recognised in the statement of comprehensive income. When securities classified as available-for-sale are sold or impaired, the accumulated fair value adjustments are included in the income statement as gains and losses from investment activities.
Interest on available-for-sale securities calculated using the effective interest method is recognised in the income statement as part of investment income. Dividends on available-for-sale equity instruments are recognised in the income statement as part of investment income when the group’s right to receive payment is established.
The fair values of quoted financial assets are based on current bid prices. If the market for a financial asset is not active, the group establishes fair value by using valuation techniques. These include the use of recent arm’s length transactions, reference to other instruments that are substantially the same, and discounted cash flow analysis refined to reflect the issuer’s specific circumstances.
The group does not apply hedge accounting other than the hedging activities for contracts for difference.
Loans advanced to associated companies and subsidiaries, which are interest-free with no repayment terms, are carried at amortised cost using the effective-interest method. Discounting of these loans does not have a material effect on the carrying amount.
Impairment of financial assets
The group assesses at each statement of financial position date whether there is objective evidence that a financial asset or a group of financial assets is impaired. In the case of equity securities classified as available-for-sale, a significant or prolonged decline in the fair value of the security below its cost is considered in determining whether the securities are impaired. If any such evidence exists for available-for-sale financial assets, the cumulative loss – measured as the difference between the acquisition cost and the current fair value, less any impairment loss on that financial asset previously recognised in profit or loss – is removed from equity and recognised in the income statement. Impairment losses recognised in the income statement on equity instruments are not reversed through the income statement.
Loans and advances are considered impaired if, and only if, there is objective evidence of impairment as a result of events that occurred after initial asset recognition (known as loss events) and these loss events have an adverse impact on the assets’ estimated future cash flows that can be reliably measured. Objective evidence that loans and advances may be impaired, includes breach of contract, such as a default or delinquency in interest or principal payments. In this regard instalments past due date are considered in breach of contract. The amount of the impairment loss is the difference between the asset’s carrying amount and the present value of estimated future cash flows, discounted at the original effective interest rate. Impairment losses are recognised in the income statement, and reversed through the income statement.
Investment in investment contracts
These are valued at fair value, if issued by an independent credible party, or at fair values of the underlying investments supporting the investment contract policy adjusted for applicable liquidity or credit risk.
DERIVATIVE FINANCIAL INSTRUMENTS
Derivative financial instruments are recognised initially at fair value on the date on which a derivative contract is entered into. Subsequent to initial recognition, derivative financial instruments are measured at fair value. Fair values of over-the-counter derivatives are obtained using valuation techniques, including discounted cash flow models and option pricing models.
46
PSG GROUP LIMITED ANNUAL REPORT 2010
Accounting policiescontinued
The best evidence of fair value of a derivative at initial recognition is the transaction price (i.e. the fair value of the consideration given or received) unless the fair value of that instrument is evidenced by comparison with other observable current market transactions in the same instrument or based on a valuation technique whose variables include only observable market data.
RECEIVABLES
Receivables are initially measured at fair value and subsequently recognised at amortised cost using the effective interest rate method, less provision for impairment. A provision for impairment is established when there is objective evidence that the group will not be able to collect all amounts due according to the original terms of receivables. Significant financial difficulties of the debtor, probability that the debtor will enter bankruptcy or financial reorganisation, and default or delinquency in payments are considered indicators that the receivable is impaired. The amount of the provision is the difference between the asset’s carrying amount and the present value of estimated future cash flows, discounted at the original effective interest rate. The movement in the amount of the provision is recognised in the income statement.
CONTRACTS FOR DIFFERENCE (CFD)
The group enters into contracts for difference with clients whereby the company provides leveraged exposure to equities specified by the client. The client pays a margin of between 10% and 15% of the value of the equities. Margin calls are made for the full value of any decrease in value of the equities.
CFD positions with clients are funded with equal and opposite CFD positions with other financial institutions. External funding is only used on an intra-day basis to purchase the underlying equity positions which are then delivered to the financial institution, at the end of each business day, for settlement of the intra-day funding provided. The CFD positions are classified as financial assets or liabilities at fair value through profit or loss.
The group is contractually bound to pay out or recover any fair value adjustments from the parties entering into the contracts for difference, based on the fair value movement of the specified listed equities invested in for the client.
CASH AND CASH EQUIVALENTS
Cash and cash equivalents include cash in hand, other deposits held at call with banks, other short-term highly liquid investments with maturities of three months or less, and bank overdrafts. Bank overdrafts are included within borrowings on the statement of financial position.
SHARE CAPITAL
Ordinary shares are classified as equity. Incremental costs directly attributable to the issue of equity instruments are shown in equity as a deduction from the proceeds, net of tax.
Where any group company purchases the company’s equity share capital (treasury shares), the consideration paid, including any directly attributable incremental costs (net of income taxes), is deducted from equity attributable to the company’s equity holders until the shares are cancelled, reissued or disposed of. Where such shares are subsequently sold, reissued or otherwise disposed of, any consideration received is included in equity attributable to the company’s equity holders, net of any directly attributable incremental transaction costs and the related income tax effects.
Subsidiary preference shares
Cumulative, non-redeemable, non-participating subsidiary preference shares, where the dividend declaration is subject to the discretion of the subsidiary’s board, are classified as equity.
INSURANCE AND INVESTMENT CONTRACTS – CLASSIFICATION
A distinction is made between investment contracts (which fall within the scope of IAS 39, Financial Instruments: Recognition and Measurement) and insurance contracts (where the financial soundness valuation (FSV) method continues to apply, subject to certain requirements specified in IFRS 4, Insurance Contracts). A contract is classified as insurance where the group accepts significant insurance risk by agreeing with the policyholder to pay benefits if a specified uncertain future event (the insured event) adversely affects
47
PSG GROUP LIMITED ANNUAL REPORT 2010
Accounting policiescontinued
the policyholder or other beneficiary. Significant insurance risk exists where it is expected that for the duration of the policy or part thereof, policy benefits payable on the occurrence of the insured event will exceed the amount payable on early termination before allowance for expense deductions at early termination. Once a contract has been classified as an insurance contract, the classification remains unchanged for the remainder of its lifetime, even if the insurance risk reduces significantly during this period.
Investment contracts are those contracts that transfer financial risk with no significant insurance risk. These contracts are measured at the fair value of the corresponding financial assets.
INSURANCE CONTRACTS
Policyholder contracts that transfer significant insurance risk are classified as insurance contracts. These contracts are valued in terms of the FSV basis contained in PGN 104 issued by the Actuarial Society of South Africa.
Insurance contracts are valued as the present value of future cash flows due to benefit payments and administration expenses that are directly related to the contract discounted at the rate of return at year-end on the assets backing the policyholder funds. Future cash flows are projected on a best estimate basis with an allowance for compulsory margins for adverse deviations as prescribed by PGN 104. Best estimate assumptions are required for future investment returns, expenses, persistency, mortality and other factors that may impact on the financial position of the group. As per PGN 104, contractual premium increases are allowed for, but future voluntary premium increases are ignored.
In addition, certain discretionary margins are created to allow profits to emerge over the lifetime of the policy to reflect the small number of policies and associated volatility. Where the number of policies is small the prescribed margins alone do not result in an acceptable probability of the total reserve being sufficient to meet all liabilities.
The financial soundness methodology includes allowance for liability adequacy testing to ensure that the carrying amount of technical provisions is sufficient in view of estimated future cash flows. Where a shortfall is identified an additional provision is made.
The group reflects premium income relating to insurance business on a gross basis together with the gross amount of any reinsurance premiums. All premiums are accounted for when they become due and payable.
The group shows the gross amount of policyholder benefit payments in respect of insurance contracts together with the gross reinsurance recoveries and accounts for such transactions when claims are intimated.
FINANCIAL LIABILITIES
A financial liability is any liability that is a contractual obligation to deliver cash or another financial asset to another entity.
Financial liabilities include borrowings, derivative financial instruments, policyholder liabilities under investment contracts, third party liabilities arising on consolidation at mutual funds and trade and other payables. The group issues investment contracts without fixed terms (unit linked) and with fixed and guaranteed terms (fixed interest rate).
Financial liabilities are initially recognised at fair value less transaction costs that are directly attributable to the raising of the funds, for all financial liabilities carried at amortised cost. All financial liabilities measured at fair value through profit or loss are initially recognised at fair value. The best evidence of the fair value at initial recognition is the transaction price (i.e. the fair value of the consideration received) unless the fair value of that instrument is evidenced by comparison with other observable current market transactions in the same instrument or based on a valuation technique whose variables include only data from observable markets.
The fair value of a unit-linked financial liability is determined using the current unit price reflecting the fair values of the financial assets contained within the company’s unitised investment funds linked to the financial liability, multiplied by the number of units attributed to the policyholder at a statement of financial position date. No initial profit is recognised immediately as any profit on initial recognition is amortised in line with cash flow projections over the life of the contract.
48
PSG GROUP LIMITED ANNUAL REPORT 2010
Accounting policiescontinued
For investment contracts with fixed and guaranteed terms, the amortised cost basis is used. In this case, the liability is initially measured at its fair value less transaction costs that are incremental and directly attributable to the acquisition or issue of the contract.
Subsequent measurement of investment contracts at amortised cost uses the effective-interest method. This method requires the determination of an interest rate (the effective interest rate) that exactly discounts to the net carrying amount of the financial liability, the estimated future cash payments or receipts through the expected life of the financial instrument.
The liability under investment contracts is derecognised when the contract expires, is discharged or is cancelled by the policyholder. For a contract that can be cancelled by the policyholder, the fair value cannot be less than the surrender value.
BorrowingsBorrowings are recognised initially at fair value, net of transaction costs incurred. Borrowings are subsequently stated at amortised cost; any difference between the proceeds (net of transaction costs) and the redemption value is recognised in the income statement over the period of the borrowings using the effective-interest method.
Preference shares, which are mandatorily redeemable on a specific date, are classified as liabilities. The dividends on these preference shares are recognised in the income statement as interest expense.
DEFERRED REVENUE LIABILITY (DRL)Service fee income on investment management contracts is recognised on an accrual basis as and when the services are rendered. A DRL is recognised in respect of upfront fees, which are directly attributable to a contract that is charged for securing the investment management service contract. The DRL is then amortised to revenue when the services are provided, over the expected duration of the contract on a straight-line basis.
CURRENT AND DEFERRED INCOME TAxThe tax expense for the period comprises current and deferred tax. Tax is recognised in the income statement, except to the extent that it relates to items recognised in other comprehensive income or directly in equity. In this case the tax is also recognised in other comprehensive income or directly in equity, respectively.
The current income tax charge is calculated on the basis of the tax laws enacted or substantively enacted at the statement of financial position date in the countries where the group’s subsidiaries and associates operate and generate taxable income. Management periodically evaluates positions taken in tax returns with respect to situations in which applicable tax regulations are subject to interpretation and establishes provisions, where appropriate, on the basis of amounts expected to be paid to the tax authorities.
Deferred income tax is provided in full, using the liability method, on temporary differences arising between the tax bases of assets and liabilities and their carrying amounts in the consolidated financial statements. However, if the deferred income tax arises from initial recognition of an asset or liability in a transaction other than a business combination, that at the time of the transaction affects neither accounting nor taxable profit or loss, it is not accounted for. Deferred income tax is determined using tax rates (and laws) that have been enacted or substantively enacted by the statement of financial position date and are expected to apply when the related deferred income tax asset is realised or the deferred income tax liability is settled.
Deferred income tax assets are recognised to the extent that it is probable that future taxable profit will be available against which the temporary differences can be utilised.
Deferred income tax is provided on temporary differences arising on investments in subsidiaries and associated companies, except where the group controls the timing of the reversal of the temporary difference and it is probable that the temporary difference will not reverse in the foreseeable future.
Deferred income tax assets and liabilities are offset when there is a legally enforceable right to offset current tax assets against current tax liabilities and when the deferred income taxes assets and liabilities relate to income taxes levied by the same taxation authority on either the taxable entity or different taxable entities where there is an intention to settle the balances on a net basis.
49
PSG GROUP LIMITED ANNUAL REPORT 2010
Accounting policiescontinued
EMPLOYEE BENEFITS
Pension obligations
The group only has defined-contribution plans. A defined-contribution plan is a pension plan under which the group pays fixed contributions into a separate entity. The group has no legal or constructive obligations to pay further contributions if the fund does not hold sufficient assets to pay all employees the benefits relating to employee service in the current and prior periods. The contributions are recognised as an employee benefit expense when they are due. Prepaid contributions are recognised as an asset to the extent that a cash refund or a reduction in the future payments is available.
Other post-retirement benefits
The group has no liabilities with regard to post-retirement medical benefits.
Share-based compensation
The group operates an equity-settled share-based compensation plan as well as a cash-settled scheme where the calculation of the compensation is based on the group share price (“cash scheme”).
For the equity-settled share-based compensation scheme, the fair value of the employee services received in exchange for the grant of the scheme shares, less the amount paid by the employee, is recognised as an expense. The total amount to be expensed over the vesting period, which is between three and five years, is determined by reference to the fair value of the scheme shares granted, excluding the impact of any non-market vesting conditions. Non-market vesting conditions are included in assumptions about the number of scheme shares that are expected to become exercisable. At each statement of financial position date, the entity revises its estimates of the number of scheme shares that are expected to become exercisable. It recognises the impact of the revision of original estimates, if any, in the income statement, and a corresponding adjustment to equity over the remaining vesting period. The proceeds received from employees are credited to the loan account.
If the group cancels or settles a grant of equity instruments during the vesting period, the group accounts for the cancellation or settlement of the grant and recognises immediately the amount that otherwise would have been recognised for services received over the remainder of the vesting period.
For the cash-settled scheme, the fair value of the liability incurred for employee services received is recognised as an expense over the vesting period. Until the liability is settled, the group remeasures the fair value of the liability at each reporting date and at the date of settlement, with any changes in value recognised in profit or loss for the period.
The share-based payment costs are recognised in the income statement and a share-based payment reserve is recognised as part of equity and represents the fair value of the shares that will be delivered at grant date.
A liability is raised for the fair value of the cash share scheme at each statement of financial position date.
Annual leave
Employee entitlements to annual leave are recognised when they accrue to employees. An accrual is made for the estimated annual leave as a result of services rendered by employees up to statement of financial position date.
Profit sharing and bonus plans
The group recognises a liability and an expense for bonuses and profit sharing. The group recognises a provision where contractually obliged or where there is a past practice that has created a constructive obligation.
PROVISIONS
Provisions are recognised when:• the group has a present legal or constructive obligation as a result of past events;• it is more likely than not that an outflow of resources will be required to settle the obligation; and• the amount has been reliably estimated.
50
PSG GROUP LIMITED ANNUAL REPORT 2010
Accounting policiescontinued
Provisions are measured at the present value of the expenditures expected to be required to settle the obligation using a pre-tax rate that reflects current market assessments of the time value of money and the risks specific to the obligation. The increase in the provision due to passage of time is recognised as an interest expense.
REVENUE RECOGNITION
Revenue comprises the fair value of the consideration received or receivable for services in the ordinary course of the group’s activities. Revenue is shown net of value added tax, after eliminating revenue within the group. Revenue is recognised as follows:
Rendering of services
Investment management fees and initial feesUpfront payments received for asset management services relating to the rendering of future services are deferred and amortised in proportion to the stage of completion of the service for which they were paid.
Recurring feesRevenue arising from brokerage activities and other related services, advisory services and portfolio management offered by the group is recognised in the accounting period in which the services are rendered, with reference to completion of the specific transaction.
Fee income is recognised when the related company is unconditionally entitled thereto. No profit is recognised when the outcome of a transaction cannot be estimated reliably.
Interest income
Interest income for financial assets that are not classified as at fair value through profit or loss is recognised using the effective-interest method. When a receivable is impaired, the group reduces the carrying amount to its recoverable amount, being the estimated future cash flow discounted at the original effective interest rate of the instrument and continues unwinding discount as interest income. Interest income from financial assets that are classified as at fair value through profit or loss is included in investment income.
Dividend income
Dividend income is recognised when the right to receive payment is established. Dividend income from financial assets that are classified as at fair value through profit or loss is included in investment income.
LEASES
Leases in which a significant portion of the risks and rewards of ownership is retained by the lessor are classified as operating leases. Payments made under operating leases are charged to the income statement on a straight-line basis over the period of the lease.
DIVIDEND DISTRIBUTIONS
Dividend distributions to the company’s shareholders are recognised as a liability in the period in which the dividends are approved by the company’s board of directors.
SECONDARY TAx ON COMPANIES
South African resident companies are subject to a dual corporate tax system, one part of the tax being levied on taxable income and the other, a secondary tax (called STC), on distributed income. A company incurs STC charges on the declaration or deemed declaration of dividends (as defined under tax law) to its shareholders. STC is not a withholding tax on shareholders, but a tax on companies.
The STC tax consequence of dividends is recognised as a taxation charge in the income statement in the same period that the related dividend is accrued as a liability. The STC liability is reduced by dividends received during the dividend cycle. Where dividends declared exceed the dividends received during a cycle, STC is payable at the current STC rate on the net amount. Where dividends received exceed dividends declared within a cycle, there is no liability to pay STC. The potential tax benefit related to excess dividends is carried forward to the next dividend cycle as an STC credit. Deferred tax assets are recognised on unutilised STC credits to the extent that it is probable that the group will declare dividends in the following year to utilise such STC credits.
51
PSG GROUP LIMITED ANNUAL REPORT 2010
Accounting policiescontinued
CONTINGENCIES
A contingent liability is either a possible obligation that arises from past events and whose existence will be confirmed only by the occurrence or non-occurrence of one or more uncertain future events not wholly within the control of the company or a present obligation that arises from past events but it is not probable that an outflow of resources embodying economic benefits will be required to settle the obligation or the amount of the obligation cannot be measured with sufficient reliability. These contingent liabilities are not recognised in the statement of financial position but disclosed in the notes to the financial statements.
A contingent asset is a possible asset that arises from past events and whose existence will be confirmed only by the occurrence or non-occurrence of one or more uncertain future events not wholly within the control of the entity. These contingent assets are not recognised in the statement of financial position but are disclosed in the notes to the financial statements if the inflow of financial benefits is probable.
CRITICAL ACCOUNTING ESTIMATES AND JUDGEMENTS IN APPLYING ACCOUNTING POLICIES
Estimates and judgements are continually evaluated and are based on historical experience and other factors, including expectations of future events that are believed to be reasonable under the circumstances.
The group makes estimates and assumptions that affect the reported amounts of assets and liabilities within the next financial year. Estimates and judgements are continually evaluated and based on historical experience and other factors, including expectations of future events that are believed to be reasonable under circumstances.
Estimated impairment of goodwill
The group tests annually whether goodwill has suffered any impairment, in accordance with the accounting policy on goodwill. The recoverable amounts of cash-generating units have been determined based on value-in-use and fair value less cost to sell calculations. These calculations require the use of estimates (see note 2).
Fair value of derivatives and other unlisted financial instruments
The fair value of financial instruments that are trading on recognised over-the-counter (OTC) platforms is based on the closing price and classified as quoted instruments. The fair value of financial instruments that are not traded in an active market is determined by using valuation techniques as disclosed in the policy relating to financial assets.
Expense provisions
Management uses its discretion to make an estimate of the expenditure required to settle the present obligation at the statement of financial position date of the amount they estimate that the group would rationally pay to settle the obligation or to transfer it to a third party.
Employee benefits
Refer to note 14 on share-based compensation schemes.
Equity accounting
The group accounts for certain investments as associates although the group holds less than 20 per cent of the issued share capital. This is based on the group’s ability to exercise significant influence over the investments through its voting power (both through its equity holding and its representation on the board of directors), its participation in the strategic, financial and operational, decisions of the investments and the fact that the influence is also acknowledged by the investments.
Directors’ valuation of unlisted associated companies
Directors’ valuation of unlisted associated companies is determined with reference to market prices, assessing the fair value of underlying investments as well as the published net asset value or valuation techniques. Valuation techniques used include applying a market-related price-earnings ratio to operational earnings or performing discounted cash flow models to the expected cash flows. The following assumptions are used in the valuation models:
52
PSG GROUP LIMITED ANNUAL REPORT 2010
Assumptions 2010 2009Range Range
Weighted average cost of capital 14% – 19% 12,5% – 16%Growth rate 0% – 25% 0% – 25%Terminal growth rate 6% 5,3%Risk-free rate 8,3% 7,8%
Impairment of investments
An impairment of investments is considered when the fair value is below its carrying value. In determining whether the decline is significant or prolonged, the following factors may be considered: normal volatility in share price, the financial health of the investee, sector performance and changes in operational and financing cash flow.
An impairment loss is recognised for the amount by which the investment’s carrying amount exceeds its recoverable amount. The recoverable amount is the higher of an asset’s fair value less costs to sell and value in use. The value in use is calculated with reference to the assumptions noted above. The underlying market values of investments in listed entities held by associated companies are also considered in assessing the carrying values.
The directors are satisfied that the company’s investments are fairly stated.
Acquisition of associated companies
During the year new investments, and further investments in existing associated companies were made. In accounting for these transactions management had to apply judgement in allocating the purchase price to the tangible and intangible assets of the associates acquired, as well as to goodwill.
Investment contracts
The company issues a significant number of investment contracts that are designated at fair value through profit or loss. These financial instruments are not quoted in active markets, and their fair values are determined by using valuation techniques. Such techniques (for example, valuation models) are validated and periodically reviewed by qualified personnel independent of the area that created them. All models are validated before they are used and calibrated to ensure that outputs reflect actual experience and comparable market prices.
Accounting policiescontinued
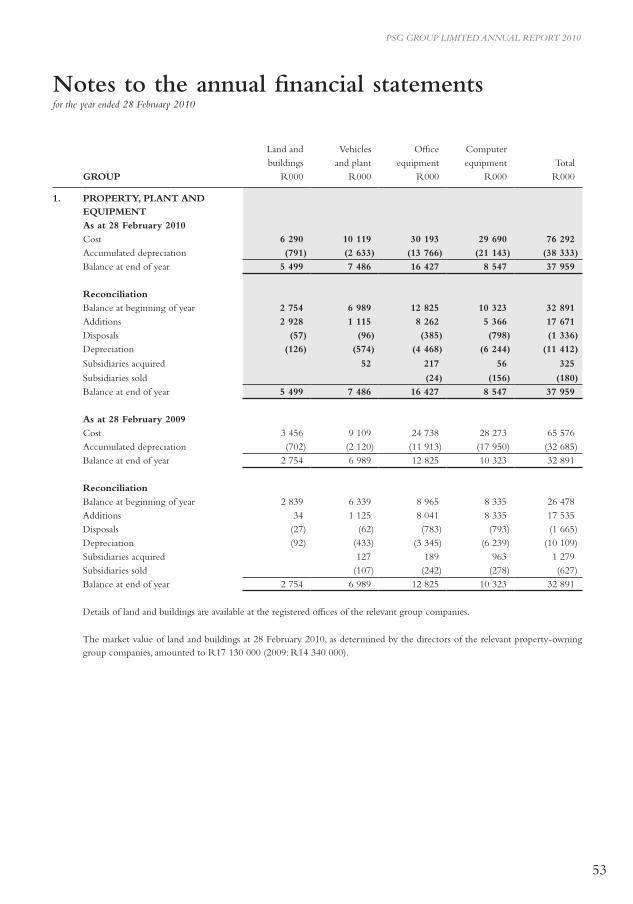
53
PSG GROUP LIMITED ANNUAL REPORT 2010
Land and Vehicles Office Computer buildings and plant equipment equipment Total
GROUP R000 R000 R000 R000 R000
1.
PROPERTY, PLANT AND EQUIPMENTAs at 28 February 2010Cost 6 290 10 119 30 193 29 690 76 292 Accumulated depreciation (791) (2 633) (13 766) (21 143) (38 333)Balance at end of year 5 499 7 486 16 427 8 547 37 959
ReconciliationBalance at beginning of year 2 754 6 989 12 825 10 323 32 891 Additions 2 928 1 115 8 262 5 366 17 671 Disposals (57) (96) (385) (798) (1 336)Depreciation (126) (574) (4 468) (6 244) (11 412)
Subsidiaries acquired 52 217 56 325
Subsidiaries sold (24) (156) (180)Balance at end of year 5 499 7 486 16 427 8 547 37 959
As at 28 February 2009Cost 3 456 9 109 24 738 28 273 65 576 Accumulated depreciation (702) (2 120) (11 913) (17 950) (32 685)Balance at end of year 2 754 6 989 12 825 10 323 32 891
ReconciliationBalance at beginning of year 2 839 6 339 8 965 8 335 26 478 Additions 34 1 125 8 041 8 335 17 535 Disposals (27) (62) (783) (793) (1 665)Depreciation (92) (433) (3 345) (6 239) (10 109)Subsidiaries acquired 127 189 963 1 279 Subsidiaries sold (107) (242) (278) (627)Balance at end of year 2 754 6 989 12 825 10 323 32 891
Details of land and buildings are available at the registered offices of the relevant group companies.
The market value of land and buildings at 28 February 2010, as determined by the directors of the relevant property-owning group companies, amounted to R17 130 000 (2009: R14 340 000).
Notes to the annual financial statementsfor the year ended 28 February 2010
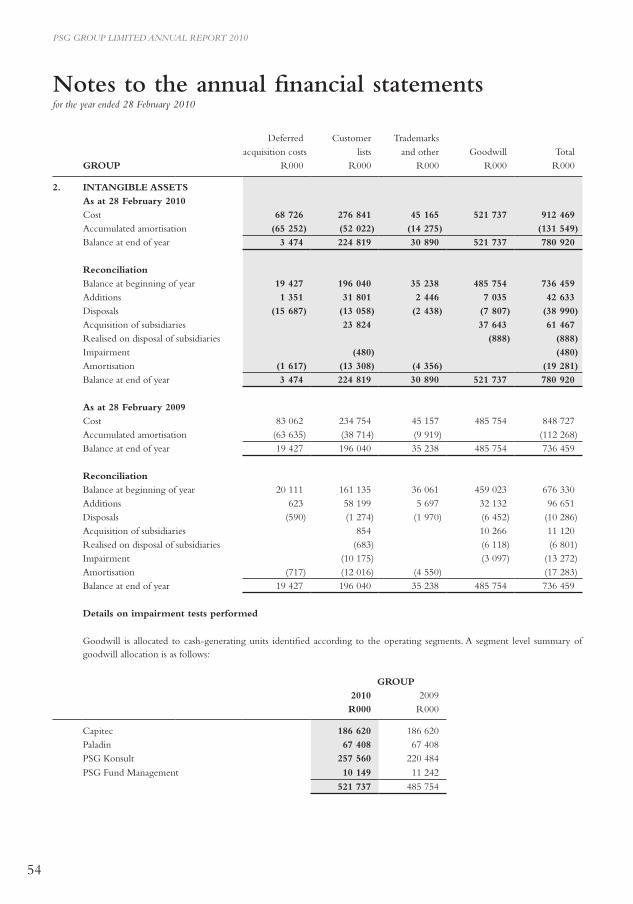
54
PSG GROUP LIMITED ANNUAL REPORT 2010
Deferred Customer Trademarks acquisition costs lists and other Goodwill Total
GROUP R000 R000 R000 R000 R000
2. INTANGIBLE ASSETSAs at 28 February 2010Cost 68 726 276 841 45 165 521 737 912 469 Accumulated amortisation (65 252) (52 022) (14 275) (131 549)Balance at end of year 3 474 224 819 30 890 521 737 780 920
ReconciliationBalance at beginning of year 19 427 196 040 35 238 485 754 736 459 Additions 1 351 31 801 2 446 7 035 42 633 Disposals (15 687) (13 058) (2 438) (7 807) (38 990)Acquisition of subsidiaries 23 824 37 643 61 467 Realised on disposal of subsidiaries (888) (888)Impairment (480) (480)Amortisation (1 617) (13 308) (4 356) (19 281)Balance at end of year 3 474 224 819 30 890 521 737 780 920
As at 28 February 2009Cost 83 062 234 754 45 157 485 754 848 727 Accumulated amortisation (63 635) (38 714) (9 919) (112 268)Balance at end of year 19 427 196 040 35 238 485 754 736 459
ReconciliationBalance at beginning of year 20 111 161 135 36 061 459 023 676 330 Additions 623 58 199 5 697 32 132 96 651 Disposals (590) (1 274) (1 970) (6 452) (10 286)Acquisition of subsidiaries 854 10 266 11 120 Realised on disposal of subsidiaries (683) (6 118) (6 801)Impairment (10 175) (3 097) (13 272)Amortisation (717) (12 016) (4 550) (17 283)Balance at end of year 19 427 196 040 35 238 485 754 736 459
Details on impairment tests performed
Goodwill is allocated to cash-generating units identified according to the operating segments. A segment level summary of goodwill allocation is as follows:
GROUP2010 2009R000 R000
Capitec 186 620 186 620 Paladin 67 408 67 408 PSG Konsult 257 560 220 484
PSG Fund Management 10 149 11 242
521 737 485 754
Notes to the annual financial statementsfor the year ended 28 February 2010
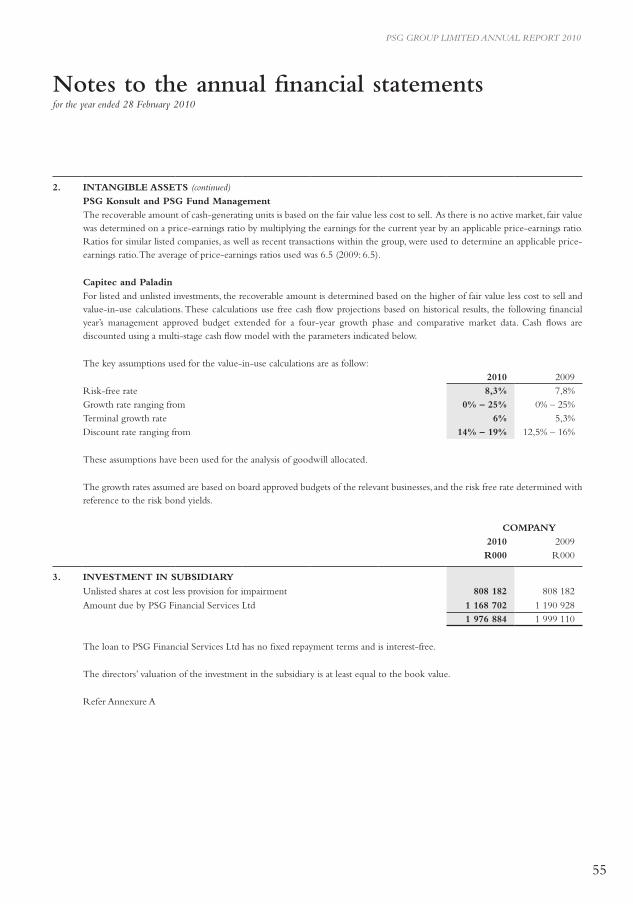
55
PSG GROUP LIMITED ANNUAL REPORT 2010
2. INTANGIBLE ASSETS (continued)PSG Konsult and PSG Fund ManagementThe recoverable amount of cash-generating units is based on the fair value less cost to sell. As there is no active market, fair value was determined on a price-earnings ratio by multiplying the earnings for the current year by an applicable price-earnings ratio. Ratios for similar listed companies, as well as recent transactions within the group, were used to determine an applicable price-earnings ratio. The average of price-earnings ratios used was 6.5 (2009: 6.5).
Capitec and PaladinFor listed and unlisted investments, the recoverable amount is determined based on the higher of fair value less cost to sell and value-in-use calculations. These calculations use free cash flow projections based on historical results, the following financial year’s management approved budget extended for a four-year growth phase and comparative market data. Cash flows are discounted using a multi-stage cash flow model with the parameters indicated below.
The key assumptions used for the value-in-use calculations are as follow:2010 2009
Risk-free rate 8,3% 7,8%Growth rate ranging from 0% – 25% 0% – 25%Terminal growth rate 6% 5,3%Discount rate ranging from 14% – 19% 12,5% – 16%
These assumptions have been used for the analysis of goodwill allocated.
The growth rates assumed are based on board approved budgets of the relevant businesses, and the risk free rate determined with reference to the risk bond yields.
COMPANY 2010 2009 R000 R000
3. INVESTMENT IN SUBSIDIARY
Unlisted shares at cost less provision for impairment 808 182 808 182
Amount due by PSG Financial Services Ltd 1 168 702 1 190 928 1 976 884 1 999 110
The loan to PSG Financial Services Ltd has no fixed repayment terms and is interest-free.
The directors’ valuation of the investment in the subsidiary is at least equal to the book value.
Refer Annexure A
Notes to the annual financial statementsfor the year ended 28 February 2010
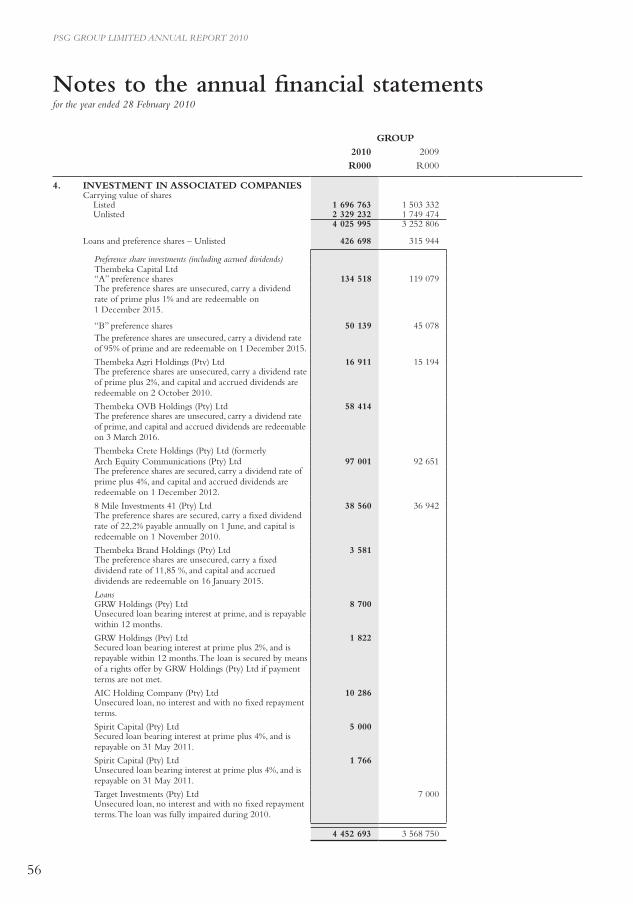
56
PSG GROUP LIMITED ANNUAL REPORT 2010
GROUP 2010 2009R000 R000
4. INVESTMENT IN ASSOCIATED COMPANIESCarrying value of shares Listed 1 696 763 1 503 332 Unlisted 2 329 232 1 749 474
4 025 995 3 252 806
Loans and preference shares – Unlisted 426 698 315 944
Preference share investments (including accrued dividends)Thembeka Capital Ltd “A” preference shares 134 518 119 079The preference shares are unsecured, carry a dividend rate of prime plus 1% and are redeemable on 1 December 2015.
“B” preference shares 50 139 45 078 The preference shares are unsecured, carry a dividend rate of 95% of prime and are redeemable on 1 December 2015.
Thembeka Agri Holdings (Pty) Ltd 16 911 15 194 The preference shares are unsecured, carry a dividend rate of prime plus 2%, and capital and accrued dividends are redeemable on 2 October 2010.
Thembeka OVB Holdings (Pty) Ltd 58 414The preference shares are unsecured, carry a dividend rate of prime, and capital and accrued dividends are redeemable on 3 March 2016.
Thembeka Crete Holdings (Pty) Ltd (formerly Arch Equity Communications (Pty) Ltd 97 001 92 651 The preference shares are secured, carry a dividend rate of prime plus 4%, and capital and accrued dividends are redeemable on 1 December 2012.
8 Mile Investments 41 (Pty) Ltd 38 560 36 942 The preference shares are secured, carry a fixed dividend rate of 22,2% payable annually on 1 June, and capital is redeemable on 1 November 2010.
Thembeka Brand Holdings (Pty) Ltd 3 581The preference shares are unsecured, carry a fixed dividend rate of 11,85 %, and capital and accrued dividends are redeemable on 16 January 2015.
LoansGRW Holdings (Pty) Ltd 8 700Unsecured loan bearing interest at prime, and is repayable within 12 months.
GRW Holdings (Pty) Ltd 1 822Secured loan bearing interest at prime plus 2%, and is repayable within 12 months. The loan is secured by means of a rights offer by GRW Holdings (Pty) Ltd if payment terms are not met.
AIC Holding Company (Pty) Ltd 10 286Unsecured loan, no interest and with no fixed repayment terms.
Spirit Capital (Pty) Ltd 5 000Secured loan bearing interest at prime plus 4%, and is repayable on 31 May 2011.
Spirit Capital (Pty) Ltd 1 766Unsecured loan bearing interest at prime plus 4%, and is repayable on 31 May 2011.
Target Investments (Pty) Ltd 7 000 Unsecured loan, no interest and with no fixed repayment terms. The loan was fully impaired during 2010.
4 452 693 3 568 750
Notes to the annual financial statementsfor the year ended 28 February 2010
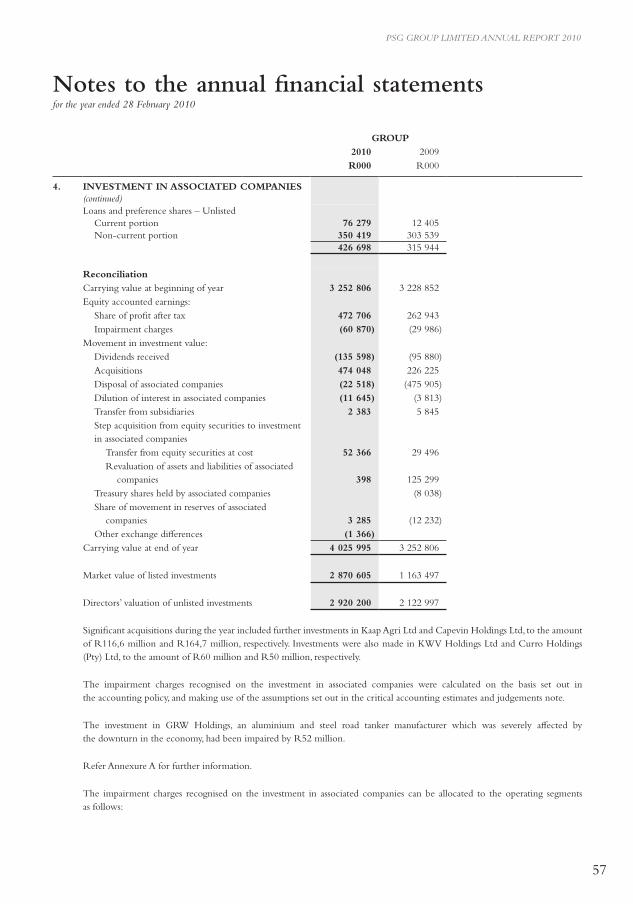
57
PSG GROUP LIMITED ANNUAL REPORT 2010
GROUP2010 2009R000 R000
4. INVESTMENT IN ASSOCIATED COMPANIES (continued)Loans and preference shares – Unlisted
Current portion 76 279 12 405 Non-current portion 350 419 303 539
426 698 315 944
ReconciliationCarrying value at beginning of year 3 252 806 3 228 852 Equity accounted earnings:
Share of profit after tax 472 706 262 943 Impairment charges (60 870) (29 986)
Movement in investment value:Dividends received (135 598) (95 880) Acquisitions 474 048 226 225 Disposal of associated companies (22 518) (475 905) Dilution of interest in associated companies (11 645) (3 813) Transfer from subsidiaries 2 383 5 845 Step acquisition from equity securities to investment in associated companies
Transfer from equity securities at cost 52 366 29 496 Revaluation of assets and liabilities of associated
companies 398 125 299 Treasury shares held by associated companies (8 038) Share of movement in reserves of associated
companies 3 285 (12 232) Other exchange differences (1 366)
Carrying value at end of year 4 025 995 3 252 806
Market value of listed investments 2 870 605 1 163 497
Directors’ valuation of unlisted investments 2 920 200 2 122 997
Significant acquisitions during the year included further investments in Kaap Agri Ltd and Capevin Holdings Ltd, to the amount of R116,6 million and R164,7 million, respectively. Investments were also made in KWV Holdings Ltd and Curro Holdings (Pty) Ltd, to the amount of R60 million and R50 million, respectively.
The impairment charges recognised on the investment in associated companies were calculated on the basis set out in the accounting policy, and making use of the assumptions set out in the critical accounting estimates and judgements note.
The investment in GRW Holdings, an aluminium and steel road tanker manufacturer which was severely affected by the downturn in the economy, had been impaired by R52 million.
Refer Annexure A for further information.
The impairment charges recognised on the investment in associated companies can be allocated to the operating segments as follows:
Notes to the annual financial statementsfor the year ended 28 February 2010
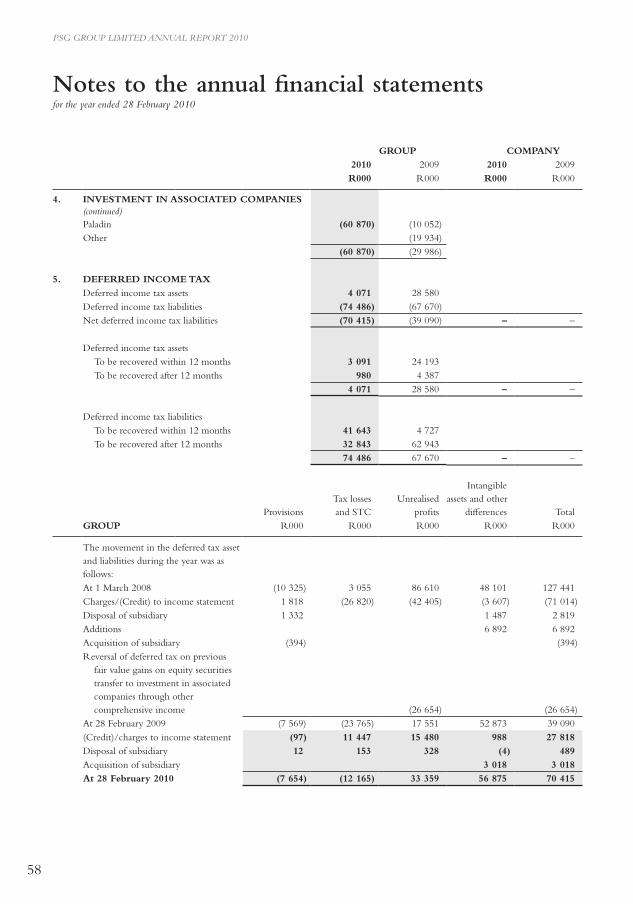
58
PSG GROUP LIMITED ANNUAL REPORT 2010
GROUP COMPANY2010 2009 2010 2009R000 R000 R000 R000
4. INVESTMENT IN ASSOCIATED COMPANIES (continued)Paladin (60 870) (10 052) Other (19 934)
(60 870) (29 986)
5. DEFERRED INCOME TAxDeferred income tax assets 4 071 28 580 Deferred income tax liabilities (74 486) (67 670) Net deferred income tax liabilities (70 415) (39 090) – –
Deferred income tax assetsTo be recovered within 12 months 3 091 24 193 To be recovered after 12 months 980 4 387
4 071 28 580 – –
Deferred income tax liabilitiesTo be recovered within 12 months 41 643 4 727 To be recovered after 12 months 32 843 62 943
74 486 67 670 – –
ProvisionsTax losses and STC
Unrealised profits
Intangibleassets and other
differences TotalGROUP R000 R000 R000 R000 R000
The movement in the deferred tax asset and liabilities during the year was as follows:At 1 March 2008 (10 325) 3 055 86 610 48 101 127 441 Charges/(Credit) to income statement 1 818 (26 820) (42 405) (3 607) (71 014) Disposal of subsidiary 1 332 1 487 2 819 Additions 6 892 6 892 Acquisition of subsidiary (394) (394) Reversal of deferred tax on previous fair value gains on equity securities
transfer to investment in associated companies through other comprehensive income (26 654) (26 654)
At 28 February 2009 (7 569) (23 765) 17 551 52 873 39 090 (Credit)/charges to income statement (97) 11 447 15 480 988 27 818 Disposal of subsidiary 12 153 328 (4) 489 Acquisition of subsidiary 3 018 3 018 At 28 February 2010 (7 654) (12 165) 33 359 56 875 70 415
Notes to the annual financial statementsfor the year ended 28 February 2010
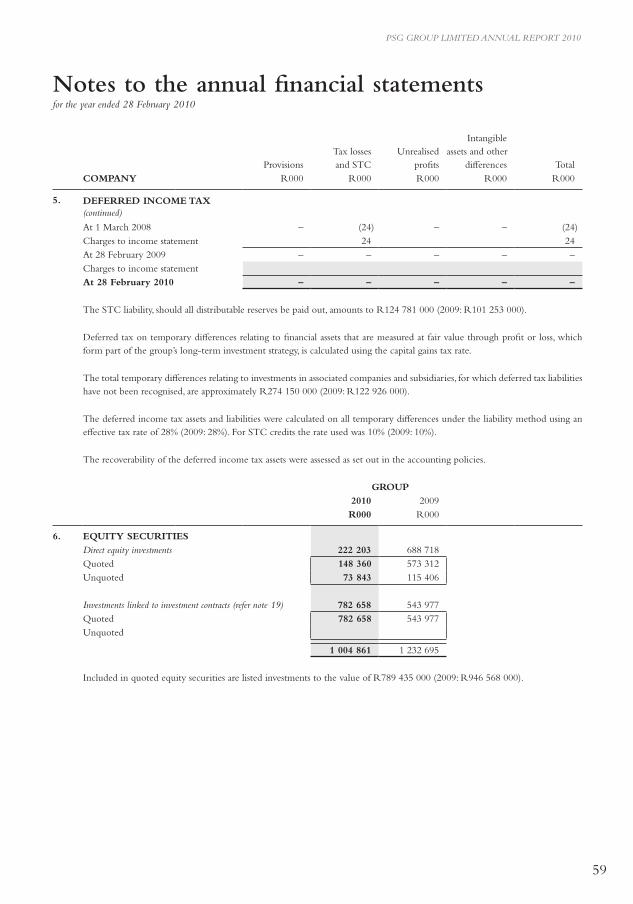
59
PSG GROUP LIMITED ANNUAL REPORT 2010
ProvisionsTax losses and STC
Unrealised profits
Intangibleassets and other
differences TotalCOMPANY R000 R000 R000 R000 R000
5. DEFERRED INCOME TAx (continued)
At 1 March 2008 – (24) – – (24)Charges to income statement 24 24 At 28 February 2009 – – – – –Charges to income statementAt 28 February 2010 – – – – –
The STC liability, should all distributable reserves be paid out, amounts to R124 781 000 (2009: R101 253 000).
Deferred tax on temporary differences relating to financial assets that are measured at fair value through profit or loss, which form part of the group’s long-term investment strategy, is calculated using the capital gains tax rate.
The total temporary differences relating to investments in associated companies and subsidiaries, for which deferred tax liabilities have not been recognised, are approximately R274 150 000 (2009: R122 926 000).
The deferred income tax assets and liabilities were calculated on all temporary differences under the liability method using an effective tax rate of 28% (2009: 28%). For STC credits the rate used was 10% (2009: 10%).
The recoverability of the deferred income tax assets were assessed as set out in the accounting policies.
GROUP 2010 2009 R000 R000
6. EQUITY SECURITIESDirect equity investments 222 203 688 718Quoted 148 360 573 312Unquoted 73 843 115 406
Investments linked to investment contracts (refer note 19) 782 658 543 977Quoted 782 658 543 977Unquoted
1 004 861 1 232 695
Included in quoted equity securities are listed investments to the value of R789 435 000 (2009: R946 568 000).
Notes to the annual financial statementsfor the year ended 28 February 2010
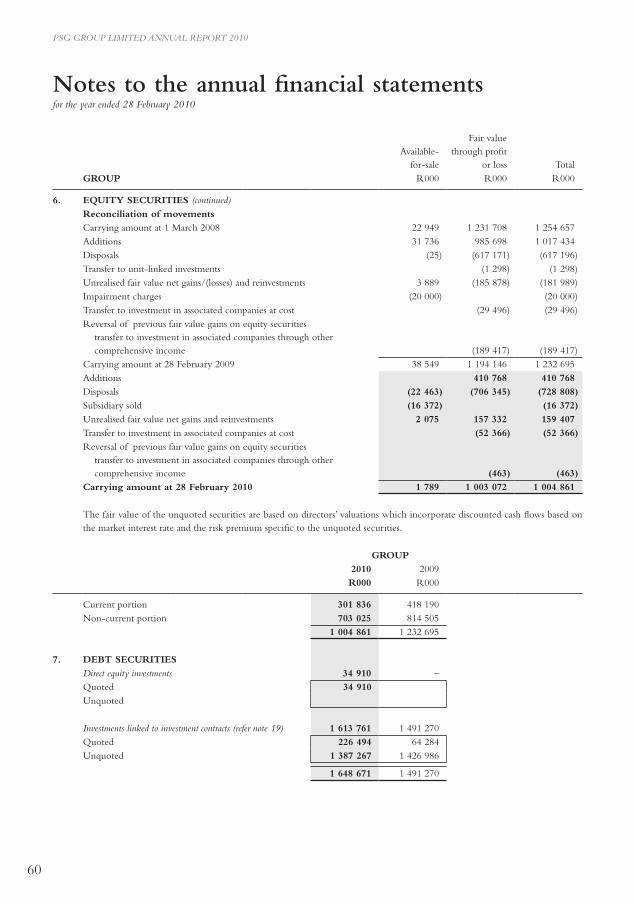
60
PSG GROUP LIMITED ANNUAL REPORT 2010
Available-for-sale
Fair value through profit
or loss TotalGROUP R000 R000 R000
6. EQUITY SECURITIES (continued)Reconciliation of movementsCarrying amount at 1 March 2008 22 949 1 231 708 1 254 657Additions 31 736 985 698 1 017 434 Disposals (25) (617 171) (617 196) Transfer to unit-linked investments (1 298) (1 298) Unrealised fair value net gains/(losses) and reinvestments 3 889 (185 878) (181 989) Impairment charges (20 000) (20 000) Transfer to investment in associated companies at cost (29 496) (29 496) Reversal of previous fair value gains on equity securities
transfer to investment in associated companies through other comprehensive income (189 417) (189 417)
Carrying amount at 28 February 2009 38 549 1 194 146 1 232 695 Additions 410 768 410 768Disposals (22 463) (706 345) (728 808) Subsidiary sold (16 372) (16 372) Unrealised fair value net gains and reinvestments 2 075 157 332 159 407 Transfer to investment in associated companies at cost (52 366) (52 366) Reversal of previous fair value gains on equity securities
transfer to investment in associated companies through other comprehensive income (463) (463)
Carrying amount at 28 February 2010 1 789 1 003 072 1 004 861
The fair value of the unquoted securities are based on directors’ valuations which incorporate discounted cash flows based on the market interest rate and the risk premium specific to the unquoted securities.
GROUP 2010 2009 R000 R000
Current portion 301 836 418 190 Non-current portion 703 025 814 505
1 004 861 1 232 695
7. DEBT SECURITIESDirect equity investments 34 910 –Quoted 34 910 Unquoted
Investments linked to investment contracts (refer note 19) 1 613 761 1 491 270 Quoted 226 494 64 284 Unquoted 1 387 267 1 426 986
1 648 671 1 491 270
Notes to the annual financial statementsfor the year ended 28 February 2010
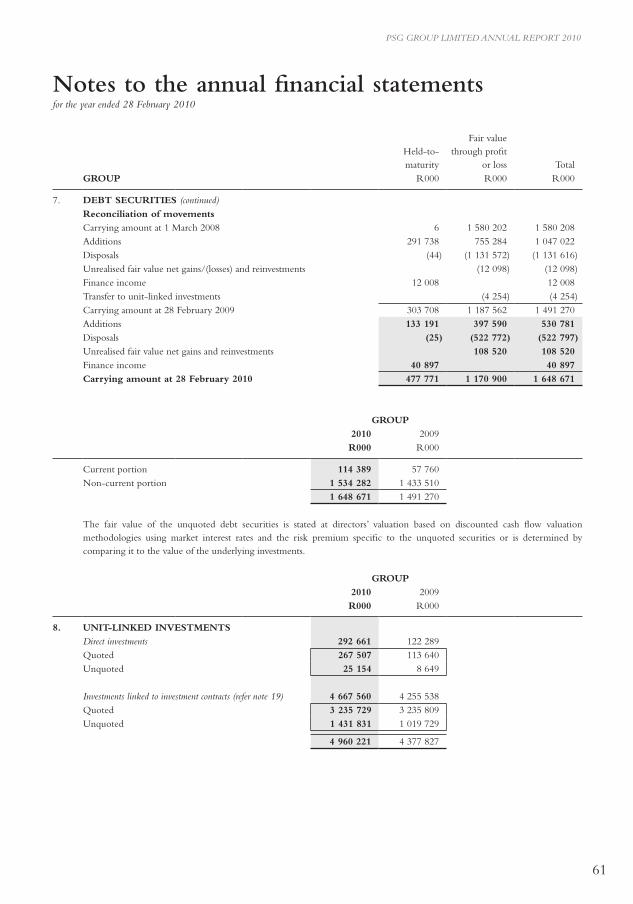
61
PSG GROUP LIMITED ANNUAL REPORT 2010
Held-to-maturity
Fair value through profit
or loss TotalGROUP R000 R000 R000
7. DEBT SECURITIES (continued)Reconciliation of movementsCarrying amount at 1 March 2008 6 1 580 202 1 580 208Additions 291 738 755 284 1 047 022 Disposals (44) (1 131 572) (1 131 616) Unrealised fair value net gains/(losses) and reinvestments (12 098) (12 098) Finance income 12 008 12 008Transfer to unit-linked investments (4 254) (4 254) Carrying amount at 28 February 2009 303 708 1 187 562 1 491 270 Additions 133 191 397 590 530 781Disposals (25) (522 772) (522 797) Unrealised fair value net gains and reinvestments 108 520 108 520Finance income 40 897 40 897Carrying amount at 28 February 2010 477 771 1 170 900 1 648 671
GROUP2010 2009 R000 R000
Current portion 114 389 57 760 Non-current portion 1 534 282 1 433 510
1 648 671 1 491 270
The fair value of the unquoted debt securities is stated at directors’ valuation based on discounted cash flow valuation methodologies using market interest rates and the risk premium specific to the unquoted securities or is determined by comparing it to the value of the underlying investments.
GROUP 2010 2009R000 R000
8. UNIT-LINKED INVESTMENTSDirect investments 292 661 122 289Quoted 267 507 113 640 Unquoted 25 154 8 649
Investments linked to investment contracts (refer note 19) 4 667 560 4 255 538Quoted 3 235 729 3 235 809 Unquoted 1 431 831 1 019 729
4 960 221 4 377 827
Notes to the annual financial statementsfor the year ended 28 February 2010
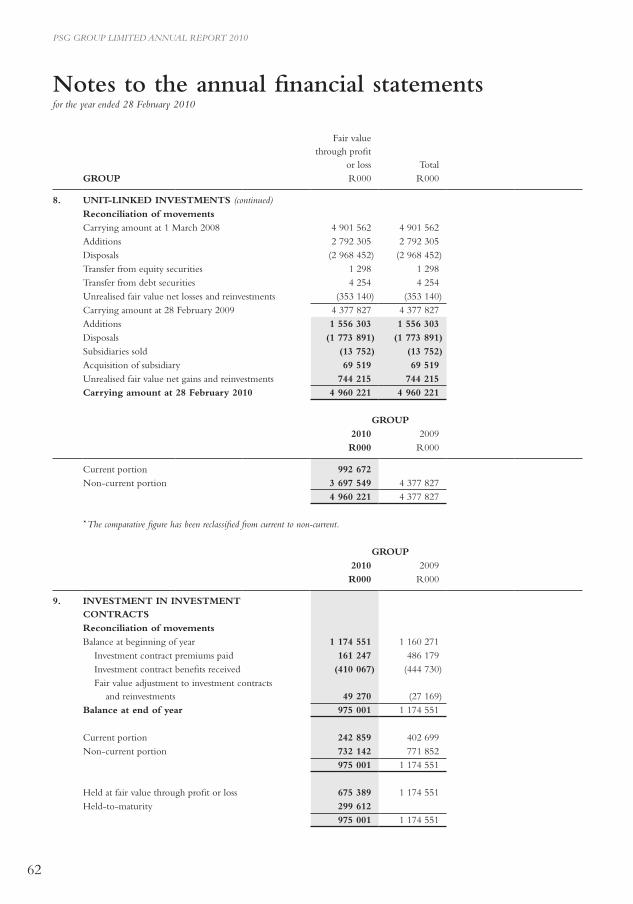
62
PSG GROUP LIMITED ANNUAL REPORT 2010
Fair value through profit
or loss TotalGROUP R000 R000
8. UNIT-LINKED INVESTMENTS (continued)Reconciliation of movementsCarrying amount at 1 March 2008 4 901 562 4 901 562Additions 2 792 305 2 792 305 Disposals (2 968 452) (2 968 452) Transfer from equity securities 1 298 1 298 Transfer from debt securities 4 254 4 254 Unrealised fair value net losses and reinvestments (353 140) (353 140) Carrying amount at 28 February 2009 4 377 827 4 377 827 Additions 1 556 303 1 556 303Disposals (1 773 891) (1 773 891) Subsidiaries sold (13 752) (13 752) Acquisition of subsidiary 69 519 69 519 Unrealised fair value net gains and reinvestments 744 215 744 215 Carrying amount at 28 February 2010 4 960 221 4 960 221
GROUP 2010 2009R000 R000
Current portion 992 672Non-current portion 3 697 549 4 377 827
4 960 221 4 377 827
* The comparative figure has been reclassified from current to non-current.
GROUP 2010 2009R000 R000
9. INVESTMENT IN INVESTMENT CONTRACTSReconciliation of movementsBalance at beginning of year 1 174 551 1 160 271
Investment contract premiums paid 161 247 486 179 Investment contract benefits received (410 067) (444 730) Fair value adjustment to investment contracts
and reinvestments 49 270 (27 169) Balance at end of year 975 001 1 174 551
Current portion 242 859 402 699 Non-current portion 732 142 771 852
975 001 1 174 551
Held at fair value through profit or loss 675 389 1 174 551Held-to-maturity 299 612
975 001 1 174 551
Notes to the annual financial statementsfor the year ended 28 February 2010
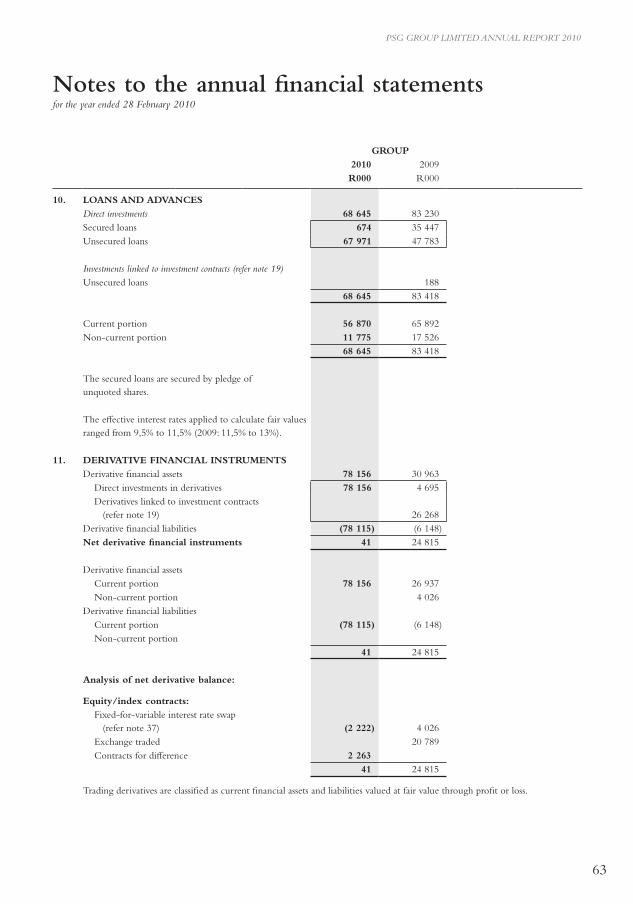
63
PSG GROUP LIMITED ANNUAL REPORT 2010
GROUP2010 2009R000 R000
10. LOANS AND ADVANCESDirect investments 68 645 83 230Secured loans 674 35 447 Unsecured loans 67 971 47 783
Investments linked to investment contracts (refer note 19)Unsecured loans 188
68 645 83 418
Current portion 56 870 65 892 Non-current portion 11 775 17 526
68 645 83 418
The secured loans are secured by pledge of unquoted shares.
The effective interest rates applied to calculate fair values ranged from 9,5% to 11,5% (2009: 11,5% to 13%).
11. DERIVATIVE FINANCIAL INSTRUMENTSDerivative financial assets 78 156 30 963
Direct investments in derivatives 78 156 4 695 Derivatives linked to investment contracts (refer note 19)
26 268
Derivative financial liabilities (78 115) (6 148) Net derivative financial instruments 41 24 815
Derivative financial assetsCurrent portion 78 156 26 937 Non-current portion 4 026
Derivative financial liabilitiesCurrent portion (78 115) (6 148) Non-current portion
41 24 815
Analysis of net derivative balance:
Equity/index contracts:Fixed-for-variable interest rate swap (refer note 37) (2 222) 4 026 Exchange traded 20 789 Contracts for difference 2 263
41 24 815
Trading derivatives are classified as current financial assets and liabilities valued at fair value through profit or loss.
Notes to the annual financial statementsfor the year ended 28 February 2010
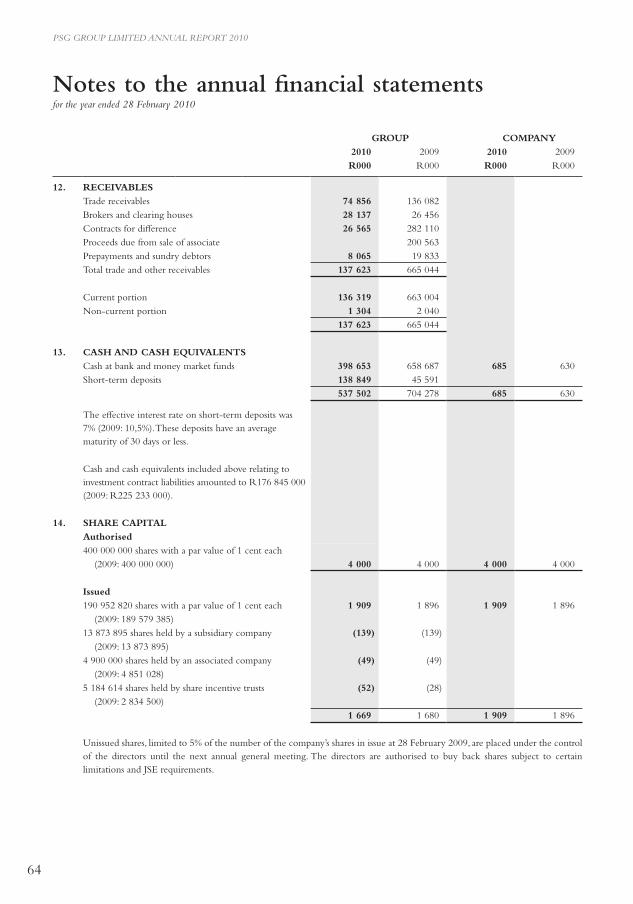
64
PSG GROUP LIMITED ANNUAL REPORT 2010
GROUP COMPANY2010 2009 2010 2009R000 R000 R000 R000
12. RECEIVABLESTrade receivables 74 856 136 082 Brokers and clearing houses 28 137 26 456 Contracts for difference 26 565 282 110 Proceeds due from sale of associate 200 563 Prepayments and sundry debtors 8 065 19 833 Total trade and other receivables 137 623 665 044
Current portion 136 319 663 004 Non-current portion 1 304 2 040
137 623 665 044
13. CASH AND CASH EQUIVALENTSCash at bank and money market funds 398 653 658 687 685 630 Short-term deposits 138 849 45 591
537 502 704 278 685 630
The effective interest rate on short-term deposits was 7% (2009: 10,5%). These deposits have an average maturity of 30 days or less.
Cash and cash equivalents included above relating to investment contract liabilities amounted to R176 845 000 (2009: R225 233 000).
14. SHARE CAPITALAuthorised400 000 000 shares with a par value of 1 cent each
(2009: 400 000 000) 4 000 4 000 4 000 4 000
Issued190 952 820 shares with a par value of 1 cent each 1 909 1 896 1 909 1 896
(2009: 189 579 385)13 873 895 shares held by a subsidiary company (139) (139)
(2009: 13 873 895)4 900 000 shares held by an associated company (49) (49)
(2009: 4 851 028)5 184 614 shares held by share incentive trusts (52) (28)
(2009: 2 834 500) 1 669 1 680 1 909 1 896
Unissued shares, limited to 5% of the number of the company’s shares in issue at 28 February 2009, are placed under the control of the directors until the next annual general meeting. The directors are authorised to buy back shares subject to certain limitations and JSE requirements.
Notes to the annual financial statementsfor the year ended 28 February 2010
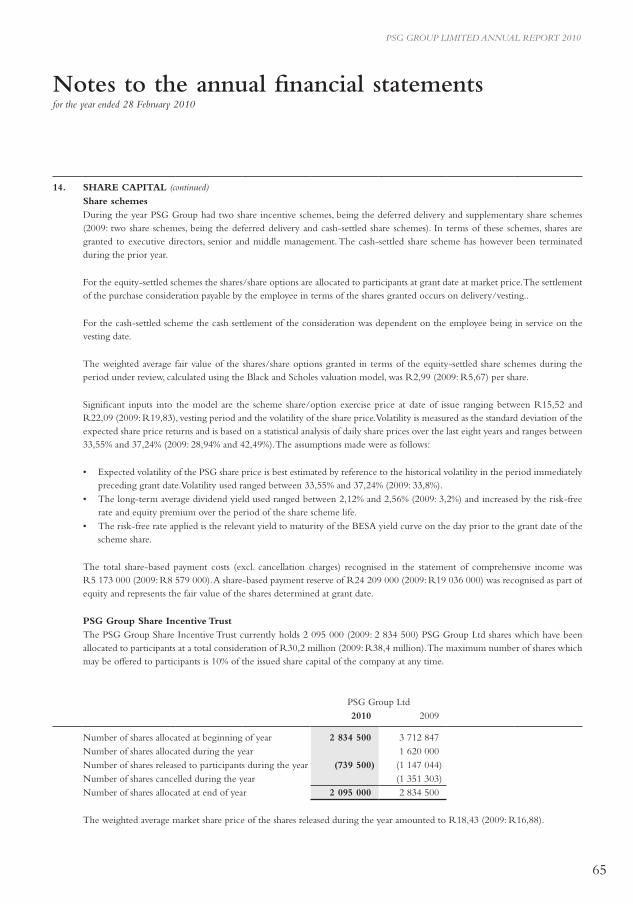
65
PSG GROUP LIMITED ANNUAL REPORT 2010
14. SHARE CAPITAL (continued)Share schemesDuring the year PSG Group had two share incentive schemes, being the deferred delivery and supplementary share schemes (2009: two share schemes, being the deferred delivery and cash-settled share schemes). In terms of these schemes, shares are granted to executive directors, senior and middle management. The cash-settled share scheme has however been terminated during the prior year.
For the equity-settled schemes the shares/share options are allocated to participants at grant date at market price. The settlement of the purchase consideration payable by the employee in terms of the shares granted occurs on delivery/vesting..
For the cash-settled scheme the cash settlement of the consideration was dependent on the employee being in service on the vesting date.
The weighted average fair value of the shares/share options granted in terms of the equity-settled share schemes during the period under review, calculated using the Black and Scholes valuation model, was R2,99 (2009: R5,67) per share.
Significant inputs into the model are the scheme share/option exercise price at date of issue ranging between R15,52 and R22,09 (2009: R19,83), vesting period and the volatility of the share price. Volatility is measured as the standard deviation of the expected share price returns and is based on a statistical analysis of daily share prices over the last eight years and ranges between 33,55% and 37,24% (2009: 28,94% and 42,49%). The assumptions made were as follows:
• Expected volatility of the PSG share price is best estimated by reference to the historical volatility in the period immediately preceding grant date. Volatility used ranged between 33,55% and 37,24% (2009: 33,8%).
• The long-term average dividend yield used ranged between 2,12% and 2,56% (2009: 3,2%) and increased by the risk-free rate and equity premium over the period of the share scheme life.
• The risk-free rate applied is the relevant yield to maturity of the BESA yield curve on the day prior to the grant date of the scheme share.
The total share-based payment costs (excl. cancellation charges) recognised in the statement of comprehensive income was R5 173 000 (2009: R8 579 000). A share-based payment reserve of R24 209 000 (2009: R19 036 000) was recognised as part of equity and represents the fair value of the shares determined at grant date.
PSG Group Share Incentive TrustThe PSG Group Share Incentive Trust currently holds 2 095 000 (2009: 2 834 500) PSG Group Ltd shares which have been allocated to participants at a total consideration of R30,2 million (2009: R38,4 million). The maximum number of shares which may be offered to participants is 10% of the issued share capital of the company at any time.
PSG Group Ltd 2010 2009
Number of shares allocated at beginning of year 2 834 500 3 712 847Number of shares allocated during the year 1 620 000Number of shares released to participants during the year (739 500) (1 147 044)Number of shares cancelled during the year (1 351 303)Number of shares allocated at end of year 2 095 000 2 834 500
The weighted average market share price of the shares released during the year amounted to R18,43 (2009: R16,88).
Notes to the annual financial statementsfor the year ended 28 February 2010
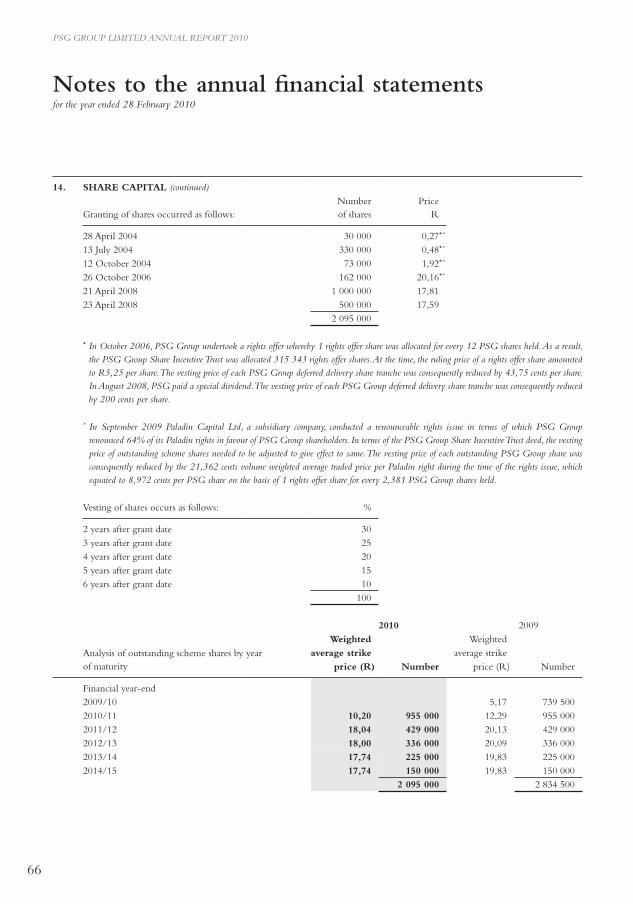
66
PSG GROUP LIMITED ANNUAL REPORT 2010
14. SHARE CAPITAL (continued)
Granting of shares occurred as follows: Number of shares
PriceR
28 April 2004 30 000 0,27*ˆ 13 July 2004 330 000 0,48*ˆ12 October 2004 73 000 1,92*ˆ26 October 2006 162 000 20,16*ˆ21 April 2008 1 000 000 17,8123 April 2008 500 000 17,59
2 095 000
* In October 2006, PSG Group undertook a rights offer whereby 1 rights offer share was allocated for every 12 PSG shares held. As a result, the PSG Group Share Incentive Trust was allocated 315 343 rights offer shares. At the time, the ruling price of a rights offer share amounted to R5,25 per share. The vesting price of each PSG Group deferred delivery share tranche was consequently reduced by 43,75 cents per share. In August 2008, PSG paid a special dividend. The vesting price of each PSG Group deferred delivery share tranche was consequently reduced by 200 cents per share.
ˆ In September 2009 Paladin Capital Ltd, a subsidiary company, conducted a renounceable rights issue in terms of which PSG Group renounced 64% of its Paladin rights in favour of PSG Group shareholders. In terms of the PSG Group Share Incentive Trust deed, the vesting price of outstanding scheme shares needed to be adjusted to give effect to same. The vesting price of each outstanding PSG Group share was consequently reduced by the 21,362 cents volume weighted average traded price per Paladin right during the time of the rights issue, which equated to 8,972 cents per PSG share on the basis of 1 rights offer share for every 2,381 PSG Group shares held.
Vesting of shares occurs as follows: %
2 years after grant date 30 3 years after grant date 25 4 years after grant date 20 5 years after grant date 15 6 years after grant date 10
100
2010 2009Weighted Weighted
Analysis of outstanding scheme shares by year of maturity
average strike average strikeprice (R) Number price (R) Number
Financial year-end2009/10 5,17 739 500 2010/11 10,20 955 000 12,29 955 000 2011/12 18,04 429 000 20,13 429 000 2012/13 18,00 336 000 20,09 336 000 2013/14 17,74 225 000 19,83 225 000 2014/15 17,74 150 000 19,83 150 000
2 095 000 2 834 500
Notes to the annual financial statementsfor the year ended 28 February 2010
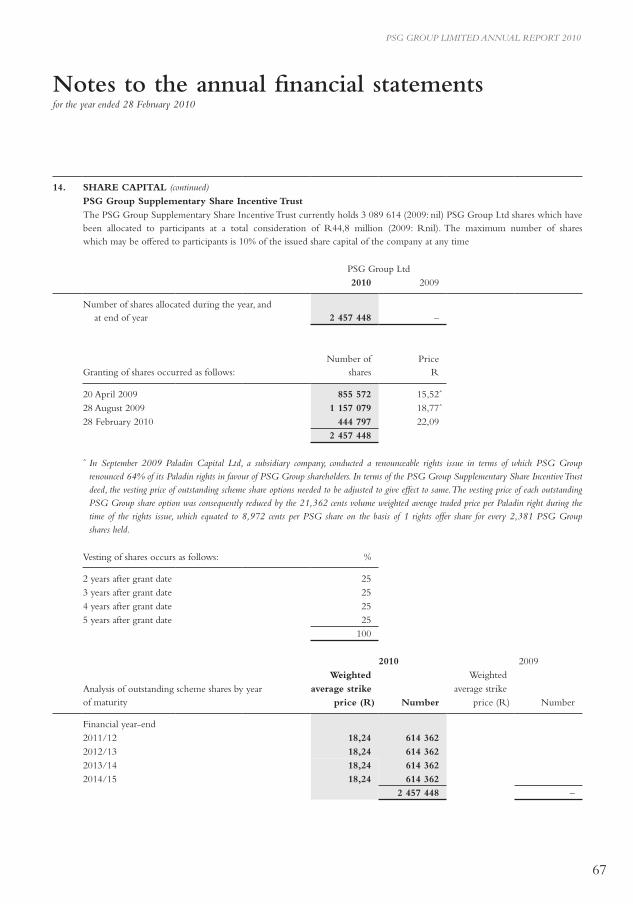
67
PSG GROUP LIMITED ANNUAL REPORT 2010
14. SHARE CAPITAL (continued)PSG Group Supplementary Share Incentive TrustThe PSG Group Supplementary Share Incentive Trust currently holds 3 089 614 (2009: nil) PSG Group Ltd shares which have been allocated to participants at a total consideration of R44,8 million (2009: Rnil). The maximum number of shares which may be offered to participants is 10% of the issued share capital of the company at any time
PSG Group Ltd 2010 2009
Number of shares allocated during the year, and at end of year 2 457 448 –
Granting of shares occurred as follows:Number of
shares Price
R
20 April 2009 855 572 15,52ˆ28 August 2009 1 157 079 18,77ˆ28 February 2010 444 797 22,09
2 457 448
ˆ In September 2009 Paladin Capital Ltd, a subsidiary company, conducted a renounceable rights issue in terms of which PSG Group renounced 64% of its Paladin rights in favour of PSG Group shareholders. In terms of the PSG Group Supplementary Share Incentive Trust deed, the vesting price of outstanding scheme share options needed to be adjusted to give effect to same. The vesting price of each outstanding PSG Group share option was consequently reduced by the 21,362 cents volume weighted average traded price per Paladin right during the time of the rights issue, which equated to 8,972 cents per PSG share on the basis of 1 rights offer share for every 2,381 PSG Group shares held.
Vesting of shares occurs as follows: %
2 years after grant date 25 3 years after grant date 25 4 years after grant date 25 5 years after grant date 25
100
2010 2009Weighted Weighted
Analysis of outstanding scheme shares by year of maturity
average strike average strikeprice (R) Number price (R) Number
Financial year-end2011/12 18,24 614 362 2012/13 18,24 614 362 2013/14 18,24 614 362 2014/15 18,24 614 362
2 457 448 –
Notes to the annual financial statementsfor the year ended 28 February 2010
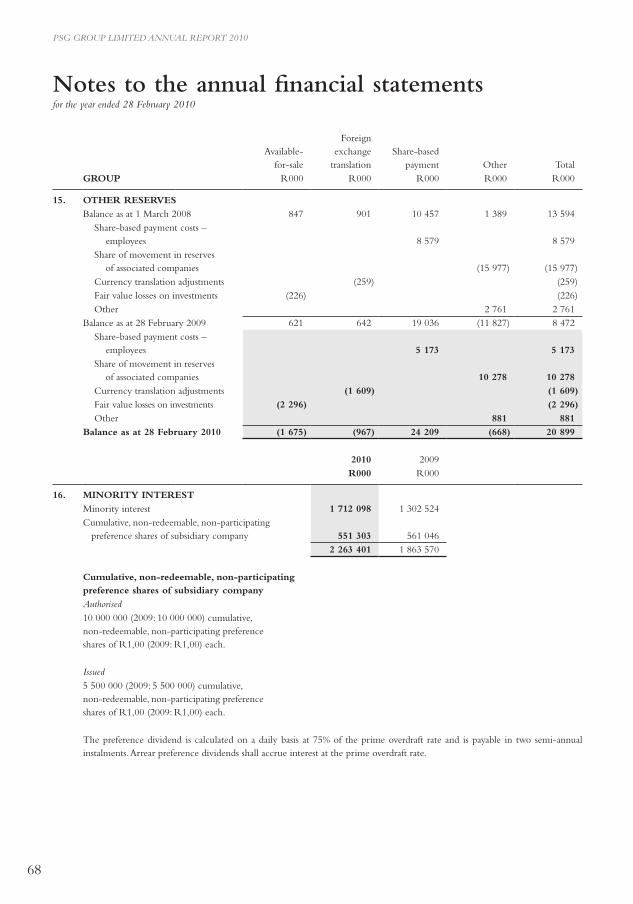
68
PSG GROUP LIMITED ANNUAL REPORT 2010
Available-for-sale
Foreign exchange
translationShare-based
payment Other TotalGROUP R000 R000 R000 R000 R000
15. OTHER RESERVESBalance as at 1 March 2008 847 901 10 457 1 389 13 594
Share-based payment costs – employees 8 579 8 579
Share of movement in reserves of associated companies (15 977) (15 977)
Currency translation adjustments (259) (259)Fair value losses on investments (226) (226)Other 2 761 2 761
Balance as at 28 February 2009 621 642 19 036 (11 827) 8 472 Share-based payment costs –
employees 5 173 5 173 Share of movement in reserves
of associated companies 10 278 10 278 Currency translation adjustments (1 609) (1 609)Fair value losses on investments (2 296) (2 296)Other 881 881
Balance as at 28 February 2010 (1 675) (967) 24 209 (668) 20 899
2010 2009R000 R000
16. MINORITY INTERESTMinority interest 1 712 098 1 302 524 Cumulative, non-redeemable, non-participating preference shares of subsidiary company 551 303 561 046
2 263 401 1 863 570
Cumulative, non-redeemable, non-participating preference shares of subsidiary companyAuthorised10 000 000 (2009: 10 000 000) cumulative, non-redeemable, non-participating preference shares of R1,00 (2009: R1,00) each.
Issued5 500 000 (2009: 5 500 000) cumulative, non-redeemable, non-participating preference shares of R1,00 (2009: R1,00) each.
The preference dividend is calculated on a daily basis at 75% of the prime overdraft rate and is payable in two semi-annual instalments. Arrear preference dividends shall accrue interest at the prime overdraft rate.
Notes to the annual financial statementsfor the year ended 28 February 2010
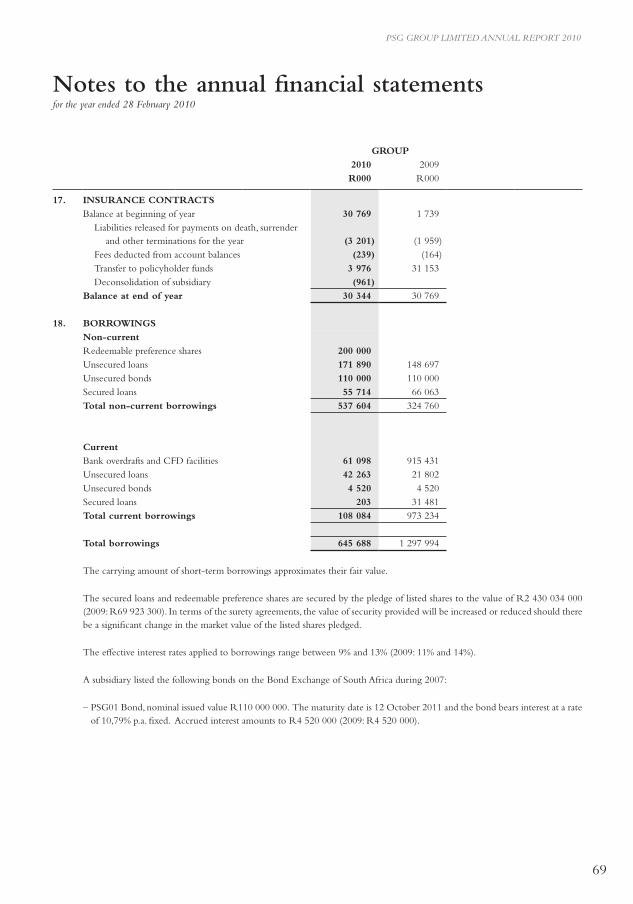
69
PSG GROUP LIMITED ANNUAL REPORT 2010
GROUP2010 2009R000 R000
17. INSURANCE CONTRACTSBalance at beginning of year 30 769 1 739
Liabilities released for payments on death, surrender and other terminations for the year (3 201) (1 959)
Fees deducted from account balances (239) (164) Transfer to policyholder funds 3 976 31 153 Deconsolidation of subsidiary (961)
Balance at end of year 30 344 30 769
18. BORROWINGSNon-currentRedeemable preference shares 200 000 Unsecured loans 171 890 148 697Unsecured bonds 110 000 110 000 Secured loans 55 714 66 063 Total non-current borrowings 537 604 324 760
CurrentBank overdrafts and CFD facilities 61 098 915 431 Unsecured loans 42 263 21 802 Unsecured bonds 4 520 4 520Secured loans 203 31 481 Total current borrowings 108 084 973 234
Total borrowings 645 688 1 297 994
The carrying amount of short-term borrowings approximates their fair value.
The secured loans and redeemable preference shares are secured by the pledge of listed shares to the value of R2 430 034 000 (2009: R69 923 300). In terms of the surety agreements, the value of security provided will be increased or reduced should there be a significant change in the market value of the listed shares pledged.
The effective interest rates applied to borrowings range between 9% and 13% (2009: 11% and 14%).
A subsidiary listed the following bonds on the Bond Exchange of South Africa during 2007:
– PSG01 Bond, nominal issued value R110 000 000. The maturity date is 12 October 2011 and the bond bears interest at a rate of 10,79% p.a. fixed. Accrued interest amounts to R4 520 000 (2009: R4 520 000).
Notes to the annual financial statementsfor the year ended 28 February 2010
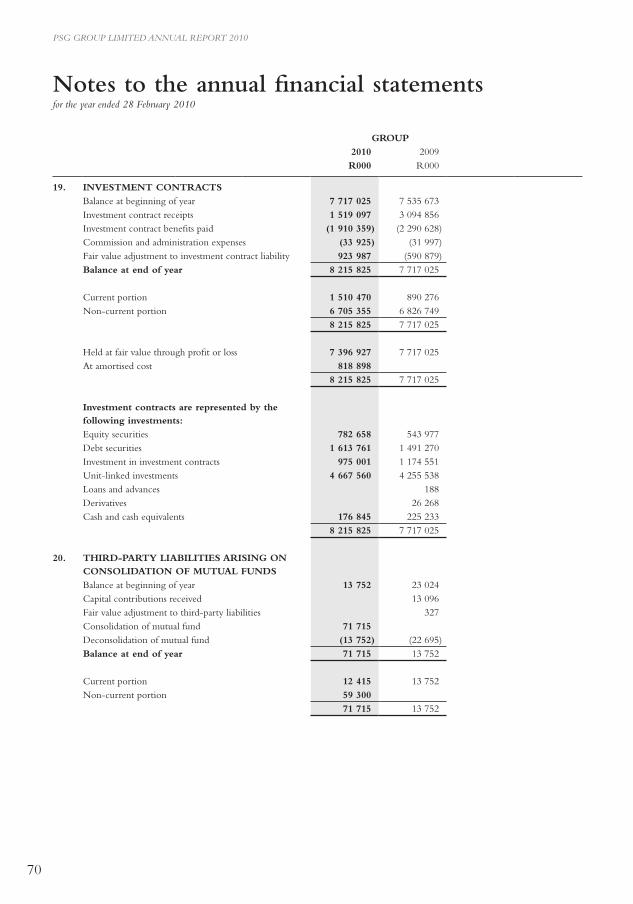
70
PSG GROUP LIMITED ANNUAL REPORT 2010
GROUP2010 2009R000 R000
19. INVESTMENT CONTRACTSBalance at beginning of year 7 717 025 7 535 673 Investment contract receipts 1 519 097 3 094 856 Investment contract benefits paid (1 910 359) (2 290 628) Commission and administration expenses (33 925) (31 997) Fair value adjustment to investment contract liability 923 987 (590 879) Balance at end of year 8 215 825 7 717 025
Current portion 1 510 470 890 276Non-current portion 6 705 355 6 826 749
8 215 825 7 717 025
Held at fair value through profit or loss 7 396 927 7 717 025 At amortised cost 818 898
8 215 825 7 717 025
Investment contracts are represented by the following investments:Equity securities 782 658 543 977Debt securities 1 613 761 1 491 270 Investment in investment contracts 975 001 1 174 551 Unit-linked investments 4 667 560 4 255 538 Loans and advances 188 Derivatives 26 268 Cash and cash equivalents 176 845 225 233
8 215 825 7 717 025
20. THIRD-PARTY LIABILITIES ARISING ON CONSOLIDATION OF MUTUAL FUNDSBalance at beginning of year 13 752 23 024 Capital contributions received 13 096 Fair value adjustment to third-party liabilities 327 Consolidation of mutual fund 71 715 Deconsolidation of mutual fund (13 752) (22 695) Balance at end of year 71 715 13 752
Current portion 12 415 13 752 Non-current portion 59 300
71 715 13 752
Notes to the annual financial statementsfor the year ended 28 February 2010
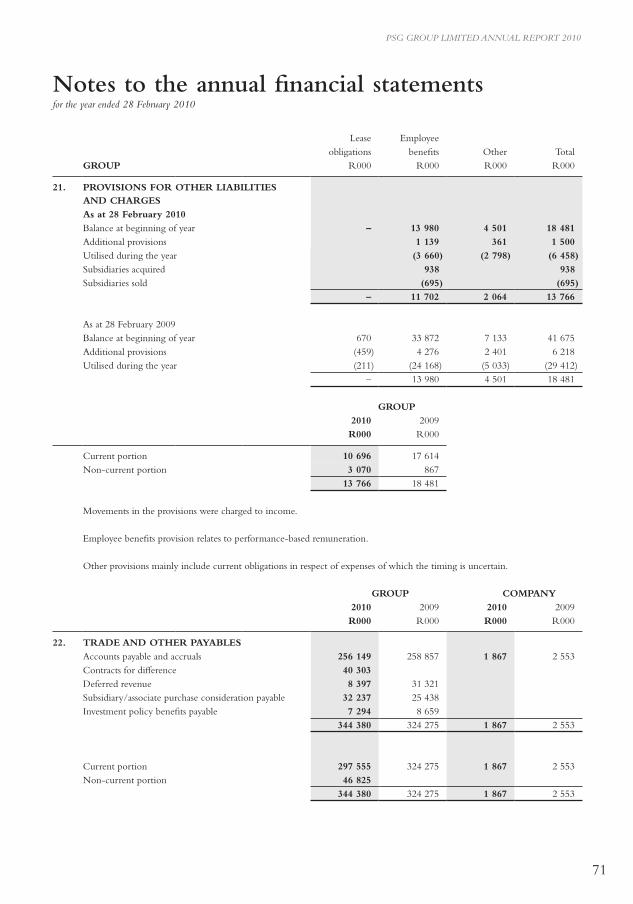
71
PSG GROUP LIMITED ANNUAL REPORT 2010
Lease Employee obligations benefits Other Total
GROUP R000 R000 R000 R000
21. PROVISIONS FOR OTHER LIABILITIES AND CHARGESAs at 28 February 2010Balance at beginning of year – 13 980 4 501 18 481 Additional provisions 1 139 361 1 500 Utilised during the year (3 660) (2 798) (6 458)Subsidiaries acquired 938 938 Subsidiaries sold (695) (695)
– 11 702 2 064 13 766
As at 28 February 2009Balance at beginning of year 670 33 872 7 133 41 675 Additional provisions (459) 4 276 2 401 6 218 Utilised during the year (211) (24 168) (5 033) (29 412)
– 13 980 4 501 18 481
GROUP2010 2009R000 R000
Current portion 10 696 17 614 Non-current portion 3 070 867
13 766 18 481
Movements in the provisions were charged to income.
Employee benefits provision relates to performance-based remuneration.
Other provisions mainly include current obligations in respect of expenses of which the timing is uncertain.
GROUP COMPANY2010 2009 2010 2009R000 R000 R000 R000
22. TRADE AND OTHER PAYABLESAccounts payable and accruals 256 149 258 857 1 867 2 553 Contracts for difference 40 303 Deferred revenue 8 397 31 321 Subsidiary/associate purchase consideration payable 32 237 25 438 Investment policy benefits payable 7 294 8 659
344 380 324 275 1 867 2 553
Current portion 297 555 324 275 1 867 2 553 Non-current portion 46 825
344 380 324 275 1 867 2 553
Notes to the annual financial statementsfor the year ended 28 February 2010
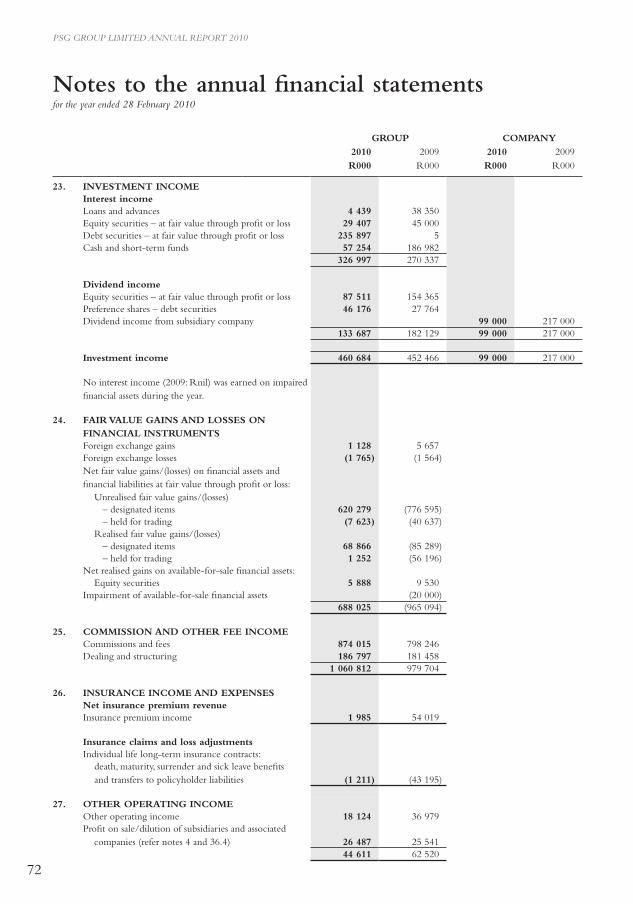
72
PSG GROUP LIMITED ANNUAL REPORT 2010
GROUP COMPANY2010 2009 2010 2009R000 R000 R000 R000
23. INVESTMENT INCOMEInterest incomeLoans and advances 4 439 38 350 Equity securities – at fair value through profit or loss 29 407 45 000 Debt securities – at fair value through profit or loss 235 897 5 Cash and short-term funds 57 254 186 982
326 997 270 337
Dividend incomeEquity securities – at fair value through profit or loss 87 511 154 365 Preference shares – debt securities 46 176 27 764 Dividend income from subsidiary company 99 000 217 000
133 687 182 129 99 000 217 000
Investment income 460 684 452 466 99 000 217 000
No interest income (2009: Rnil) was earned on impaired financial assets during the year.
24. FAIR VALUE GAINS AND LOSSES ON FINANCIAL INSTRUMENTSForeign exchange gains 1 128 5 657 Foreign exchange losses (1 765) (1 564) Net fair value gains/(losses) on financial assets and financial liabilities at fair value through profit or loss:
Unrealised fair value gains/(losses) – designated items 620 279 (776 595) – held for trading (7 623) (40 637)Realised fair value gains/(losses) – designated items 68 866 (85 289) – held for trading 1 252 (56 196)
Net realised gains on available-for-sale financial assets:Equity securities 5 888 9 530
Impairment of available-for-sale financial assets (20 000) 688 025 (965 094)
25. COMMISSION AND OTHER FEE INCOMECommissions and fees 874 015 798 246 Dealing and structuring 186 797 181 458
1 060 812 979 704
26. INSURANCE INCOME AND ExPENSESNet insurance premium revenueInsurance premium income 1 985 54 019
Insurance claims and loss adjustmentsIndividual life long-term insurance contracts:
death, maturity, surrender and sick leave benefits and transfers to policyholder liabilities (1 211) (43 195)
27. OTHER OPERATING INCOMEOther operating income 18 124 36 979 Profit on sale/dilution of subsidiaries and associated companies (refer notes 4 and 36.4) 26 487 25 541
44 611 62 520
Notes to the annual financial statementsfor the year ended 28 February 2010
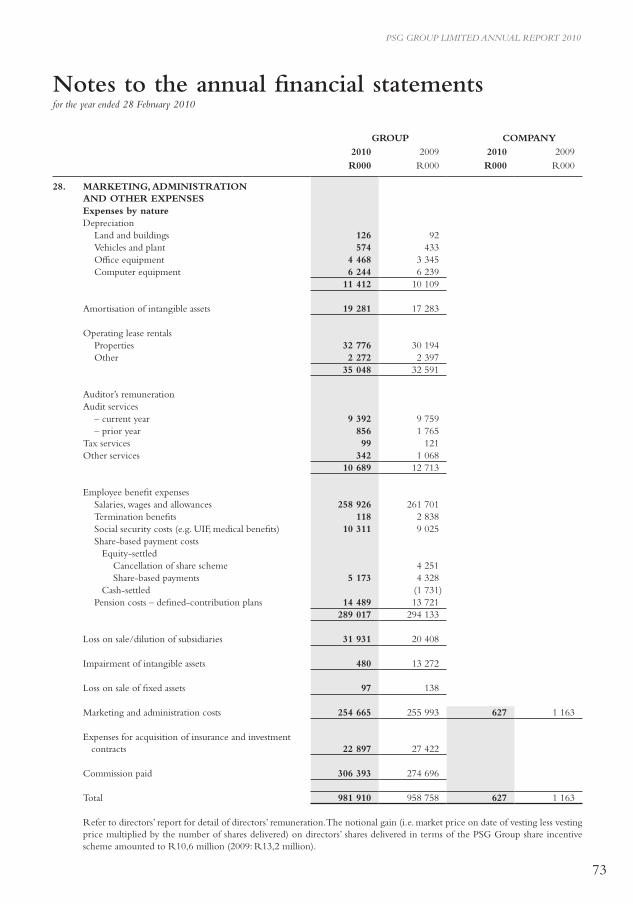
73
PSG GROUP LIMITED ANNUAL REPORT 2010
GROUP COMPANY2010 2009 2010 2009R000 R000 R000 R000
28. MARKETING, ADMINISTRATION AND OTHER ExPENSESExpenses by natureDepreciation
Land and buildings 126 92 Vehicles and plant 574 433 Office equipment 4 468 3 345 Computer equipment 6 244 6 239
11 412 10 109
Amortisation of intangible assets 19 281 17 283
Operating lease rentalsProperties 32 776 30 194 Other 2 272 2 397
35 048 32 591
Auditor’s remunerationAudit services
– current year 9 392 9 759 – prior year 856 1 765
Tax services 99 121 Other services 342 1 068
10 689 12 713
Employee benefit expensesSalaries, wages and allowances 258 926 261 701 Termination benefits 118 2 838 Social security costs (e.g. UIF, medical benefits) 10 311 9 025 Share-based payment costs
Equity-settledCancellation of share scheme 4 251 Share-based payments 5 173 4 328
Cash-settled (1 731) Pension costs – defined-contribution plans 14 489 13 721
289 017 294 133
Loss on sale/dilution of subsidiaries 31 931 20 408
Impairment of intangible assets 480 13 272
Loss on sale of fixed assets 97 138
Marketing and administration costs 254 665 255 993 627 1 163
Expenses for acquisition of insurance and investment contracts 22 897 27 422
Commission paid 306 393 274 696
Total 981 910 958 758 627 1 163
Refer to directors’ report for detail of directors’ remuneration. The notional gain (i.e. market price on date of vesting less vesting price multiplied by the number of shares delivered) on directors’ shares delivered in terms of the PSG Group share incentive scheme amounted to R10,6 million (2009: R13,2 million).
Notes to the annual financial statementsfor the year ended 28 February 2010
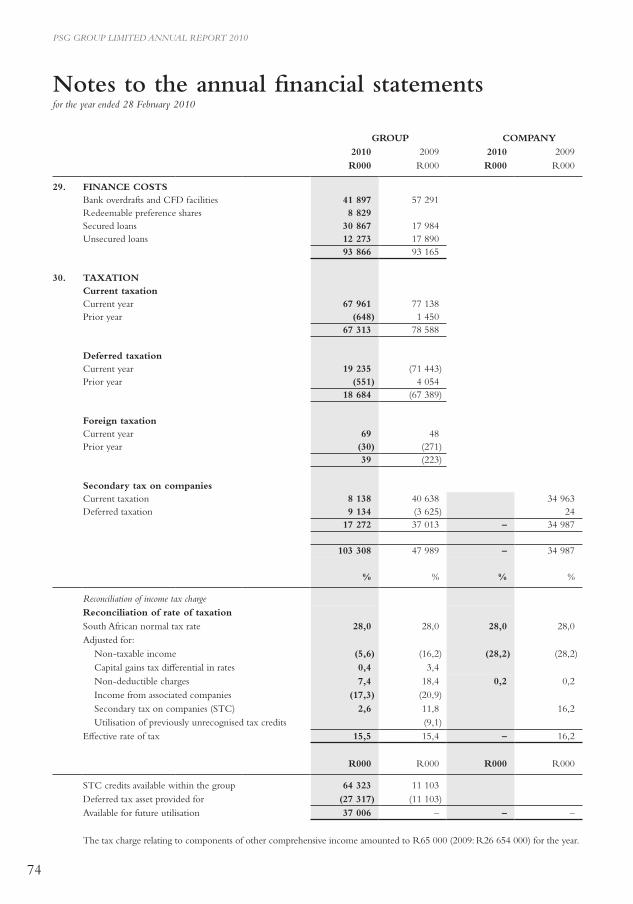
74
PSG GROUP LIMITED ANNUAL REPORT 2010
GROUP COMPANY2010 2009 2010 2009R000 R000 R000 R000
29. FINANCE COSTSBank overdrafts and CFD facilities 41 897 57 291 Redeemable preference shares 8 829 Secured loans 30 867 17 984 Unsecured loans 12 273 17 890
93 866 93 165
30. TAxATIONCurrent taxationCurrent year 67 961 77 138 Prior year (648) 1 450
67 313 78 588
Deferred taxationCurrent year 19 235 (71 443) Prior year (551) 4 054
18 684 (67 389)
Foreign taxationCurrent year 69 48 Prior year (30) (271)
39 (223)
Secondary tax on companiesCurrent taxation 8 138 40 638 34 963 Deferred taxation 9 134 (3 625) 24
17 272 37 013 – 34 987
103 308 47 989 – 34 987
% % % %
Reconciliation of income tax chargeReconciliation of rate of taxationSouth African normal tax rate 28,0 28,0 28,0 28,0 Adjusted for:
Non-taxable income (5,6) (16,2) (28,2) (28,2) Capital gains tax differential in rates 0,4 3,4 Non-deductible charges 7,4 18,4 0,2 0,2 Income from associated companies (17,3) (20,9) Secondary tax on companies (STC) 2,6 11,8 16,2 Utilisation of previously unrecognised tax credits (9,1)
Effective rate of tax 15,5 15,4 – 16,2
R000 R000 R000 R000
STC credits available within the group 64 323 11 103 Deferred tax asset provided for (27 317) (11 103) Available for future utilisation 37 006 – – –
The tax charge relating to components of other comprehensive income amounted to R65 000 (2009: R26 654 000) for the year.
Notes to the annual financial statementsfor the year ended 28 February 2010
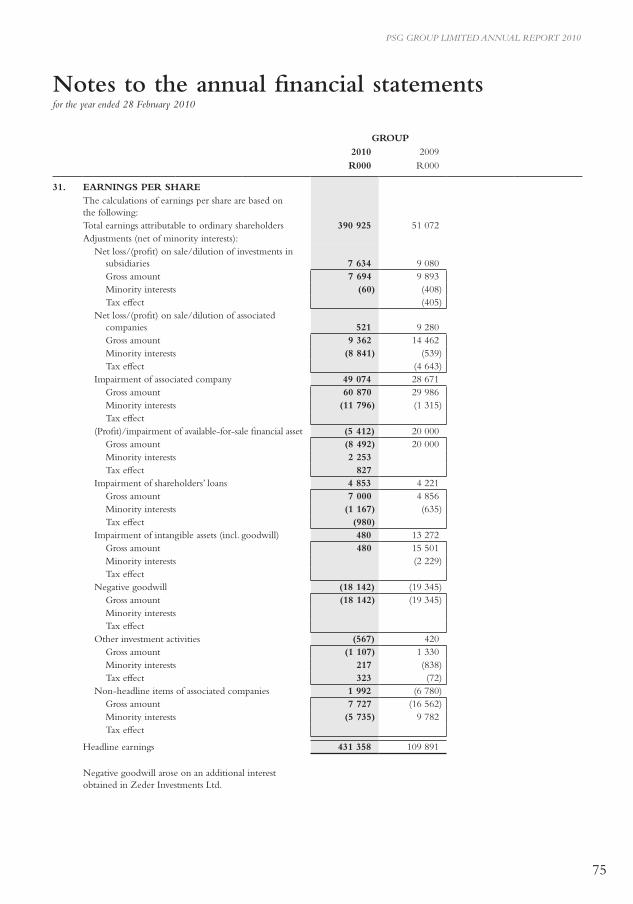
75
PSG GROUP LIMITED ANNUAL REPORT 2010
GROUP2010 2009R000 R000
31. EARNINGS PER SHAREThe calculations of earnings per share are based on the following:Total earnings attributable to ordinary shareholders 390 925 51 072 Adjustments (net of minority interests):
Net loss/(profit) on sale/dilution of investments in subsidiaries 7 634
9 080
Gross amount 7 694 9 893 Minority interests (60) (408)Tax effect (405)
Net loss/(profit) on sale/dilution of associated companies 521
9 280
Gross amount 9 362 14 462Minority interests (8 841) (539)Tax effect (4 643)
Impairment of associated company 49 074 28 671 Gross amount 60 870 29 986Minority interests (11 796) (1 315)Tax effect
(Profit)/impairment of available-for-sale financial asset (5 412) 20 000 Gross amount (8 492) 20 000 Minority interests 2 253Tax effect 827
Impairment of shareholders’ loans 4 853 4 221 Gross amount 7 000 4 856 Minority interests (1 167) (635)Tax effect (980)
Impairment of intangible assets (incl. goodwill) 480 13 272Gross amount 480 15 501Minority interests (2 229)Tax effect
Negative goodwill (18 142) (19 345)Gross amount (18 142) (19 345)Minority interestsTax effect
Other investment activities (567) 420 Gross amount (1 107) 1 330Minority interests 217 (838)Tax effect 323 (72)
Non-headline items of associated companies 1 992 (6 780)Gross amount 7 727 (16 562)Minority interests (5 735) 9 782Tax effect
Headline earnings 431 358 109 891
Negative goodwill arose on an additional interest obtained in Zeder Investments Ltd.
Notes to the annual financial statementsfor the year ended 28 February 2010
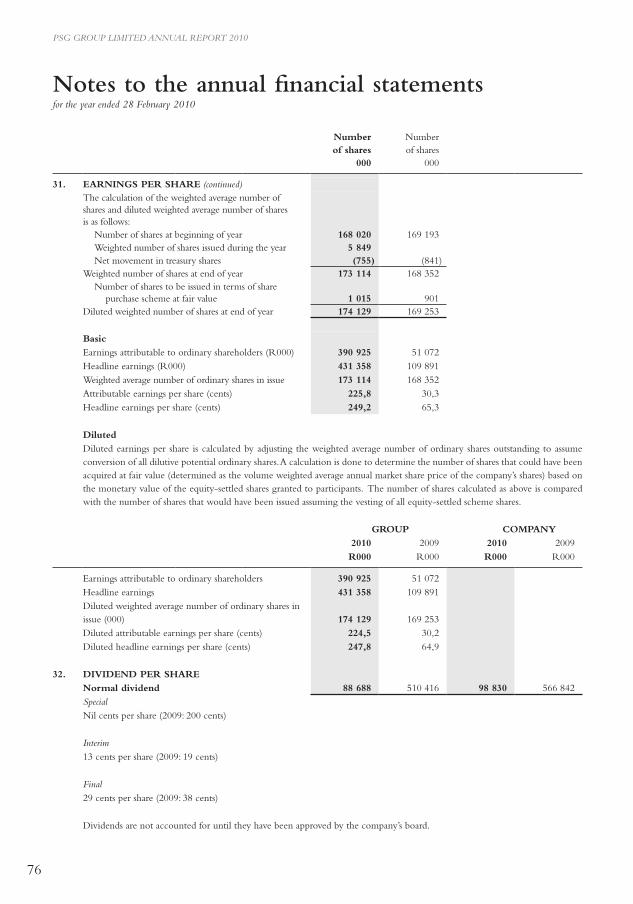
76
PSG GROUP LIMITED ANNUAL REPORT 2010
Number Numberof shares of shares
000 000
31. EARNINGS PER SHARE (continued)The calculation of the weighted average number of shares and diluted weighted average number of shares is as follows:
Number of shares at beginning of year 168 020 169 193 Weighted number of shares issued during the year 5 849Net movement in treasury shares (755) (841)
Weighted number of shares at end of year 173 114 168 352 Number of shares to be issued in terms of share
purchase scheme at fair value 1 015 901 Diluted weighted number of shares at end of year 174 129 169 253
BasicEarnings attributable to ordinary shareholders (R000) 390 925 51 072 Headline earnings (R000) 431 358 109 891 Weighted average number of ordinary shares in issue 173 114 168 352 Attributable earnings per share (cents) 225,8 30,3 Headline earnings per share (cents) 249,2 65,3
DilutedDiluted earnings per share is calculated by adjusting the weighted average number of ordinary shares outstanding to assume conversion of all dilutive potential ordinary shares. A calculation is done to determine the number of shares that could have been acquired at fair value (determined as the volume weighted average annual market share price of the company’s shares) based on the monetary value of the equity-settled shares granted to participants. The number of shares calculated as above is compared with the number of shares that would have been issued assuming the vesting of all equity-settled scheme shares.
GROUP COMPANY2010 2009 2010 2009R000 R000 R000 R000
Earnings attributable to ordinary shareholders 390 925 51 072 Headline earnings 431 358 109 891 Diluted weighted average number of ordinary shares in issue (000) 174 129 169 253 Diluted attributable earnings per share (cents) 224,5 30,2 Diluted headline earnings per share (cents) 247,8 64,9
32. DIVIDEND PER SHARENormal dividend 88 688 510 416 98 830 566 842 SpecialNil cents per share (2009: 200 cents)
Interim13 cents per share (2009: 19 cents)
Final29 cents per share (2009: 38 cents)
Dividends are not accounted for until they have been approved by the company’s board.
Notes to the annual financial statementsfor the year ended 28 February 2010
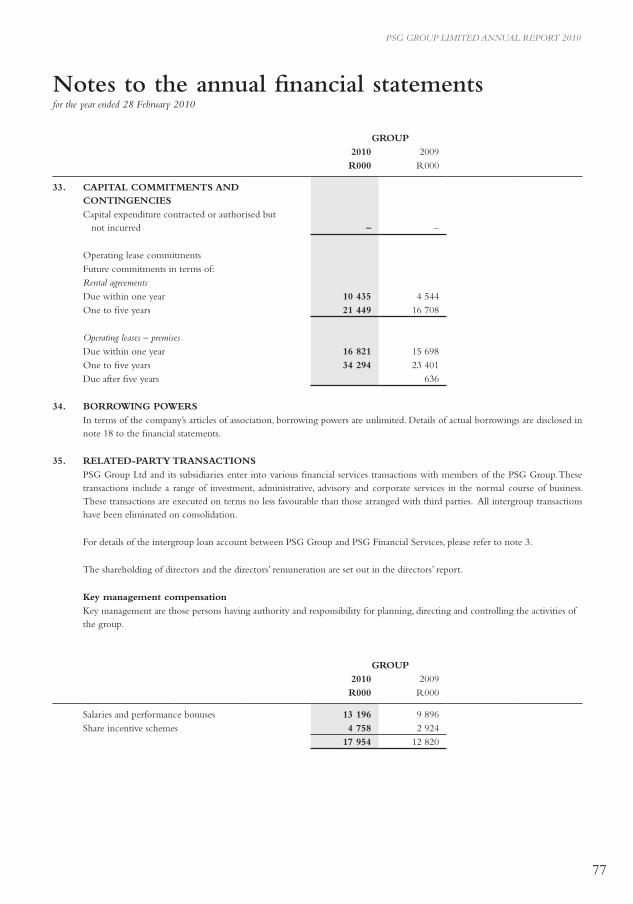
77
PSG GROUP LIMITED ANNUAL REPORT 2010
GROUP2010 2009R000 R000
33. CAPITAL COMMITMENTS AND CONTINGENCIESCapital expenditure contracted or authorised but not incurred – –
Operating lease commitmentsFuture commitments in terms of:Rental agreementsDue within one year 10 435 4 544 One to five years 21 449 16 708
Operating leases – premisesDue within one year 16 821 15 698 One to five years 34 294 23 401 Due after five years 636
34. BORROWING POWERSIn terms of the company’s articles of association, borrowing powers are unlimited. Details of actual borrowings are disclosed in note 18 to the financial statements.
35. RELATED-PARTY TRANSACTIONSPSG Group Ltd and its subsidiaries enter into various financial services transactions with members of the PSG Group. These transactions include a range of investment, administrative, advisory and corporate services in the normal course of business. These transactions are executed on terms no less favourable than those arranged with third parties. All intergroup transactions have been eliminated on consolidation.
For details of the intergroup loan account between PSG Group and PSG Financial Services, please refer to note 3.
The shareholding of directors and the directors’ remuneration are set out in the directors’ report.
Key management compensationKey management are those persons having authority and responsibility for planning, directing and controlling the activities of the group.
GROUP2010 2009R000 R000
Salaries and performance bonuses 13 196 9 896 Share incentive schemes 4 758 2 924
17 954 12 820
Notes to the annual financial statementsfor the year ended 28 February 2010
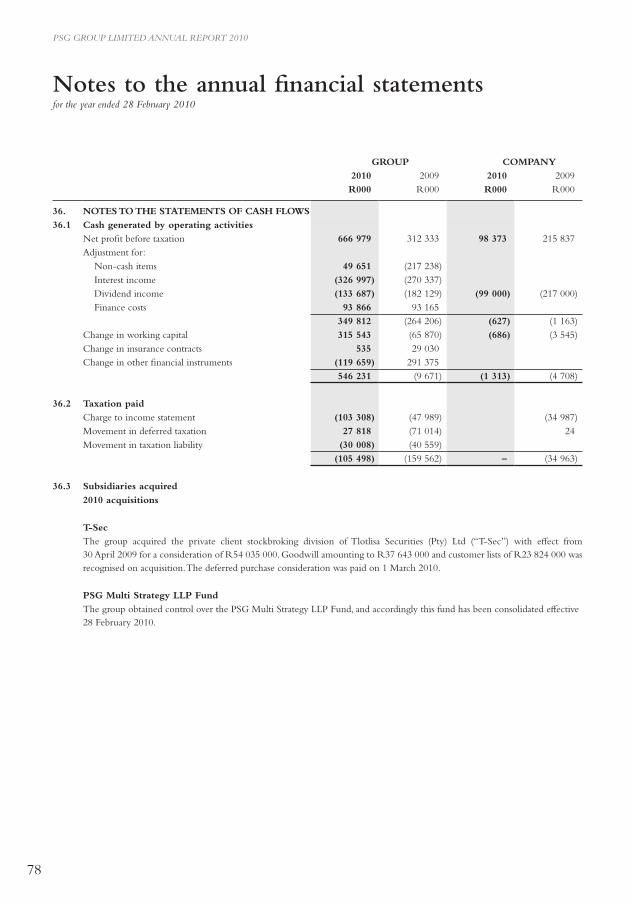
78
PSG GROUP LIMITED ANNUAL REPORT 2010
GROUP COMPANY2010 2009 2010 2009R000 R000 R000 R000
36. NOTES TO THE STATEMENTS OF CASH FLOWS36.1 Cash generated by operating activities
Net profit before taxation 666 979 312 333 98 373 215 837 Adjustment for:
Non-cash items 49 651 (217 238)Interest income (326 997) (270 337)Dividend income (133 687) (182 129) (99 000) (217 000)Finance costs 93 866 93 165
349 812 (264 206) (627) (1 163)Change in working capital 315 543 (65 870) (686) (3 545)Change in insurance contracts 535 29 030 Change in other financial instruments (119 659) 291 375
546 231 (9 671) (1 313) (4 708)
36.2 Taxation paidCharge to income statement (103 308) (47 989) (34 987)Movement in deferred taxation 27 818 (71 014) 24 Movement in taxation liability (30 008) (40 559)
(105 498) (159 562) – (34 963)
36.3 Subsidiaries acquired
2010 acquisitions
T-SecThe group acquired the private client stockbroking division of Tlotlisa Securities (Pty) Ltd (“T-Sec”) with effect from 30 April 2009 for a consideration of R54 035 000. Goodwill amounting to R37 643 000 and customer lists of R23 824 000 was recognised on acquisition. The deferred purchase consideration was paid on 1 March 2010.
PSG Multi Strategy LLP FundThe group obtained control over the PSG Multi Strategy LLP Fund, and accordingly this fund has been consolidated effective 28 February 2010.
Notes to the annual financial statementsfor the year ended 28 February 2010
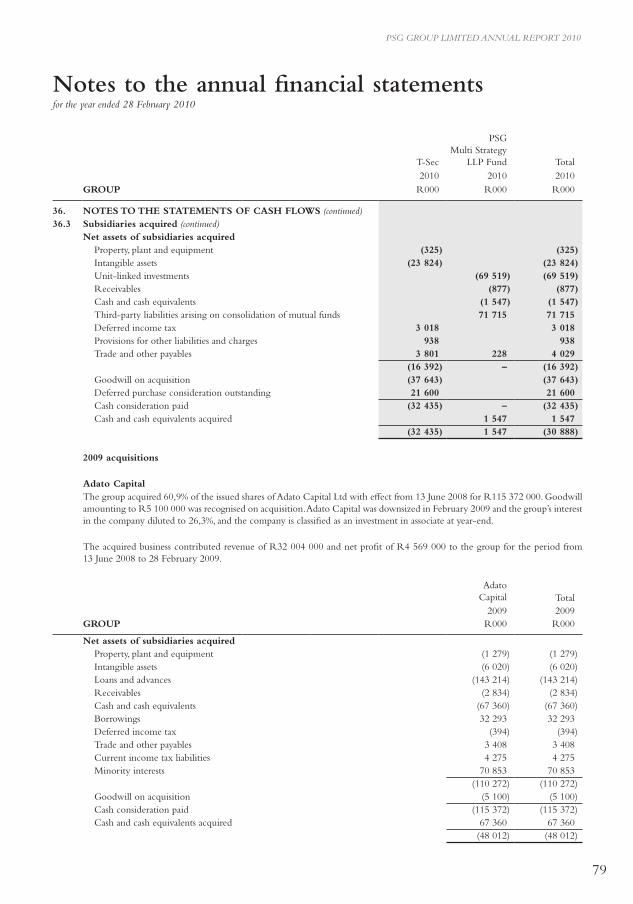
79
PSG GROUP LIMITED ANNUAL REPORT 2010
T-Sec
PSGMulti Strategy
LLP Fund Total 2010 2010 2010
GROUP R000 R000 R000
36. NOTES TO THE STATEMENTS OF CASH FLOWS (continued)36.3 Subsidiaries acquired (continued)
Net assets of subsidiaries acquiredProperty, plant and equipment (325) (325)Intangible assets (23 824) (23 824)Unit-linked investments (69 519) (69 519)Receivables (877) (877)Cash and cash equivalents (1 547) (1 547)Third-party liabilities arising on consolidation of mutual funds 71 715 71 715 Deferred income tax 3 018 3 018 Provisions for other liabilities and charges 938 938 Trade and other payables 3 801 228 4 029
(16 392) – (16 392)Goodwill on acquisition (37 643) (37 643)Deferred purchase consideration outstanding 21 600 21 600 Cash consideration paid (32 435) – (32 435)Cash and cash equivalents acquired 1 547 1 547
(32 435) 1 547 (30 888)
2009 acquisitions
Adato CapitalThe group acquired 60,9% of the issued shares of Adato Capital Ltd with effect from 13 June 2008 for R115 372 000. Goodwill amounting to R5 100 000 was recognised on acquisition. Adato Capital was downsized in February 2009 and the group’s interest in the company diluted to 26,3%, and the company is classified as an investment in associate at year-end.
The acquired business contributed revenue of R32 004 000 and net profit of R4 569 000 to the group for the period from 13 June 2008 to 28 February 2009.
Adato Capital Total
2009 2009GROUP R000 R000
Net assets of subsidiaries acquiredProperty, plant and equipment (1 279) (1 279)Intangible assets (6 020) (6 020)Loans and advances (143 214) (143 214)Receivables (2 834) (2 834)Cash and cash equivalents (67 360) (67 360)Borrowings 32 293 32 293 Deferred income tax (394) (394)Trade and other payables 3 408 3 408 Current income tax liabilities 4 275 4 275 Minority interests 70 853 70 853
(110 272) (110 272)Goodwill on acquisition (5 100) (5 100)Cash consideration paid (115 372) (115 372)Cash and cash equivalents acquired 67 360 67 360
(48 012) (48 012)
Notes to the annual financial statementsfor the year ended 28 February 2010
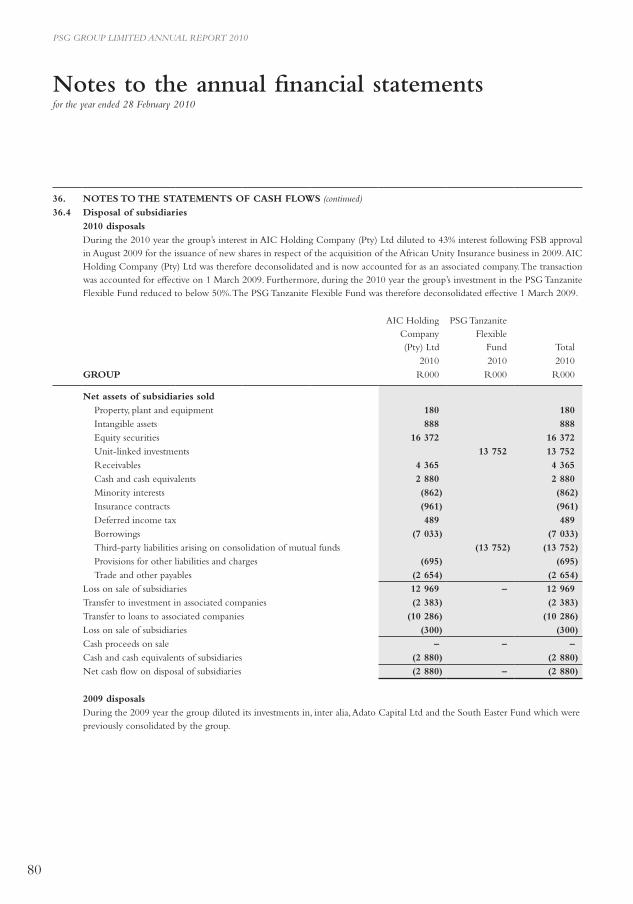
80
PSG GROUP LIMITED ANNUAL REPORT 2010
36. NOTES TO THE STATEMENTS OF CASH FLOWS (continued)36.4 Disposal of subsidiaries
2010 disposalsDuring the 2010 year the group’s interest in AIC Holding Company (Pty) Ltd diluted to 43% interest following FSB approval in August 2009 for the issuance of new shares in respect of the acquisition of the African Unity Insurance business in 2009. AIC Holding Company (Pty) Ltd was therefore deconsolidated and is now accounted for as an associated company. The transaction was accounted for effective on 1 March 2009. Furthermore, during the 2010 year the group’s investment in the PSG Tanzanite Flexible Fund reduced to below 50%. The PSG Tanzanite Flexible Fund was therefore deconsolidated effective 1 March 2009.
AIC Holding Company
(Pty) Ltd
PSG Tanzanite Flexible
Fund Total2010 2010 2010
GROUP R000 R000 R000
Net assets of subsidiaries soldProperty, plant and equipment 180 180 Intangible assets 888 888 Equity securities 16 372 16 372 Unit-linked investments 13 752 13 752 Receivables 4 365 4 365 Cash and cash equivalents 2 880 2 880 Minority interests (862) (862)Insurance contracts (961) (961)Deferred income tax 489 489 Borrowings (7 033) (7 033)Third-party liabilities arising on consolidation of mutual funds (13 752) (13 752)Provisions for other liabilities and charges (695) (695)Trade and other payables (2 654) (2 654)
Loss on sale of subsidiaries 12 969 – 12 969 Transfer to investment in associated companies (2 383) (2 383)Transfer to loans to associated companies (10 286) (10 286)Loss on sale of subsidiaries (300) (300)Cash proceeds on sale – – –Cash and cash equivalents of subsidiaries (2 880) (2 880)Net cash flow on disposal of subsidiaries (2 880) – (2 880)
2009 disposalsDuring the 2009 year the group diluted its investments in, inter alia, Adato Capital Ltd and the South Easter Fund which were previously consolidated by the group.
Notes to the annual financial statementsfor the year ended 28 February 2010
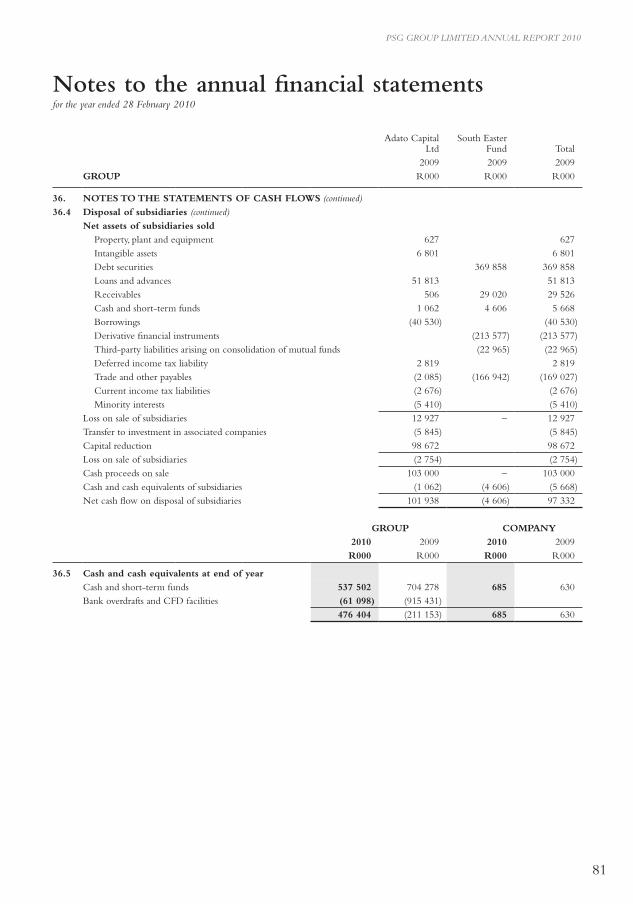
81
PSG GROUP LIMITED ANNUAL REPORT 2010
Adato CapitalLtd
South EasterFund Total
2009 2009 2009GROUP R000 R000 R000
36. NOTES TO THE STATEMENTS OF CASH FLOWS (continued)36.4 Disposal of subsidiaries (continued)
Net assets of subsidiaries soldProperty, plant and equipment 627 627 Intangible assets 6 801 6 801 Debt securities 369 858 369 858 Loans and advances 51 813 51 813 Receivables 506 29 020 29 526 Cash and short-term funds 1 062 4 606 5 668 Borrowings (40 530) (40 530)Derivative financial instruments (213 577) (213 577)Third-party liabilities arising on consolidation of mutual funds (22 965) (22 965)Deferred income tax liability 2 819 2 819 Trade and other payables (2 085) (166 942) (169 027)Current income tax liabilities (2 676) (2 676)Minority interests (5 410) (5 410)
Loss on sale of subsidiaries 12 927 – 12 927 Transfer to investment in associated companies (5 845) (5 845)Capital reduction 98 672 98 672 Loss on sale of subsidiaries (2 754) (2 754)Cash proceeds on sale 103 000 – 103 000 Cash and cash equivalents of subsidiaries (1 062) (4 606) (5 668)Net cash flow on disposal of subsidiaries 101 938 (4 606) 97 332
GROUP COMPANY2010 2009 2010 2009R000 R000 R000 R000
36.5 Cash and cash equivalents at end of yearCash and short-term funds 537 502 704 278 685 630 Bank overdrafts and CFD facilities (61 098) (915 431)
476 404 (211 153) 685 630
Notes to the annual financial statementsfor the year ended 28 February 2010
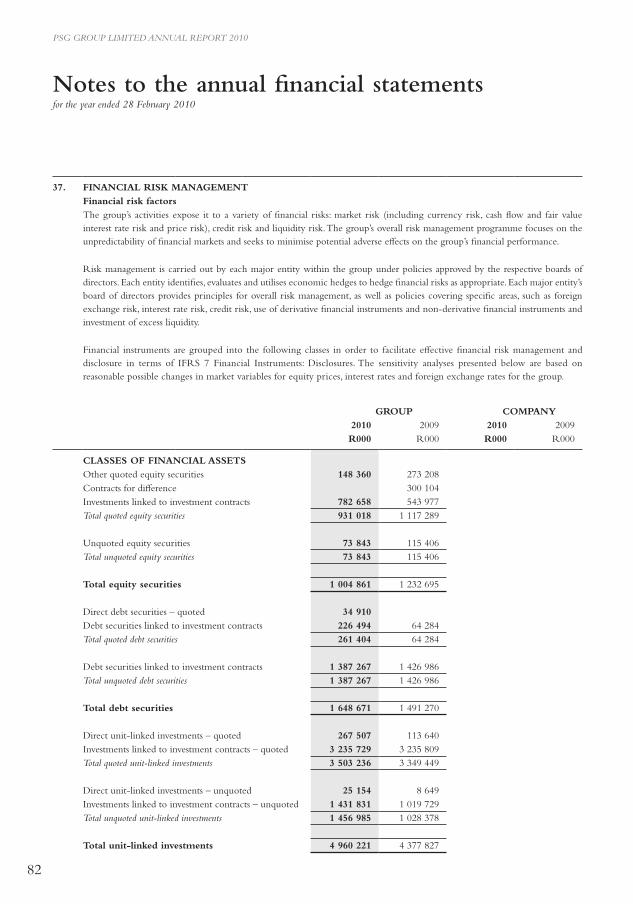
82
PSG GROUP LIMITED ANNUAL REPORT 2010
37. FINANCIAL RISK MANAGEMENTFinancial risk factorsThe group’s activities expose it to a variety of financial risks: market risk (including currency risk, cash flow and fair value interest rate risk and price risk), credit risk and liquidity risk. The group’s overall risk management programme focuses on the unpredictability of financial markets and seeks to minimise potential adverse effects on the group’s financial performance.
Risk management is carried out by each major entity within the group under policies approved by the respective boards of directors. Each entity identifies, evaluates and utilises economic hedges to hedge financial risks as appropriate. Each major entity’s board of directors provides principles for overall risk management, as well as policies covering specific areas, such as foreign exchange risk, interest rate risk, credit risk, use of derivative financial instruments and non-derivative financial instruments and investment of excess liquidity.
Financial instruments are grouped into the following classes in order to facilitate effective financial risk management and disclosure in terms of IFRS 7 Financial Instruments: Disclosures. The sensitivity analyses presented below are based on reasonable possible changes in market variables for equity prices, interest rates and foreign exchange rates for the group.
GROUP COMPANY2010 2009 2010 2009R000 R000 R000 R000
CLASSES OF FINANCIAL ASSETSOther quoted equity securities 148 360 273 208 Contracts for difference 300 104 Investments linked to investment contracts 782 658 543 977 Total quoted equity securities 931 018 1 117 289
Unquoted equity securities 73 843 115 406 Total unquoted equity securities 73 843 115 406
Total equity securities 1 004 861 1 232 695
Direct debt securities – quoted 34 910Debt securities linked to investment contracts 226 494 64 284 Total quoted debt securities 261 404 64 284
Debt securities linked to investment contracts 1 387 267 1 426 986 Total unquoted debt securities 1 387 267 1 426 986
Total debt securities 1 648 671 1 491 270
Direct unit-linked investments – quoted 267 507 113 640 Investments linked to investment contracts – quoted 3 235 729 3 235 809 Total quoted unit-linked investments 3 503 236 3 349 449
Direct unit-linked investments – unquoted 25 154 8 649 Investments linked to investment contracts – unquoted 1 431 831 1 019 729 Total unquoted unit-linked investments 1 456 985 1 028 378
Total unit-linked investments 4 960 221 4 377 827
Notes to the annual financial statementsfor the year ended 28 February 2010
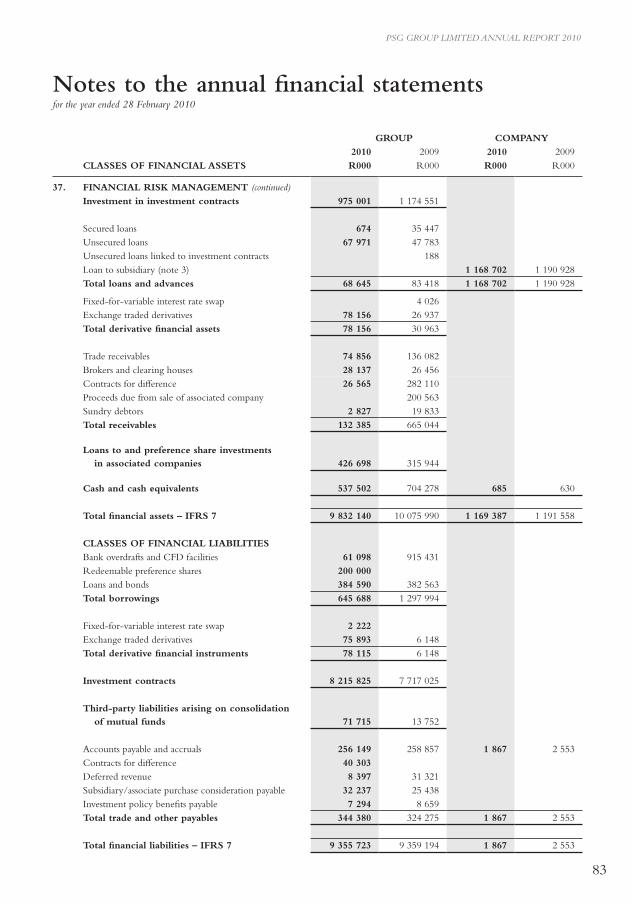
83
PSG GROUP LIMITED ANNUAL REPORT 2010
GROUP COMPANY2010 2009 2010 2009
CLASSES OF FINANCIAL ASSETS R000 R000 R000 R000
37. FINANCIAL RISK MANAGEMENT (continued)Investment in investment contracts 975 001 1 174 551
Secured loans 674 35 447 Unsecured loans 67 971 47 783 Unsecured loans linked to investment contracts 188 Loan to subsidiary (note 3) 1 168 702 1 190 928 Total loans and advances 68 645 83 418 1 168 702 1 190 928
Fixed-for-variable interest rate swap 4 026 Exchange traded derivatives 78 156 26 937 Total derivative financial assets 78 156 30 963
Trade receivables 74 856 136 082 Brokers and clearing houses 28 137 26 456 Contracts for difference 26 565 282 110 Proceeds due from sale of associated company 200 563 Sundry debtors 2 827 19 833 Total receivables 132 385 665 044
Loans to and preference share investments in associated companies 426 698 315 944
Cash and cash equivalents 537 502 704 278 685 630
Total financial assets – IFRS 7 9 832 140 10 075 990 1 169 387 1 191 558
CLASSES OF FINANCIAL LIABILITIESBank overdrafts and CFD facilities 61 098 915 431 Redeemable preference shares 200 000 Loans and bonds 384 590 382 563 Total borrowings 645 688 1 297 994
Fixed-for-variable interest rate swap 2 222 Exchange traded derivatives 75 893 6 148 Total derivative financial instruments 78 115 6 148
Investment contracts 8 215 825 7 717 025
Third-party liabilities arising on consolidation of mutual funds 71 715 13 752
Accounts payable and accruals 256 149 258 857 1 867 2 553 Contracts for difference 40 303 Deferred revenue 8 397 31 321 Subsidiary/associate purchase consideration payable 32 237 25 438 Investment policy benefits payable 7 294 8 659 Total trade and other payables 344 380 324 275 1 867 2 553
Total financial liabilities – IFRS 7 9 355 723 9 359 194 1 867 2 553
Notes to the annual financial statementsfor the year ended 28 February 2010
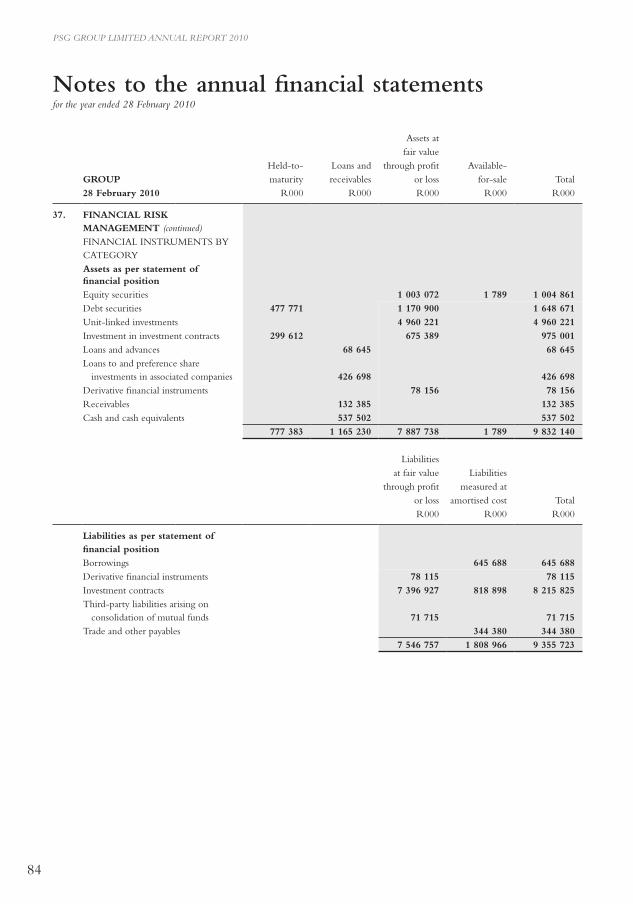
84
PSG GROUP LIMITED ANNUAL REPORT 2010
Assets atfair value
Held-to- Loans and through profit Available-GROUP maturity receivables or loss for-sale Total28 February 2010 R000 R000 R000 R000 R000
37. FINANCIAL RISK MANAGEMENT (continued)FINANCIAL INSTRUMENTS By CATEGORyAssets as per statement of financial positionEquity securities 1 003 072 1 789 1 004 861Debt securities 477 771 1 170 900 1 648 671Unit-linked investments 4 960 221 4 960 221Investment in investment contracts 299 612 675 389 975 001 Loans and advances 68 645 68 645 Loans to and preference share investments in associated companies 426 698 426 698 Derivative financial instruments 78 156 78 156 Receivables 132 385 132 385 Cash and cash equivalents 537 502 537 502
777 383 1 165 230 7 887 738 1 789 9 832 140
Liabilitiesat fair value Liabilities
through profit measured ator loss amortised cost TotalR000 R000 R000
Liabilities as per statement of financial positionBorrowings 645 688 645 688 Derivative financial instruments 78 115 78 115 Investment contracts 7 396 927 818 898 8 215 825 Third-party liabilities arising on consolidation of mutual funds 71 715 71 715 Trade and other payables 344 380 344 380
7 546 757 1 808 966 9 355 723
Notes to the annual financial statementsfor the year ended 28 February 2010
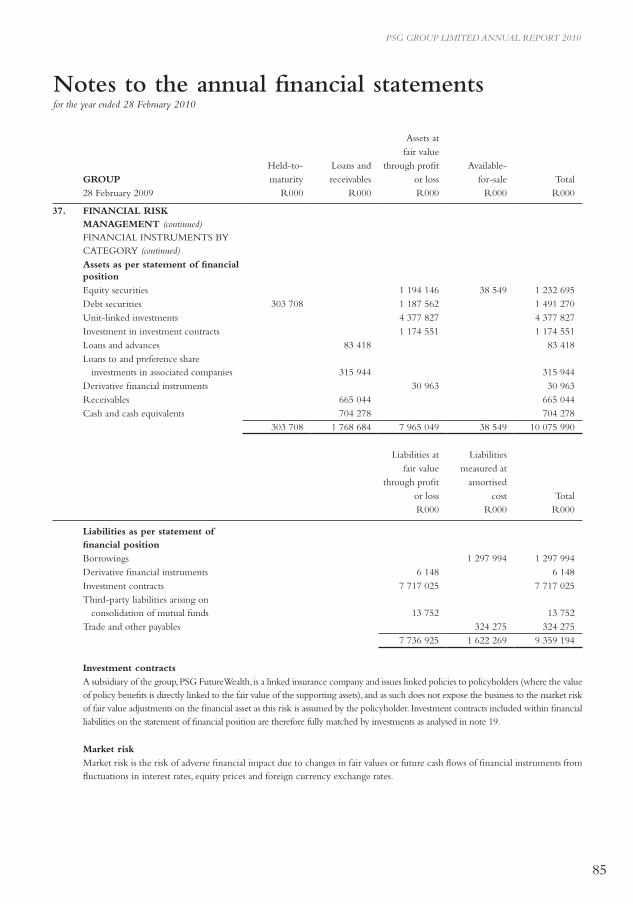
85
PSG GROUP LIMITED ANNUAL REPORT 2010
Assets atfair value
Held-to- Loans and through profit Available-GROUP maturity receivables or loss for-sale Total28 February 2009 R000 R000 R000 R000 R000
37. FINANCIAL RISK MANAGEMENT (continued)FINANCIAL INSTRUMENTS By CATEGORy (continued)Assets as per statement of financial positionEquity securities 1 194 146 38 549 1 232 695 Debt securities 303 708 1 187 562 1 491 270 Unit-linked investments 4 377 827 4 377 827 Investment in investment contracts 1 174 551 1 174 551 Loans and advances 83 418 83 418 Loans to and preference share investments in associated companies 315 944 315 944 Derivative financial instruments 30 963 30 963 Receivables 665 044 665 044 Cash and cash equivalents 704 278 704 278
303 708 1 768 684 7 965 049 38 549 10 075 990
Liabilities at Liabilitiesfair value measured at
through profit amortisedor loss cost TotalR000 R000 R000
Liabilities as per statement of financial positionBorrowings 1 297 994 1 297 994Derivative financial instruments 6 148 6 148Investment contracts 7 717 025 7 717 025Third-party liabilities arising on consolidation of mutual funds 13 752 13 752Trade and other payables 324 275 324 275
7 736 925 1 622 269 9 359 194
Investment contractsA subsidiary of the group, PSG FutureWealth, is a linked insurance company and issues linked policies to policyholders (where the value of policy benefits is directly linked to the fair value of the supporting assets), and as such does not expose the business to the market risk of fair value adjustments on the financial asset as this risk is assumed by the policyholder. Investment contracts included within financial liabilities on the statement of financial position are therefore fully matched by investments as analysed in note 19.
Market riskMarket risk is the risk of adverse financial impact due to changes in fair values or future cash flows of financial instruments from fluctuations in interest rates, equity prices and foreign currency exchange rates.
Notes to the annual financial statementsfor the year ended 28 February 2010
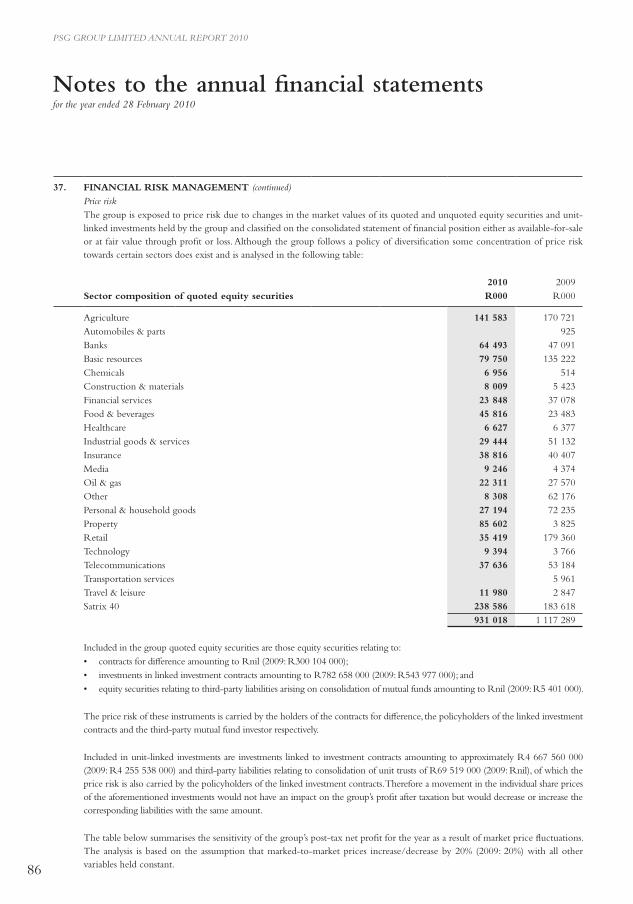
86
PSG GROUP LIMITED ANNUAL REPORT 2010
37. FINANCIAL RISK MANAGEMENT (continued)Price riskThe group is exposed to price risk due to changes in the market values of its quoted and unquoted equity securities and unit- linked investments held by the group and classified on the consolidated statement of financial position either as available-for-sale or at fair value through profit or loss. Although the group follows a policy of diversification some concentration of price risk towards certain sectors does exist and is analysed in the following table:
2010 2009 Sector composition of quoted equity securities R000 R000
Agriculture 141 583 170 721Automobiles & parts 925Banks 64 493 47 091Basic resources 79 750 135 222Chemicals 6 956 514Construction & materials 8 009 5 423Financial services 23 848 37 078Food & beverages 45 816 23 483Healthcare 6 627 6 377Industrial goods & services 29 444 51 132Insurance 38 816 40 407Media 9 246 4 374Oil & gas 22 311 27 570Other 8 308 62 176Personal & household goods 27 194 72 235Property 85 602 3 825Retail 35 419 179 360Technology 9 394 3 766Telecommunications 37 636 53 184Transportation services 5 961Travel & leisure 11 980 2 847Satrix 40 238 586 183 618
931 018 1 117 289
Included in the group quoted equity securities are those equity securities relating to:• contracts for difference amounting to Rnil (2009: R300 104 000);• investments in linked investment contracts amounting to R782 658 000 (2009: R543 977 000); and• equity securities relating to third-party liabilities arising on consolidation of mutual funds amounting to Rnil (2009: R5 401 000).
The price risk of these instruments is carried by the holders of the contracts for difference, the policyholders of the linked investment contracts and the third-party mutual fund investor respectively.
Included in unit-linked investments are investments linked to investment contracts amounting to approximately R4 667 560 000 (2009: R4 255 538 000) and third-party liabilities relating to consolidation of unit trusts of R69 519 000 (2009: Rnil), of which the price risk is also carried by the policyholders of the linked investment contracts. Therefore a movement in the individual share prices of the aforementioned investments would not have an impact on the group’s profit after taxation but would decrease or increase the corresponding liabilities with the same amount.
The table below summarises the sensitivity of the group’s post-tax net profit for the year as a result of market price fluctuations. The analysis is based on the assumption that marked-to-market prices increase/decrease by 20% (2009: 20%) with all other variables held constant.
Notes to the annual financial statementsfor the year ended 28 February 2010
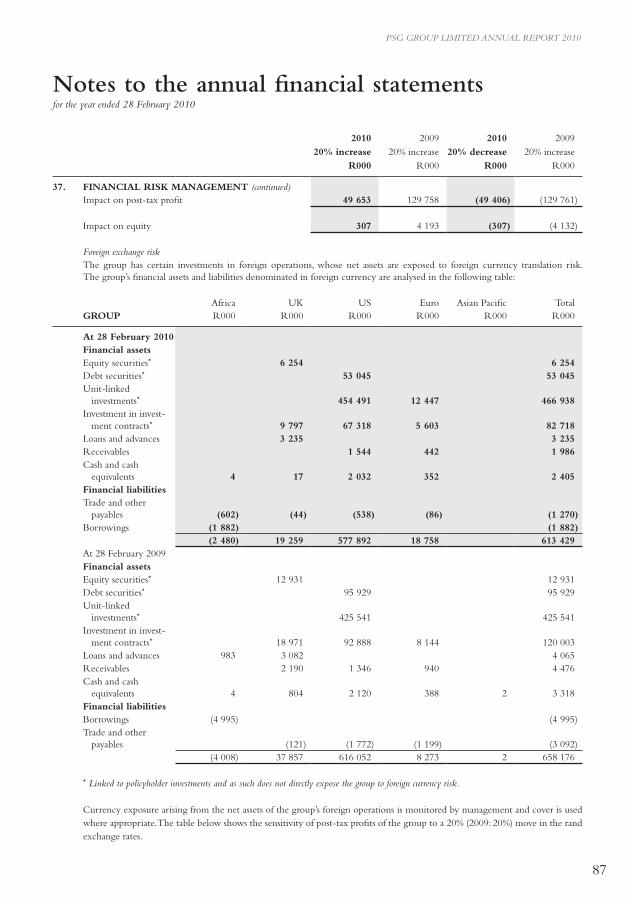
87
PSG GROUP LIMITED ANNUAL REPORT 2010
2010 2009 2010 200920% increase 20% increase 20% decrease 20% increase
R000 R000 R000 R000
37. FINANCIAL RISK MANAGEMENT (continued)Impact on post-tax profit 49 653 129 758 (49 406) (129 761)
Impact on equity 307 4 193 (307) (4 132)
Foreign exchange riskThe group has certain investments in foreign operations, whose net assets are exposed to foreign currency translation risk. The group’s financial assets and liabilities denominated in foreign currency are analysed in the following table:
Africa UK US Euro Asian Pacific TotalGROUP R000 R000 R000 R000 R000 R000
At 28 February 2010Financial assets Equity securities* 6 254 6 254Debt securities* 53 045 53 045Unit-linked investments* 454 491 12 447 466 938Investment in invest- ment contracts* 9 797 67 318 5 603 82 718Loans and advances 3 235 3 235Receivables 1 544 442 1 986Cash and cash equivalents 4 17 2 032 352 2 405Financial liabilitiesTrade and other payables (602) (44) (538) (86) (1 270)Borrowings (1 882) (1 882)
(2 480) 19 259 577 892 18 758 613 429At 28 February 2009Financial assets Equity securities* 12 931 12 931Debt securities* 95 929 95 929Unit-linked investments* 425 541 425 541Investment in invest- ment contracts* 18 971 92 888 8 144 120 003Loans and advances 983 3 082 4 065Receivables 2 190 1 346 940 4 476Cash and cash equivalents 4 804 2 120 388 2 3 318Financial liabilitiesBorrowings (4 995) (4 995)Trade and other payables (121) (1 772) (1 199) (3 092)
(4 008) 37 857 616 052 8 273 2 658 176
* Linked to policyholder investments and as such does not directly expose the group to foreign currency risk.
Currency exposure arising from the net assets of the group’s foreign operations is monitored by management and cover is used where appropriate. The table below shows the sensitivity of post-tax profits of the group to a 20% (2009: 20%) move in the rand exchange rates.
Notes to the annual financial statementsfor the year ended 28 February 2010
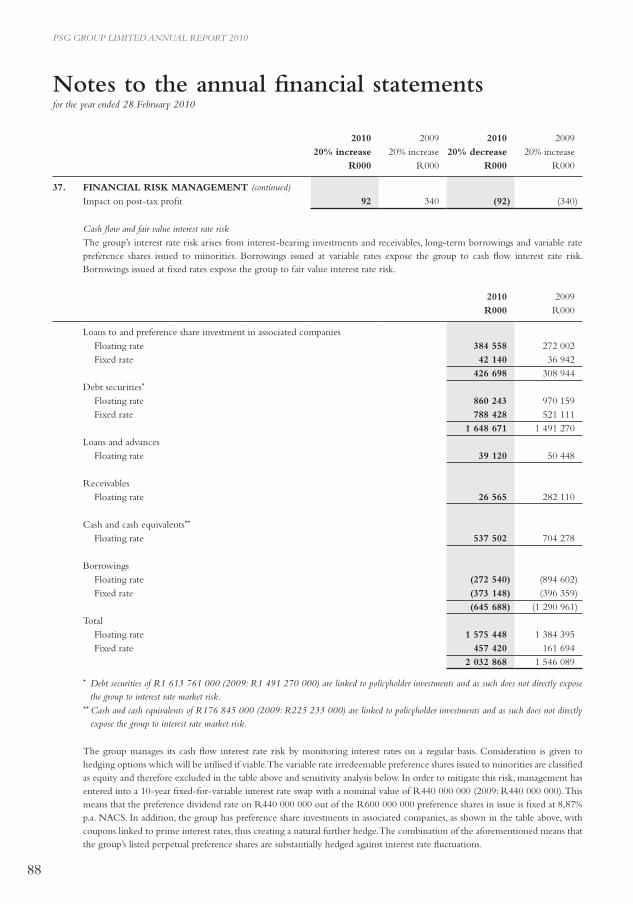
88
PSG GROUP LIMITED ANNUAL REPORT 2010
2010 2009 2010 200920% increase 20% increase 20% decrease 20% increase
R000 R000 R000 R000
37. FINANCIAL RISK MANAGEMENT (continued)Impact on post-tax profit 92 340 (92) (340)
Cash flow and fair value interest rate riskThe group’s interest rate risk arises from interest-bearing investments and receivables, long-term borrowings and variable rate preference shares issued to minorities. Borrowings issued at variable rates expose the group to cash flow interest rate risk. Borrowings issued at fixed rates expose the group to fair value interest rate risk.
2010 2009 R000 R000
Loans to and preference share investment in associated companiesFloating rate 384 558 272 002Fixed rate 42 140 36 942
426 698 308 944Debt securities*
Floating rate 860 243 970 159Fixed rate 788 428 521 111
1 648 671 1 491 270Loans and advances
Floating rate 39 120 50 448
ReceivablesFloating rate 26 565 282 110
Cash and cash equivalents**
Floating rate 537 502 704 278
BorrowingsFloating rate (272 540) (894 602)Fixed rate (373 148) (396 359)
(645 688) (1 290 961)Total
Floating rate 1 575 448 1 384 395Fixed rate 457 420 161 694
2 032 868 1 546 089
* Debt securities of R1 613 761 000 (2009: R1 491 270 000) are linked to policyholder investments and as such does not directly expose the group to interest rate market risk.
** Cash and cash equivalents of R176 845 000 (2009: R225 233 000) are linked to policyholder investments and as such does not directly expose the group to interest rate market risk.
The group manages its cash flow interest rate risk by monitoring interest rates on a regular basis. Consideration is given to hedging options which will be utilised if viable. The variable rate irredeemable preference shares issued to minorities are classified as equity and therefore excluded in the table above and sensitivity analysis below. In order to mitigate this risk, management has entered into a 10-year fixed-for-variable interest rate swap with a nominal value of R440 000 000 (2009: R440 000 000). This means that the preference dividend rate on R440 000 000 out of the R600 000 000 preference shares in issue is fixed at 8,87% p.a. NACS. In addition, the group has preference share investments in associated companies, as shown in the table above, with coupons linked to prime interest rates, thus creating a natural further hedge. The combination of the aforementioned means that the group’s listed perpetual preference shares are substantially hedged against interest rate fluctuations.
Notes to the annual financial statementsfor the year ended 28 February 2010
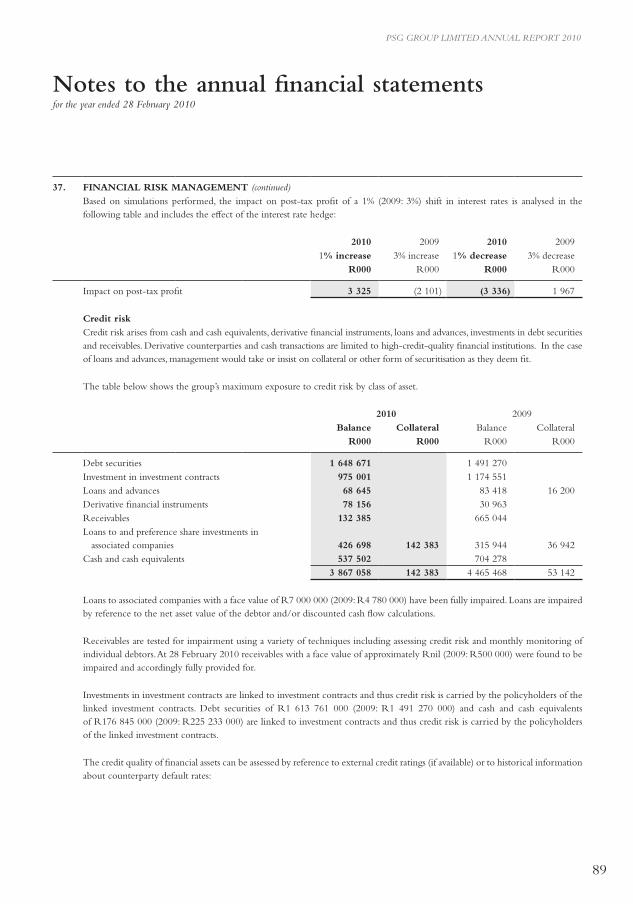
89
PSG GROUP LIMITED ANNUAL REPORT 2010
37. FINANCIAL RISK MANAGEMENT (continued)Based on simulations performed, the impact on post-tax profit of a 1% (2009: 3%) shift in interest rates is analysed in the following table and includes the effect of the interest rate hedge:
2010 2009 2010 20091% increase 3% increase 1% decrease 3% decrease
R000 R000 R000 R000
Impact on post-tax profit 3 325 (2 101) (3 336) 1 967
Credit riskCredit risk arises from cash and cash equivalents, derivative financial instruments, loans and advances, investments in debt securities and receivables. Derivative counterparties and cash transactions are limited to high-credit-quality financial institutions. In the case of loans and advances, management would take or insist on collateral or other form of securitisation as they deem fit.
The table below shows the group’s maximum exposure to credit risk by class of asset.
2010 2009Balance Collateral Balance Collateral
R000 R000 R000 R000
Debt securities 1 648 671 1 491 270Investment in investment contracts 975 001 1 174 551Loans and advances 68 645 83 418 16 200Derivative financial instruments 78 156 30 963Receivables 132 385 665 044Loans to and preference share investments in associated companies 426 698 142 383 315 944 36 942Cash and cash equivalents 537 502 704 278
3 867 058 142 383 4 465 468 53 142
Loans to associated companies with a face value of R7 000 000 (2009: R4 780 000) have been fully impaired. Loans are impaired by reference to the net asset value of the debtor and/or discounted cash flow calculations.
Receivables are tested for impairment using a variety of techniques including assessing credit risk and monthly monitoring of individual debtors. At 28 February 2010 receivables with a face value of approximately Rnil (2009: R500 000) were found to be impaired and accordingly fully provided for.
Investments in investment contracts are linked to investment contracts and thus credit risk is carried by the policyholders of the linked investment contracts. Debt securities of R1 613 761 000 (2009: R1 491 270 000) and cash and cash equivalents of R176 845 000 (2009: R225 233 000) are linked to investment contracts and thus credit risk is carried by the policyholders of the linked investment contracts.
The credit quality of financial assets can be assessed by reference to external credit ratings (if available) or to historical information about counterparty default rates:
Notes to the annual financial statementsfor the year ended 28 February 2010
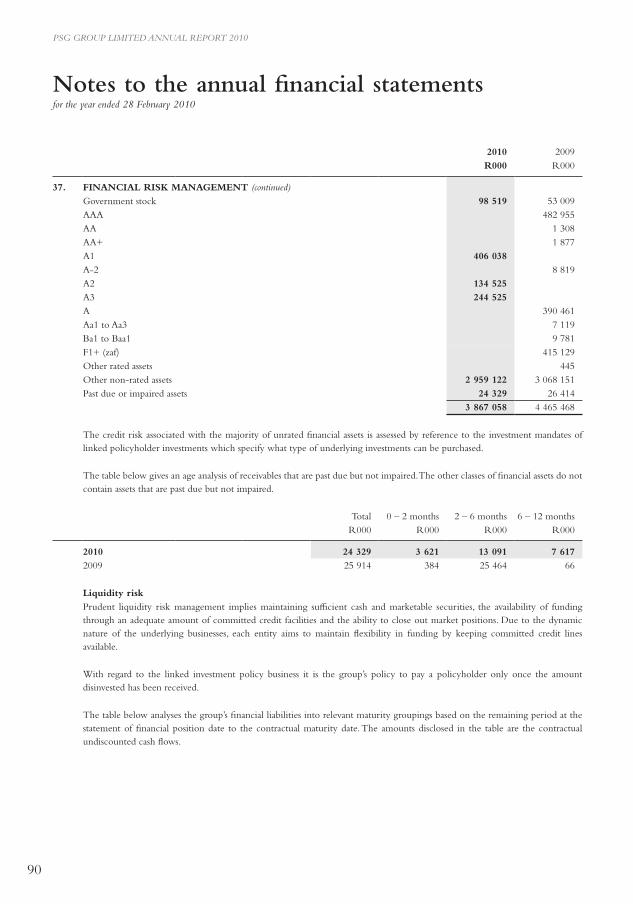
90
PSG GROUP LIMITED ANNUAL REPORT 2010
2010 2009R000 R000
37. FINANCIAL RISK MANAGEMENT (continued)Government stock 98 519 53 009AAA 482 955AA 1 308AA+ 1 877A1 406 038A-2 8 819A2 134 525A3 244 525A 390 461Aa1 to Aa3 7 119Ba1 to Baa1 9 781F1+ (zaf) 415 129Other rated assets 445Other non-rated assets 2 959 122 3 068 151Past due or impaired assets 24 329 26 414
3 867 058 4 465 468
The credit risk associated with the majority of unrated financial assets is assessed by reference to the investment mandates of linked policyholder investments which specify what type of underlying investments can be purchased.
The table below gives an age analysis of receivables that are past due but not impaired. The other classes of financial assets do not contain assets that are past due but not impaired.
Total 0 – 2 months 2 – 6 months 6 – 12 monthsR000 R000 R000 R000
2010 24 329 3 621 13 091 7 6172009 25 914 384 25 464 66
Liquidity riskPrudent liquidity risk management implies maintaining sufficient cash and marketable securities, the availability of funding through an adequate amount of committed credit facilities and the ability to close out market positions. Due to the dynamic nature of the underlying businesses, each entity aims to maintain flexibility in funding by keeping committed credit lines available.
With regard to the linked investment policy business it is the group’s policy to pay a policyholder only once the amount disinvested has been received.
The table below analyses the group’s financial liabilities into relevant maturity groupings based on the remaining period at the statement of financial position date to the contractual maturity date. The amounts disclosed in the table are the contractual undiscounted cash flows.
Notes to the annual financial statementsfor the year ended 28 February 2010
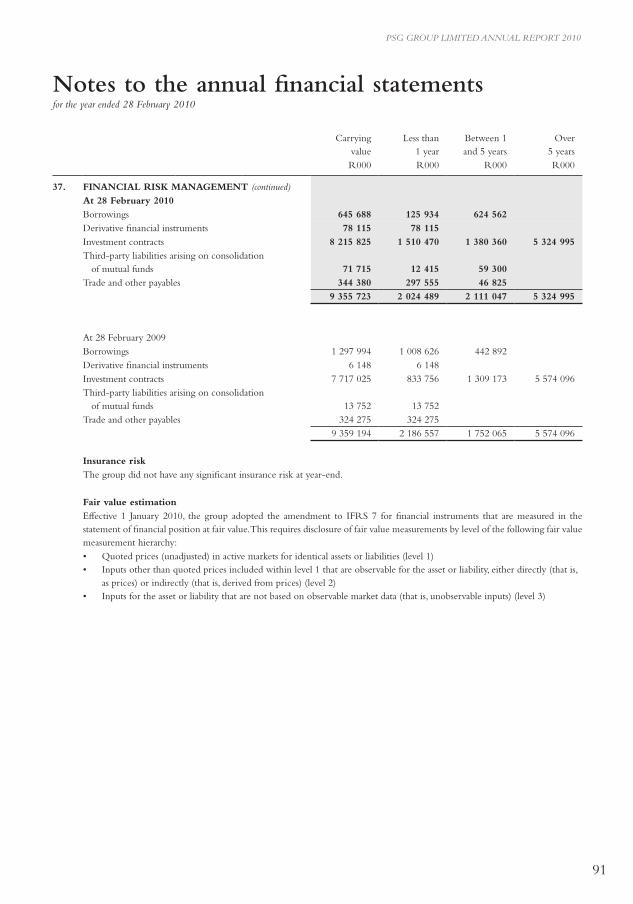
91
PSG GROUP LIMITED ANNUAL REPORT 2010
Carrying value
Less than 1 year
Between 1 and 5 years
Over 5 years
R000 R000 R000 R000
37. FINANCIAL RISK MANAGEMENT (continued)At 28 February 2010Borrowings 645 688 125 934 624 562Derivative financial instruments 78 115 78 115Investment contracts 8 215 825 1 510 470 1 380 360 5 324 995Third-party liabilities arising on consolidation of mutual funds 71 715 12 415 59 300Trade and other payables 344 380 297 555 46 825
9 355 723 2 024 489 2 111 047 5 324 995
At 28 February 2009Borrowings 1 297 994 1 008 626 442 892Derivative financial instruments 6 148 6 148Investment contracts 7 717 025 833 756 1 309 173 5 574 096Third-party liabilities arising on consolidation of mutual funds 13 752 13 752Trade and other payables 324 275 324 275
9 359 194 2 186 557 1 752 065 5 574 096
Insurance riskThe group did not have any significant insurance risk at year-end.
Fair value estimationEffective 1 January 2010, the group adopted the amendment to IFRS 7 for financial instruments that are measured in the statement of financial position at fair value. This requires disclosure of fair value measurements by level of the following fair value measurement hierarchy:• Quoted prices (unadjusted) in active markets for identical assets or liabilities (level 1)• Inputs other than quoted prices included within level 1 that are observable for the asset or liability, either directly (that is,
as prices) or indirectly (that is, derived from prices) (level 2)• Inputs for the asset or liability that are not based on observable market data (that is, unobservable inputs) (level 3)
Notes to the annual financial statementsfor the year ended 28 February 2010
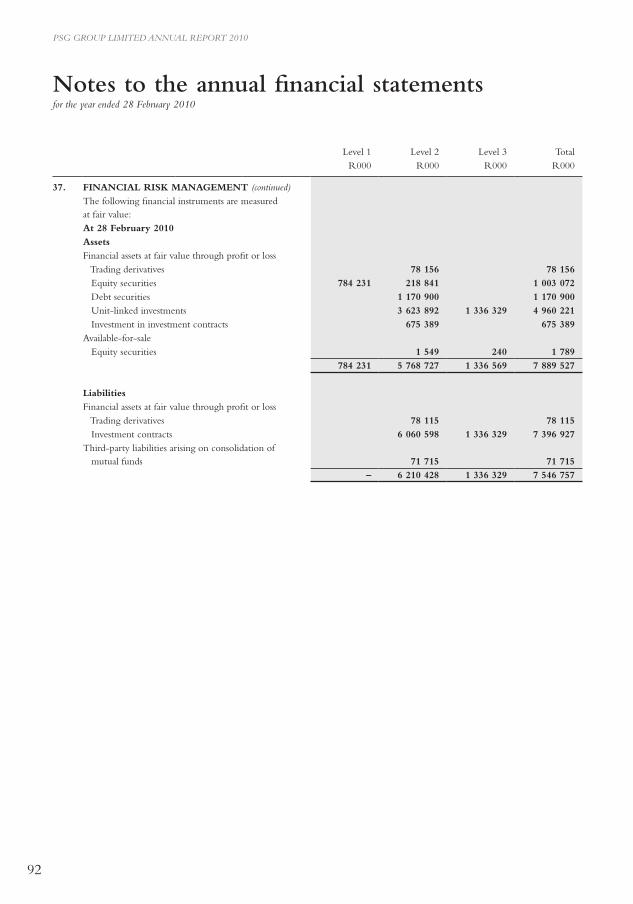
92
PSG GROUP LIMITED ANNUAL REPORT 2010
Level 1 Level 2 Level 3 TotalR000 R000 R000 R000
37. FINANCIAL RISK MANAGEMENT (continued)The following financial instruments are measured at fair value:At 28 February 2010AssetsFinancial assets at fair value through profit or loss Trading derivatives 78 156 78 156 Equity securities 784 231 218 841 1 003 072 Debt securities 1 170 900 1 170 900 Unit-linked investments 3 623 892 1 336 329 4 960 221 Investment in investment contracts 675 389 675 389Available-for-sale Equity securities 1 549 240 1 789
784 231 5 768 727 1 336 569 7 889 527
LiabilitiesFinancial assets at fair value through profit or loss Trading derivatives 78 115 78 115 Investment contracts 6 060 598 1 336 329 7 396 927Third-party liabilities arising on consolidation of mutual funds 71 715 71 715
– 6 210 428 1 336 329 7 546 757
Notes to the annual financial statementsfor the year ended 28 February 2010
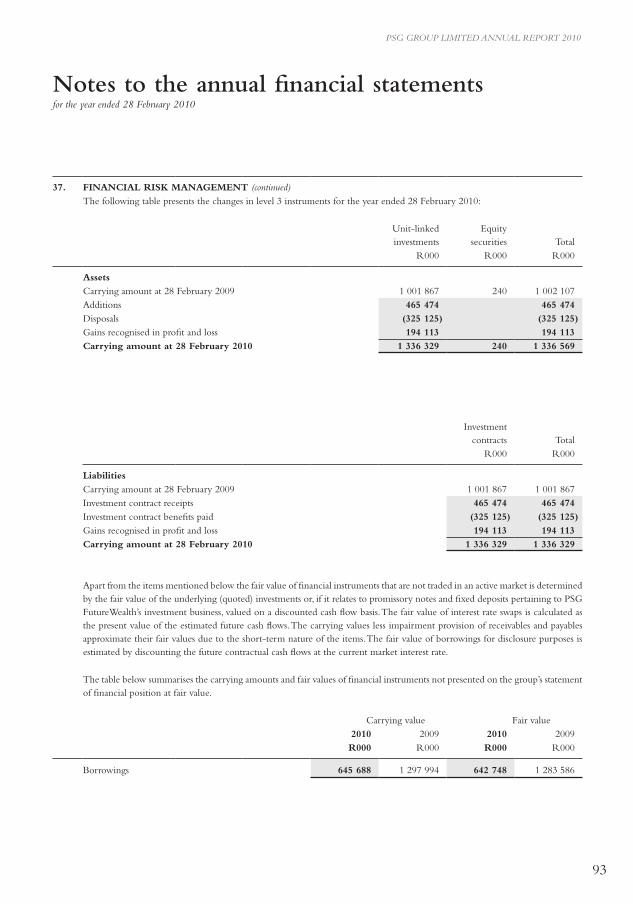
93
PSG GROUP LIMITED ANNUAL REPORT 2010
37. FINANCIAL RISK MANAGEMENT (continued)The following table presents the changes in level 3 instruments for the year ended 28 February 2010:
Unit-linkedinvestments
Equity securities Total
R000 R000 R000
AssetsCarrying amount at 28 February 2009 1 001 867 240 1 002 107Additions 465 474 465 474Disposals (325 125) (325 125)Gains recognised in profit and loss 194 113 194 113Carrying amount at 28 February 2010 1 336 329 240 1 336 569
Investmentcontracts Total
R000 R000
LiabilitiesCarrying amount at 28 February 2009 1 001 867 1 001 867Investment contract receipts 465 474 465 474Investment contract benefits paid (325 125) (325 125)Gains recognised in profit and loss 194 113 194 113Carrying amount at 28 February 2010 1 336 329 1 336 329
Apart from the items mentioned below the fair value of financial instruments that are not traded in an active market is determined by the fair value of the underlying (quoted) investments or, if it relates to promissory notes and fixed deposits pertaining to PSG FutureWealth’s investment business, valued on a discounted cash flow basis. The fair value of interest rate swaps is calculated as the present value of the estimated future cash flows. The carrying values less impairment provision of receivables and payables approximate their fair values due to the short-term nature of the items. The fair value of borrowings for disclosure purposes is estimated by discounting the future contractual cash flows at the current market interest rate.
The table below summarises the carrying amounts and fair values of financial instruments not presented on the group’s statement of financial position at fair value.
Carrying value Fair value2010 2009 2010 2009R000 R000 R000 R000
Borrowings 645 688 1 297 994 642 748 1 283 586
Notes to the annual financial statementsfor the year ended 28 February 2010
94
PSG GROUP LIMITED ANNUAL REPORT 2010
37. FINANCIAL RISK MANAGEMENT (continued)CAPITAL RISK MANAGEMENT (continued)The group’s objectives when managing capital are to safeguard the group’s ability to continue as a going concern in order to provide returns for shareholders and benefits for other stakeholders and to maintain an optimal capital structure to reduce the cost of capital. In order to maintain or adjust the capital structure, the group may adjust the amount of dividends paid to shareholders, return capital to shareholders, issue new shares or sell assets to reduce debt.
The group’s capital comprises total equity as shown in the consolidated statement of financial position plus net debt. Net debt is calculated as total borrowings less cash and cash equivalents as shown in the consolidated statement of financial position. When funding is required management will consider the various forms of paper available for issue taking into account current market conditions, anticipated trends in market indicators and the financial position of the group at the time. Management will accordingly consider issuing ordinary shares, perpetual preference shares, short, long or medium-term borrowings with variable or fixed rates. Historically the group’s long and medium-term paper have been issued at fixed rates of interest. The directors have authority to issue ordinary shares up to 5% of the number of shares in issue as at the previous year-end.
Certain subsidiaries have regulatory capital adequacy requirements as a result of the respective industries in which they operate. PSG FutureWealth Ltd is required to hold a minimum amount of capital in order to reduce the policyholders’ exposure to the company’s liquidity risk. The Financial Services Board regularly reviews compliance with these minimum capital requirements as the regulatory authority. The company must maintain shareholders’ funds that will be sufficient to meet obligations in the event of substantial deviations from the main assumptions affecting the company’s business. Capital adequacy requirements were covered 2,5 times at 28 February 2010 (2009: 2,2 times). This ratio is determined in accordance with regulations and the guidelines issued by the Actuarial Society of South Africa.
Notes to the annual financial statementsfor the year ended 28 February 2010
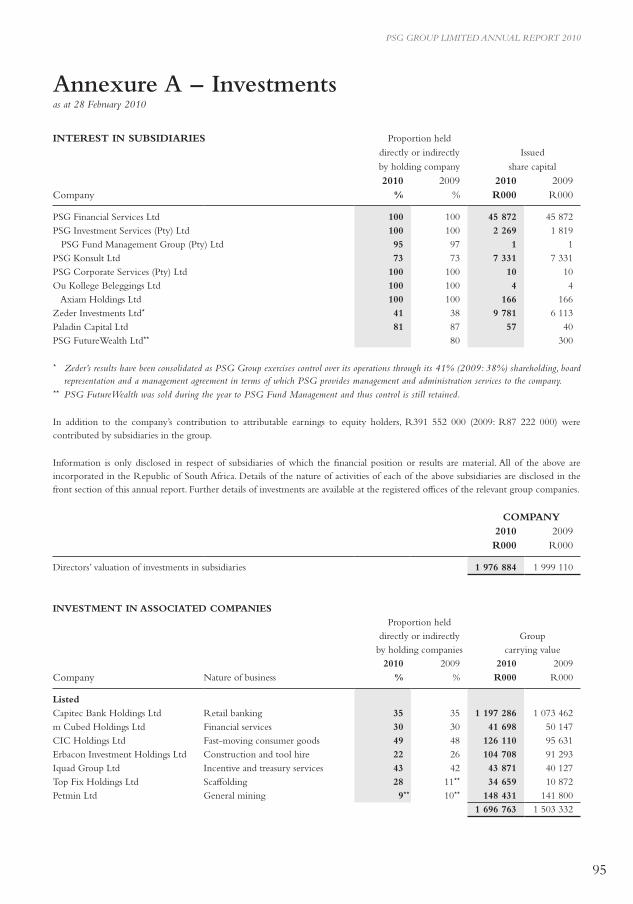
95
PSG GROUP LIMITED ANNUAL REPORT 2010
INTEREST IN SUBSIDIARIES Proportion held
directly or indirectly Issued
by holding company share capital
2010 2009 2010 2009Company % % R000 R000
PSG Financial Services Ltd 100 100 45 872 45 872 PSG Investment Services (Pty) Ltd 100 100 2 269 1 819 PSG Fund Management Group (Pty) Ltd 95 97 1 1 PSG Konsult Ltd 73 73 7 331 7 331 PSG Corporate Services (Pty) Ltd 100 100 10 10 Ou Kollege Beleggings Ltd 100 100 4 4 Axiam Holdings Ltd 100 100 166 166 Zeder Investments Ltd* 41 38 9 781 6 113 Paladin Capital Ltd 81 87 57 40 PSG FutureWealth Ltd** 80 300
* Zeder’s results have been consolidated as PSG Group exercises control over its operations through its 41% (2009: 38%) shareholding, board representation and a management agreement in terms of which PSG provides management and administration services to the company.
** PSG FutureWealth was sold during the year to PSG Fund Management and thus control is still retained.
In addition to the company’s contribution to attributable earnings to equity holders, R391 552 000 (2009: R87 222 000) were contributed by subsidiaries in the group.
Information is only disclosed in respect of subsidiaries of which the financial position or results are material. All of the above are incorporated in the Republic of South Africa. Details of the nature of activities of each of the above subsidiaries are disclosed in the front section of this annual report. Further details of investments are available at the registered offices of the relevant group companies.
COMPANY2010 2009R000 R000
Directors’ valuation of investments in subsidiaries 1 976 884 1 999 110
INVESTMENT IN ASSOCIATED COMPANIES Proportion held directly or indirectly Group by holding companies carrying value
2010 2009 2010 2009
Company Nature of business % % R000 R000
ListedCapitec Bank Holdings Ltd Retail banking 35 35 1 197 286 1 073 462 m Cubed Holdings Ltd Financial services 30 30 41 698 50 147 CIC Holdings Ltd Fast-moving consumer goods 49 48 126 110 95 631 Erbacon Investment Holdings Ltd Construction and tool hire 22 26 104 708 91 293 Iquad Group Ltd Incentive and treasury services 43 42 43 871 40 127 Top Fix Holdings Ltd Scaffolding 28 11** 34 659 10 872 Petmin Ltd General mining 9** 10** 148 431 141 800
1 696 763 1 503 332
Annexure A – Investmentsas at 28 February 2010
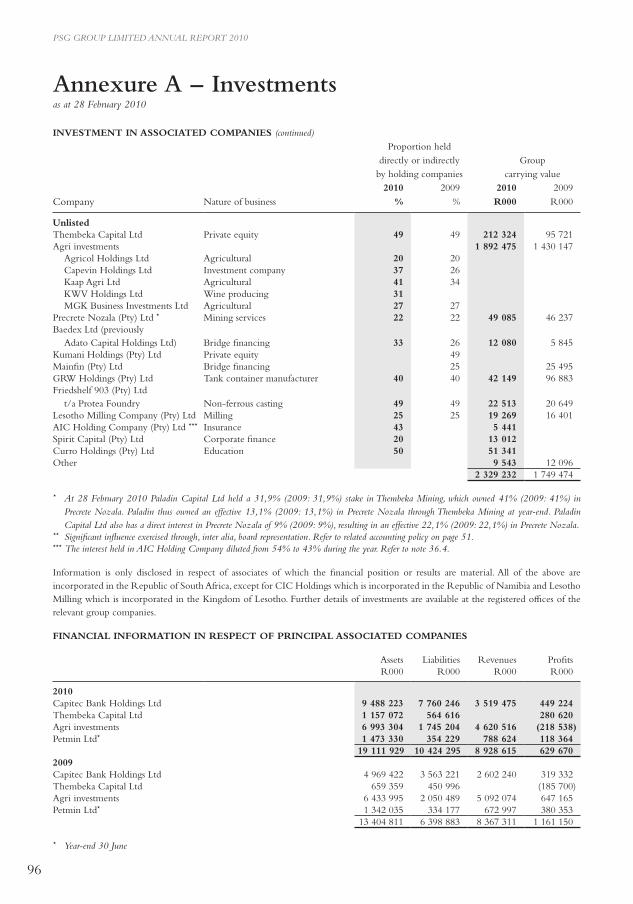
96
PSG GROUP LIMITED ANNUAL REPORT 2010
Annexure A – Investmentsas at 28 February 2010
INVESTMENT IN ASSOCIATED COMPANIES (continued) Proportion held directly or indirectly Group by holding companies carrying value
2010 2009 2010 2009
Company Nature of business % % R000 R000
UnlistedThembeka Capital Ltd Private equity 49 49 212 324 95 721 Agri investments 1 892 475 1 430 147
Agricol Holdings Ltd Agricultural 20 20 Capevin Holdings Ltd Investment company 37 26Kaap Agri Ltd Agricultural 41 34 KWV Holdings Ltd Wine producing 31 MGK Business Investments Ltd Agricultural 27 27
Precrete Nozala (Pty) Ltd * Mining services 22 22 49 085 46 237 Baedex Ltd (previously
Adato Capital Holdings Ltd) Bridge financing 33 26
12 080 5 845 Kumani Holdings (Pty) Ltd Private equity 49 Mainfin (Pty) Ltd Bridge financing 25 25 495 GRW Holdings (Pty) Ltd Tank container manufacturer 40 40 42 149 96 883 Friedshelf 903 (Pty) Ltd
t/a Protea Foundry Non-ferrous casting
49 49 22 513 20 649 Lesotho Milling Company (Pty) Ltd Milling 25 25 19 269 16 401 AIC Holding Company (Pty) Ltd *** Insurance 43 5 441 Spirit Capital (Pty) Ltd Corporate finance 20 13 012 Curro Holdings (Pty) Ltd Education 50 51 341 Other 9 543 12 096
2 329 232 1 749 474
* At 28 February 2010 Paladin Capital Ltd held a 31,9% (2009: 31,9%) stake in Thembeka Mining, which owned 41% (2009: 41%) in Precrete Nozala. Paladin thus owned an effective 13,1% (2009: 13,1%) in Precrete Nozala through Thembeka Mining at year-end. Paladin Capital Ltd also has a direct interest in Precrete Nozala of 9% (2009: 9%), resulting in an effective 22,1% (2009: 22,1%) in Precrete Nozala.
** Significant influence exercised through, inter alia, board representation. Refer to related accounting policy on page 51.*** The interest held in AIC Holding Company diluted from 54% to 43% during the year. Refer to note 36.4.
Information is only disclosed in respect of associates of which the financial position or results are material. All of the above are incorporated in the Republic of South Africa, except for CIC Holdings which is incorporated in the Republic of Namibia and Lesotho Milling which is incorporated in the Kingdom of Lesotho. Further details of investments are available at the registered offices of the relevant group companies.
FINANCIAL INFORMATION IN RESPECT OF PRINCIPAL ASSOCIATED COMPANIES
Assets Liabilities Revenues ProfitsR000 R000 R000 R000
2010Capitec Bank Holdings Ltd 9 488 223 7 760 246 3 519 475 449 224 Thembeka Capital Ltd 1 157 072 564 616 280 620 Agri investments 6 993 304 1 745 204 4 620 516 (218 538)Petmin Ltd* 1 473 330 354 229 788 624 118 364
19 111 929 10 424 295 8 928 615 629 6702009Capitec Bank Holdings Ltd 4 969 422 3 563 221 2 602 240 319 332 Thembeka Capital Ltd 659 359 450 996 (185 700)Agri investments 6 433 995 2 050 489 5 092 074 647 165 Petmin Ltd* 1 342 035 334 177 672 997 380 353
13 404 811 6 398 883 8 367 311 1 161 150
* Year-end 30 June
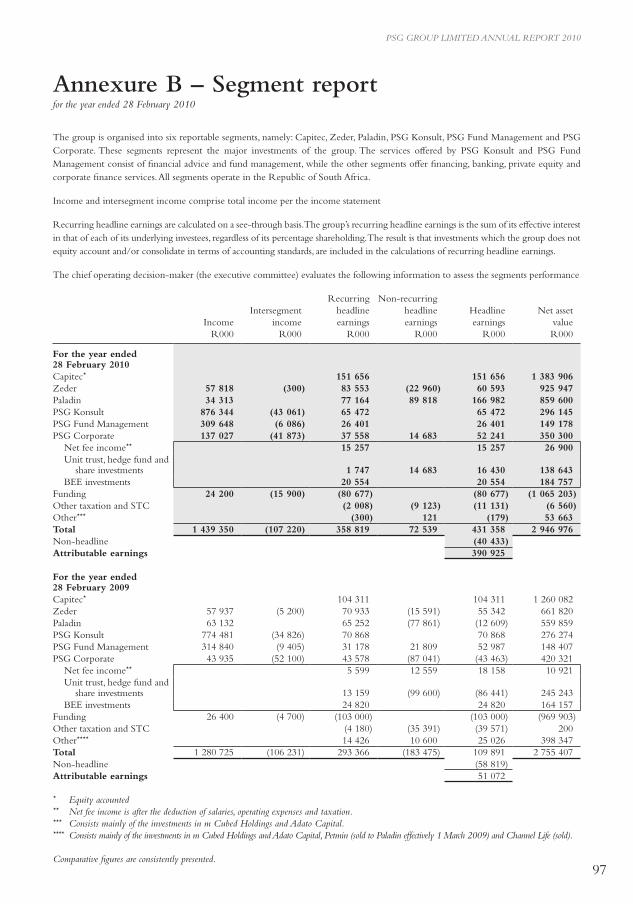
97
PSG GROUP LIMITED ANNUAL REPORT 2010
Annexure B – Segment reportfor the year ended 28 February 2010
The group is organised into six reportable segments, namely: Capitec, Zeder, Paladin, PSG Konsult, PSG Fund Management and PSG Corporate. These segments represent the major investments of the group. The services offered by PSG Konsult and PSG Fund Management consist of financial advice and fund management, while the other segments offer financing, banking, private equity and corporate finance services. All segments operate in the Republic of South Africa.
Income and intersegment income comprise total income per the income statement
Recurring headline earnings are calculated on a see-through basis. The group’s recurring headline earnings is the sum of its effective interest in that of each of its underlying investees, regardless of its percentage shareholding. The result is that investments which the group does not equity account and/or consolidate in terms of accounting standards, are included in the calculations of recurring headline earnings.
The chief operating decision-maker (the executive committee) evaluates the following information to assess the segments performance.
Recurring Non-recurringIntersegment headline headline Headline Net asset
Income income earnings earnings earnings valueR000 R000 R000 R000 R000 R000
For the year ended 28 February 2010Capitec* 151 656 151 656 1 383 906 Zeder 57 818 (300) 83 553 (22 960) 60 593 925 947 Paladin 34 313 77 164 89 818 166 982 859 600 PSG Konsult 876 344 (43 061) 65 472 65 472 296 145 PSG Fund Management 309 648 (6 086) 26 401 26 401 149 178 PSG Corporate 137 027 (41 873) 37 558 14 683 52 241 350 300
Net fee income** 15 257 15 257 26 900 Unit trust, hedge fund and
share investments 1 747 14 683 16 430 138 643 BEE investments 20 554 20 554 184 757
Funding 24 200 (15 900) (80 677) (80 677) (1 065 203)Other taxation and STC (2 008) (9 123) (11 131) (6 560)Other*** (300) 121 (179) 53 663 Total 1 439 350 (107 220) 358 819 72 539 431 358 2 946 976 Non-headline (40 433)Attributable earnings 390 925
For the year ended 28 February 2009Capitec* 104 311 104 311 1 260 082 Zeder 57 937 (5 200) 70 933 (15 591) 55 342 661 820 Paladin 63 132 65 252 (77 861) (12 609) 559 859 PSG Konsult 774 481 (34 826) 70 868 70 868 276 274 PSG Fund Management 314 840 (9 405) 31 178 21 809 52 987 148 407 PSG Corporate 43 935 (52 100) 43 578 (87 041) (43 463) 420 321
Net fee income** 5 599 12 559 18 158 10 921 Unit trust, hedge fund and
share investments 13 159 (99 600) (86 441) 245 243 BEE investments 24 820 24 820 164 157
Funding 26 400 (4 700) (103 000) (103 000) (969 903)Other taxation and STC (4 180) (35 391) (39 571) 200 Other**** 14 426 10 600 25 026 398 347 Total 1 280 725 (106 231) 293 366 (183 475) 109 891 2 755 407 Non-headline (58 819)Attributable earnings 51 072
* Equity accounted** Net fee income is after the deduction of salaries, operating expenses and taxation.*** Consists mainly of the investments in m Cubed Holdings and Adato Capital.**** Consists mainly of the investments in m Cubed Holdings and Adato Capital, Petmin (sold to Paladin effectively 1 March 2009) and Channel Life (sold).
Comparative figures are consistently presented.
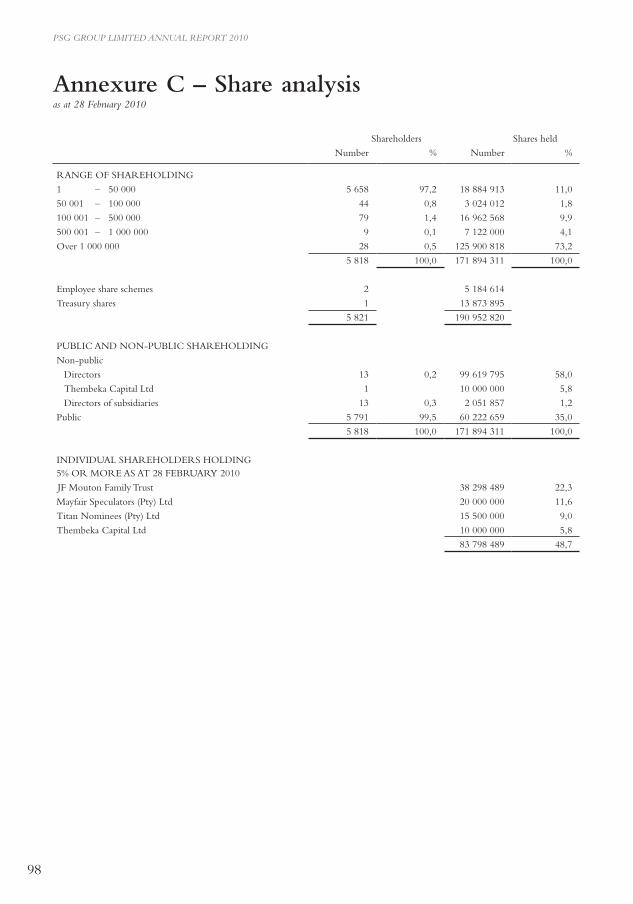
98
PSG GROUP LIMITED ANNUAL REPORT 2010
Annexure C – Share analysisas at 28 February 2010
Shareholders Shares held
Number % Number %
RANGE OF SHAREHOLDING
1 – 50 000 5 658 97,2 18 884 913 11,0
50 001 – 100 000 44 0,8 3 024 012 1,8
100 001 – 500 000 79 1,4 16 962 568 9,9
500 001 – 1 000 000 9 0,1 7 122 000 4,1
Over 1 000 000 28 0,5 125 900 818 73,2
5 818 100,0 171 894 311 100,0
Employee share schemes 2 5 184 614
Treasury shares 1 13 873 895
5 821 190 952 820
PUBLIC AND NON-PUBLIC SHAREHOLDING
Non-public
Directors 13 0,2 99 619 795 58,0
Thembeka Capital Ltd 1 10 000 000 5,8
Directors of subsidiaries 13 0,3 2 051 857 1,2
Public 5 791 99,5 60 222 659 35,0
5 818 100,0 171 894 311 100,0
INDIVIDUAL SHAREHOLDERS HOLDING 5% OR MORE AS AT 28 FEBRUARy 2010
JF Mouton Family Trust 38 298 489 22,3
Mayfair Speculators (Pty) Ltd 20 000 000 11,6
Titan Nominees (Pty) Ltd 15 500 000 9,0
Thembeka Capital Ltd 10 000 000 5,8
83 798 489 48,7
99
PSG GROUP LIMITED ANNUAL REPORT 2010
Notice of annual general meeting
Notice is hereby given of the annual general meeting of shareholders of PSG Group Ltd (“PSG Group” or “the company”) to be held
at The Venue at Webersburg, Webersburg Wines, Annandale Road, Stellenbosch on Friday, 18 June 2010 at 12:00.
AGENDA
1. To receive and consider the annual financial statements of the company and the reports of the directors and the auditor for the
year ended 28 February 2010.
2. Re-election of directors
2.1. To re-elect as director Mr J de V du Toit who retires by rotation in terms of the articles of association of the company and,
being eligible, offers himself for re-election.
Summary curriculum vitae of Jacob de Vos du Toit
Mr Du Toit matriculated in Worcester whereafter he completed his studies at Stellenbosch and Cape Town. After he qualified
as a Chartered Accountant (SA) he started his working career with Trust Building Society in Cape Town as senior general
manager in 1984.
In 1988 he joined SMK as financial director and later as portfolio manager. Mr Du Toit is a co-founder of PSG Group and
still serves as director on the board.
2.2. To re-elect as director Mr JF Mouton, who retires by rotation in terms of the articles of association of the company and,
being eligible, offers himself for re-election.
Summary curriculum vitae of Johannes Fredericus Mouton
Mr Mouton obtained a BComm (Hons) from the University of Stellenbosch (1969) and qualified as a Chartered Accountant
(SA) in 1973.
Mr Mouton is the founder and chairman of PSG Group, executive director of Paladin Capital Ltd, PSG Financial
Services Ltd and PSG Konsult Ltd. He is chairman of Zeder Investments Ltd and a non-executive director of Steinhoff
International Holdings Ltd and KWV.
Mr Mouton also serves as a trustee of trusts and investment funds of Stellenbosch University. Prior to the establishment of
PSG Group, he co-founded and served as managing director of the stockbroking firm SMK.
2.3. To re-elect as director Mr CA Otto, who retires by rotation in terms of the articles of association of the company and, being
eligible, offers himself for re-election.
Summary curriculum vitae of Chris Adriaan Otto
Mr Otto was born in Johannesburg and educated at the University of Stellenbosch (BComm LLB).
He is a co-founder of PSG and has been an executive director of PSG Group since its formation in 1995 until March 2009.
Mr Otto has been directly involved in the establishment of PSG’s investment in micro-finance and subsequent establishment
of Capitec Bank Holdings Ltd of which he has been a director since inception. He has also been responsible for the
establishment of PSG’s investments in the agri sector which culminated in the formation of Zeder Investments Ltd of which
he remains a director. Mr Otto serves on various boards as a non-executive director including PSG Financial Services Ltd,
Capevin Investments Ltd, Zeder Investments Ltd and Kaap Agri Ltd.

100
PSG GROUP LIMITED ANNUAL REPORT 2010
Notice of annual general meeting (continued)
2.4 To re-elect as director Mr JA Holtzhausen, being a new appointment to the board, who retires in terms of the articles of
association of the company and, being eligible, offers himself for re-election.
Summary curriculum vitae of Johannes Andries Holtzhausen
Mr Holtzhausen is a qualified attorney (B.Iuris (cum laude) LLB, HDip Tax). He joined the PSG Group in 1998 and is the
managing director of PSG Capital (Pty) Ltd. He also serves on the boards of Paladin Capital Ltd and various of their investee
companies. He is a member of the PSG Group Exco.
Mr Holtzhausen has been involved in corporate finance since 1995, having implemented numerous corporate finance
transactions and private equity investments.
2.5 To re-elect as director Mr MM du Toit, being a new appointment to the board, who retires in terms of the articles of
association of the company and, being eligible, offers himself for re-election.
Summary curriculum vitae of Matthys Michielse du Toit
Mr Du Toit graduated with a BSc and MBA degree (cum laude). He started his career with Syfrets Managed Assets as
a portfolio manager. He spent six years, of which three were as a director, at George Huysamer & Partners. Mr Du Toit was
a founding member of Coronation Fund Managers Ltd. He held the position of CEO from 1997 to 2007 and grew
Coronation Fund Managers Ltd from a small fund management business to the second largest independent fund manager in
South Africa. Coronation Fund Managers Ltd listed on the JSE in June 2003.
Mr Du Toit is a director of a number of companies, chairman of KWV Holdings Ltd and runs an investment management
business for family offices and select individuals, Rootstock Investment Management (Pty) Ltd.
2.6 To re-elect as director Mr JJ Mouton, who retires by rotation in terms of the articles of association of the company and, being
eligible, offers himself for re-election.
Summary curriculum vitae of Johannes Jacobus Mouton
Mr Mouton obtained an MPhil Finance from the University of Cambridge and holds a BAcc (cum laude) and BAcc (Hons)
from the University of Stellenbosch. He also qualified as a Chartered Accountant (SA).
He joined PSG Group in 2002 and is the manager of the PSG Tanzanite Flexible Fund.
3. To confirm the reappointment of PricewaterhouseCoopers Inc as auditor for the ensuing year on the recommendation of the
PSG Group audit and risk committee.
4. To confirm the auditor’s remuneration for the year ended 28 February 2010 as determined by the PSG Group audit and risk
committee.
5. To consider and, if deemed fit, pass, with or without modification, the following ordinary and special resolutions:
5.1 Ordinary resolution number 1
“Resolved that the unissued shares in the company, limited to 5% of the number of shares in issue at 28 February 2010, be
and are hereby placed under the control of the directors until the next annual general meeting and that they be and are
hereby authorised to issue any such shares as they may deem fit, subject to the Companies Act 61 of 1973 as amended (“the
Companies Act”), the articles of association of the company, and the provisions of the Listings Requirements of the JSE Ltd
(JSE), save that the aforementioned 5% limitation shall not apply to any shares issued in terms of a rights offer.”
101
PSG GROUP LIMITED ANNUAL REPORT 2010
Notice of annual general meeting (continued)
5.2 Ordinary resolution number 2
“Resolved that the directors of the company be and are hereby authorised by way of a general authority, to allot and issue
any of its unissued shares for cash placed under their control as they in their discretion may deem fit, without restriction,
subject to the provisions of the Listings Requirements of the JSE , and subject to the proviso that the aggregate number
of ordinary shares able to be allotted and issued in terms of this resolution, shall be limited to 5% of the issued share capital
at 28 February 2010, provided that:
– the approval shall be valid until the date of the next annual general meeting of the company, provided it shall not extend
beyond 15 months from the date of this resolution;
– a paid press announcement giving full details, including the impact on net asset value and earnings per share, will be
published after any issue representing, on a cumulative basis within any one financial year, 5% or more of the number of
shares in issue prior to such issue;
– the general issues of shares for cash in the aggregate in any one financial year may not exceed 5% of the applicant’s issued
share capital (number of securities) of that class. The securities of a particular class will be aggregated with the securities
that are compulsorily convertible into securities of that class; and, in the case of the issue of compulsorily convertible
securities, aggregated with the securities of that class into which they are compulsorily convertible. The number of
securities of a class which may be issued shall be based on the number of securities of that class in issue at the date of such
application less any securities of the class issued during the current financial year, provided that any securities of that class
to be issued pursuant to a rights issue (announced and irrevocable and underwritten) or acquisition (concluded up to the
date of application) may be included as though they were securities in issue at the date of application;
– in determining the price at which an issue of shares will be made in terms of this authority the maximum discount
permitted will be 10% of the weighted average traded price of such shares, as determined over the 30 trading days prior
to the date that the price of the issue is agreed between the issuer and the party subscribing for the securities. The JSE
should be consulted for a ruling if the applicant’s securities have not traded in such 30 business day period;
– any such issue will only be made to public shareholders as defined in paragraphs 4.25 to 4.27 of the Listings Requirements
of the JSE and not to related parties; and
– any such issue will only be securities of a class already in issue.”
At least 75% of the shareholders present in person or by proxy and entitled to vote at the annual general meeting must cast
their vote in favour of this resolution.
5.3 Special resolution number 1
“Resolved as a special resolution that the company be and is hereby authorised, as a general approval, to repurchase any of the
shares issued by the company, upon such terms and conditions and in such amounts as the directors may from time to time
determine, but subject to the provisions of section 85 to section 88 of the Companies Act, the articles of association of
the company, the Listings Requirements of the JSE and the requirements of any other stock exchange on which the shares
of the company may be quoted or listed, namely that:
– the general repurchase of the shares may only be implemented on the open market of the JSE and done without any prior
understanding or arrangement between the company and the counterparty;
– this general authority shall only be valid until the next annual general meeting of the company, provided that it shall not
extend beyond 15 months from the date of this resolution;
– an announcement must be published as soon as the company has acquired shares constituting, on a cumulative basis,
3% of the number of shares in issue prior to the acquisition, pursuant to which the aforesaid 3% threshold is reached,
containing full details thereof, as well as for each 3% in aggregate of the initial number of shares acquired thereafter;
– the general authority to repurchase is limited to a maximum of 20% in the aggregate in any one financial year of the
company’s issued share capital at the time the authority is granted;
– the general repurchase is authorised by the company’s articles of association;
– repurchases must not be made at a price more than 10% above the weighted average of the market value of the shares for
five business days immediately preceding the date that the transaction is effected. The JSE should be consulted for a ruling
if the applicants securities have not traded in such five business day period;
102
PSG GROUP LIMITED ANNUAL REPORT 2010
Notice of annual general meeting (continued)
– the company will only effect a general repurchase if after the repurchase is effected it still complies with paragraphs 3.37
to 3.41 of the Listings Requirements of the JSE concerning shareholder spread requirements;
– the company may at any point in time only appoint one agent to effect any repurchase(s) on the company’s behalf;
– the company may not effect a repurchase during any prohibited period as defined in terms of the Listings Requirements
of the JSE unless there is a repurchase programme in place as contemplated in terms of 5.72(g) of the Listings
Requirements of the JSE; and
– the company must ensure that its sponsor provides the JSE with the required working capital letters before it commences
the repurchase of any shares.”
5.4 Special resolution number 2
“Resolved as a special resolution that the company, insofar as it may be necessary to do so, hereby approves, as a general
approval, and authorises the acquisition by any subsidiary of the company of shares issued by such subsidiary and/or by
the company, upon such terms and conditions and in such amounts as the directors of such subsidiary/ies may from time to
time determine, but subject to the provisions of section 85 to section 89 of the Companies Act, the articles of association
of the company, the Listings Requirements of the JSE (if listed) and the requirements of any other stock exchange on which
the shares of the acquiree company may be quoted or listed, namely that:
– the general repurchase of shares may only be implemented on the open market of the JSE and done without any prior
understanding or arrangement between the company and the other counterparty;
– this general authority shall only be valid until the next annual general meeting of the company, provided that it shall not
extend beyond 15 months from the date of this resolution;
– an announcement must be published as soon as the subsidiary has acquired shares constituting, on a cumulative basis,
3% of the number of shares of the acquiree company in issue prior to the acquisition, pursuant to which the aforesaid
3% threshold is reached, containing full details thereof, as well as for each 3% in aggregate of the initial number of shares
acquired thereafter;
– this general authority to repurchase is limited to a maximum of 20% in the aggregate in any one financial year of the
acquiree company’s issued share capital at the time the authority is granted, subject to a maximum of 10% in the aggregate
in the event that it is the company’s share capital that is repurchased by a subsidiary;
– the general purchase is authorised by the company’s articles of association;
– repurchases must not be made at a price more than 10% above the weighted average of the market value of the shares
for the five business days immediately preceding the date that the transaction is effected. The JSE should be consulted
for a ruling if the applicants securities have not traded in such five business day period;
– the subsidiary company will only effect a general repurchase if after the repurchase is effected the company still complies
with paragraphs 3.37 to 3.41 of the Listings Requirements of the JSE concerning shareholder spread requirements;
– the company and/or subsidiary may at any point in time only appoint one agent to effect any repurchase(s) on the
subsidiary company’s behalf;
– the subsidiary company may not effect a repurchase during any prohibited period as defined in terms of the Listings
Requirements of the JSE unless there is a repurchase programme in place as contemplated in terms of 5.27(g) of the
Listings Requirements of the JSE; and
– the company must ensure that its sponsor provides the JSE with the required working capital letters before it commences
the repurchase of any shares.”
Reasons for and effects of the special resolutions
1. The reason for and effect of special resolution number 1 is to grant the directors a general authority in terms of the Companies
Act for the acquisition by the company of shares issued by it on the basis reflected in the special resolution.
In terms of the Listings Requirements of the JSE any general repurchase by the company must, inter alia, be limited to a maximum
of 20% of the company’s issued share capital in any one financial year of that class at the time the authority is granted.
103
PSG GROUP LIMITED ANNUAL REPORT 2010
Notice of annual general meeting (continued)
2. The reason for and effect of special resolution number 2 is to grant the board of directors of any subsidiary of the company
a general authority to acquire shares issued by such subsidiary and/or by the company on the basis reflected in the special resolution.
In terms of the Listings Requirements of the JSE, any general purchase by a subsidiary of shares must, inter alia, be limited to
a maximum of 20% of the issued share capital of the acquiree company in any one financial year of that class at the time the
authority is granted, subject to a maximum of 10% in the event that it is the company’s share capital that is repurchased by
a subsidiary.
3. The directors of the company or its subsidiaries will only utilise the general authority to purchase shares of the company and/or
the subsidiary as set out in special resolutions 1 and 2 to the extent that the directors, after considering the maximum shares
to be purchased, are of the opinion that the company and its subsidiaries’ (“PSG Group”) position would not be compromised as
to the following:
– the PSG Group’s ability in the ordinary course of business to pay its debts for a period of 12 months after the date of the
notice of the annual general meeting;
– the consolidated assets of the PSG Group will be in excess of the consolidated liabilities of the PSG Group. The assets and
liabilities should be recognised and measured in accordance with the accounting policies used in the latest audited annual
financial statements of the PSG Group;
– the ordinary capital and reserves of the PSG Group after the purchase will remain adequate for the purpose of the business
of the PSG Group for a period of 12 months after the date of the notice of the annual general meeting; and
– the working capital available to the PSG Group after the purchase will be sufficient for the PSG Group’s requirements for
a period of two months after the date of the notice of the annual general meeting.
Information relating to the special resolutions
1. General information in respect of directors (page 10), major shareholders (page 98), directors’ interest in securities and material
changes (page 28) and the share capital of the company (page 66) is contained in the annual report to which this notice is attached.
2. The company is not involved in any legal or arbitration proceedings, nor are any proceedings pending or threatened of which the
company is aware that may have or have had in the previous 12 months, a material effect on the company’s financial position.
3. The directors, whose names are on page 10 of the annual report to which this notice is attached, collectively and individually
accept full responsibility for the accuracy of the information given and certify that to the best of their knowledge and belief there
are no facts that have been omitted which would make any statement false or misleading, and that all reasonable enquiries to
ascertain such facts that have been made and that the notice contains all information required by the Listings Requirements
of the JSE.
4. Special resolutions 1 and 2 are renewals of resolutions taken at the previous annual general meeting on 19 June 2009.
VOTING
Shareholders entitled to attend and vote at the annual general meeting may appoint one or more proxies to attend, speak and vote
thereat in their stead. A proxy need not be a member of the company. A form of proxy, in which the relevant instructions for its
completion are set out, is enclosed for the use of a certificated shareholder or own-name registered dematerialised shareholder who
wishes to be represented at the annual general meeting. Completion of a form of proxy will not preclude such shareholder from
attending and voting (in preference to that shareholder’s proxy) at the annual general meeting.
The instrument appointing a proxy and the authority (if any) under which it is signed must reach the transfer secretaries of the company
at the address given below by no later than 12:00 on Tuesday, 15 June 2010.
104
PSG GROUP LIMITED ANNUAL REPORT 2010
Notice of annual general meeting (continued)
Dematerialised shareholders, other than own-name registered dematerialised shareholders, who wish to attend the annual general
meeting in person will need to request their Central Securities Depository Participant (CSDP) or broker to provide them with the
necessary authority in terms of the custody agreement entered into between such shareholders and the CSDP or broker.
On a poll, ordinary shareholders will have one vote in respect of each share held. Dematerialised shareholders, other than own-name
registered dematerialised shareholders, who are unable to attend the annual general meeting and who wish to be represented thereat,
must provide their CSDP or broker with their voting instructions in terms of the custody agreement entered into between themselves
and the CSDP or broker in the manner and time stipulated therein.
By order of the board
PSG Corporate Services (Pty) Ltd
Company secretary
19 May 2010
Stellenbosch
Registered office
PSG Group Ltd
Ou Kollege
35 Kerk Street
Stellenbosch, 7600
(PO Box 7403, Stellenbosch, 7599)
Transfer secretaries
Computershare Investor Services (Pty) Ltd
Ground Floor
70 Marshall Street
Johannesburg, 2001
(PO Box 61051, Marshalltown, 2107)
105
PSG GROUP LIMITED ANNUAL REPORT 2010
PSG Financial Services Limited
PSG FINANCIAL SERVICES LIMITED ANNUAL REPORT 2010
106
Annual financial statementsPSG Financial Services Limited
Approval of annual financial statements 107
Independent auditor’s report 108
Declaration by the company secretary 108
Directors’ report 109
Statement of financial position 110
Income statement 111
Statement of comprehensive income 111
Statement of changes in equity 112
Statement of cash flows 113
Accounting policies 114
Notes to the annual financial statements 115
Annexure A – Investments
• Investment in subsidiaries 126
• Investment in associated companies 126
• Financial information in respect of principal associated companies 126
Annexure B – Preference share analysis 127
Contents
PSG FINANCIAL SERVICES LIMITED ANNUAL REPORT 2010
107
Approval of annual financial statements
The directors are responsible for the maintenance of adequate accounting records and to prepare annual financial statements that fairly represent the state of affairs and the results of the company. The external auditors are responsible for independently auditing and reporting on the fair presentation of these annual financial statements. Management fulfils this responsibility primarily by establishing and maintaining accounting systems and practices adequately supported by internal accounting controls. Such controls provide assurance that the company’s assets are safeguarded, that transactions are executed in accordance with management’s authorisations and that the financial records are reliable. The annual financial statements are prepared in accordance with International Financial Reporting Standards (IFRS) and incorporate full and reasonable disclosure. Appropriate and recognised accounting policies are consistently applied.
The external auditor has unrestricted access to all records, assets and personnel of the company.
The company is classified as a widely held company in terms of the Companies Act, but has not appointed an audit committee since the functions in terms of section 270A(1) of the Act are performed on its behalf by the audit committee of its holding company. The audit committee of the holding company has confirmed to the directors of the company that these functions have been performed without any exceptions noted in relation to the financial statements and that they are satisfied that the auditor was independent of the company.
The financial statements are prepared on the going concern basis, since the directors have every reason to believe that the company has adequate resources to continue for the foreseeable future.
The financial statements set out on pages 109 to 127 were approved by the board of directors of PSG Financial Services Ltd and are signed on its behalf by:
JF Mouton WL GreeffChairman Financial director
19 May 2010Stellenbosch
PSG FINANCIAL SERVICES LIMITED ANNUAL REPORT 2010
108
Independent auditor’s reportto the members of PSG Financial Services Ltd
We have audited the annual financial statements of PSG Financial Services Ltd, which comprise the statement of financial position as at 28 February 2010, and the income statement, statements of comprehensive income, changes in equity and cash flows for the year then ended, and a summary of significant accounting policies and other explanatory notes, and the directors’ report, as set out on pages 109 to 127.
Directors’ responsibility for the financial statementsThe company’s directors are responsible for the preparation and fair presentation of these financial statements in accordance with International Financial Reporting Standards and in the manner required by the Companies Act of South Africa. This responsibility includes: designing, implementing and maintaining internal control relevant to the preparation and fair presentation of financial statements that are free from material misstatement, whether due to fraud or error; selecting and applying appropriate accounting policies; and making accounting estimates that are reasonable in the circumstances.
Auditor’s responsibilityOur responsibility is to express an opinion on these financial statements based on our audit. We conducted our audit in accordance with International Standards on Auditing. Those standards require that we comply with ethical requirements and plan and perform the audit to obtain reasonable assurance whether the financial statements are free from material misstatement.
An audit involves performing procedures to obtain audit evidence about the amounts and disclosures in the financial statements. The procedures selected depend on the auditor’s judgement, including the assessment of the risks of material misstatement of the financial statements, whether due to fraud or error. In making those risk assessments, the auditor considers internal control relevant to the entity’s preparation and fair presentation of the financial statements in order to design audit procedures that are appropriate in the circumstances, but not for the purpose of expressing an opinion on the effectiveness of the entity’s internal control. An audit also includes evaluating the appropriateness of accounting policies used and the reasonableness of accounting estimates made by management, as well as evaluating the overall presentation of the financial statements.
We believe that the audit evidence we have obtained is sufficient and appropriate to provide a basis for our audit opinion.
OpinionIn our opinion, the financial statements present fairly, in all material respects, the financial position of PSG Financial Services Ltd as at 28 February 2010, and its financial performance and its cash flows for the year then ended in accordance with International Financial Reporting Standards and in the manner required by the Companies Act of South Africa.
PricewaterhouseCoopers Inc. Director: HD NelRegistered auditor
19 May 2010Cape Town
Declaration by the company secretary
We declare that, to the best of our knowledge, the company has lodged with the Registrar all such returns as are required of a public company in terms of the Companies Act and that all such returns are true, correct and up to date.
PSG Corporate Services (Pty) LtdPer CJ SiertsemaCompany secretary
19 May 2010Stellenbosch
PSG FINANCIAL SERVICES LIMITED ANNUAL REPORT 2010
109
Directors’ report
NATURE OF BUSINESSThe company’s subsidiaries and associated entities offer diversified financial services.
OPERATING RESULTSThe operating results and the state of affairs of the company are fully set out in the attached statement of financial position, income statement and notes thereto. The company’s earnings attributable to shareholders amounted to R250,4 million (2009: R185,9 million).
SHARE CAPITALDetails of the authorised and issued share capital appear in note 8 to the financial statements.
DIVIDENDSOrdinaryDividends paid during the year amounted to R99 million (2009: R217 million).
PreferenceThe directors have declared the following dividends in respect of the cumulative, non-redeemable, non-participating preference shares for the year ended 28 February 2010:
Cents per share 2010 2009
Interim 450,4 571,1Final 390,5 563,6Total 840,9 1 134,7
DIRECTORSThe directors of the company at the date of this report appear on page 10. Since the date of the previous report, Mr MM (Thys) du Toit was appointed as an independent non-executive director with effect from 29 September 2009 and Mr JA (Johan) Holtzhausen as a non-executive director with effect from 13 May 2010.
HOLDING COMPANYThe company is a wholly owned subsidiary of PSG Group Ltd, except for the 6 079 738 (2009: 6 079 738) preference shares which are listed on the JSE Ltd.
SHAREHOLDING OF DIRECTORSThe shareholding of directors in the preference share capital of the company as at 28 February 2010 was as follows:
Total Total Beneficial Non-beneficial shareholding 2010 shareholding 2009
Direct Indirect Direct Indirect Number % Number %
L van A Bellingan 50 000 30 000 80 000 1,3 80 000 1,3J de V du Toit 52 632 52 632 0,9 52 632 0,9MJ Jooste 350 000 350 000 5,8 350 000 5,8Dr J van Zyl Smit 50 000 0,8
– 50 000 – 432 632 482 632 8,0 532 632 8,8
There were no changes to directors’ shareholding since the year-end and the date of this report.
SECRETARYThe secretary of the company is PSG Corporate Services (Pty) Ltd. The business and postal addresses are shown on page 132.
EVENTS SUBSEQUENT TO YEAR-ENDSubsequent to year-end, the company raised a further R200 million in listed perpetual preference shares.
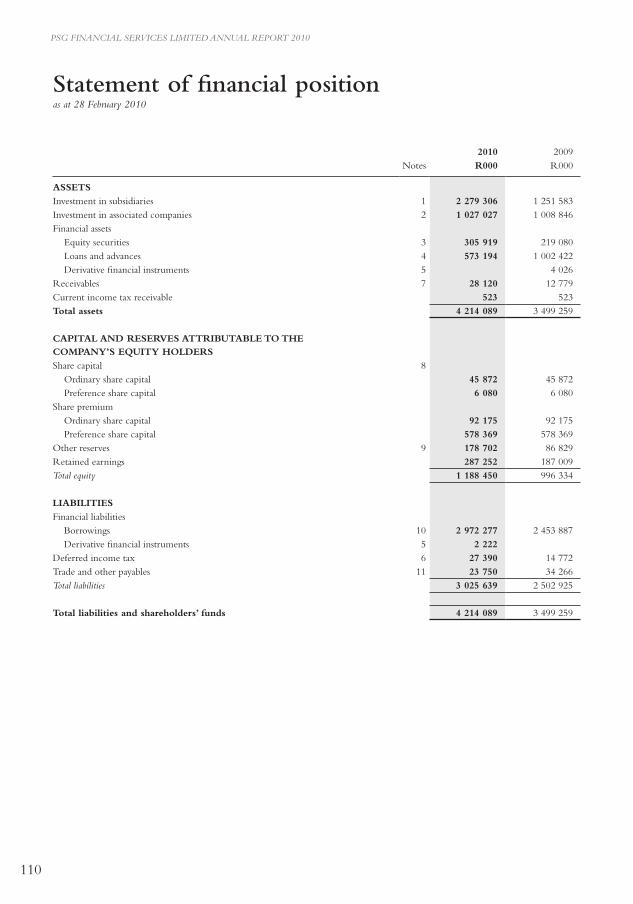
PSG FINANCIAL SERVICES LIMITED ANNUAL REPORT 2010
110
Statement of financial positionas at 28 February 2010
2010 2009Notes R000 R000
ASSETSInvestment in subsidiaries 1 2 279 306 1 251 583 Investment in associated companies 2 1 027 027 1 008 846 Financial assets
Equity securities 3 305 919 219 080 Loans and advances 4 573 194 1 002 422 Derivative financial instruments 5 4 026
Receivables 7 28 120 12 779 Current income tax receivable 523 523 Total assets 4 214 089 3 499 259
CAPITAL AND RESERVES ATTRIBUTABLE TO THE COMPANY’S EQUITY HOLDERSShare capital 8
Ordinary share capital 45 872 45 872 Preference share capital 6 080 6 080
Share premiumOrdinary share capital 92 175 92 175 Preference share capital 578 369 578 369
Other reserves 9 178 702 86 829 Retained earnings 287 252 187 009 Total equity 1 188 450 996 334
LIABILITIESFinancial liabilities
Borrowings 10 2 972 277 2 453 887 Derivative financial instruments 5 2 222
Deferred income tax 6 27 390 14 772 Trade and other payables 11 23 750 34 266 Total liabilities 3 025 639 2 502 925
Total liabilities and shareholders’ funds 4 214 089 3 499 259
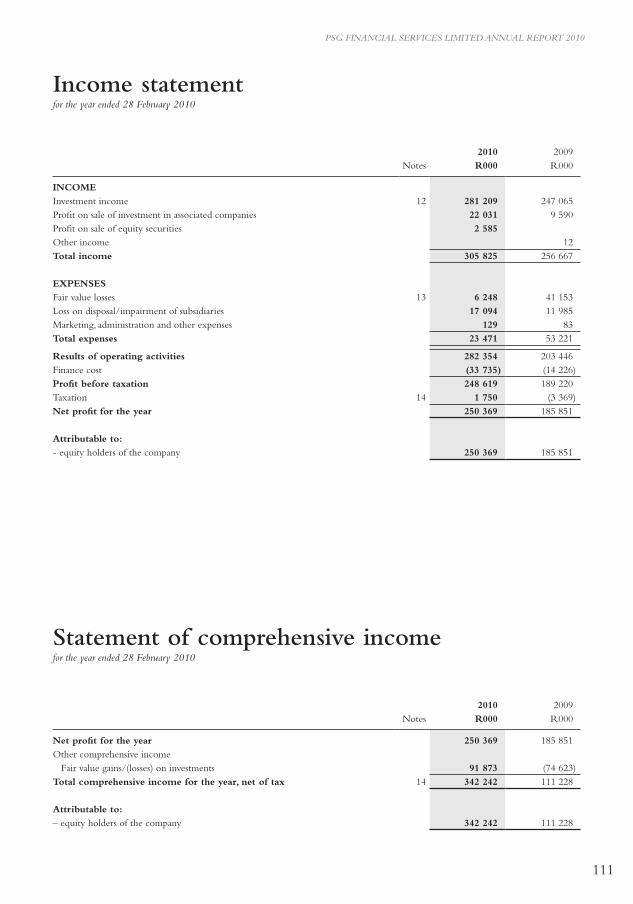
PSG FINANCIAL SERVICES LIMITED ANNUAL REPORT 2010
111
Income statementfor the year ended 28 February 2010
Statement of comprehensive incomefor the year ended 28 February 2010
2010 2009Notes R000 R000
INCOMEInvestment income 12 281 209 247 065 Profit on sale of investment in associated companies 22 031 9 590 Profit on sale of equity securities 2 585 Other income 12 Total income 305 825 256 667
ExPENSESFair value losses 13 6 248 41 153 Loss on disposal/impairment of subsidiaries 17 094 11 985 Marketing, administration and other expenses 129 83 Total expenses 23 471 53 221
Results of operating activities 282 354 203 446 Finance cost (33 735) (14 226) Profit before taxation 248 619 189 220 Taxation 14 1 750 (3 369) Net profit for the year 250 369 185 851
Attributable to:- equity holders of the company 250 369 185 851
2010 2009Notes R000 R000
Net profit for the year 250 369 185 851 Other comprehensive income Fair value gains/(losses) on investments 91 873 (74 623)Total comprehensive income for the year, net of tax 14 342 242 111 228
Attributable to:– equity holders of the company 342 242 111 228
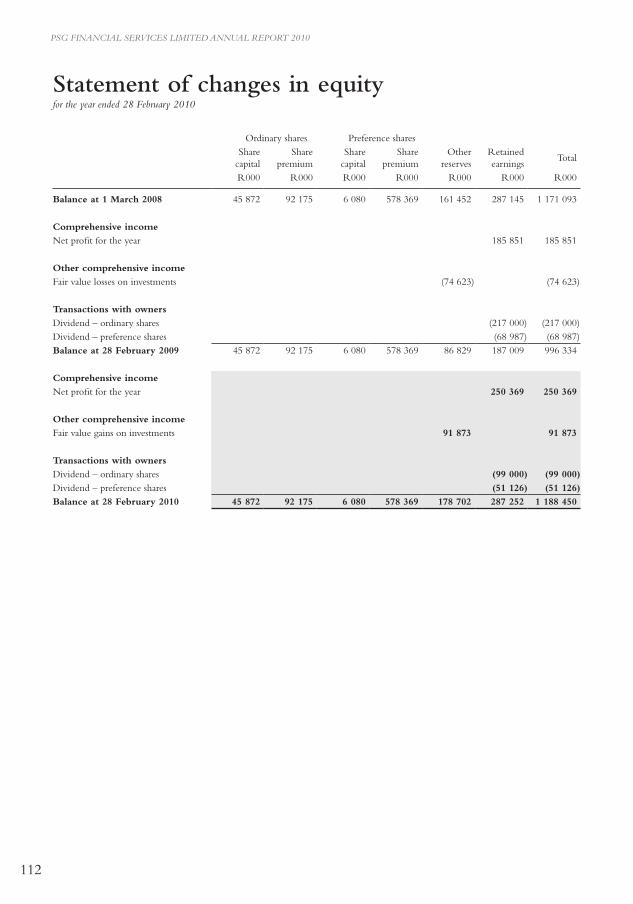
PSG FINANCIAL SERVICES LIMITED ANNUAL REPORT 2010
112
Statement of changes in equityfor the year ended 28 February 2010
Ordinary shares Preference sharesShare
capitalShare
premiumShare
capitalShare
premiumOther
reservesRetained earnings
Total
R000 R000 R000 R000 R000 R000 R000
Balance at 1 March 2008 45 872 92 175 6 080 578 369 161 452 287 145 1 171 093
Comprehensive incomeNet profit for the year 185 851 185 851
Other comprehensive incomeFair value losses on investments (74 623) (74 623)
Transactions with ownersDividend – ordinary shares (217 000) (217 000) Dividend – preference shares (68 987) (68 987) Balance at 28 February 2009 45 872 92 175 6 080 578 369 86 829 187 009 996 334
Comprehensive incomeNet profit for the year 250 369 250 369
Other comprehensive incomeFair value gains on investments 91 873 91 873
Transactions with ownersDividend – ordinary shares (99 000) (99 000)Dividend – preference shares (51 126) (51 126)Balance at 28 February 2010 45 872 92 175 6 080 578 369 178 702 287 252 1 188 450
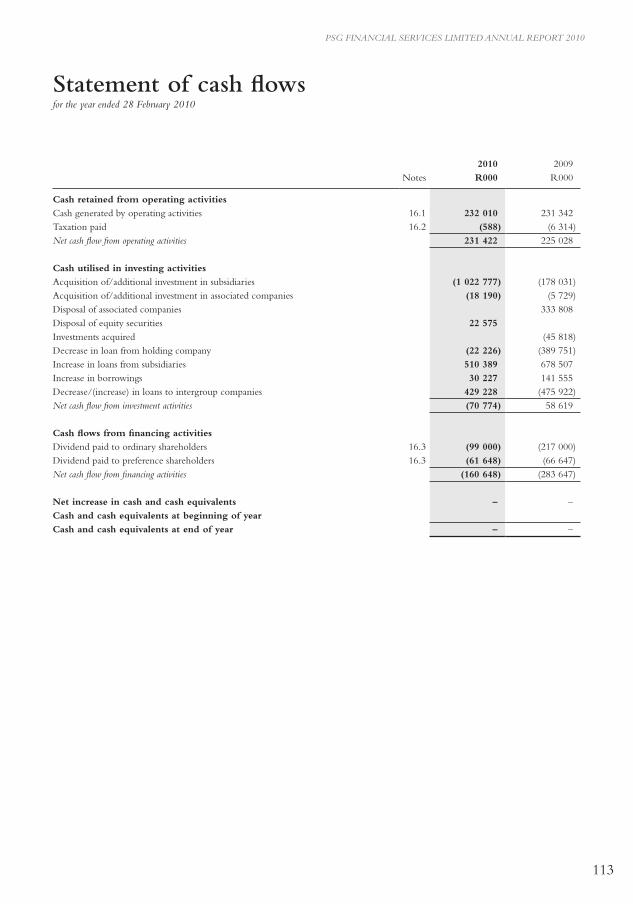
PSG FINANCIAL SERVICES LIMITED ANNUAL REPORT 2010
113
2010 2009Notes R000 R000
Cash retained from operating activitiesCash generated by operating activities 16.1 232 010 231 342 Taxation paid 16.2 (588) (6 314)Net cash flow from operating activities 231 422 225 028
Cash utilised in investing activitiesAcquisition of/additional investment in subsidiaries (1 022 777) (178 031)Acquisition of/additional investment in associated companies (18 190) (5 729)Disposal of associated companies 333 808 Disposal of equity securities 22 575 Investments acquired (45 818)Decrease in loan from holding company (22 226) (389 751)Increase in loans from subsidiaries 510 389 678 507 Increase in borrowings 30 227 141 555 Decrease/(increase) in loans to intergroup companies 429 228 (475 922)Net cash flow from investment activities (70 774) 58 619
Cash flows from financing activitiesDividend paid to ordinary shareholders 16.3 (99 000) (217 000)Dividend paid to preference shareholders 16.3 (61 648) (66 647)Net cash flow from financing activities (160 648) (283 647)
Net increase in cash and cash equivalents – –Cash and cash equivalents at beginning of yearCash and cash equivalents at end of year – –
Statement of cash flowsfor the year ended 28 February 2010
PSG FINANCIAL SERVICES LIMITED ANNUAL REPORT 2010
114
Accounting policies
The principal accounting policies applied in the preparation of these financial statements are the same as those of PSG Group Ltd, as set out in the accounting policies of the PSG Group Ltd consolidated financial statements. These policies have been consistently applied to all the years presented. BASIS OF PREPARATIONThe company has prepared these stand-alone financial statements only, as the company is the only significant asset of PSG Group Ltd. The consolidated financial statements of the company are therefore very similar to PSG Group Ltd’s consolidated financial statements which are included on pages 27 to 98.
The company has also prepared consolidated financial statements in accordance with International Financial Reporting Standards (IFRS) for the company and its subsidiaries (the “PSL Group”). In the consolidated financial statements, subsidiary undertakings – those companies in which the PSL Group, directly or indirectly, has an interest of more than half of the voting rights or otherwise has power to exercise control over the operations – have been fully consolidated. The consolidated financial statements can be obtained from the registered office.
Users of these stand-alone financial statements should read them together with the PSG Group Ltd’s financial statements or the PSL Group’s consolidated financial statements as at and for the year ended 28 February 2010 in order to obtain full information on the financial position, results of operations and changes in financial position of the PSL Group as a whole.
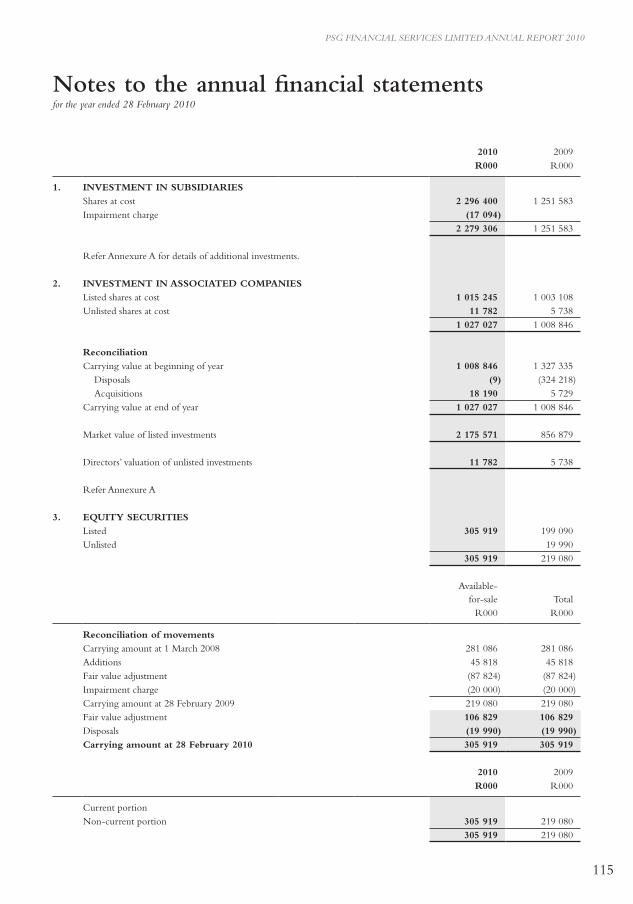
PSG FINANCIAL SERVICES LIMITED ANNUAL REPORT 2010
115
Notes to the annual financial statementsfor the year ended 28 February 2010
2010 2009R000 R000
1. INVESTMENT IN SUBSIDIARIESShares at cost 2 296 400 1 251 583 Impairment charge (17 094)
2 279 306 1 251 583
Refer Annexure A for details of additional investments.
2. INVESTMENT IN ASSOCIATED COMPANIESListed shares at cost 1 015 245 1 003 108 Unlisted shares at cost 11 782 5 738
1 027 027 1 008 846
ReconciliationCarrying value at beginning of year 1 008 846 1 327 335
Disposals (9) (324 218) Acquisitions 18 190 5 729
Carrying value at end of year 1 027 027 1 008 846
Market value of listed investments 2 175 571 856 879
Directors’ valuation of unlisted investments 11 782 5 738
Refer Annexure A
3. EQUITY SECURITIESListed 305 919 199 090 Unlisted 19 990
305 919 219 080
Available-for-sale Total
R000 R000
Reconciliation of movementsCarrying amount at 1 March 2008 281 086 281 086 Additions 45 818 45 818 Fair value adjustment (87 824) (87 824) Impairment charge (20 000) (20 000) Carrying amount at 28 February 2009 219 080 219 080 Fair value adjustment 106 829 106 829Disposals (19 990) (19 990) Carrying amount at 28 February 2010 305 919 305 919
2010 2009R000 R000
Current portionNon-current portion 305 919 219 080
305 919 219 080
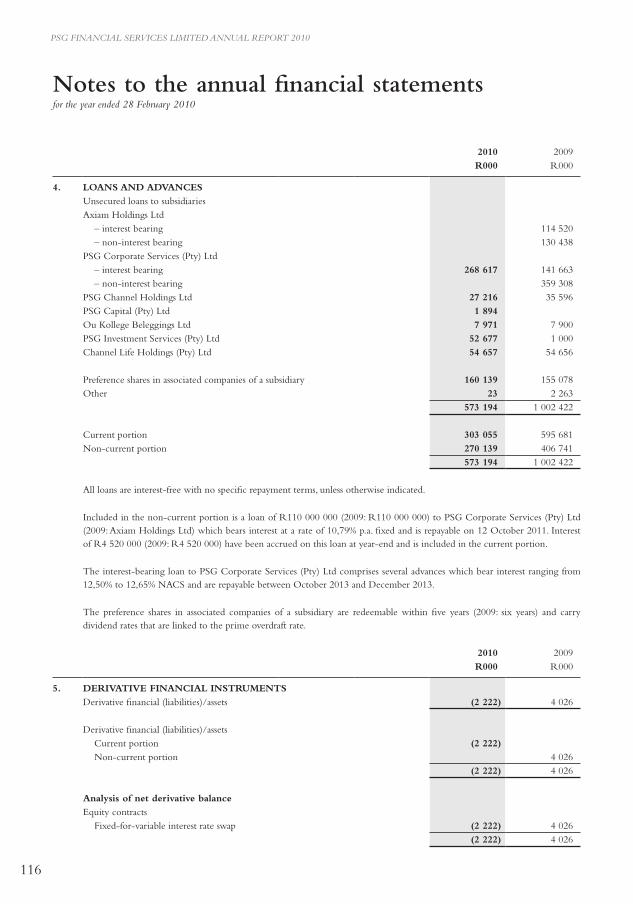
PSG FINANCIAL SERVICES LIMITED ANNUAL REPORT 2010
116
Notes to the annual financial statementsfor the year ended 28 February 2010
2010 2009R000 R000
4. LOANS AND ADVANCESUnsecured loans to subsidiariesAxiam Holdings Ltd
– interest bearing 114 520 – non-interest bearing 130 438
PSG Corporate Services (Pty) Ltd– interest bearing 268 617 141 663 – non-interest bearing 359 308
PSG Channel Holdings Ltd 27 216 35 596 PSG Capital (Pty) Ltd 1 894 Ou Kollege Beleggings Ltd 7 971 7 900 PSG Investment Services (Pty) Ltd 52 677 1 000 Channel Life Holdings (Pty) Ltd 54 657 54 656
Preference shares in associated companies of a subsidiary 160 139 155 078 Other 23 2 263
573 194 1 002 422
Current portion 303 055 595 681 Non-current portion 270 139 406 741
573 194 1 002 422
All loans are interest-free with no specific repayment terms, unless otherwise indicated.
Included in the non-current portion is a loan of R110 000 000 (2009: R110 000 000) to PSG Corporate Services (Pty) Ltd (2009: Axiam Holdings Ltd) which bears interest at a rate of 10,79% p.a. fixed and is repayable on 12 October 2011. Interest of R4 520 000 (2009: R4 520 000) have been accrued on this loan at year-end and is included in the current portion.
The interest-bearing loan to PSG Corporate Services (Pty) Ltd comprises several advances which bear interest ranging from 12,50% to 12,65% NACS and are repayable between October 2013 and December 2013.
The preference shares in associated companies of a subsidiary are redeemable within five years (2009: six years) and carry dividend rates that are linked to the prime overdraft rate.
2010 2009R000 R000
5. DERIVATIVE FINANCIAL INSTRUMENTSDerivative financial (liabilities)/assets (2 222) 4 026
Derivative financial (liabilities)/assetsCurrent portion (2 222)Non-current portion 4 026
(2 222) 4 026
Analysis of net derivative balanceEquity contracts
Fixed-for-variable interest rate swap (2 222) 4 026 (2 222) 4 026
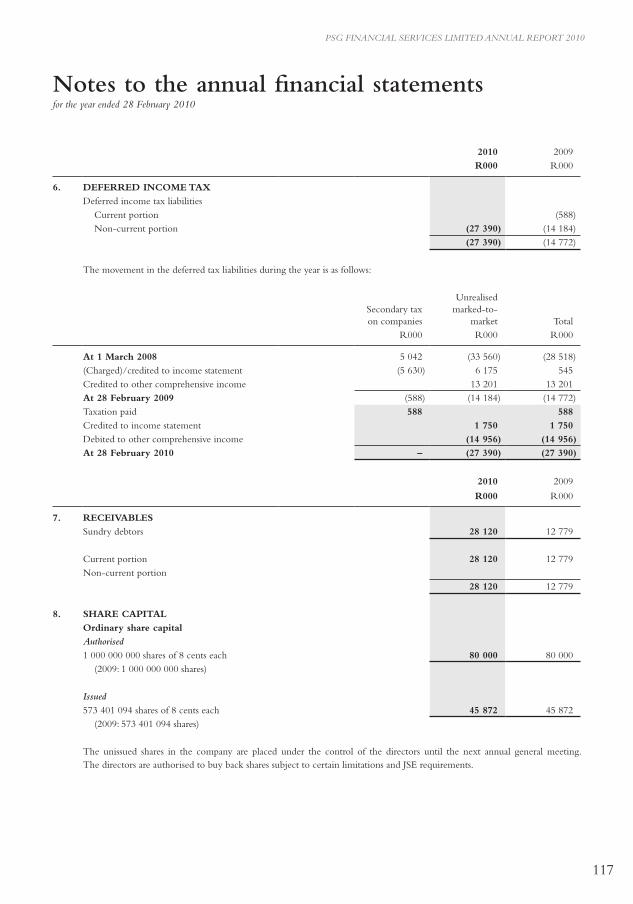
PSG FINANCIAL SERVICES LIMITED ANNUAL REPORT 2010
117
Notes to the annual financial statementsfor the year ended 28 February 2010
2010 2009R000 R000
6. DEFERRED INCOME TAxDeferred income tax liabilities
Current portion (588) Non-current portion (27 390) (14 184)
(27 390) (14 772)
The movement in the deferred tax liabilities during the year is as follows:
Secondary tax on companies
Unrealised marked-to-
market TotalR000 R000 R000
At 1 March 2008 5 042 (33 560) (28 518) (Charged)/credited to income statement (5 630) 6 175 545 Credited to other comprehensive income 13 201 13 201 At 28 February 2009 (588) (14 184) (14 772) Taxation paid 588 588Credited to income statement 1 750 1 750Debited to other comprehensive income (14 956) (14 956)At 28 February 2010 – (27 390) (27 390)
2010 2009
R000 R000
7. RECEIVABLESSundry debtors 28 120 12 779
Current portion 28 120 12 779 Non-current portion
28 120 12 779
8. SHARE CAPITALOrdinary share capitalAuthorised
1 000 000 000 shares of 8 cents each 80 000 80 000 (2009: 1 000 000 000 shares)
Issued
573 401 094 shares of 8 cents each 45 872 45 872 (2009: 573 401 094 shares)
The unissued shares in the company are placed under the control of the directors until the next annual general meeting. The directors are authorised to buy back shares subject to certain limitations and JSE requirements.
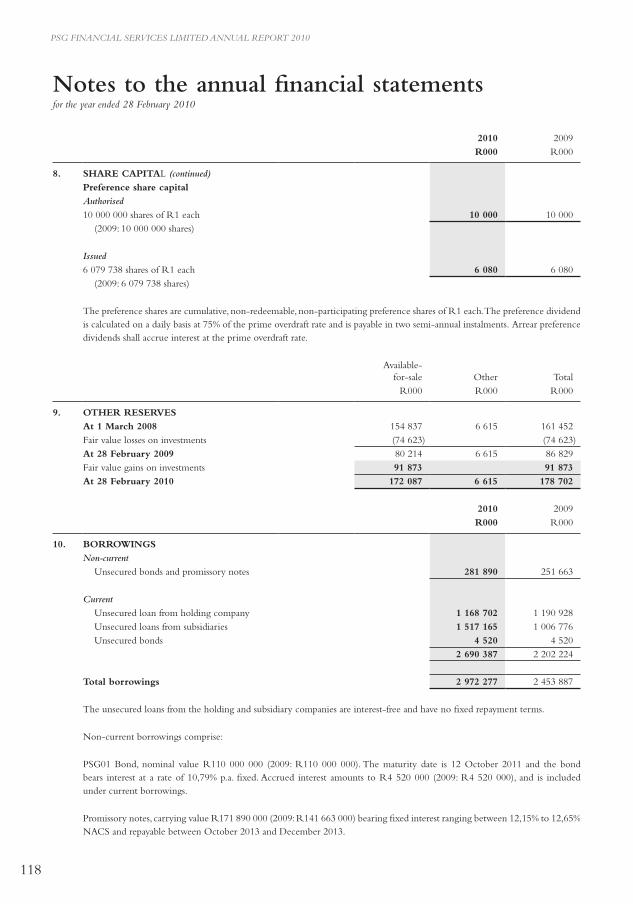
PSG FINANCIAL SERVICES LIMITED ANNUAL REPORT 2010
118
Notes to the annual financial statementsfor the year ended 28 February 2010
2010 2009R000 R000
8. SHARE CAPITAL (continued)
Preference share capitalAuthorised
10 000 000 shares of R1 each 10 000 10 000 (2009: 10 000 000 shares)
Issued
6 079 738 shares of R1 each 6 080 6 080 (2009: 6 079 738 shares)
The preference shares are cumulative, non-redeemable, non-participating preference shares of R1 each. The preference dividend is calculated on a daily basis at 75% of the prime overdraft rate and is payable in two semi-annual instalments. Arrear preference dividends shall accrue interest at the prime overdraft rate.
Available-for-sale Other Total
R000 R000 R000
9. OTHER RESERVESAt 1 March 2008 154 837 6 615 161 452 Fair value losses on investments (74 623) (74 623)At 28 February 2009 80 214 6 615 86 829 Fair value gains on investments 91 873 91 873At 28 February 2010 172 087 6 615 178 702
2010 2009R000 R000
10. BORROWINGSNon-current
Unsecured bonds and promissory notes 281 890 251 663
Current
Unsecured loan from holding company 1 168 702 1 190 928 Unsecured loans from subsidiaries 1 517 165 1 006 776 Unsecured bonds 4 520 4 520
2 690 387 2 202 224
Total borrowings 2 972 277 2 453 887
The unsecured loans from the holding and subsidiary companies are interest-free and have no fixed repayment terms.
Non-current borrowings comprise:
PSG01 Bond, nominal value R110 000 000 (2009: R110 000 000). The maturity date is 12 October 2011 and the bond bears interest at a rate of 10,79% p.a. fixed. Accrued interest amounts to R4 520 000 (2009: R4 520 000), and is included under current borrowings.
Promissory notes, carrying value R171 890 000 (2009: R141 663 000) bearing fixed interest ranging between 12,15% to 12,65% NACS and repayable between October 2013 and December 2013.
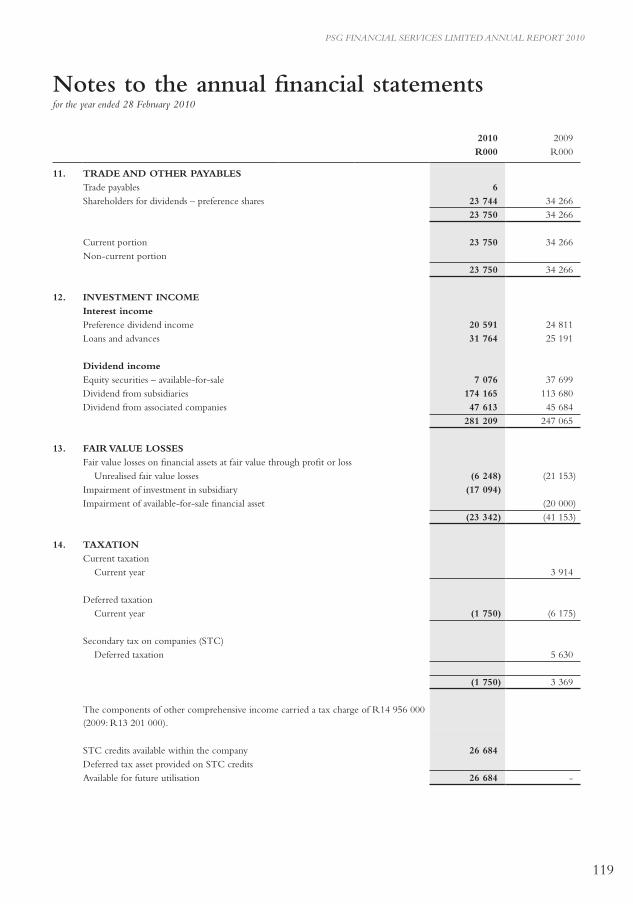
PSG FINANCIAL SERVICES LIMITED ANNUAL REPORT 2010
119
Notes to the annual financial statementsfor the year ended 28 February 2010
2010 2009R000 R000
11. TRADE AND OTHER PAYABLESTrade payables 6 Shareholders for dividends – preference shares 23 744 34 266
23 750 34 266
Current portion 23 750 34 266 Non-current portion
23 750 34 266
12. INVESTMENT INCOMEInterest income Preference dividend income 20 591 24 811 Loans and advances 31 764 25 191
Dividend incomeEquity securities – available-for-sale 7 076 37 699 Dividend from subsidiaries 174 165 113 680 Dividend from associated companies 47 613 45 684
281 209 247 065
13. FAIR VALUE LOSSESFair value losses on financial assets at fair value through profit or loss
Unrealised fair value losses (6 248) (21 153) Impairment of investment in subsidiary (17 094) Impairment of available-for-sale financial asset (20 000)
(23 342) (41 153)
14. TAxATIONCurrent taxation
Current year 3 914
Deferred taxationCurrent year (1 750) (6 175)
Secondary tax on companies (STC)Deferred taxation 5 630
(1 750) 3 369
The components of other comprehensive income carried a tax charge of R14 956 000 (2009: R13 201 000).
STC credits available within the company 26 684Deferred tax asset provided on STC creditsAvailable for future utilisation 26 684 -
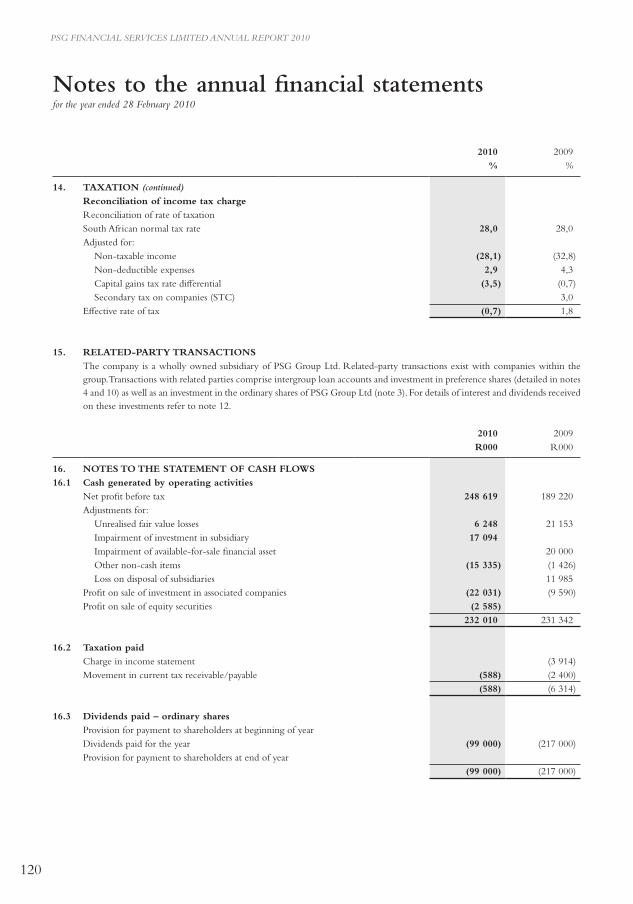
PSG FINANCIAL SERVICES LIMITED ANNUAL REPORT 2010
120
Notes to the annual financial statementsfor the year ended 28 February 2010
2010 2009% %
14. TAxATION (continued)Reconciliation of income tax chargeReconciliation of rate of taxationSouth African normal tax rate 28,0 28,0 Adjusted for:
Non-taxable income (28,1) (32,8)Non-deductible expenses 2,9 4,3 Capital gains tax rate differential (3,5) (0,7)Secondary tax on companies (STC) 3,0
Effective rate of tax (0,7) 1,8
15. RELATED-PARTY TRANSACTIONSThe company is a wholly owned subsidiary of PSG Group Ltd. Related-party transactions exist with companies within the group. Transactions with related parties comprise intergroup loan accounts and investment in preference shares (detailed in notes 4 and 10) as well as an investment in the ordinary shares of PSG Group Ltd (note 3). For details of interest and dividends received on these investments refer to note 12.
2010 2009R000 R000
16. NOTES TO THE STATEMENT OF CASH FLOWS16.1 Cash generated by operating activities
Net profit before tax 248 619 189 220 Adjustments for:
Unrealised fair value losses 6 248 21 153 Impairment of investment in subsidiary 17 094 Impairment of available-for-sale financial asset 20 000 Other non-cash items (15 335) (1 426)Loss on disposal of subsidiaries 11 985
Profit on sale of investment in associated companies (22 031) (9 590)Profit on sale of equity securities (2 585)
232 010 231 342
16.2 Taxation paidCharge in income statement (3 914)Movement in current tax receivable/payable (588) (2 400)
(588) (6 314)
16.3 Dividends paid – ordinary sharesProvision for payment to shareholders at beginning of yearDividends paid for the year (99 000) (217 000)Provision for payment to shareholders at end of year
(99 000) (217 000)
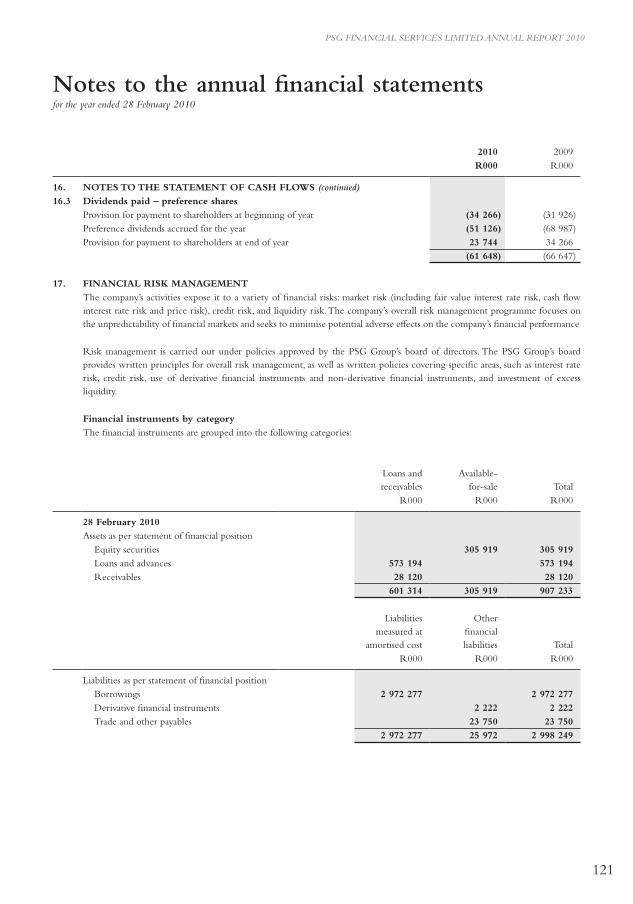
PSG FINANCIAL SERVICES LIMITED ANNUAL REPORT 2010
121
Notes to the annual financial statementsfor the year ended 28 February 2010
2010 2009R000 R000
16. NOTES TO THE STATEMENT OF CASH FLOWS (continued)16.3 Dividends paid – preference shares
Provision for payment to shareholders at beginning of year (34 266) (31 926)Preference dividends accrued for the year (51 126) (68 987)Provision for payment to shareholders at end of year 23 744 34 266
(61 648) (66 647)
17. FINANCIAL RISK MANAGEMENTThe company’s activities expose it to a variety of financial risks: market risk (including fair value interest rate risk, cash flow interest rate risk and price risk), credit risk, and liquidity risk. The company’s overall risk management programme focuses on the unpredictability of financial markets and seeks to minimise potential adverse effects on the company’s financial performance.
Risk management is carried out under policies approved by the PSG Group’s board of directors. The PSG Group’s board provides written principles for overall risk management, as well as written policies covering specific areas, such as interest rate risk, credit risk, use of derivative financial instruments and non-derivative financial instruments, and investment of excess liquidity.
Financial instruments by categoryThe financial instruments are grouped into the following categories:
Loans and receivables
Available-for-sale Total
R000 R000 R000
28 February 2010Assets as per statement of financial position
Equity securities 305 919 305 919Loans and advances 573 194 573 194 Receivables 28 120 28 120
601 314 305 919 907 233
Liabilities measured at
amortised cost
Other financial liabilities Total
R000 R000 R000
Liabilities as per statement of financial positionBorrowings 2 972 277 2 972 277 Derivative financial instruments 2 222 2 222 Trade and other payables 23 750 23 750
2 972 277 25 972 2 998 249
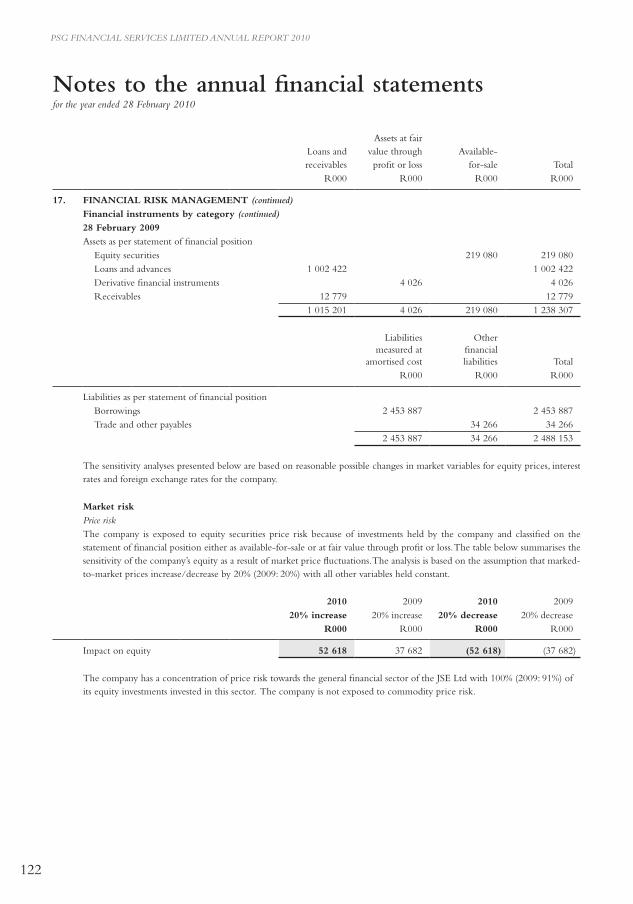
PSG FINANCIAL SERVICES LIMITED ANNUAL REPORT 2010
122
Notes to the annual financial statementsfor the year ended 28 February 2010
Loans and receivables
Assets at fair value through profit or loss
Available-for-sale Total
R000 R000 R000 R000
17. FINANCIAL RISK MANAGEMENT (continued)Financial instruments by category (continued)28 February 2009Assets as per statement of financial position
Equity securities 219 080 219 080 Loans and advances 1 002 422 1 002 422 Derivative financial instruments 4 026 4 026 Receivables 12 779 12 779
1 015 201 4 026 219 080 1 238 307
Liabilities measured at
amortised cost
Other financial liabilities Total
R000 R000 R000
Liabilities as per statement of financial positionBorrowings 2 453 887 2 453 887 Trade and other payables 34 266 34 266
2 453 887 34 266 2 488 153
The sensitivity analyses presented below are based on reasonable possible changes in market variables for equity prices, interest rates and foreign exchange rates for the company.
Market riskPrice riskThe company is exposed to equity securities price risk because of investments held by the company and classified on the statement of financial position either as available-for-sale or at fair value through profit or loss. The table below summarises the sensitivity of the company’s equity as a result of market price fluctuations. The analysis is based on the assumption that marked-to-market prices increase/decrease by 20% (2009: 20%) with all other variables held constant.
2010 2009 2010 2009 20% increase 20% increase 20% decrease 20% decrease
R000 R000 R000 R000
Impact on equity 52 618 37 682 (52 618) (37 682)
The company has a concentration of price risk towards the general financial sector of the JSE Ltd with 100% (2009: 91%) of its equity investments invested in this sector. The company is not exposed to commodity price risk.
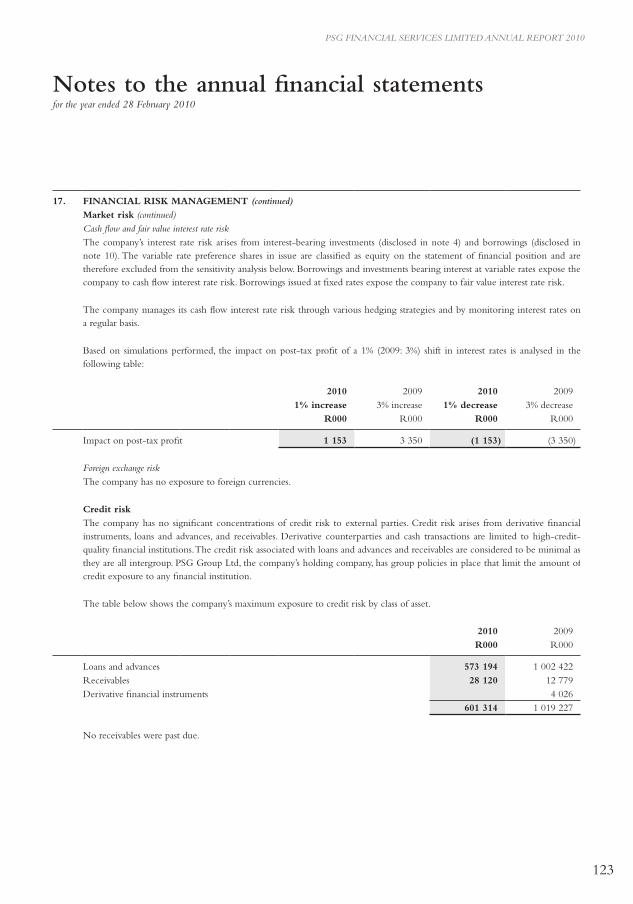
PSG FINANCIAL SERVICES LIMITED ANNUAL REPORT 2010
123
17. FINANCIAL RISK MANAGEMENT (continued)Market risk (continued)Cash flow and fair value interest rate riskThe company’s interest rate risk arises from interest-bearing investments (disclosed in note 4) and borrowings (disclosed in note 10). The variable rate preference shares in issue are classified as equity on the statement of financial position and are therefore excluded from the sensitivity analysis below. Borrowings and investments bearing interest at variable rates expose the company to cash flow interest rate risk. Borrowings issued at fixed rates expose the company to fair value interest rate risk.
The company manages its cash flow interest rate risk through various hedging strategies and by monitoring interest rates on a regular basis.
Based on simulations performed, the impact on post-tax profit of a 1% (2009: 3%) shift in interest rates is analysed in the following table:
2010 2009 2010 2009 1% increase 3% increase 1% decrease 3% decrease
R000 R000 R000 R000
Impact on post-tax profit 1 153 3 350 (1 153) (3 350)
Foreign exchange riskThe company has no exposure to foreign currencies.
Credit riskThe company has no significant concentrations of credit risk to external parties. Credit risk arises from derivative financial instruments, loans and advances, and receivables. Derivative counterparties and cash transactions are limited to high-credit-quality financial institutions. The credit risk associated with loans and advances and receivables are considered to be minimal as they are all intergroup. PSG Group Ltd, the company’s holding company, has group policies in place that limit the amount of credit exposure to any financial institution.
The table below shows the company’s maximum exposure to credit risk by class of asset.
2010 2009R000 R000
Loans and advances 573 194 1 002 422 Receivables 28 120 12 779 Derivative financial instruments 4 026
601 314 1 019 227
No receivables were past due.
Notes to the annual financial statementsfor the year ended 28 February 2010
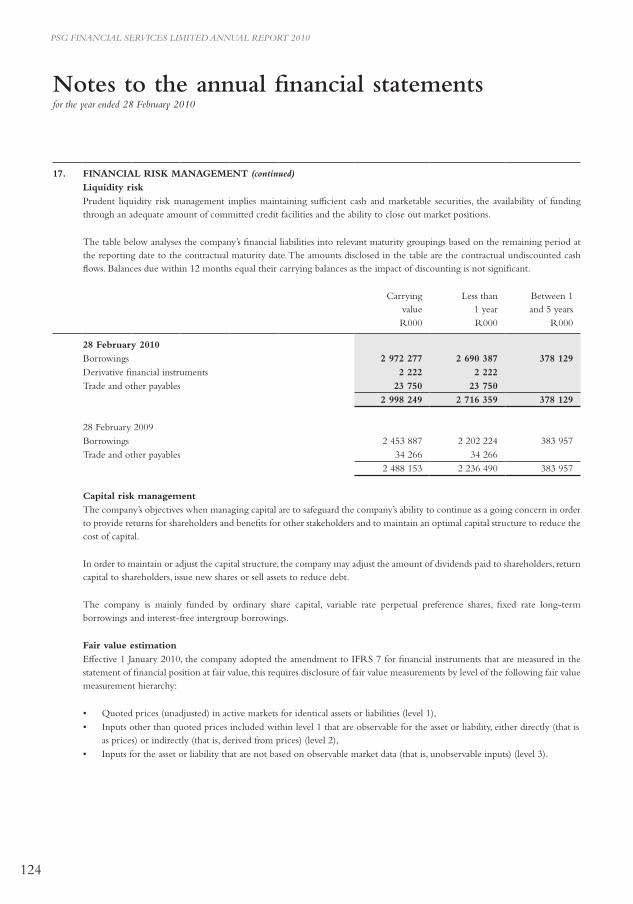
PSG FINANCIAL SERVICES LIMITED ANNUAL REPORT 2010
124
Notes to the annual financial statementsfor the year ended 28 February 2010
17. FINANCIAL RISK MANAGEMENT (continued)Liquidity riskPrudent liquidity risk management implies maintaining sufficient cash and marketable securities, the availability of funding through an adequate amount of committed credit facilities and the ability to close out market positions.
The table below analyses the company’s financial liabilities into relevant maturity groupings based on the remaining period at the reporting date to the contractual maturity date. The amounts disclosed in the table are the contractual undiscounted cash flows. Balances due within 12 months equal their carrying balances as the impact of discounting is not significant.
Carrying value
Less than 1 year
Between 1 and 5 years
R000 R000 R000
28 February 2010Borrowings 2 972 277 2 690 387 378 129 Derivative financial instruments 2 222 2 222Trade and other payables 23 750 23 750
2 998 249 2 716 359 378 129
28 February 2009Borrowings 2 453 887 2 202 224 383 957 Trade and other payables 34 266 34 266
2 488 153 2 236 490 383 957
Capital risk managementThe company’s objectives when managing capital are to safeguard the company’s ability to continue as a going concern in order to provide returns for shareholders and benefits for other stakeholders and to maintain an optimal capital structure to reduce the cost of capital.
In order to maintain or adjust the capital structure, the company may adjust the amount of dividends paid to shareholders, return capital to shareholders, issue new shares or sell assets to reduce debt.
The company is mainly funded by ordinary share capital, variable rate perpetual preference shares, fixed rate long-term borrowings and interest-free intergroup borrowings.
Fair value estimationEffective 1 January 2010, the company adopted the amendment to IFRS 7 for financial instruments that are measured in the statement of financial position at fair value, this requires disclosure of fair value measurements by level of the following fair value measurement hierarchy:
• Quoted prices (unadjusted) in active markets for identical assets or liabilities (level 1),• Inputs other than quoted prices included within level 1 that are observable for the asset or liability, either directly (that is,
as prices) or indirectly (that is, derived from prices) (level 2),• Inputs for the asset or liability that are not based on observable market data (that is, unobservable inputs) (level 3).
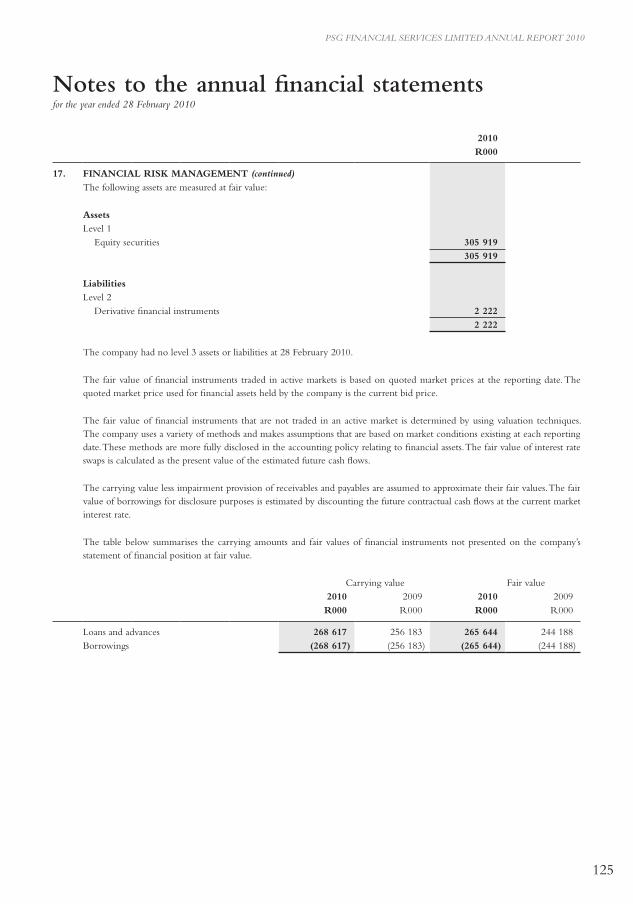
PSG FINANCIAL SERVICES LIMITED ANNUAL REPORT 2010
125
Notes to the annual financial statementsfor the year ended 28 February 2010
2010R000
17. FINANCIAL RISK MANAGEMENT (continued)The following assets are measured at fair value:
AssetsLevel 1
Equity securities 305 919 305 919
LiabilitiesLevel 2
Derivative financial instruments 2 222 2 222
The company had no level 3 assets or liabilities at 28 February 2010.
The fair value of financial instruments traded in active markets is based on quoted market prices at the reporting date. The quoted market price used for financial assets held by the company is the current bid price.
The fair value of financial instruments that are not traded in an active market is determined by using valuation techniques. The company uses a variety of methods and makes assumptions that are based on market conditions existing at each reporting date. These methods are more fully disclosed in the accounting policy relating to financial assets. The fair value of interest rate swaps is calculated as the present value of the estimated future cash flows.
The carrying value less impairment provision of receivables and payables are assumed to approximate their fair values. The fair value of borrowings for disclosure purposes is estimated by discounting the future contractual cash flows at the current market interest rate.
The table below summarises the carrying amounts and fair values of financial instruments not presented on the company’s statement of financial position at fair value.
Carrying value Fair value2010 2009 2010 2009R000 R000 R000 R000
Loans and advances 268 617 256 183 265 644 244 188 Borrowings (268 617) (256 183) (265 644) (244 188)
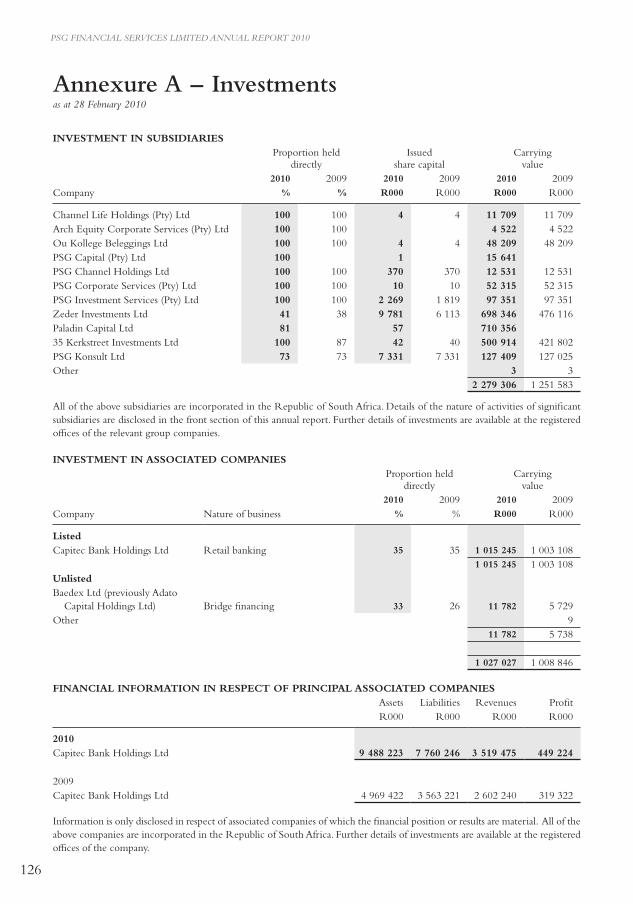
PSG FINANCIAL SERVICES LIMITED ANNUAL REPORT 2010
126
Annexure A – Investmentsas at 28 February 2010
INVESTMENT IN SUBSIDIARIES Proportion held directly
Issued share capital
Carrying value
2010 2009 2010 2009 2010 2009Company % % R000 R000 R000 R000
Channel Life Holdings (Pty) Ltd 100 100 4 4 11 709 11 709 Arch Equity Corporate Services (Pty) Ltd 100 100 4 522 4 522 Ou Kollege Beleggings Ltd 100 100 4 4 48 209 48 209 PSG Capital (Pty) Ltd 100 1 15 641 PSG Channel Holdings Ltd 100 100 370 370 12 531 12 531 PSG Corporate Services (Pty) Ltd 100 100 10 10 52 315 52 315 PSG Investment Services (Pty) Ltd 100 100 2 269 1 819 97 351 97 351 Zeder Investments Ltd 41 38 9 781 6 113 698 346 476 116 Paladin Capital Ltd 81 57 710 356 35 Kerkstreet Investments Ltd 100 87 42 40 500 914 421 802 PSG Konsult Ltd 73 73 7 331 7 331 127 409 127 025 Other 3 3
2 279 306 1 251 583
All of the above subsidiaries are incorporated in the Republic of South Africa. Details of the nature of activities of significant subsidiaries are disclosed in the front section of this annual report. Further details of investments are available at the registered offices of the relevant group companies.
INVESTMENT IN ASSOCIATED COMPANIES Proportion held directly
Carrying value
2010 2009 2010 2009Company Nature of business % % R000 R000
ListedCapitec Bank Holdings Ltd Retail banking 35 35 1 015 245 1 003 108
1 015 245 1 003 108UnlistedBaedex Ltd (previously Adato
Capital Holdings Ltd) Bridge financing 33 26 11 782 5 729Other 9
11 782 5 738
1 027 027 1 008 846
FINANCIAL INFORMATION IN RESPECT OF PRINCIPAL ASSOCIATED COMPANIESAssets Liabilities Revenues ProfitR000 R000 R000 R000
2010Capitec Bank Holdings Ltd 9 488 223 7 760 246 3 519 475 449 224
2009Capitec Bank Holdings Ltd 4 969 422 3 563 221 2 602 240 319 322
Information is only disclosed in respect of associated companies of which the financial position or results are material. All of the above companies are incorporated in the Republic of South Africa. Further details of investments are available at the registered offices of the company.
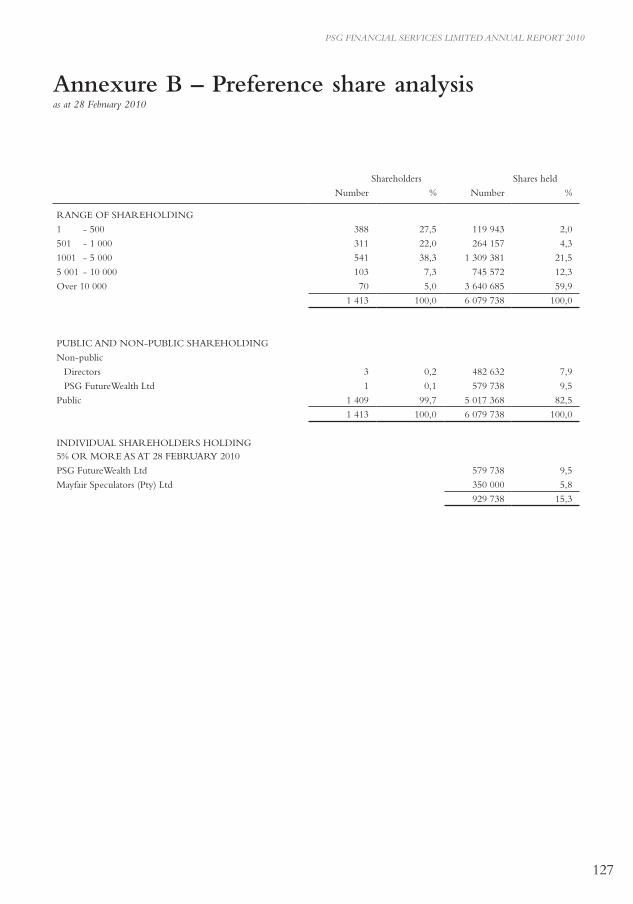
PSG FINANCIAL SERVICES LIMITED ANNUAL REPORT 2010
127
Annexure B – Preference share analysisas at 28 February 2010
Shareholders Shares held
Number % Number %
RANGE OF SHAREHOLDING
1 - 500 388 27,5 119 943 2,0
501 - 1 000 311 22,0 264 157 4,3
1001 - 5 000 541 38,3 1 309 381 21,5
5 001 - 10 000 103 7,3 745 572 12,3
Over 10 000 70 5,0 3 640 685 59,9
1 413 100,0 6 079 738 100,0
PUBLIC AND NON-PUBLIC SHAREHOLDING
Non-public
Directors 3 0,2 482 632 7,9
PSG FutureWealth Ltd 1 0,1 579 738 9,5
Public 1 409 99,7 5 017 368 82,5
1 413 100,0 6 079 738 100,0
INDIVIDUAL SHAREHOLDERS HOLDING 5% OR MORE AS AT 28 FEBRUARy 2010
PSG FutureWealth Ltd 579 738 9,5
Mayfair Speculators (Pty) Ltd 350 000 5,8
929 738 15,3
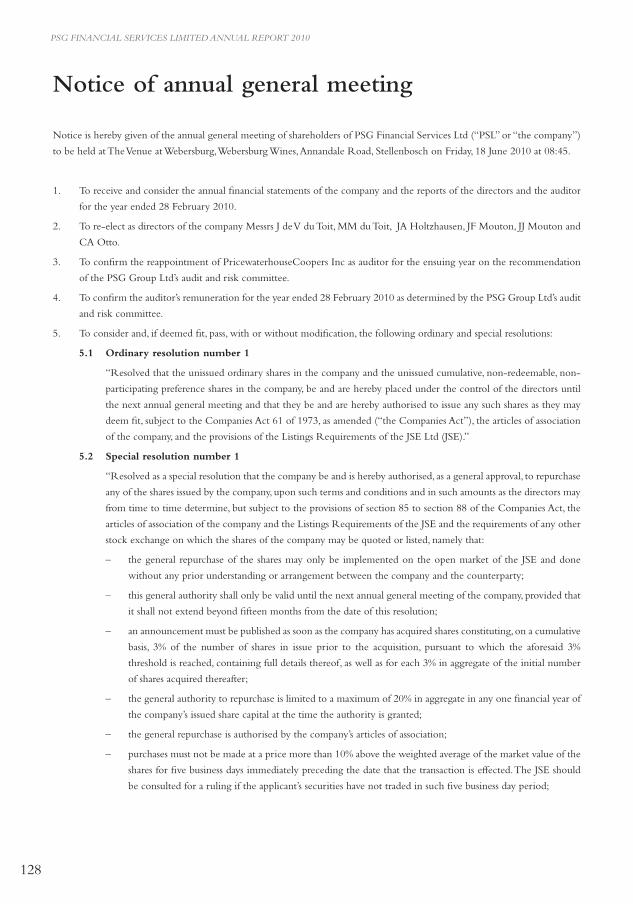
PSG FINANCIAL SERVICES LIMITED ANNUAL REPORT 2010
128
Notice of annual general meeting
Notice is hereby given of the annual general meeting of shareholders of PSG Financial Services Ltd (“PSL” or “the company”)
to be held at The Venue at Webersburg, Webersburg Wines, Annandale Road, Stellenbosch on Friday, 18 June 2010 at 08:45.
1. To receive and consider the annual financial statements of the company and the reports of the directors and the auditor
for the year ended 28 February 2010.
2. To re-elect as directors of the company Messrs J de V du Toit, MM du Toit, JA Holtzhausen, JF Mouton, JJ Mouton and
CA Otto.
3. To confirm the reappointment of PricewaterhouseCoopers Inc as auditor for the ensuing year on the recommendation
of the PSG Group Ltd’s audit and risk committee.
4. To confirm the auditor’s remuneration for the year ended 28 February 2010 as determined by the PSG Group Ltd’s audit
and risk committee.
5. To consider and, if deemed fit, pass, with or without modification, the following ordinary and special resolutions:
5.1 Ordinary resolution number 1
“Resolved that the unissued ordinary shares in the company and the unissued cumulative, non-redeemable, non-
participating preference shares in the company, be and are hereby placed under the control of the directors until
the next annual general meeting and that they be and are hereby authorised to issue any such shares as they may
deem fit, subject to the Companies Act 61 of 1973, as amended (“the Companies Act”), the articles of association
of the company, and the provisions of the Listings Requirements of the JSE Ltd (JSE).”
5.2 Special resolution number 1
“Resolved as a special resolution that the company be and is hereby authorised, as a general approval, to repurchase
any of the shares issued by the company, upon such terms and conditions and in such amounts as the directors may
from time to time determine, but subject to the provisions of section 85 to section 88 of the Companies Act, the
articles of association of the company and the Listings Requirements of the JSE and the requirements of any other
stock exchange on which the shares of the company may be quoted or listed, namely that:
– the general repurchase of the shares may only be implemented on the open market of the JSE and done
without any prior understanding or arrangement between the company and the counterparty;
– this general authority shall only be valid until the next annual general meeting of the company, provided that
it shall not extend beyond fifteen months from the date of this resolution;
– an announcement must be published as soon as the company has acquired shares constituting, on a cumulative
basis, 3% of the number of shares in issue prior to the acquisition, pursuant to which the aforesaid 3%
threshold is reached, containing full details thereof, as well as for each 3% in aggregate of the initial number
of shares acquired thereafter;
– the general authority to repurchase is limited to a maximum of 20% in aggregate in any one financial year of
the company’s issued share capital at the time the authority is granted;
– the general repurchase is authorised by the company’s articles of association;
– purchases must not be made at a price more than 10% above the weighted average of the market value of the
shares for five business days immediately preceding the date that the transaction is effected. The JSE should
be consulted for a ruling if the applicant’s securities have not traded in such five business day period;
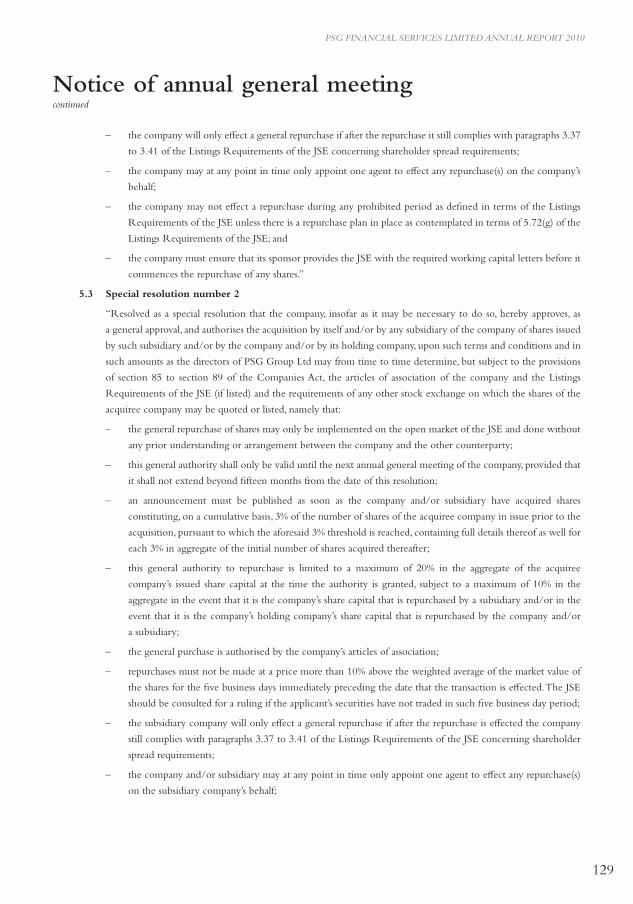
PSG FINANCIAL SERVICES LIMITED ANNUAL REPORT 2010
129
Notice of annual general meetingcontinued
– the company will only effect a general repurchase if after the repurchase it still complies with paragraphs 3.37
to 3.41 of the Listings Requirements of the JSE concerning shareholder spread requirements;
– the company may at any point in time only appoint one agent to effect any repurchase(s) on the company’s
behalf;
– the company may not effect a repurchase during any prohibited period as defined in terms of the Listings
Requirements of the JSE unless there is a repurchase plan in place as contemplated in terms of 5.72(g) of the
Listings Requirements of the JSE; and
– the company must ensure that its sponsor provides the JSE with the required working capital letters before it
commences the repurchase of any shares.”
5.3 Special resolution number 2
“Resolved as a special resolution that the company, insofar as it may be necessary to do so, hereby approves, as
a general approval, and authorises the acquisition by itself and/or by any subsidiary of the company of shares issued
by such subsidiary and/or by the company and/or by its holding company, upon such terms and conditions and in
such amounts as the directors of PSG Group Ltd may from time to time determine, but subject to the provisions
of section 85 to section 89 of the Companies Act, the articles of association of the company and the Listings
Requirements of the JSE (if listed) and the requirements of any other stock exchange on which the shares of the
acquiree company may be quoted or listed, namely that:
– the general repurchase of shares may only be implemented on the open market of the JSE and done without
any prior understanding or arrangement between the company and the other counterparty;
– this general authority shall only be valid until the next annual general meeting of the company, provided that
it shall not extend beyond fifteen months from the date of this resolution;
– an announcement must be published as soon as the company and/or subsidiary have acquired shares
constituting, on a cumulative basis, 3% of the number of shares of the acquiree company in issue prior to the
acquisition, pursuant to which the aforesaid 3% threshold is reached, containing full details thereof as well for
each 3% in aggregate of the initial number of shares acquired thereafter;
– this general authority to repurchase is limited to a maximum of 20% in the aggregate of the acquiree
company’s issued share capital at the time the authority is granted, subject to a maximum of 10% in the
aggregate in the event that it is the company’s share capital that is repurchased by a subsidiary and/or in the
event that it is the company’s holding company’s share capital that is repurchased by the company and/or
a subsidiary;
– the general purchase is authorised by the company’s articles of association;
– repurchases must not be made at a price more than 10% above the weighted average of the market value of
the shares for the five business days immediately preceding the date that the transaction is effected. The JSE
should be consulted for a ruling if the applicant’s securities have not traded in such five business day period;
– the subsidiary company will only effect a general repurchase if after the repurchase is effected the company
still complies with paragraphs 3.37 to 3.41 of the Listings Requirements of the JSE concerning shareholder
spread requirements;
– the company and/or subsidiary may at any point in time only appoint one agent to effect any repurchase(s)
on the subsidiary company’s behalf;
PSG FINANCIAL SERVICES LIMITED ANNUAL REPORT 2010
130
Notice of annual general meetingcontinued
– the subsidiary company may not effect a repurchase during any prohibited period as defined in terms of the
Listings Requirements of the JSE unless there is a repurchase plan in place as contemplated in terms of
5.72(g) of the Listings Requirements of the JSE; and
– the company must ensure that its sponsor provides the JSE with the required working capital letters before it
commences the repurchase of any shares.”
Reasons for and effects of the special resolutions
1. The reason for and effect of special resolution number 1 is to grant the directors a general authority in terms of the
Companies Act for the acquisition by the company of shares issued by it on the basis reflected in the special resolution.
In terms of the Listings Requirements of the JSE, any general repurchase by the company must, inter alia, be limited to
a maximum of 20% of the company’s issued share capital in any one financial year of that class at the time the authority
is granted.
2. The reason for and effect of special resolution number 2 is to grant the board of directors of the company and/or any
subsidiary of the company a general authority to acquire shares issued by such subsidiary and/or by the company and/or
the company’s holding company, on the basis reflected in the special resolution.
In terms of the Listings Requirements of the JSE, any general purchase by a subsidiary of listed shares must, inter alia, be
limited to a maximum of 20% of the issued share capital of the acquiree company in any one financial year of that class
at the time the authority is granted, subject to a maximum of 10% in the event that it is the company’s and/or the
company’s holding company’s share capital that is repurchased by a subsidiary.
3. The directors of the company or its subsidiaries will only utilise the general authority to purchase shares of the company’s
holding company and/or the company and/or the subsidiary as set out in special resolutions numbers 1 and 2 to the
extent that the directors of PSG Group, after considering the maximum shares to be purchased, are of the opinion that
the company and its subsidiaries’ (“PSG Group”) position would not be compromised as to the following:
– the PSG Group’s ability in the ordinary course of business to pay its debts for a period of 12 months after the date of
the notice of the annual general meeting;
– the consolidated assets of the PSG Group will be in excess of the consolidated liabilities of the PSG Group. The assets
and liabilities should be recognised and measured in accordance with the accounting policies used in the latest audited
annual financial statements of the PSG Group;
– the ordinary capital and reserves of the PSG Group after the purchase will remain adequate for the purpose of the
business of the PSG Group for a period of 12 months after the date of the notice of the annual general meeting; and
– the working capital available to the PSG Group after the purchase will be sufficient for the PSG Group’s requirements
for a period of 12 months after the date of the notice of the annual general meeting.
Information relating to the special resolutions
1. General information in respect of directors (page 10), major shareholders (page 127), directors’ interest in securities and
material changes (page 109) and the share capital of the company (page 117) is contained in the annual report to which
this notice is attached.
2. The company is not involved in any legal or arbitration proceedings, nor are any proceedings pending or threatened of
which the company is aware that may have or have had a material effect on the company’s financial position in the
previous 12 months.
PSG FINANCIAL SERVICES LIMITED ANNUAL REPORT 2010
131
3. The directors, whose names are on page 10 of the annual report to which this notice is attached, collectively and
individually accept full responsibility for the accuracy of the information given and certify that to the best of their
knowledge and belief there are no facts that have been omitted which would make any statement false or misleading, and
that all reasonable enquiries to ascertain such facts have been made and that the notice contains all information required
by the JSE Listings Requirements.
4. Special resolutions 1 and 2 are renewals of resolutions taken at the previous annual general meeting on 19 June 2009.
By order of the board
PSG Corporate Services (Pty) Ltd
Company secretary
19 May 2010
Stellenbosch
Registered office
PSG Financial Services Ltd
Ou Kollege
35 Kerk Street
Stellenbosch, 7600
(PO Box 7403, Stellenbosch, 7599)
Transfer secretaries
Computershare Investor Services (Pty) Ltd
Ground Floor
70 Marshall Street
Johannesburg, 2001
(PO Box 61051, Marshalltown, 2107)
Notice of annual general meetingcontinued
132
PSG GROUP LIMITED ANNUAL REPORT 2010
Details of PSG Group Ltd Details of PSG Financial Services Ltd
Registration number 1970/008484/06 Registration number 1919/000478/06
Share code: PSG Share code: PGFP
ISIN code: ZAE000013017 ISIN code: ZAE000096079
Secretary and registered office Corporate adviser and sponsor
PSG Corporate Services (Pty) Ltd PSG Capital
Registration number 1996/004840/07
Ou Kollege Broker
35 Kerk Street PSG Online Securities Ltd
Stellenbosch 7600
PO Box 7403 Auditor
Stellenbosch 7599 PricewaterhouseCoopers Inc.
Telephone +27 21 887 9602
Facsimile +27 21 887 9619 Principal banker
Absa Bank Ltd
Transfer secretaries
Computershare Investor Services (Pty) Ltd Website address
Ground Floor www.psggroup.co.za
70 Marshall Street
Johannesburg, 2001
(PO Box 61051, Marshalltown, 2107)
2010
Financial year-end 28 February
Profit announcement 19 April
Annual general meeting 18 June
Interim report 11 October
Administration
Shareholders’ diary

FORM OF PROxY – FOR USE BY CERTIFICATED AND OWN-NAME DEMATERIALISED SHAREHOLDERS ONLY
For use at the annual general meeting of ordinary shareholders of the company to be held at Webersburg at 12:00 on Friday, 18 June 2010.
I/We (Full name in print) ______________________________________________________________________________
of (address) _________________________________________________________________________________________
being the registered holder of _________________________________________________ ordinary shares hereby appoint:
1. _________________________________________________________________________________ or failing him/her,
2. _________________________________________________________________________________ or failing him/her,
3. the chairman of the meeting,
as my proxy to vote for me/us at the annual general meeting for purposes of considering and, if deemed fit, passing, with or without modification, the special resolutions and ordinary resolutions to be proposed thereat and at each adjournment thereof and to vote for and/or against the resolutions and/or abstain from voting in respect of the shares registered in my/our name(s) in accordance with the following instructions (see Notes):
Number of shares
In favour of Against Abstain
1. To adopt annual financial statements and reports
2.1 To re-elect J de V du Toit as director
2.2 To re-elect JF Mouton as director
2.3 To re-elect CA Otto as director
2.4 To re-elect JA Holtzhausen as director
2.5 To re-elect MM du Toit as director
2.6 To re-elect JJ Mouton as director
3. To confirm the reappointment of the auditor, PricewaterhouseCoopers Inc.
4. To confirm the auditor’s remuneration
5.1 Ordinary resolution number 1 – unissued shares
5.2 Special resolution number 1 – share buyback by PSG Group
5.3 Special resolution number 2 – share buyback by subsidiaries of PSG Group
Please indicate your voting instruction by way of inserting the number of shares or by a cross in the space provided.
Signed at __________________________________ on this _________________ day of ______________________ 2010
Signature(s)
Assisted by (where applicable) (state capacity and full name)
___________________________________________________________________________________________________Each PSG Group shareholder is entitled to appoint one or more proxy(ies) (who need not be a shareholder(s) of the company) to attend, speak and vote in his stead at the annual general meeting.
(Incorporated in the Republic of South Africa)(Registration number 1970/008484/06)
JSE share code: PSGISIN code: ZAE 000013017
(“PSG Group” or “the company”)

Notes
1. A PSG Group shareholder may insert the name of a proxy or the names of two alternative proxies of the shareholder’s choice in the space(s) provided, with or without deleting “the chairman of the annual general meeting”. The person whose name appears first on the form of proxy and who is present at the meeting will be entitled to act as proxy to the exclusion of those whose names follow.
2. A PSG Group shareholder’s instructions to the proxy must be indicated by the insertion of the relevant number of shares to be voted on behalf of that shareholder in the appropriate box provided. Failure to comply with the above will be deemed to authorise the chairman of the annual general meeting, if he/she is the authorised proxy, to vote in favour of the resolutions at the meeting, or any other proxy to vote or to abstain from voting at the meeting as he/she deems fit, in respect of all the shares concerned. A shareholder or his/her proxy is not obliged to use all the votes exercisable by the shareholder or his/her proxy, but the total of the votes cast and in respect whereof abstentions are recorded may not exceed the total of the votes exercisable by the shareholder or his/her proxy.
3. When there are joint registered holders of any shares, any one of such persons may vote at the meeting in respect of such shares as if he/she was solely entitled thereto, but, if more than one of such joint holders be present or represented at any meeting, that one of the said persons whose name stands first in the register in respect of such shares or his/her proxy, as the case may be, shall alone be entitled to vote in respect thereof. Several executors or administrators of a deceased member, in whose name any shares stand, shall be deemed joint holders thereof.
4. Forms of proxy must be completed and returned to be received by the transfer secretaries of the company, Computershare Investor Services (Pty) Ltd (PO Box 61051, Marshalltown, 2107), by not later than 12:00 on Tuesday, 15 June 2010.
5. Any alteration or correction made to this form of proxy must be initialled by the signatory(ies).
6. Documentary evidence establishing the authority of a person signing this form of proxy in a representative capacity must be attached to this form of proxy unless previously recorded by the company’s transfer secretaries or waived by the chairman of the annual general meeting.
7. The completion and lodging of this form of proxy will not preclude the relevant shareholder from attending the annual general meeting and speaking and voting in person thereat to the exclusion of any proxy appointed in terms hereof, should such shareholder wish to do so.


AnnuAl RepoRt
2010
PS
G G
RO
UP
An
nu
Al
Re
po
Rt
2010