proximate determinants of fertility …psri.uonbi.ac.ke/sites/default/files/chss/psri/psri/awes...
TRANSCRIPT

PROXIMATE DETERMINANTS OF FERTILITY AMONG POOR AND NON POOR
WOMEN IN KENYA
BY
AWES ABDULKADIR AMIN
Registration No Q56/79807/2012
A PROJECT SUBMITTED IN PARTIAL FULFILLMENT OF THE REQUIREMENTS FOR THE
AWARD OF THE DEGREE OF MASTERS OF SCIENCE IN POPULATION STUDIES AT
POPUALTION STUDIES RESEARCH INSTITUTE
UNIVERSITY OF NAIROBI, KENYA
NOVEMBER, 2014

ii
DECLARATION
I hereby declare that this project is my bona fide work. I earnestly declare that this project has not been
presented for degree award in any other University.
Name: AWES ABDULKADIR AMIN
Registration No Q56/79807/2012
SIGNATURE:……………………………………..Date:…………………….…………
This project has been submitted for award of Master of Science Degree in Population Studies with our
approval as university supervisors:
PROFESSOR ALFRED AGWANDA
SIGNATURE:……………………………………..Date:…………………….…………
DR. ANDREW MUTUKU
SIGNATURE:……………………………………..Date:…………………….…………

iii
DEDICATION
This work is dedicated to my lovely family, especially my dear mother Khadija Guled, my wife Ayan
Mohammed, my childrem Muhammad, Khadija, Amin, Abdulrazaq, Guled, Fathiya, Madina and my sister
Fathiya Amin for all their dedicated partnership for the success of my life.

iv
ACKNOWLEDGEMENT
In the name of Allah, the Most Beneficent, the Most Merciful
Praise be to Allah, the Lord of the Worlds. First and foremost, I am indebted to the Almighty Allah because of
whose full mercy and grace I completed my study. My sincere appreciation goes to my employer, Kenya
National Bureau of Statistics (KNBS) for facilitating me to undertake this course. Special appreciation should
go to the KNBS Director General, Mr. Zachary Mwangi and the entire Bureau training committee for
approving this course. My deep gratitude goes to my research supervisors, Professor Alfred Agwanda and Dr
Andrew Mutuku for their continuous advice and professional guidance towards realization of this work, thank
you very much. My heartfelt appreciation and great thanks also goes to all the lecturers at PSRI. To other
members of staff at PSRI computer Lab, Library and administration, thanks for providing me with all the
necessary materials and documents within the required time.
Special thanks to goes to my dear mother, wife and children for moral support and prayers during my study
period, you have always been with me. Without your support and prayers, it would not have been easy for me
to complete my course. I would also like to express my sincerely thanks to my younger sister, Fathiya Amin
for her encouragement. To my fellow PSRI students, receive my gratitude for you gave me support and
courage. Finally, I thank all those, who in one way or another have contributed to the success of my studies.
v
ABSTRACT
The general objective of the study was to examine the role of the proximate determinants of fertility inhibiting
effects among the poor and non poor in Kenya over the period 2003 to 2008/09. It sought to determine the
fertility inhibiting effect of each of the principal proximate determinants of fertility to change in TFR. The
study is based on the analysis of secondary data obtained from the Kenya Demographic and Health Surveys
(KDHS) of 2003 and 2008/09. The study used Bongaarts model of proximate determinants of fertility as the
main method of data analysis. The variables selected in the study included contraceptive use, postpartum
infecundibility, proportion married and sterility. The findings are analyzed using three socio economic
characteristic of educational level, region and residence. Due to lack of data, induced abortion was not
assessed in the study. The computation procedures are first used to estimate the four indexes of contraceptive
use, postpartum infecundibility, proportion married and sterility to measure the inhibiting effect. Second, TFR
is estimated using the Bongaarts Fertility Model. Lastly, the indexes are decomposed to determine the
contribution made by each of the proximate determinants to be observed change in fertility.
The study indicates that TFR among poor and non poor women declined by 22.2% and 1.2%, respectively. It
was found that fertility declined among poor women mostly due to a 15.4% decline in marriage patterns, a
4.5% decline as a result in increase in contraceptive use and a 3.8% decline due to lengthening of the duration
of postpartum infecundability. For the non poor women fertility declined due to a 4.0 %increase in marriage
pattern, a 3.5% increase due to decrease in contraceptives use and a 8.5% decrease as a result of lengthening
of the duration of postpartum infecundability. The increase in contraceptives use among the poor women
contributed 20% while the decrease in contraceptives use among non poor contributed more than twice to the
decrease in fertility. Marriage patterns contributed 69.0% of the decline in TFR among poor women and more
than three times to the decrease of fertility among non poor women.
Across the regions comparison, Total Fertility Rate (TFR) among poor women declined only in Central and
North Eastern Provinces. Among the non poor, fertility declined in all the Provinces except Coast Province
where the increase was marginal and Eastern Province where TFR remained the same. The increase in fertility
in Coast Province can be attributed to the change in marriage pattern by 21.6% and the shortening of the
duration of postpartum infecundability by 2.3%. However, the increase in contraceptive use contributed to the
decline in TFR by 8.8% to offset partly the increase in marriage pattern and postpartum infecundability.
Among the poor and non poor women, Nyanza and North Eastern Provinces had the highest decline in TFR of
35.0% over the two periods. This could be attributed to the fact that Nyanza Province had the highest increase

vi
in the duration of postpartum infecundability. The TFR increased by 1.1% and 2.4% among poor women with
primary education and non poor women with secondary and above education, respectively.
The results of the study have shown that the important role marriage has played in fertility decline. At the sub
groups, it was found that non poor women contributed to the increase in fertility while the poor women
contributed to its decline. Furthermore, the study showed that at the aggregate level, urban and rural areas
poor women are delaying marriage while non poor women enter into marriage earlier in 2008/09 than in 2003.
The main policy implications for these findings are that we need to have education programmes for all women
so that they can delay entry into marriage. These programmes should target women who had no education and
regions where women tend to enter marriage earlier than in the past.
vii
TABLE OF CONTENTS
DEDICATION ---------------------------------------------------------------------------------------------------------------- iii
ACKNOWLEDGEMENT -------------------------------------------------------------------------------------------------- iv
ABSTRACT -------------------------------------------------------------------------------------------------------------------- v
LIST OF TABLES ------------------------------------------------------------------------------------------------------------ x
CHAPTER ONE: INTRODUCTION -------------------------------------------------------------------------------------- 1
1.1. Background of the Study --------------------------------------------------------------------------------------------- 1
1.2. Problem Statement ---------------------------------------------------------------------------------------------------- 2
1.3. Objectives of the study ----------------------------------------------------------------------------------------------- 3
1.4. Justification of the Study -------------------------------------------------------------------------------------------- 4
1.5. Scope and Limitations of the Study -------------------------------------------------------------------------------- 4
CHAPTER TWO: LITERATURE REVIEW ----------------------------------------------------------------------------- 6
2.1. Introduction ------------------------------------------------------------------------------------------------------------ 6
2.2. Theoretical Perspective of Proximate Determinants of Fertility ----------------------------------------------- 6
2.3. Applications of the Bongaarts Model of Proximate determinants --------------------------------------------- 7
2.3.2. Asia ---------------------------------------------------------------------------------------------------------------- 8
2.3.2. Sub Saharan African Region ----------------------------------------------------------------------------------- 9
2.3.2. Kenya ------------------------------------------------------------------------------------------------------------ 10
2.4. Summary of Literature Review ----------------------------------------------------------------------------------- 11
2.5. Analytical Framework ---------------------------------------------------------------------------------------------- 11
2.5. Definition of Concepts --------------------------------------------------------------------------------------------- 13
2.6. Definition of Variables and Measurements --------------------------------------------------------------------- 14
2.6.1. Background Variables ----------------------------------------------------------------------------------------- 14
2.6.2. Demographic Variables --------------------------------------------------------------------------------------- 15
2.6.3. Proximate determinants Variables --------------------------------------------------------------------------- 15
viii
CHAPTER THREE: DATA AND METHODS ------------------------------------------------------------------------ 16
3.1. Introduction ---------------------------------------------------------------------------------------------------------- 16
3.2. Sources of data ------------------------------------------------------------------------------------------------------ 16
3.3. Method of Data Analysis ------------------------------------------------------------------------------------------- 17
3.4. Computation procedures to estimate of the Indices of proximate determinants --------------------------- 18
3.4.1 Estimation of Index of Marriage (Cm) ----------------------------------------------------------------------- 18
3.4.2 Estimation of the Index of Contraception (Cc) ------------------------------------------------------------- 19
3.4.3 Estimation of the Index of Postpartum Infecundability (Ci) --------------------------------------------- 19
3.4.4. Estimation of Index of Primary Sterility (Cp) ------------------------------------------------------------- 20
3.5. Decomposition of the Proximate Determinants to Fertility Change ----------------------------------------- 20
CHAPTER FOUR: FERTILITY INHIBITING EFFECTS OF THE PROXIMATE DETERMINANTS ----- 22
4.1. Introduction ---------------------------------------------------------------------------------------------------------- 22
4.2. Background Characteristics of the Survey Population --------------------------------------------------------- 22
4.3. Estimation of the Indices of the Poor and Non Poor Women ------------------------------------------------- 23
4.3.1. Index of Marriage (Cm) --------------------------------------------------------------------------------------- 23
4.3.2. Index of Contraception (Cc) ---------------------------------------------------------------------------------- 26
4.3.3. Estimation of the Index of Postpartum (Ci) ---------------------------------------------------------------- 28
4.3.4. Estimation of Index of Primary Sterility (Cp) ------------------------------------------------------------- 30
4.4. Role of the major Proximate Determinants by Economic Status --------------------------------------------- 30
4.5. Estimation of TFR using Bongaarts Fertility Model ----------------------------------------------------------- 32
4.5 Decomposition of the Change in TFR for the Period 2003-2008/09 ----------------------------------------- 34
CHAPTER FIVE: SUMMARY, CONCLUSIONS AND RECOMMENDATIONS ----------------------------- 37
5.1. Introduction ---------------------------------------------------------------------------------------------------------- 37
5.2. Summary ------------------------------------------------------------------------------------------------------------- 37
5.3. Recommendations --------------------------------------------------------------------------------------------------- 38

ix
5.3.1. Recommendations for Policy --------------------------------------------------------------------------------- 38
5.3.1. Recommendations for further Research -------------------------------------------------------------------- 40
REFERENCES -------------------------------------------------------------------------------------------------------------- 41
x
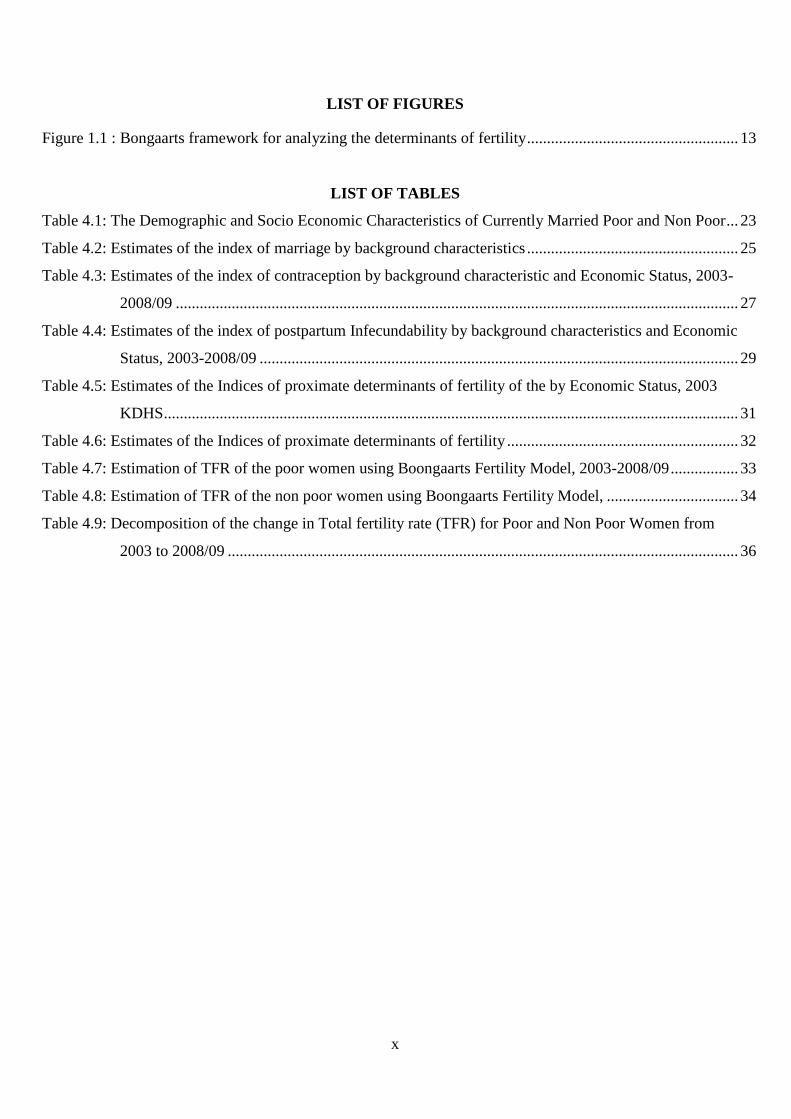
LIST OF FIGURES
Figure 1.1 : Bongaarts framework for analyzing the determinants of fertility ..................................................... 13
LIST OF TABLES
Table 4.1: The Demographic and Socio Economic Characteristics of Currently Married Poor and Non Poor ... 23
Table 4.2: Estimates of the index of marriage by background characteristics ..................................................... 25
Table 4.3: Estimates of the index of contraception by background characteristic and Economic Status, 2003-
2008/09 ............................................................................................................................................. 27
Table 4.4: Estimates of the index of postpartum Infecundability by background characteristics and Economic
Status, 2003-2008/09 ........................................................................................................................ 29
Table 4.5: Estimates of the Indices of proximate determinants of fertility of the by Economic Status, 2003
KDHS ................................................................................................................................................ 31
Table 4.6: Estimates of the Indices of proximate determinants of fertility .......................................................... 32
Table 4.7: Estimation of TFR of the poor women using Boongaarts Fertility Model, 2003-2008/09 ................. 33
Table 4.8: Estimation of TFR of the non poor women using Boongaarts Fertility Model, ................................. 34
Table 4.9: Decomposition of the change in Total fertility rate (TFR) for Poor and Non Poor Women from
2003 to 2008/09 ................................................................................................................................ 36
1
CHAPTER ONE
INTRODUCTION
1.1. Background of the Study
Kenya's population is growing rapidly and has more than tripled from 10.9 million people in
1969 to 38.6 million people in 2009.The population growth rate which was about 2.5 percent
per annum in 1969 increased to a peak of 3.8 percent per annum in 1979, before declining and
stagnating at about 2.9 percent per annum in 1999 and 2009. The current annual growth is still
considered to be high, and owing to the past growth rates the population is still youthful with
nearly half being aged 18 years or below. At the growth rate of 2.9 percent per annum, the
population is expected to double to about 77 million in 2030 (NCPD, 2012). Fertility has been
the driving factor in the growth of population in Kenya. Fertility declined dramatically during
the last two decades of the 20th century, changing from a high of 8.1 children per woman in the
late 1970s, through 6.7 in the late 1980s, to 4.7 during the last half of the 1990s. However,
fertility seems to have started rising, albeit marginally, from 1998, reaching a fertility of 4.9 and
4.6 children per woman in 2003 and 2008/09, respectively (KDHS 2003, 2008/09).
In recent decades fertility has declined at a rapid pace in a majority of developing countries.
Sub-Saharan Africa experienced significant declines despite its lagging development (Bongaarts
2008). Between 1980 and 2000 total fertility in Kenya fell by about 40 per cent, from some
eight births per woman to around five (Blacker et al, 2005). However, the rate of decline begun
to slow down, and by 2003 the decline in fertility had stalled.
Since 1965, Kenya has recognized the potential adverse effects of high population growth on
the benefits of economic growth, to emphasize the trade-offs between high population growth
and the ability to deliver quality education and health as well as reduce poverty ((NCPD, 2012).
It is for this reason that the government had put many policies and programmes to manage
population. In fact in 1968, Kenya was one of the first countries of Sub-Saharan Africa to
develop a national population policy. This policy, however, remained largely dormant until the
findings from the World Fertility Survey (WFS) in 1977 showed that Kenya had one of the
highest fertility rates in the world, with a total fertility rate (TFR) of 8 children per woman
(CBS, 1980). The Sessional Paper No. 4 of 1984, titled Population Policy Guidelines, and then
Sessional Paper No. 1 of 2000 on National Population Policy for Sustainable Development
which was developed by National Council for Population Development guided implementation
2
of population programmes up to 2010. The Government further reiterated its commitment to
support a growing population in the Vision 2030 through investments in family planning and
health (Republic of Kenya, 2007).
Kenya is characterized by high levels of poverty. It is currently estimated at slightly more than
46 percent with large regional variations (KIHBS, 2005/06). “Over years, fertility remained
more than twice as high among women from the poorest 20.0 per cent of the population
compared to those from the richest 20.0 per cent households” (NCPD, 2012). Given that
majority of the population are poor and predominantly rural, fertility rates were higher in rural
areas compared to urban areas over the same period. This shows that poor woman in Kenya
experience some unique factors which are not experienced by the non poor. The continuing high
fertility rate and differences in Total Fertility Rate between the poor and non poor in Kenya is,
therefore, of considerable concern as the resulting high rate of population growth makes
improvements in living standards difficult.
There are few studies which have measured the proximate determinants of fertility among the
poor and non poor. One such study is a comparative study by Nabanita and Faujdar (2013) who
examined the changes in the proximate determinants of fertility over time in six selected
countries of Asia namely Bangladesh, India, Indonesia, Nepal, Philippines and Vietnam. The
study found that across all the countries, contraceptive use reduced fertility among both poor
and non-poor. The effect of marriage was found to reduce fertility in case of non-poor women in
India, Nepal and Philippines whereas; effect of postpartum infecundity was responsible for
fertility decline in case of non-poor women in Bangladesh, Indonesia and Vietnam. In case of
non-poor women induced abortion played an important role in fertility reduction in India,
Indonesia, Nepal and Vietnam.
1.2. Problem Statement
In Kenya, fertility dropped from 8.1 births per woman in 1978 to 4.7 in 1998. It then increased
slightly to 4.9 births per woman in 2003 before it declined to 4.6 births per woman in 2008/09,
the lowest ever recorded in Kenya. Despite the various population strategies and policies, total
fertility rate still remains high at 4.6 percent (Oketch et al, 2011).
Several studies on proximate determinants of fertility have been undertaken in Kenya. The
recent study by Njenga (2010) found out that contraceptive practice had the highest impact.
3
Similarly, findings by Ekisa and Hinde (2005) found that between 1989 and 1993 contraceptive
use was the most important determinant of fertility. In a study by Kavali (1998) postpartum
infecundability was found to be the most important fertility inhibiting variable. Similarly, Kizito
et al (1991) found that postpartum infecundability was the most important fertility inhibiting
variable in Kenya in 1977-1978 and 1989. Kalule-Sabiti (1984) found that there were variations
in the proportion married among the population, level of contraceptive use and post-partum
lactational infecundability. Despite all these numerous studies, there is no single study which
touched on the proximate determinants of fertility among the poor and non poor in Kenya.
Therefore, this study will add to this knowledge gap and thus enable the policy makers and
planners make informed decision.
Since independence, the government had put many policies and programmes to manage
population but fertility among the poor still remains higher than that of non poor. The 2008/09
KDHS shows that Total Fertility Rates (TFR) for the poor and non poor were 7.6 and 3.1 per
woman compared to 7.0 and 2.9 per woman in 2003, respectively. The high fertility among poor
has some implications on the government resources. This study, therefore, contributes to a
better understanding in fertility change by the poor and non poor arising from the estimation of
the inhibiting factors.
The study seeks to answer the question, what role does fertility inhibiting effects of the
proximate determinants (marriage, contraception, postpartum infecundability and sterility) have
in explaining the contribution of each of the proximate determinants by the poor and non poor
over the period 2003 and 2008/09?
1.3. Objectives of the study
The general objective of the study was to examine the role of the proximate determinants of
fertility inhibiting effects among the poor and non poor in Kenya over the period 2003 to
2008/09. The specific objectives of the study were:
i. To determine the trends and pattern of the proximate determinants in the fertility among
the poor and non poor women and compare the changes over the period 2003 and
2008/09.

4
ii. To determine the fertility inhibiting effects factors which account for the regional, rural
and urban fertility differential and educational levels among poor and non poor women
over the period 2003-2008/09.
iii. To establish the change in Total Fertility Rate between 2003 and 2008/09
1.4. Justification of the Study
Rapid population growth continues to pose serious challenges for many poor countries,
especially in Africa. This is because population affects the course of economic development
(Richard el al). Therefore, the information generated by this study is crucial in assisting policy
makers and planners provision of the essential services such as provision of education and
health facilities and services needed by the public.
A study on proximate determinants of fertility is necessary since it will highlight the
contribution of the fertility of the poor and non poor in the country. In addition, the study will
help provide a basis for understanding the determinants which influence the fertility of the poor
and non poor. A number of studies on fertility have been done but no study has been conducted
to examine proximate determinants of fertility among the poor and non poor in Kenya. Most of
the studies on fertility are centred on the relationship between poverty and fertility, rural urban
fertility differential, fertility transition and determinants of fertility on the general population.
The study contributes knowledge by identifying proximate determinants of fertility among poor
and non poor.
1.5. Scope and Limitations of the Study
The study used DHS data collected in 2003 and 2008/09 covering the entire country. The results
are presented at the national as well as regional, rural and urban areas. The variables selected
included contraceptive use, postpartum infecundibility, proportion married and sterility. The
findings are also analyzed by three socio economic characteristic namely educational level,
region and residence. Due to lack of data, induced abortion will not be assessed in the study.
This is because the data on induced abortion in the two surveys was not collected since abortion
is illegal in Kenya. Despite that wealth index has some limitation it still remains the best
method of measuring the economic status of the population. Rutstein et al. (2004) compared the
DHS Wealth Index with more traditional indexes of consumer expenditures, concluding that the
Wealth Index better represents long-term (permanent) economic status and also is much easier
to implement. The 2003 and 2008/09 KDHS have used Wealth Index as a proxy for economic

5
status and thus it will be easy to compare. The computed Wealth Index has been standardized
by taking the same asset indicators for the two surveys.
6
CHAPTER TWO
LITERATURE REVIEW
2.1. Introduction
This chapter reviews the literature on studies, which have been undertaken on the proximate
determinants of fertility. The first part provides the historical development of the Bongaarts
model of proximate determinants of fertility. The second part examines the empirical
application of the model in different parts of the world, including Kenya. The last part describes
the analytical framework that was used in this study.
2.2. Theoretical Perspective of Proximate Determinants of Fertility
Factors influencing fertility can be classified into two groups, namely intermediate fertility
variables, or proximate determinants, and socioeconomic variables. Proximate determinants of
fertility is of interest because of its direct impact on fertility as it consists of a set of biological
and behavioural factors through which social, economic and cultural conditions can affect
fertility. In other words, in the absence of these determinants, human fertility may reach a
theoretical maximum of total fecundity (TF). Thus, fertility differentials between regions and
across time within the same region can always be traced to changes in one or more of the
proximate determinants.
Davis and Blake (1956) outlined that the factors affecting fertility can be classified into two
groups: background variables and intermediate or proximate variables. They include cultural,
psychological, economic, social, health, and environmental factors. The proximate determinants
are those factors that have a direct effect on fertility. The background factors operate through
the proximate determinants to influence fertility; they do not influence fertility directly. They
were the first to identify a set of 11 intermediate fertility variables. The classification of these
intermediate fertility variables did not get wide acceptance because it was not easily
incorporated in fertility analysis. Bongaarts (1978) and Bongaarts and Potter (1983) refined
Davis and Blake’s framework into eight factors, which were termed as the proximate
determinants of fertility, to understand variation in level of fertility between populations. The
eight proximate determinants are: proportion married, contraception, induced abortion,
lactational infecundability, frequency of intercourse, sterility, spontaneous intrauterine mortality
and duration of the fertile period.
7
However, after various studies, Bongaarts realized that some of these factors were more relevant
than others in determining the magnitude of fertility change. In fact, only four of them
(proportion married, contraceptive use and effectiveness, induced abortion and postpartum
infecundability) were found to be the most important in explaining fertility variation between
observed and estimated TFR, accounting for up to 96% of fertility change in some populations
(Bongaarts, 1982; 1978). Bongaarts et al. (1984) added a fifth major variable, primary sterility
to the proximate determinants model. John Stover suggested that as result of availability of a
large amount of additional data on the proximate determinants in 1998 compared to 1978,
Bongaarts model proximate determinants indexes should be refined. He suggested the following
changes in the Bongaarts model modifying marriage to proportion of women sexual activity
which is a more direct measure of exposure to pregnancy than marriage; the use of postpartum
insusceptibility which is the combined effects of both postpartum abstinence and amenorrhea
which is a more complete measure of the fertility inhibiting effects of the postpartum period;
use of pathological sterility which intended to estimate the fertility-inhibiting effects of primary
and secondary sterility rather than primary sterility as used in Bongaarts model (This revised
sterility will measure infecundity due to any cause).
2.3. Applications of the Bongaarts Model of Proximate determinants
The Bongaarts model of proximate determinants of fertility is one of the used tools in fertility
analysis (Stover, 1998). Since it was first published it has been applied in hundreds of analysis
and has influenced the collection and reporting of fertility data all over the world. According to
Stover, the framework has been used for a variety of purposes, including:
Decomposing the contribution of each of the proximate determinants to the realization
of the current level of the total fertility rate.
Analyzing the contribution of changes in the proximate determinants to changes in the
total fertility rate over time.
Comparing the differences in fertility between two countries or regions on the basis of
differences in the proximate determinants.

8
Estimating total abortion rates as a residual after the effects of all other proximate
determinants have been removed.
Projecting future levels of contraceptive use that would be required to achieve fertility
goals given expected changes in the other proximate determinants.
The proximate determinants model is mostly used to identify the main factors behind fertility
changes; the changes associated in fertility through time; to compare changes in fertility among
countries, or regions of a country; and to estimate changes in contraceptive use (Stover, 1998).
Studies of the causes of fertility levels and their changes often seek to measure directly the
impact of socioeconomic factors on fertility. Such procedures have a broad appeal to
policymakers, offering as they do to pinpoint mechanisms susceptible to manipulation by
official policy (Bongaarts, 1978). Studies have shown that fertility varies according to the
wealth status of women. Women from the rich wealth index group have a lower fertility than
women from the poor wealth index group (Teklu et al 2013).
The proximate determinants model is one of the most extensively used models in the world. A
number of studies to examine the role of proximate determinants using Boogaarts framework
have been carried out in various countries of the world. Literature review reveals that studies
specifically on the proximate determinants among poor and non poor are scanty. The model has
been used in the continent of Asia, the region of Sub Saharan Africa and Kenya as explained
below:
2.3.2. Asia
In a comparative study to examine the changes in the proximate determinants of fertility over
time in selected countries of Asia namely Bangladesh, India, Indonesia, Nepal, Philippines and
Vietnam, Nabanita and Faujdar (2013) indicated that, across all the countries, contraceptive
uses was found to reduce fertility from first period to most recent period among both poor and
non-poor depending on the country. They noted that effect of marriage was found to reduce
fertility in case of non-poor women in India, Nepal and Philippines whereas; effect of
postpartum infecundity is responsible for fertility decline in case of non-poor women in
Bangladesh, Indonesia and Vietnam. In case of non-poor women induced abortion played an
important role in fertility reduction in India, Indonesia, Nepal and Vietnam. In another study
done in Bangladesh, it was found that contraception was the most prominent determinant in
9
fertility reduction, followed by marriage, lactational infecundability and induced abortion. The
analysis reveals that although the fertility reducing effect of the marriage variable is increasing,
its effect is offset by the declining trend in lactational amenorrhoea period (Tanha et al, 2011).
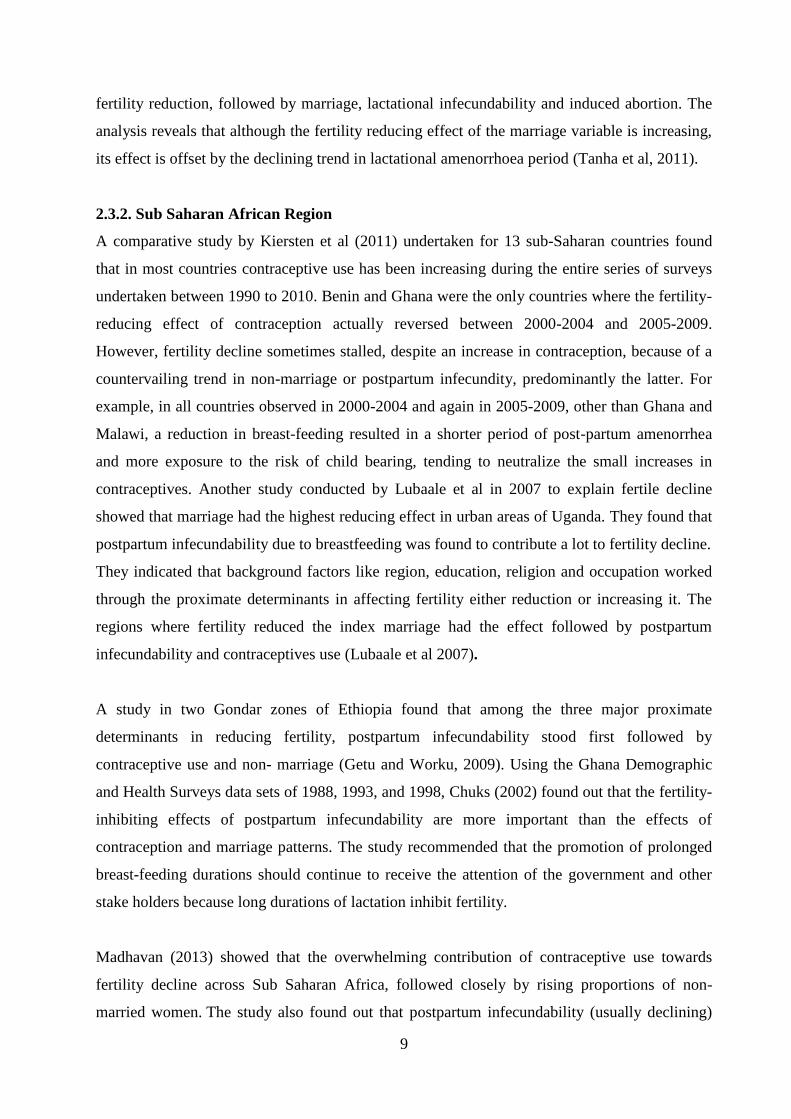
2.3.2. Sub Saharan African Region
A comparative study by Kiersten et al (2011) undertaken for 13 sub-Saharan countries found
that in most countries contraceptive use has been increasing during the entire series of surveys
undertaken between 1990 to 2010. Benin and Ghana were the only countries where the fertility-
reducing effect of contraception actually reversed between 2000-2004 and 2005-2009.
However, fertility decline sometimes stalled, despite an increase in contraception, because of a
countervailing trend in non-marriage or postpartum infecundity, predominantly the latter. For
example, in all countries observed in 2000-2004 and again in 2005-2009, other than Ghana and
Malawi, a reduction in breast-feeding resulted in a shorter period of post-partum amenorrhea
and more exposure to the risk of child bearing, tending to neutralize the small increases in
contraceptives. Another study conducted by Lubaale et al in 2007 to explain fertile decline
showed that marriage had the highest reducing effect in urban areas of Uganda. They found that
postpartum infecundability due to breastfeeding was found to contribute a lot to fertility decline.
They indicated that background factors like region, education, religion and occupation worked
through the proximate determinants in affecting fertility either reduction or increasing it. The
regions where fertility reduced the index marriage had the effect followed by postpartum
infecundability and contraceptives use (Lubaale et al 2007).
A study in two Gondar zones of Ethiopia found that among the three major proximate
determinants in reducing fertility, postpartum infecundability stood first followed by
contraceptive use and non- marriage (Getu and Worku, 2009). Using the Ghana Demographic
and Health Surveys data sets of 1988, 1993, and 1998, Chuks (2002) found out that the fertility-
inhibiting effects of postpartum infecundability are more important than the effects of
contraception and marriage patterns. The study recommended that the promotion of prolonged
breast-feeding durations should continue to receive the attention of the government and other
stake holders because long durations of lactation inhibit fertility.
Madhavan (2013) showed that the overwhelming contribution of contraceptive use towards
fertility decline across Sub Saharan Africa, followed closely by rising proportions of non-
married women. The study also found out that postpartum infecundability (usually declining)
10
accounted for a smaller proportion of the change in TFR in most countries. The urban-rural
analysis shows that in Ethiopia, contraceptive use achieved most of the fertility decline since
2000; that non-marriage has been the key driver in Ghana; there has a been an equal mix of both
in Kenya; and that Nigeria has seen so little feritlity decline that the proportions of the
proximate determinants do not matter. In all countries, urban levels of contraceptive use and
non marriage are higher than in rural areas.
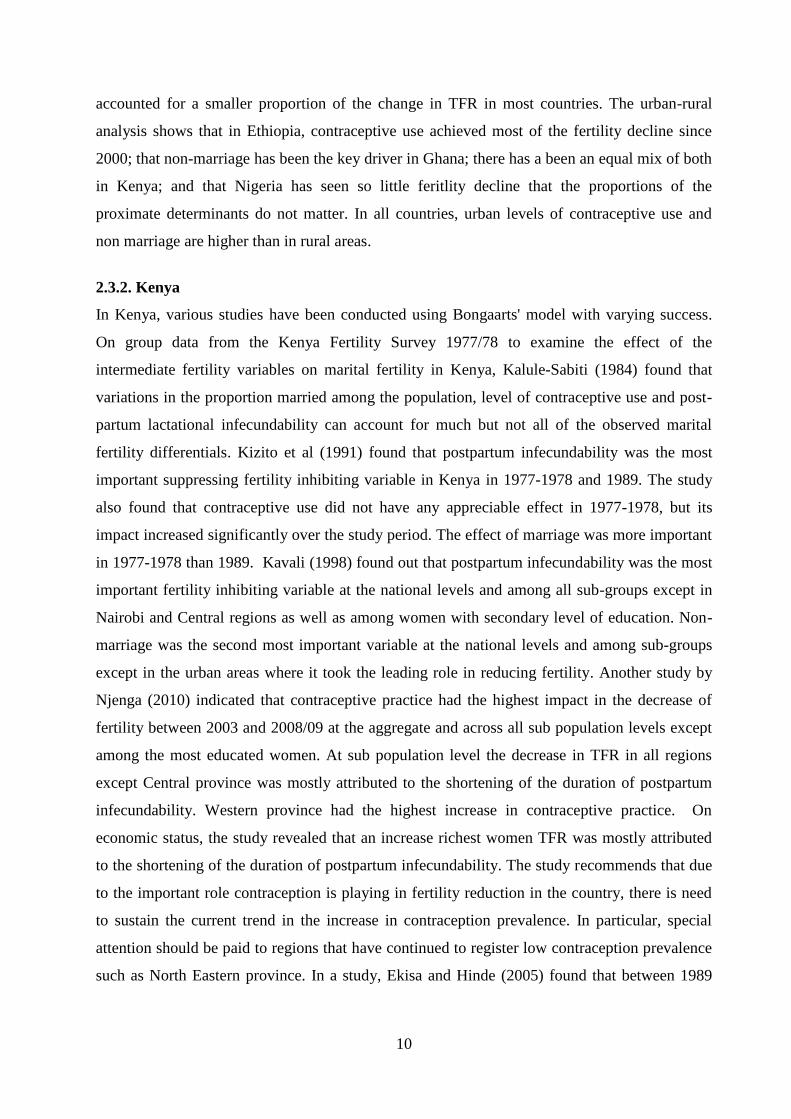
2.3.2. Kenya
In Kenya, various studies have been conducted using Bongaarts' model with varying success.
On group data from the Kenya Fertility Survey 1977/78 to examine the effect of the
intermediate fertility variables on marital fertility in Kenya, Kalule-Sabiti (1984) found that
variations in the proportion married among the population, level of contraceptive use and post-
partum lactational infecundability can account for much but not all of the observed marital
fertility differentials. Kizito et al (1991) found that postpartum infecundability was the most
important suppressing fertility inhibiting variable in Kenya in 1977-1978 and 1989. The study
also found that contraceptive use did not have any appreciable effect in 1977-1978, but its
impact increased significantly over the study period. The effect of marriage was more important
in 1977-1978 than 1989. Kavali (1998) found out that postpartum infecundability was the most
important fertility inhibiting variable at the national levels and among all sub-groups except in
Nairobi and Central regions as well as among women with secondary level of education. Non-
marriage was the second most important variable at the national levels and among sub-groups
except in the urban areas where it took the leading role in reducing fertility. Another study by
Njenga (2010) indicated that contraceptive practice had the highest impact in the decrease of
fertility between 2003 and 2008/09 at the aggregate and across all sub population levels except
among the most educated women. At sub population level the decrease in TFR in all regions
except Central province was mostly attributed to the shortening of the duration of postpartum
infecundability. Western province had the highest increase in contraceptive practice. On
economic status, the study revealed that an increase richest women TFR was mostly attributed
to the shortening of the duration of postpartum infecundability. The study recommends that due
to the important role contraception is playing in fertility reduction in the country, there is need
to sustain the current trend in the increase in contraception prevalence. In particular, special
attention should be paid to regions that have continued to register low contraception prevalence
such as North Eastern province. In a study, Ekisa and Hinde (2005) found that between 1989
11
and 1993 increased contraceptive use was the most important determinant of fertility change in
Kenya.
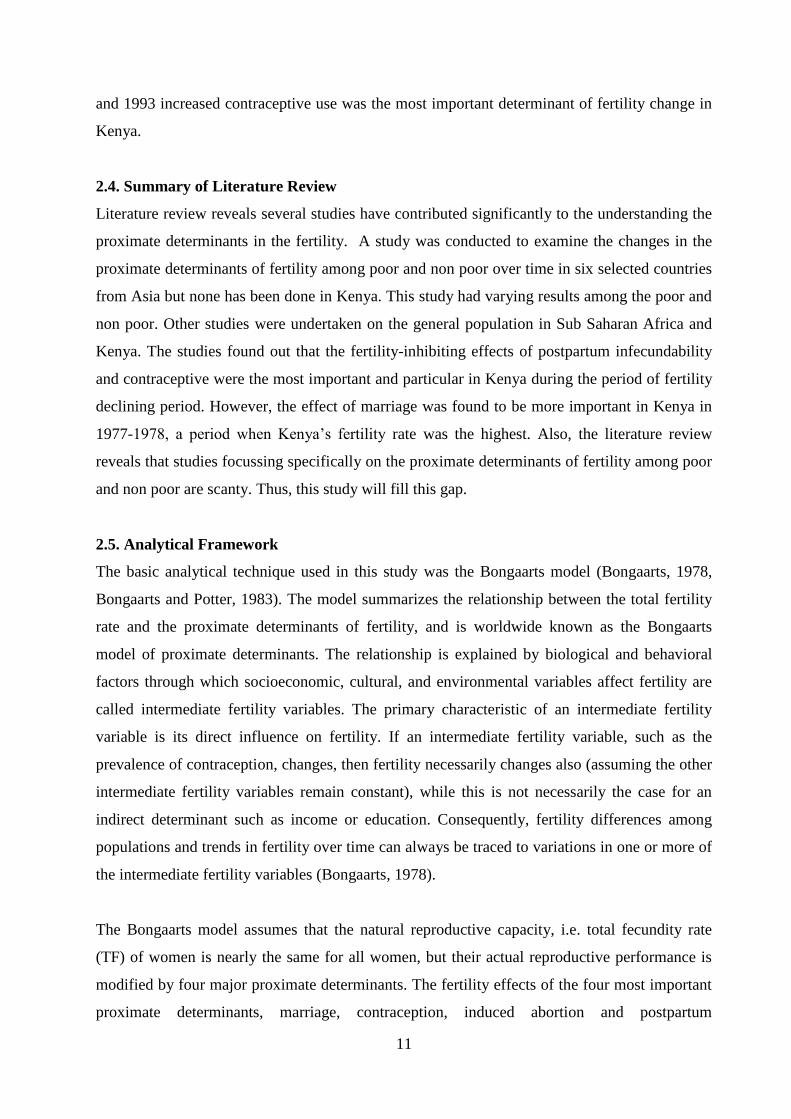
2.4. Summary of Literature Review
Literature review reveals several studies have contributed significantly to the understanding the
proximate determinants in the fertility. A study was conducted to examine the changes in the
proximate determinants of fertility among poor and non poor over time in six selected countries
from Asia but none has been done in Kenya. This study had varying results among the poor and
non poor. Other studies were undertaken on the general population in Sub Saharan Africa and
Kenya. The studies found out that the fertility-inhibiting effects of postpartum infecundability
and contraceptive were the most important and particular in Kenya during the period of fertility
declining period. However, the effect of marriage was found to be more important in Kenya in
1977-1978, a period when Kenya’s fertility rate was the highest. Also, the literature review
reveals that studies focussing specifically on the proximate determinants of fertility among poor
and non poor are scanty. Thus, this study will fill this gap.
2.5. Analytical Framework
The basic analytical technique used in this study was the Bongaarts model (Bongaarts, 1978,
Bongaarts and Potter, 1983). The model summarizes the relationship between the total fertility
rate and the proximate determinants of fertility, and is worldwide known as the Bongaarts
model of proximate determinants. The relationship is explained by biological and behavioral
factors through which socioeconomic, cultural, and environmental variables affect fertility are
called intermediate fertility variables. The primary characteristic of an intermediate fertility
variable is its direct influence on fertility. If an intermediate fertility variable, such as the
prevalence of contraception, changes, then fertility necessarily changes also (assuming the other
intermediate fertility variables remain constant), while this is not necessarily the case for an
indirect determinant such as income or education. Consequently, fertility differences among
populations and trends in fertility over time can always be traced to variations in one or more of
the intermediate fertility variables (Bongaarts, 1978).
The Bongaarts model assumes that the natural reproductive capacity, i.e. total fecundity rate
(TF) of women is nearly the same for all women, but their actual reproductive performance is
modified by four major proximate determinants. The fertility effects of the four most important
proximate determinants, marriage, contraception, induced abortion and postpartum
12
infecundability together with primary sterility are measured by five indices Cm, Cc, Ca Ci and Cp,
respectively. The Bongaarts model is as follows:
TFR= Cm×Cc× Ca ×Ci × Cp ×TF
Where TF is the total fecundity rate and Cm, Cc, Ca Ci and Cp are the indices of proportion
married, contraception, induced abortion, postpartum fecundability and sterility, respectively.
According to Bongaarts and Potters (1983), evidence has established that for almost all
populations, observed fecundity rates vary within the range 13 to 17 children per woman, with
an average of 15.3.
The model summarizes the effect of each of the fertility determinants in an index, which
generally ranges between 0-1, with 0 having the greatest inhibiting effect on fertility and 1
having the least inhibiting effect (in other words, the closer the index is to zero the more
influential the associated proximate determinant is in reducing fertility rate from its biological
maximum and vice versa). In specific terms, the index measuring the effect of marriage patterns
on fertility is denoted by Cm. This index takes the value of 1 when all women of reproductive
age are in union and 0 when none are union. The index of contraception is depicted as Cc and
equals 1 if no contraception is used and 0 if all fecund women use modern methods that are
100% effective. The effect of postpartum amenorrhoea and abstinence on fertility is measured
by Ci, the index of postpartum infecundability in such a way that when there is no lactation or
postpartum abstinence, Ci equals 1 and when infecundability is permanent, Ci equals 0. The
index of abortion is denoted by Ca and equals 1 in the absence of induced abortion and 0 if all
pregnancies are aborted. The index of pathological or primary sterility is represented as Cp and
assumes the value of 1 in the absence of primary sterility and 0 if all women are sterile. Fertility
is the primary dependent variable, while the proximate determinants will be part of the
independent variables. The analysis uses indices derived from Bongaarts’ model to show the
relative contribution of each of the four measurable proximate determinants of fertility
(contraceptive use, breastfeeding, proportion married and sterility) to total fertility rates at the
time of each survey. The analysis uses the proximate determinants conceptual framework to
guide our analytical approach as shown in Figure 2.1.
13
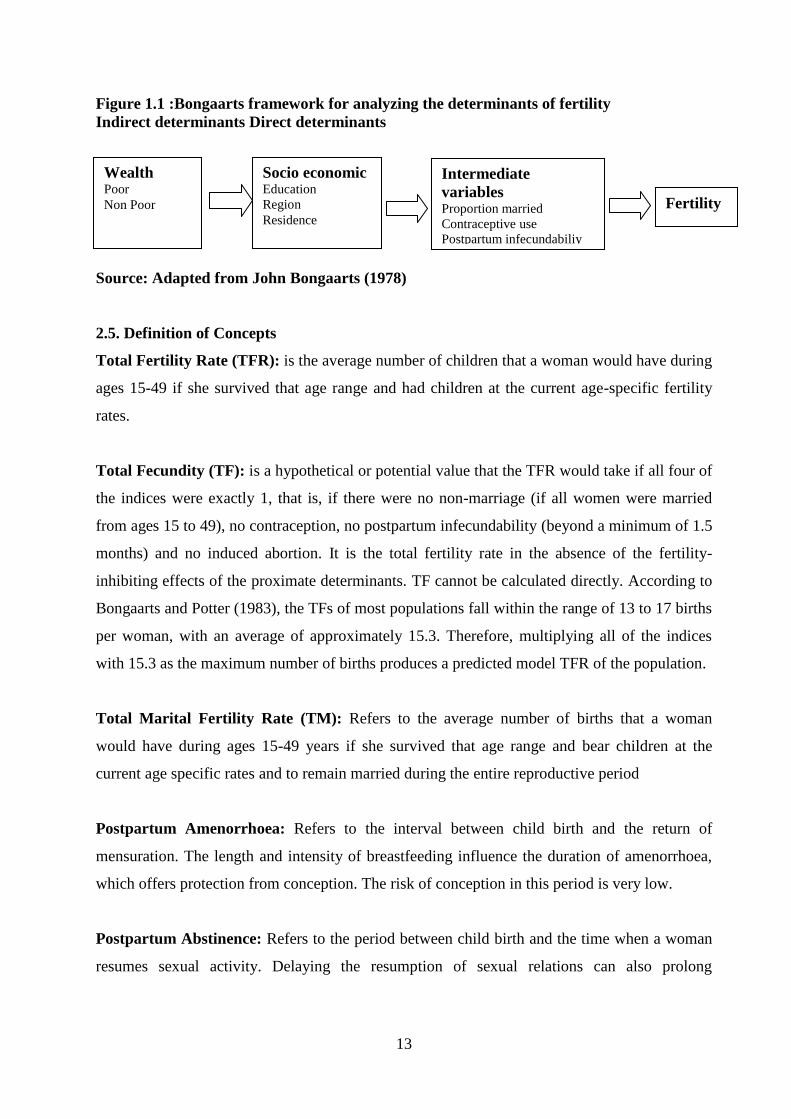
Figure 1.1 :Bongaarts framework for analyzing the determinants of fertility
Indirect determinants Direct determinants
Source: Adapted from John Bongaarts (1978)
2.5. Definition of Concepts
Total Fertility Rate (TFR): is the average number of children that a woman would have during
ages 15-49 if she survived that age range and had children at the current age-specific fertility
rates.
Total Fecundity (TF): is a hypothetical or potential value that the TFR would take if all four of
the indices were exactly 1, that is, if there were no non-marriage (if all women were married
from ages 15 to 49), no contraception, no postpartum infecundability (beyond a minimum of 1.5
months) and no induced abortion. It is the total fertility rate in the absence of the fertility-
inhibiting effects of the proximate determinants. TF cannot be calculated directly. According to
Bongaarts and Potter (1983), the TFs of most populations fall within the range of 13 to 17 births
per woman, with an average of approximately 15.3. Therefore, multiplying all of the indices
with 15.3 as the maximum number of births produces a predicted model TFR of the population.
Total Marital Fertility Rate (TM): Refers to the average number of births that a woman
would have during ages 15-49 years if she survived that age range and bear children at the
current age specific rates and to remain married during the entire reproductive period
Postpartum Amenorrhoea: Refers to the interval between child birth and the return of
mensuration. The length and intensity of breastfeeding influence the duration of amenorrhoea,
which offers protection from conception. The risk of conception in this period is very low.
Postpartum Abstinence: Refers to the period between child birth and the time when a woman
resumes sexual activity. Delaying the resumption of sexual relations can also prolong
Socio economic Education
Region
Residence
Intermediate
variables Proportion married
Contraceptive use
Postpartum infecundabiliy
Sterility
Fertility
Wealth Poor
Non Poor
14
protection. Women who gave birth in the 3 years preceeding the survey were asked about the
duration of their periods of amenorrhoea and sexual abstinence following birth.
Duration of postpartum insusceptibility: The duration of the postpartum amenorrhoea and the
period of sexual abstinence following birth jointly determine the length of the insusceptibility
period. Women are considered insusceptible if they are abstaining from sex following childbirth
or are amenorrhoeic.
2.6. Definition of Variables and Measurements
In this study there will be two types of variables i.e. Background variables and proximate of
determinants of fertility variables. The background variables are further divided into socio
economic, cultural and demographic factors. The background variables operate through the
proximate determinants to influence fertility; they do not influence fertility directly.
2.6.1. Background Variables
Socio Economic and Cultural Variables
Education: Refers to the number of years of formal schooling years completed. This study
classified levels of education into four categories: no education, primary incomplete, primary
complete and secondary and above level of education.
Marital Status: The Marital defined as either never married, married or living together,
divorced/separated or widowed. Marital status for respondents aged 15 years and above will be
included.
Regions: Refers to the former eight provinces of Kenya. These are Nairobi, Coast, Eastern,
North Eastern, Central, Rift Valley, Nyanza and Western.
Place of Residence: This category refers to where the respondent was living at the time of the
survey, classified as either urban or rural. These are coded as “1” for urban areas and “2” for
rural areas.
Wealth index: The wealth index is a composite measure of a household's cumulative living
standard. The wealth index is calculated using easy to collect data on a household’s ownership

15
of selected asset. It uses Principal Component Analysis of household assets, amenities and
services. In 2003 and 2008/09 KDHS, to measure household wealth, an index was created from
the following household assets data ranging from electricity, radio, TV, bicycle, motorbike and
car as well as dwelling characteristics like source of water and sanitation facilities and type of
material used in flooring. In this study, women are grouped according to their wealth status
under the categories poor and non poor.
2.6.2. Demographic Variables
Age: Age is measured as at the last birthday of the respondent at the time of the interview.
2.6.3. Proximate determinants Variables
Proportion Married: This variable is intended to measure the proportion of women of
reproductive age that engages all women between 15 and 49 years who reported to be currently
married during the surveys are included in this proportion.
Contraceptive Use: Any deliberate parity-dependent practice-including abstention and
sterilization-undertaken to reduce the risk of conception is considered contraception.
Breastfeeding: This is the length of time elapsed since the woman began breastfeeding after
birth to the time of survey.
Sterility: Women are sterile before menarche, the beginning of the menstrual function, and after
menopause, but a couple may become sterile before the woman reaches menopause for reasons
other than contraceptive sterilization.
16
CHAPTER THREE
DATA AND METHODS
3.1. Introduction
This chapter presents sources of data and describes the methods used in data analysis in this
study. It describes the estimation of the indices of the four proximate variables of marriage
pattern, contraceptive use, postpartum infecundability and sterility. It finally explains the
decomposition of the proximate determinants to fertility change.
3.2. Sources of data
The study is based on the analysis of secondary data obtained from the Kenya Demographic and
Health Surveys (KDHS) of 2003 and 2008/09. The surveys were designed to achieve several
objectives including collection of data on fertility levels, trends and differentials of the women
of reproductive age. Both surveys are nationally representative of 10,000 households each and
have been implemented to allow analysis for the country as a whole, the eight former provinces
of Kenya and separately by rural-urban areas. The samples were selected from a national master
sample frame, the fourth National Sample Survey and Evaluation programme (NASSEP IV)
maintained by Kenya National Bureau of Statistics, which follows a two stage sample design.
A total of 400 clusters, 129 urban and 271 rural in 2003 KDHS and 400 clusters, 133 urban and
267 rural in 2008/09 KDHS. The two surveys used three similar and methodology set of
questionnaires (Household, Women and men questionnaires) thus making it comparable. A total
of 8,195 and 8,444 women of reproductive age 15-49 years were interviewed in the KDHS of
2003 and 2008/09, respectively. The proportion of the married women was 54.5 % in 2003 and
54.2% in 2008/09. The Contraception Prevalence Rate (CPR) of the current married women
increased from 39.0 % cent in 2003 to 46.0% in 2008/09. The CPR for both non poor and poor
married women increased from 51.5% to 54% and from 17.9% to 20.1 % in 2003 and 2008/09,
respectively. There has been little change in median duration for any breastfeeding among the
children increasing slightly from 20 months to 21 months between the two survey periods. The
median duration for any breastfeeding among the children from poor families decreased slightly
from 21.6 months in 2003 to 21.4 months in 2008/09) that of the non poor families increased
from 20.1 months in 2003 to 20.5 months in 2008/09). The two surveys did not collect data on
direct economic measures such as income or consumption expenditure but use a composite
wealth index. The wealth index is calculated using data collected on a household’s ownership of
selected assets, such as televisions and bicycles; materials used for housing construction; and
17
types of water access and sanitation facilities. This study will use wealth index to measure the
economic status.
Computed wealth index has been standardized by taking the same asset indicators for each of
the two surveys. The two surveys have divided the wealth index into five equal parts into the
first quintile (poorest), first quintile (poor), middle quintile (middle income), fourth quintile
(rich) and fifth quintile (richest). For this study, women of reproductive age were grouped
according to their wealth status, under two wealth categories i.e. poor and non poor. The lowest
and second lowest quintiles has been combined and is considered as poor while the combined
fourth and fifth quintiles is considered non poor. The middle quintile has been excluded in this
study.
3.3. Method of Data Analysis
The study used Bongaarts model of proximate determinants of fertility as the main method of
data analysis. The results are presented in tables, graphs and in narrative form. Using this
model, the various indices were estimated for each region, by education and place of residence
based on wealth index. The decomposition of the change in TFR between 2003 and 2008/09 is
also presented.
By using the individual woman’s file for the analysis, the composite wealth index will first be
computed to identify the poor and non poor. The two sets, one for the poor and the other for the
non poor are then used separately to decompose the proportional change into components Pm,
Pc, Pi, Pp and Pr. The following three levels would be applied to decompose the components:
i. Determine the measurements of proximate determinants separately by economic status
over the period of time i.e. proportion of women married, proportion currently using
contraceptives, average duration of postpartum infecundability, proportion of women
aged 45-49 years who are infecund and average contraceptive use effectiveness.
ii. Calculate and estimate the effects of the four principal proximate determinants namely,
the proportion married (Cm), use of contraception (Cc), and postpartum infecundability
(Ci) separately by economic status over the period of time using.
18
iii. Calculate the P values from the indices Cm, Cc, and Ci
In order to estimate all the indexes of the intermediate fertility variables in this model, the
following data is required:
i. The total number of married women in each five year age group
ii. The total number of women in each five year age group.
iii. The total births in the in the last 36 months prior to the survey by five year age groups of
married mothers.
iv. Number of children ever born
v. The total number of married women using each modern contraceptive method
vi. Proportion using contraception among married women of reproductive age (15-49 years
vii. The total number of women who are currently breastfeeding.
viii. Mean duration of breastfeeding
ix. Women aged 45-49 who have had no live births
x. Economic status, education level, residence and region of married women
3.4. Computation procedures to estimate of the Indices of proximate determinants
In this study, only four proximate variables are considered namely: marriage pattern (Cm),
contraceptive use (Cc), and postpartum infecundability (Ci) and Sterility (Cp). The indices for
these variables can be estimated from measures of the proximate variables and these estimates
are given below:
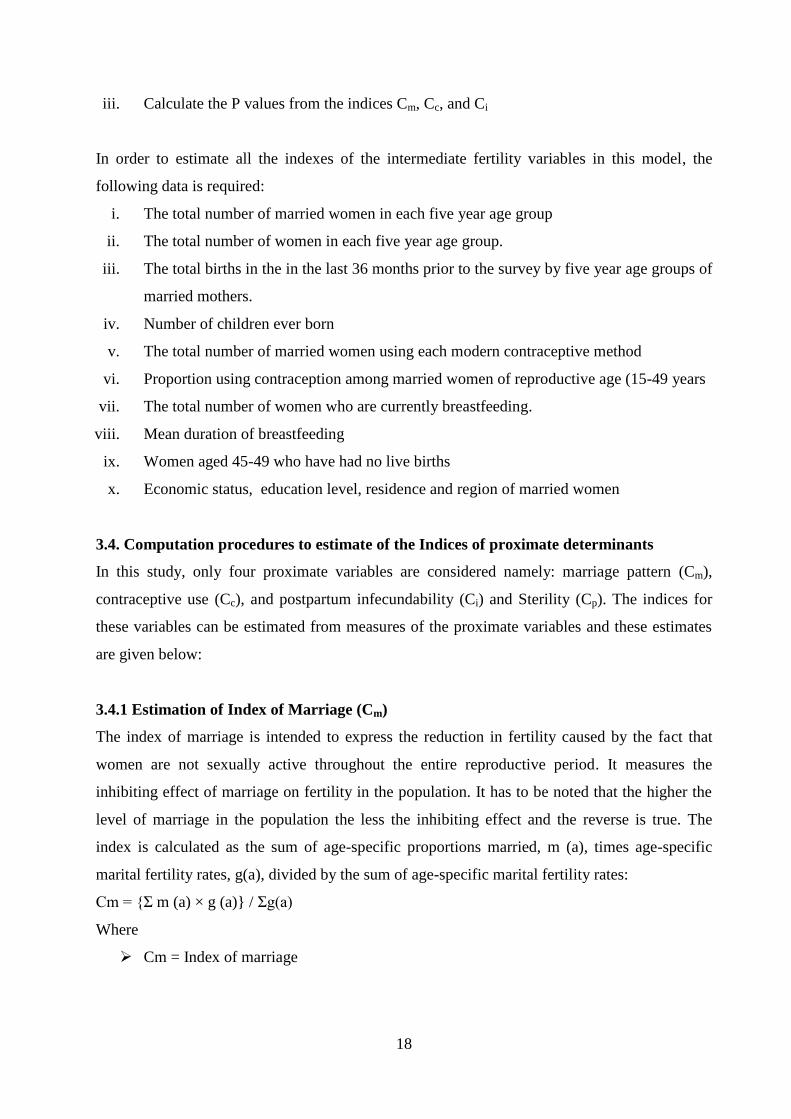
3.4.1 Estimation of Index of Marriage (Cm)
The index of marriage is intended to express the reduction in fertility caused by the fact that
women are not sexually active throughout the entire reproductive period. It measures the
inhibiting effect of marriage on fertility in the population. It has to be noted that the higher the
level of marriage in the population the less the inhibiting effect and the reverse is true. The
index is calculated as the sum of age-specific proportions married, m (a), times age-specific
marital fertility rates, g(a), divided by the sum of age-specific marital fertility rates:
Cm = {Σ m (a) × g (a)} / Σg(a)
Where
Cm = Index of marriage
19
m(a)= Age specific proportions of married females, m(a) is got by dividing the number
of married women of a particular age group by the number of women in the same age
group.
g(a) = Age specific marital fertility rates, g(a) is got by dividing the births of a particular
age group by the number of women in the same age group
The index is often approximated by the proportion of women 15-49 that are married.
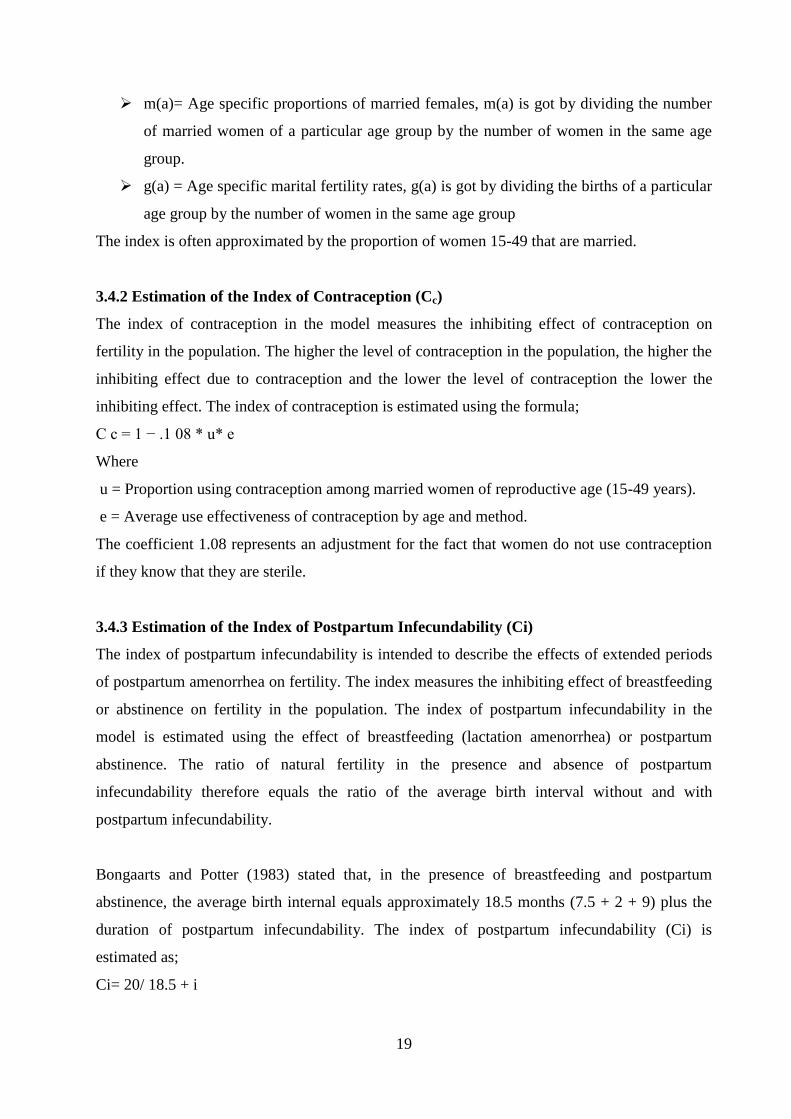
3.4.2 Estimation of the Index of Contraception (Cc)
The index of contraception in the model measures the inhibiting effect of contraception on
fertility in the population. The higher the level of contraception in the population, the higher the
inhibiting effect due to contraception and the lower the level of contraception the lower the
inhibiting effect. The index of contraception is estimated using the formula;
C c = 1 − .1 08 * u* e
Where
u = Proportion using contraception among married women of reproductive age (15-49 years).
e = Average use effectiveness of contraception by age and method.
The coefficient 1.08 represents an adjustment for the fact that women do not use contraception
if they know that they are sterile.
3.4.3 Estimation of the Index of Postpartum Infecundability (Ci)
The index of postpartum infecundability is intended to describe the effects of extended periods
of postpartum amenorrhea on fertility. The index measures the inhibiting effect of breastfeeding
or abstinence on fertility in the population. The index of postpartum infecundability in the
model is estimated using the effect of breastfeeding (lactation amenorrhea) or postpartum
abstinence. The ratio of natural fertility in the presence and absence of postpartum
infecundability therefore equals the ratio of the average birth interval without and with
postpartum infecundability.
Bongaarts and Potter (1983) stated that, in the presence of breastfeeding and postpartum
abstinence, the average birth internal equals approximately 18.5 months (7.5 + 2 + 9) plus the
duration of postpartum infecundability. The index of postpartum infecundability (Ci) is
estimated as;
Ci= 20/ 18.5 + i

20
Where Ci = the index of postpartum infecundability, i = Average duration of postpartum
infecundability caused by breastfeeding or postpartum abstinence. In this study, the index of
postpartum infecundability was estimated using the mean duration of breastfeeding and this was
obtained from a question, which aimed at establishing the duration the most recent child was
breastfed.
Without lactation, a typical average birth interval can be estimated to be 20 months, made
up of 1.5 months of non- lactation infecundity, an average of 7.5 months waiting time to
conception, 2 months added by intrauterine mortality and 9 months gestation. With
lactation, it equals the average total duration of infecundable period plus 18,5 months
(7.5+2+9). The ratio of the average birth intervals without and with lactation is the one
called the index of lactation infecundability, Ci.
3.4.4. Estimation of Index of Primary Sterility (Cp)
Bongaarts developed an equation to estimate the index as a function of primary sterility. The
equation is:
Cp = (7.63 - 0.11 * s) / 7.3
Where
s is the percentage of women aged 45-49 who have had no live births. This equation is equal to
1.0 when three percent of women are childless at age 45-49. Anything above this level is
assumed to be the effect of pathological sterility.
3.5. Decomposition of the Proximate Determinants to Fertility Change
Any change in a population fertility level can be the result of a change in one or more of the
proximate determinants. Thus, it is possible to say that the decomposition of a trend in the TFR
is based on the following equation, which links the TFR to the fertility-inhibiting effects of the
four principal proximate variables:
TFR= Cm*Cc*Ca*Ci*TF
Let 2008/09 and 2003 be the first and last years of the time period for which decomposition is
done. Then, with a change in the TFR from TFR 2003 in the year 2003 to TFR 2008/09 in the
year 2008/09 and with simultaneous changes in the indexes from Cm2003 to Cm2008/09, from
21
Cc2003 to Cc2008/09, from Ca2003 to Ca2008/09, from Ci2003 to Ci2008/09 and from TF2003 to TF2008/09
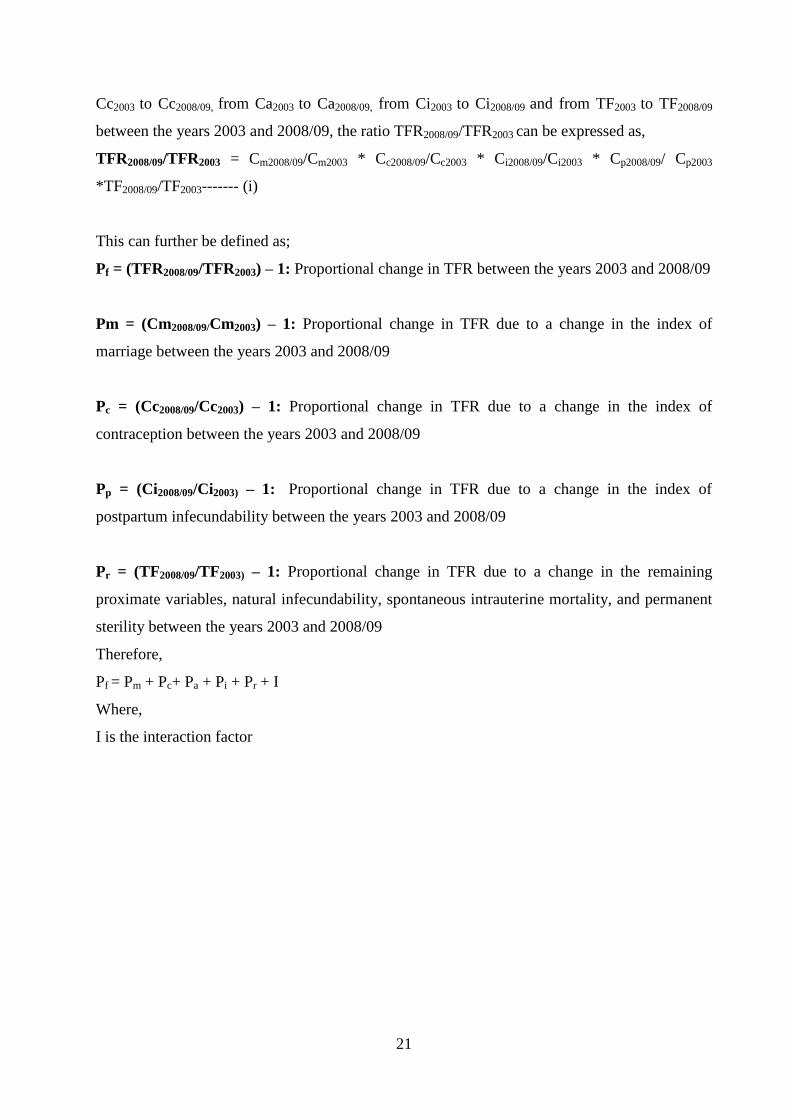
between the years 2003 and 2008/09, the ratio TFR2008/09/TFR2003 can be expressed as,
TFR2008/09/TFR2003 = Cm2008/09/Cm2003 * Cc2008/09/Cc2003 * Ci2008/09/Ci2003 * Cp2008/09/ Cp2003
*TF2008/09/TF2003------- (i)
This can further be defined as;
Pf = (TFR2008/09/TFR2003) – 1: Proportional change in TFR between the years 2003 and 2008/09
Pm = (Cm2008/09/Cm2003) – 1: Proportional change in TFR due to a change in the index of
marriage between the years 2003 and 2008/09
Pc = (Cc2008/09/Cc2003) – 1: Proportional change in TFR due to a change in the index of
contraception between the years 2003 and 2008/09
Pp = (Ci2008/09/Ci2003) – 1: Proportional change in TFR due to a change in the index of
postpartum infecundability between the years 2003 and 2008/09
Pr = (TF2008/09/TF2003) – 1: Proportional change in TFR due to a change in the remaining
proximate variables, natural infecundability, spontaneous intrauterine mortality, and permanent
sterility between the years 2003 and 2008/09
Therefore,
Pf = Pm + Pc+ Pa + Pi + Pr + I
Where,
I is the interaction factor
22
CHAPTER FOUR
FERTILITY INHIBITING EFFECTS OF THE PROXIMATE DETERMINANTS
4.1. Introduction
This chapter presents results of the fertility inhibiting effects of the proximate determinants in
the two KDHS periods of 2003 and 2008/09. The results are based on background variables
such as educational level, region of residence, urban and rural residence.
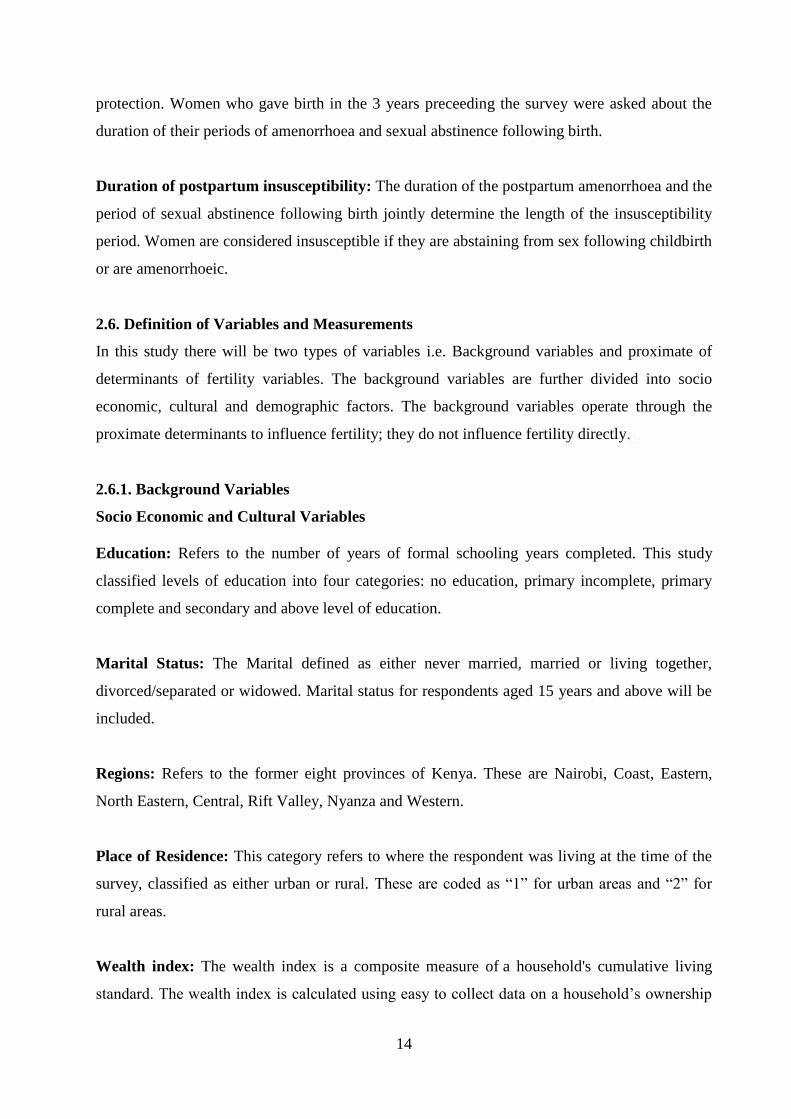
4.2. Background Characteristics of the Survey Population
Table 4.1 shows the demographic and socio economic characteristics of poor and non poor
women. Overall, about 6% and 4% of the women in 2003 and 2008/09, respectively, were in the
age group 15-19 years; about 58 % in 2003 and 61% in 2008/09 in age group 20-34 years; about
28% in 2003 and 25% were in age group 35-44 years. The remaining 8.4% in 2003 and 9.5% of
the women were aged 45-49 years. The proportion of the poor and non poor women in age
group 20-34 years increased from about 57% and 59% in 2003 to 61% and 64% in 2008/09,
respectively. The percentage of poor women in age group 45-49 years increased from 8% in
2003 to 10% in 2008/09 while that of the non poor women decreased from 8% to 7.8% over the
same period. The proportion of those in the age 15-19 decreased from 6.6% in 2003 to 5.7% in
2008/09 among the poor women and from 5.6% in 2003 to 3.4% in 2008/09 among the non
poor women. Similarly, for those in age group 35-44 years, the proportion decreased from about
29% and 27% in 2003 to 23% and 25% in 2008/09 among the poor and non women,
respectively.
On education attainment, about 11.8% of the married women had no education, 29% incomplete
primary education and primary education and 30.3% had secondary education and above. A
large proportion of poor women had no education, primary incomplete and primary complete
education compared to non poor women in both the two periods. On the other hand, bigger
proportion of non poor women is much more likely to complete primary and secondary school
than the poor women. Almost nine in ten women were either Roman Catholic or Protestant
Christians while 9% are Muslim in both the two periods. Majority of the poor and non poor
were Protestant Christians followed by Roman Catholic and Muslim, in that order.
Overall, Rift Valley region (27%) had the highest proportion of women while North Eastern
(3%) had lowest proportion. In terms of place of residence, slightly over three quarters of the
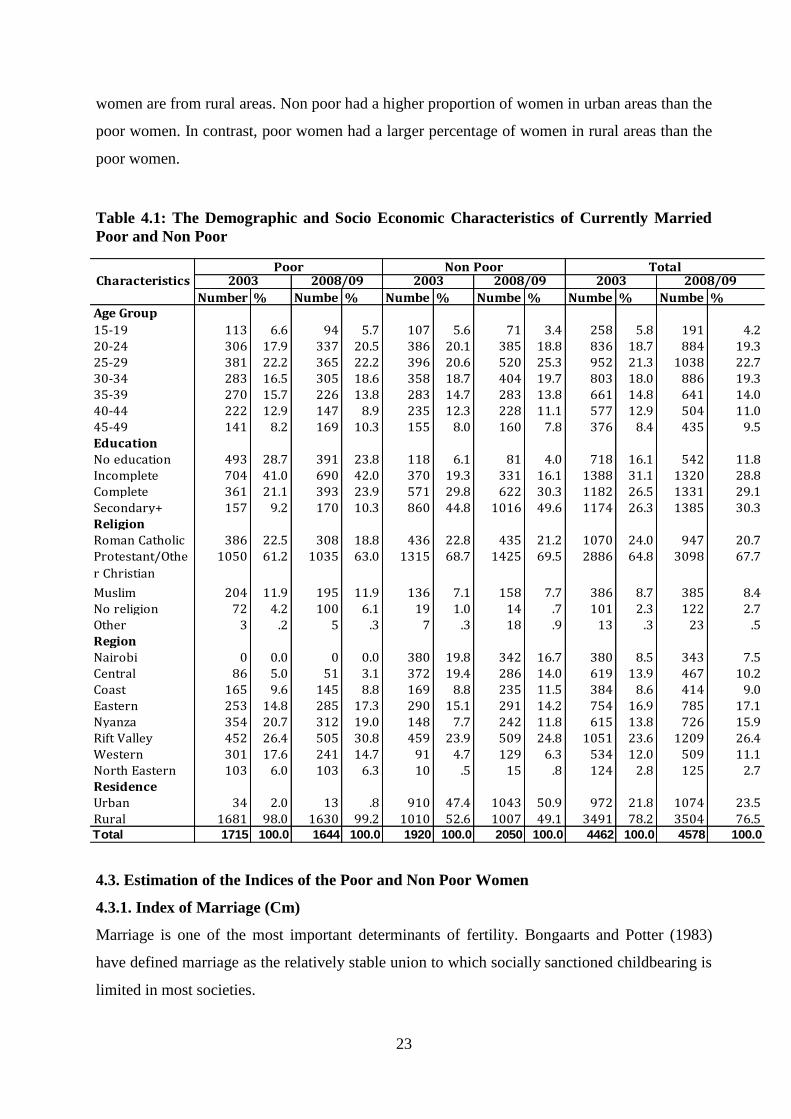
23
women are from rural areas. Non poor had a higher proportion of women in urban areas than the
poor women. In contrast, poor women had a larger percentage of women in rural areas than the
poor women.
Table 4.1: The Demographic and Socio Economic Characteristics of Currently Married
Poor and Non Poor
Number % Numbe % Numbe % Numbe % Numbe % Numbe %Age Group
15-19 113 6.6 94 5.7 107 5.6 71 3.4 258 5.8 191 4.220-24 306 17.9 337 20.5 386 20.1 385 18.8 836 18.7 884 19.325-29 381 22.2 365 22.2 396 20.6 520 25.3 952 21.3 1038 22.730-34 283 16.5 305 18.6 358 18.7 404 19.7 803 18.0 886 19.335-39 270 15.7 226 13.8 283 14.7 283 13.8 661 14.8 641 14.040-44 222 12.9 147 8.9 235 12.3 228 11.1 577 12.9 504 11.045-49 141 8.2 169 10.3 155 8.0 160 7.8 376 8.4 435 9.5EducationNo education 493 28.7 391 23.8 118 6.1 81 4.0 718 16.1 542 11.8Incomplete 704 41.0 690 42.0 370 19.3 331 16.1 1388 31.1 1320 28.8Complete 361 21.1 393 23.9 571 29.8 622 30.3 1182 26.5 1331 29.1Secondary+ 157 9.2 170 10.3 860 44.8 1016 49.6 1174 26.3 1385 30.3ReligionRoman Catholic 386 22.5 308 18.8 436 22.8 435 21.2 1070 24.0 947 20.7Protestant/Othe
r Christian
1050 61.2 1035 63.0 1315 68.7 1425 69.5 2886 64.8 3098 67.7
Muslim 204 11.9 195 11.9 136 7.1 158 7.7 386 8.7 385 8.4No religion 72 4.2 100 6.1 19 1.0 14 .7 101 2.3 122 2.7Other 3 .2 5 .3 7 .3 18 .9 13 .3 23 .5RegionNairobi 0 0.0 0 0.0 380 19.8 342 16.7 380 8.5 343 7.5Central 86 5.0 51 3.1 372 19.4 286 14.0 619 13.9 467 10.2Coast 165 9.6 145 8.8 169 8.8 235 11.5 384 8.6 414 9.0Eastern 253 14.8 285 17.3 290 15.1 291 14.2 754 16.9 785 17.1Nyanza 354 20.7 312 19.0 148 7.7 242 11.8 615 13.8 726 15.9Rift Valley 452 26.4 505 30.8 459 23.9 509 24.8 1051 23.6 1209 26.4Western 301 17.6 241 14.7 91 4.7 129 6.3 534 12.0 509 11.1North Eastern 103 6.0 103 6.3 10 .5 15 .8 124 2.8 125 2.7ResidenceUrban 34 2.0 13 .8 910 47.4 1043 50.9 972 21.8 1074 23.5Rural 1681 98.0 1630 99.2 1010 52.6 1007 49.1 3491 78.2 3504 76.5Total 1715 100.0 1644 100.0 1920 100.0 2050 100.0 4462 100.0 4578 100.0
2008/09Poor Non Poor Total
Characteristics 2003 2008/09 2003 2008/09 2003
4.3. Estimation of the Indices of the Poor and Non Poor Women
4.3.1. Index of Marriage (Cm)
Marriage is one of the most important determinants of fertility. Bongaarts and Potter (1983)
have defined marriage as the relatively stable union to which socially sanctioned childbearing is
limited in most societies.
24
The index of marriage measures the inhibiting effect of marriage on fertility in the population.
The higher the level of marriage in the population, the less the inhibiting effect on fertility and
vice versa. The index Cm gives the proportion by which TFR is smaller than TM as the result of
non marriage. The index is calculated as the ratio of the Total Fertility Rate (TFR) to the Total
Marital Fertility Rate (TM) i.e. Cm = TFR/TMFR. TM is the average number of children that a
woman would have during ages 15-49 if she survived that age range and had children at the
current age-specific rates for ever-married women. These rates include all births but are limited
to ever-married women, and are therefore larger than the usual age-specific fertility rates.
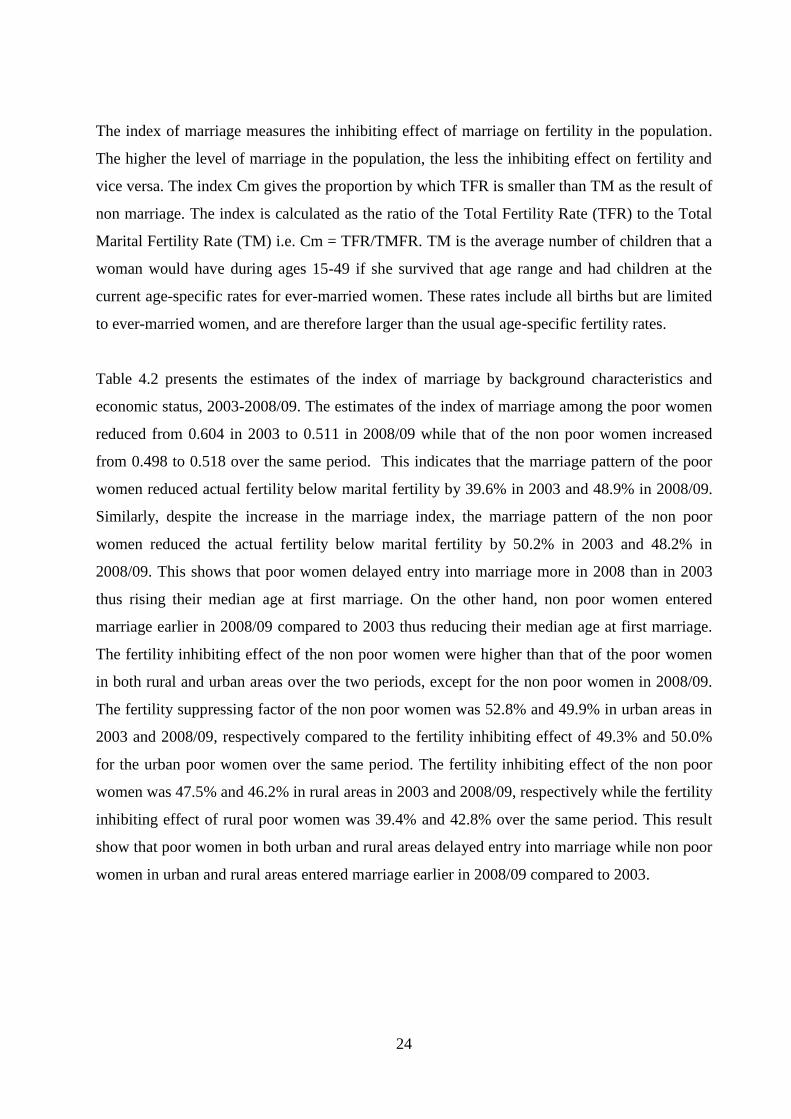
Table 4.2 presents the estimates of the index of marriage by background characteristics and
economic status, 2003-2008/09. The estimates of the index of marriage among the poor women
reduced from 0.604 in 2003 to 0.511 in 2008/09 while that of the non poor women increased
from 0.498 to 0.518 over the same period. This indicates that the marriage pattern of the poor
women reduced actual fertility below marital fertility by 39.6% in 2003 and 48.9% in 2008/09.
Similarly, despite the increase in the marriage index, the marriage pattern of the non poor
women reduced the actual fertility below marital fertility by 50.2% in 2003 and 48.2% in
2008/09. This shows that poor women delayed entry into marriage more in 2008 than in 2003
thus rising their median age at first marriage. On the other hand, non poor women entered
marriage earlier in 2008/09 compared to 2003 thus reducing their median age at first marriage.
The fertility inhibiting effect of the non poor women were higher than that of the poor women
in both rural and urban areas over the two periods, except for the non poor women in 2008/09.
The fertility suppressing factor of the non poor women was 52.8% and 49.9% in urban areas in
2003 and 2008/09, respectively compared to the fertility inhibiting effect of 49.3% and 50.0%
for the urban poor women over the same period. The fertility inhibiting effect of the non poor
women was 47.5% and 46.2% in rural areas in 2003 and 2008/09, respectively while the fertility
inhibiting effect of rural poor women was 39.4% and 42.8% over the same period. This result
show that poor women in both urban and rural areas delayed entry into marriage while non poor
women in urban and rural areas entered marriage earlier in 2008/09 compared to 2003.
25
Table 4.2: Estimates of the index of marriage by background characteristics
and Economic Status, 2003-2008/09
Cm Cm Characteristics Poor Non Poor
2003 2008/09 % change 2003 2008/09
% change
Residence Urban 0.507 0.500 -1.4 0.472 0.501 6.1 Rural 0.606 0.572 -5.6 0.525 0.538 2.5 Region
Nairobi _ _ _ 0.456 0.470 3.1 Central 0.486 0.490 0.8 0.520 0.512 -1.5 Coast 0.705 0.639 -9.4 0.501 0.609 21.6 Eastern 0.576 0.589 2.3 0.530 0.563 6.2 Nyanza 0.532 0.542 1.9 0.465 0.494 6.2 Rift Valley 0.630 0.547 -13.2 0.521 0.516 -1.0 Western 0.643 0.571 -11.2 0.453 0.498 9.9 North Eastern 0.752 0.730 -2.9 0.667 0.455 -31.8 Education No education 0.737 0.739 0.3 0.551 0.600 8.9 Primary incomplete 0.556 0.541 -2.7 0.458 0.486 6.1
Primary complete 0.620 0.572 -7.7 0.529 0.583 10.2 Secondary & Above 0.488 0.440 -9.8 0.491 0.490 -0.2
Total 0.604 0.511 -15.4 0.498 0.518 4.0
In terms of regions, fertility decline among poor women were noted in all provinces except
among poor women with no education and in Eastern and Nyanza Provinces. Fertility decline
among non poor women were observed in Central, Rift Valley and North Eastern Provinces as
well as among non poor women with secondary and above education. This means that poor
women with no education and those in Eastern and Nyanza Provinces tend to marry earlier than
before while for non poor women, those with secondary and above education and from Central,
Rift Valley and North Eastern Provinces tend to marry later. North Eastern Province and poor
women with no education had the lowest fertility inhibiting effect among poor women at 24.8%
in 2003 and 26.1% in 2008/9, respectively. For the non poor women, North Eastern and Coast
Provinces had the lowest inhibiting effect at 33.3% in 2003 and 39.1% in 2008/09, respectively.
On the other, Central Province and poor women with secondary and above education had the
highest fertility in inhibiting effect of marriage for the poor women at 51.4% in 2003 while and
56.0%% in 2008/9, respectively. For the non poor women, Western and North Eastern
Provinces had the highest inhibiting effect of marriage at 54.7% in 2003 and 54.5% in 2008/9.
26
Coast Province had the highest positive change at 21.6% in the effect of marriage while North
Eastern Province at 31.8% had the highest negative change among the non poor women. On the
other hand, among non poor women, rural areas had the lowest positive change at 2.5% while
non poor women with secondary and above education had the lowest negative change at 1.0%
in the effect of marriage. Among the poor women, Eastern Province had the highest positive
change at 2.3% in the effect of marriage while Rift Valley Province at 13.2% had the highest
negative change. Poor women with no education had the lowest marginal positive change while
urban poor women had the lowest negative change at 1.4% in the effect of marriage. Education
has had varying effect on index of marriage for both the poor and non-poor. Apart from poor
women with no education fertility inhibiting effect of poor women with other levels of
education increased from 2003 to 2008/09. The fertility inhibiting effects of non poor women
with secondary and above education increased while fertility inhibiting effects of non poor
women with no education, primary incomplete and primary education reduced. Similarly, the
fertility inhibiting effect increased with the level of education, except for the primary
incomplete and primary complete for both the poor and non poor in both the two periods. The
increase in inhibiting effect could be attributed to the delay in entry of women into marriage due
to acquisition of higher levels of education.
4.3.2. Index of Contraception (Cc)
Among populations, contraceptive practice is the intermediate fertility variable primarily
responsible for the wide range in the levels of fertility within marriage (Bongaarts, 1978).
Contraception has a direct negative impact on fertility. The index of contraception in the model
measures the inhibiting effect of contraception on fertility in the population. The higher the
level of contraception in the population, the higher the inhibiting effect due to contraception and
the lower the level of contraception the lower the inhibiting effect. The reciprocal of the index
of contraception provides the magnitude by which total marital rate (TN) is reduced relative to
total marital fertility rate (TM) by contraceptive practice.
Table 4.3 shows that the that the fertility inhibiting effect of contraception for the poor women
increased from 15.0 % in 2003 to 18.8 % in 2008/09 while that of the non poor women reduced
from 37.1.% to 34.9.% over the two survey periods. This shows that poor women contributed
more towards fertility decline than the non poor women over the two periods. Between 2003
and 2008/09, the fertility inhibiting effect of contraception among poor women increased in all
the sub population except in Eastern Province, among poor women who did not complete
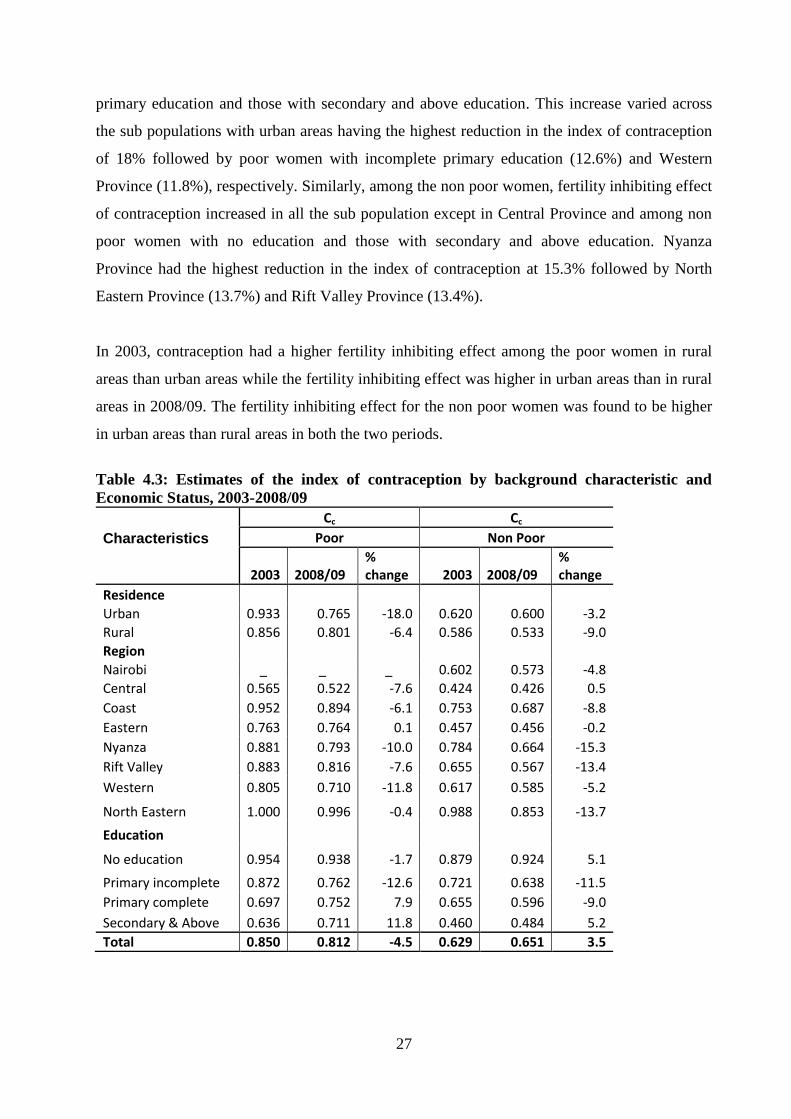
27
primary education and those with secondary and above education. This increase varied across
the sub populations with urban areas having the highest reduction in the index of contraception
of 18% followed by poor women with incomplete primary education (12.6%) and Western
Province (11.8%), respectively. Similarly, among the non poor women, fertility inhibiting effect
of contraception increased in all the sub population except in Central Province and among non
poor women with no education and those with secondary and above education. Nyanza
Province had the highest reduction in the index of contraception at 15.3% followed by North
Eastern Province (13.7%) and Rift Valley Province (13.4%).
In 2003, contraception had a higher fertility inhibiting effect among the poor women in rural
areas than urban areas while the fertility inhibiting effect was higher in urban areas than in rural
areas in 2008/09. The fertility inhibiting effect for the non poor women was found to be higher
in urban areas than rural areas in both the two periods.
Table 4.3: Estimates of the index of contraception by background characteristic and
Economic Status, 2003-2008/09
Cc Cc
Characteristics Poor Non Poor
2003 2008/09 % change 2003 2008/09
% change
Residence Urban 0.933 0.765 -18.0 0.620 0.600 -3.2 Rural 0.856 0.801 -6.4 0.586 0.533 -9.0 Region Nairobi _ _ _ 0.602 0.573 -4.8 Central 0.565 0.522 -7.6 0.424 0.426 0.5 Coast 0.952 0.894 -6.1 0.753 0.687 -8.8 Eastern 0.763 0.764 0.1 0.457 0.456 -0.2 Nyanza 0.881 0.793 -10.0 0.784 0.664 -15.3 Rift Valley 0.883 0.816 -7.6 0.655 0.567 -13.4
Western 0.805 0.710 -11.8 0.617 0.585 -5.2
North Eastern 1.000 0.996 -0.4 0.988 0.853 -13.7
Education
No education 0.954 0.938 -1.7 0.879 0.924 5.1
Primary incomplete 0.872 0.762 -12.6 0.721 0.638 -11.5 Primary complete 0.697 0.752 7.9 0.655 0.596 -9.0
Secondary & Above 0.636 0.711 11.8 0.460 0.484 5.2 Total 0.850 0.812 -4.5 0.629 0.651 3.5
28
The index of contraception declined in all sub populations among the poor women except in
Eastern Province, among poor women with primary education and those with secondary and
above education, whereas among non poor women, the index of contraception declined in all
sub populations except in Central Province, among non poor women with no education and
those with secondary and above education. Across the sub populations, Central Province had
the highest fertility inhibiting effect for both the poor and non poor women between 2003 and
2008/9. The fertility inhibiting effect in this province increased from 43.5% in 2003 to 47.8% in
2008/9 for the poor women and reduced from 57.6% to 57.4% for the non poor women over the
same period. North Eastern province had the lowest fertility inhibiting effect for the poor
women. Among the non poor women, North Eastern in 2003 and non poor women who had no
education in 2008/09 had the lowest fertility inhibiting effect.
The fertility inhibiting effect increased among the poor women with no education and primary
incomplete education, whereas the inhibiting factor reduced among poor women with primary
and secondary and above education. Among the non poor women, fertility inhibiting effect
increased among non poor women with primary incomplete and primary complete education
while it reduced among those with no education and secondary and above education. Generally,
non poor women had higher fertility inhibiting effect in all sub populations compared to the
poor women.
4.3.3. Estimation of the Index of Postpartum (Ci)
Breastfeeding and postpartum amenorrhoea and abstinence are associated with fertility. Women
are considered infecundable if they are not exposed to the risk of conception either because they
are amenorrhoeic or are abstaining from sexual intercourse after childbirth. Postpartum
infecundability is one of the four proximate factors through which economic, social and other
factors operate to influence fertility. The index of postpartum infecundability measures the
inhibiting effects of postpartum amenorrhea and breastfeeding on fertility in the population. The
longer the duration, the higher is its effect inhibiting fertility. The index of postpartum
infecundability measures to the extent postpartum infecundability reduces Total Fecundity Rate.
Table 4.4 presents the estimates of the index of postpartum infecundability by background
characteristics and economic status for the periods 2003 and 2008/09. Overall, the postpartum
infecundability reduced the total fecundity rate of the poor women by 36.1% in 2003 and 38.5%
in 2008/09. The fertility inhibiting effect of the non poor women reduced the total fecundity rate
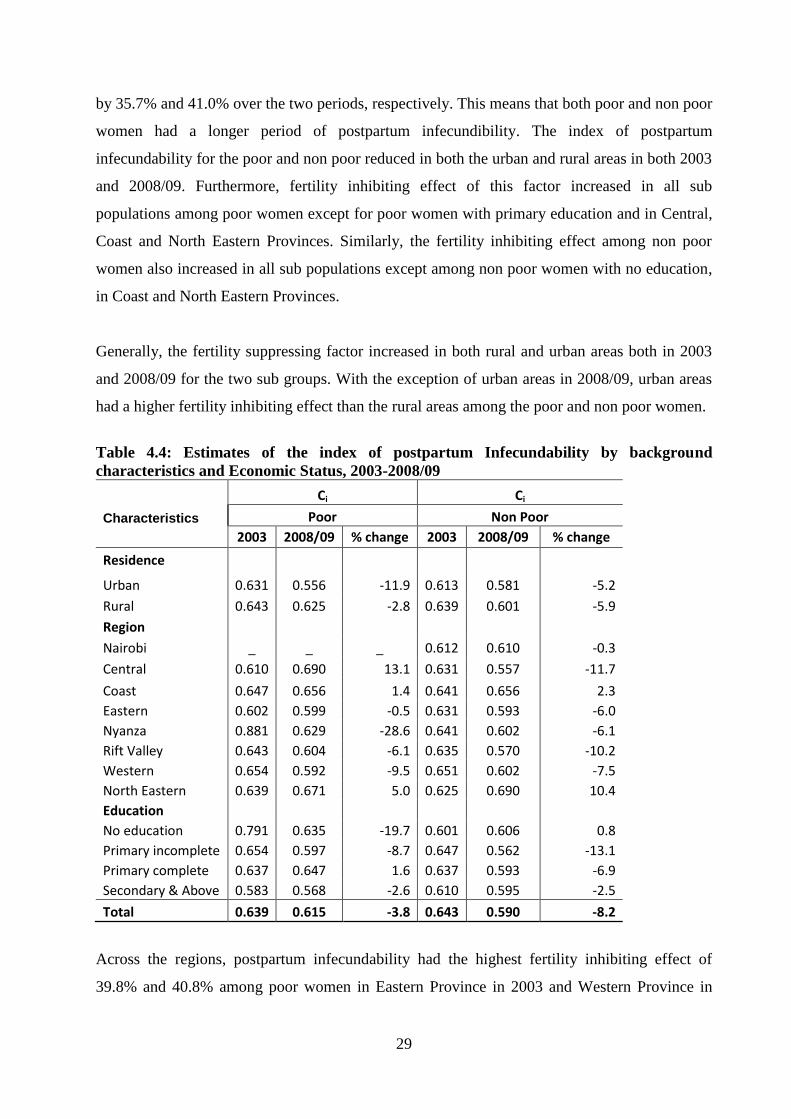
29
by 35.7% and 41.0% over the two periods, respectively. This means that both poor and non poor
women had a longer period of postpartum infecundibility. The index of postpartum
infecundability for the poor and non poor reduced in both the urban and rural areas in both 2003
and 2008/09. Furthermore, fertility inhibiting effect of this factor increased in all sub
populations among poor women except for poor women with primary education and in Central,
Coast and North Eastern Provinces. Similarly, the fertility inhibiting effect among non poor
women also increased in all sub populations except among non poor women with no education,
in Coast and North Eastern Provinces.
Generally, the fertility suppressing factor increased in both rural and urban areas both in 2003
and 2008/09 for the two sub groups. With the exception of urban areas in 2008/09, urban areas
had a higher fertility inhibiting effect than the rural areas among the poor and non poor women.
Table 4.4: Estimates of the index of postpartum Infecundability by background
characteristics and Economic Status, 2003-2008/09
Ci Ci
Characteristics Poor Non Poor
2003 2008/09 % change 2003 2008/09 % change
Residence
Urban 0.631 0.556 -11.9 0.613 0.581 -5.2
Rural 0.643 0.625 -2.8 0.639 0.601 -5.9
Region
Nairobi _ _ _ 0.612 0.610 -0.3
Central 0.610 0.690 13.1 0.631 0.557 -11.7
Coast 0.647 0.656 1.4 0.641 0.656 2.3 Eastern 0.602 0.599 -0.5 0.631 0.593 -6.0 Nyanza 0.881 0.629 -28.6 0.641 0.602 -6.1 Rift Valley 0.643 0.604 -6.1 0.635 0.570 -10.2
Western 0.654 0.592 -9.5 0.651 0.602 -7.5 North Eastern 0.639 0.671 5.0 0.625 0.690 10.4 Education No education 0.791 0.635 -19.7 0.601 0.606 0.8 Primary incomplete 0.654 0.597 -8.7 0.647 0.562 -13.1 Primary complete 0.637 0.647 1.6 0.637 0.593 -6.9 Secondary & Above 0.583 0.568 -2.6 0.610 0.595 -2.5
Total 0.639 0.615 -3.8 0.643 0.590 -8.2
Across the regions, postpartum infecundability had the highest fertility inhibiting effect of
39.8% and 40.8% among poor women in Eastern Province in 2003 and Western Province in

30
2008/09, respectively. For the non poor women, Nairobi and Central Provinces had the highest
fertility inhibiting effect of 38.8% in 2003 and 44.3% in 2008/09, respectively. On the other
hand, Nyanza and Central Provinces had the lowest fertility inhibiting effect of 11.9% in 2003
and 31.0% in 2008/09 among poor women, respectively. For the non poor, Western Province
with 34.9% in 2003 and North Eastern Province with 31.0 % in 2008/09 had the lowest
inhibiting effect.
On education, poor women with secondary and above education had the highest fertility
inhibiting effect in both 2003 and 2008/09 while poor women with no education had the lowest
fertility inhibiting effect in the two periods. Non poor women with no education in 2003 and
those who did not complete primary education in 2008/09 had the highest fertility inhibiting
effect. The non poor women with incomplete primary education in 2003 and those with
secondary and above education in 2008/09 had the lowest fertility inhibiting effect. With
exception of women who did not complete primary education in 2003 and those with secondary
and above education in the two periods, there was a higher fertility inhibiting effect among non
poor women in all level of education than the poor women. This means that non poor women
had a longer period of postpartum infecundibility than poor women within the same level of
education.
4.3.4. Estimation of Index of Primary Sterility (Cp)
The index of sterility was calculated using all ever married women (both formerly married and
currently married). The findings indicated that primary sterility had no any fertility effect for all
ever-married women aged 45-49 years in 2003 and 2008/09.
4.4. Role of the major Proximate Determinants by Economic Status
Tables 4.5 and 4.6 show the estimated indices of the proximate determinants of fertility by
economic status for the years 2003 and 2008/09. The findings indicate marriage pattern has
played an important for both poor and non poor women in the two surveys periods. Postpartum
infecundability followed for the poor women in 2003 while contraceptive use was second
among poor and non poor women in 2008/09. For the non poor women in 2003, contraceptive
use was second followed by postpartum infecundability. These results were consistent with the
other studies conducted earlier (Nabanita and Faujdar, 2013; Lubaale et al, 2007) where the
effect of marriage was found to reduce fertility. The findings were also inconsistent with the
other studies (Nabanita and Faujdar, 2013; Kiersten et al 2011; Getu and Worku, 2009; Chuks,
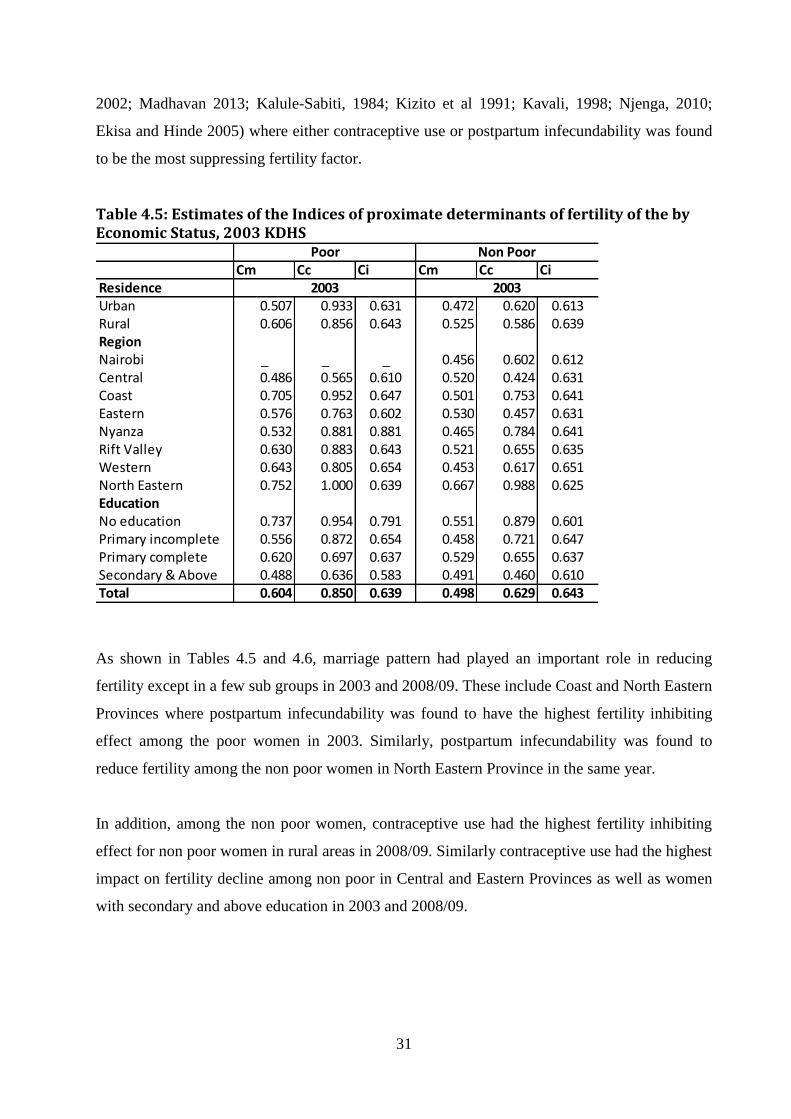
31
2002; Madhavan 2013; Kalule-Sabiti, 1984; Kizito et al 1991; Kavali, 1998; Njenga, 2010;
Ekisa and Hinde 2005) where either contraceptive use or postpartum infecundability was found
to be the most suppressing fertility factor.
Table 4.5: Estimates of the Indices of proximate determinants of fertility of the by Economic Status, 2003 KDHS
As shown in Tables 4.5 and 4.6, marriage pattern had played an important role in reducing
fertility except in a few sub groups in 2003 and 2008/09. These include Coast and North Eastern
Provinces where postpartum infecundability was found to have the highest fertility inhibiting
effect among the poor women in 2003. Similarly, postpartum infecundability was found to
reduce fertility among the non poor women in North Eastern Province in the same year.
In addition, among the non poor women, contraceptive use had the highest fertility inhibiting
effect for non poor women in rural areas in 2008/09. Similarly contraceptive use had the highest
impact on fertility decline among non poor in Central and Eastern Provinces as well as women
with secondary and above education in 2003 and 2008/09.
Cm Cc Ci Cm Cc CiResidenceUrban 0.507 0.933 0.631 0.472 0.620 0.613Rural 0.606 0.856 0.643 0.525 0.586 0.639RegionNairobi _ _ _ 0.456 0.602 0.612Central 0.486 0.565 0.610 0.520 0.424 0.631Coast 0.705 0.952 0.647 0.501 0.753 0.641Eastern 0.576 0.763 0.602 0.530 0.457 0.631Nyanza 0.532 0.881 0.881 0.465 0.784 0.641Rift Valley 0.630 0.883 0.643 0.521 0.655 0.635Western 0.643 0.805 0.654 0.453 0.617 0.651North Eastern 0.752 1.000 0.639 0.667 0.988 0.625EducationNo education 0.737 0.954 0.791 0.551 0.879 0.601Primary incomplete 0.556 0.872 0.654 0.458 0.721 0.647Primary complete 0.620 0.697 0.637 0.529 0.655 0.637Secondary & Above 0.488 0.636 0.583 0.491 0.460 0.610Total 0.604 0.850 0.639 0.498 0.629 0.643
2003 2003
Poor Non Poor
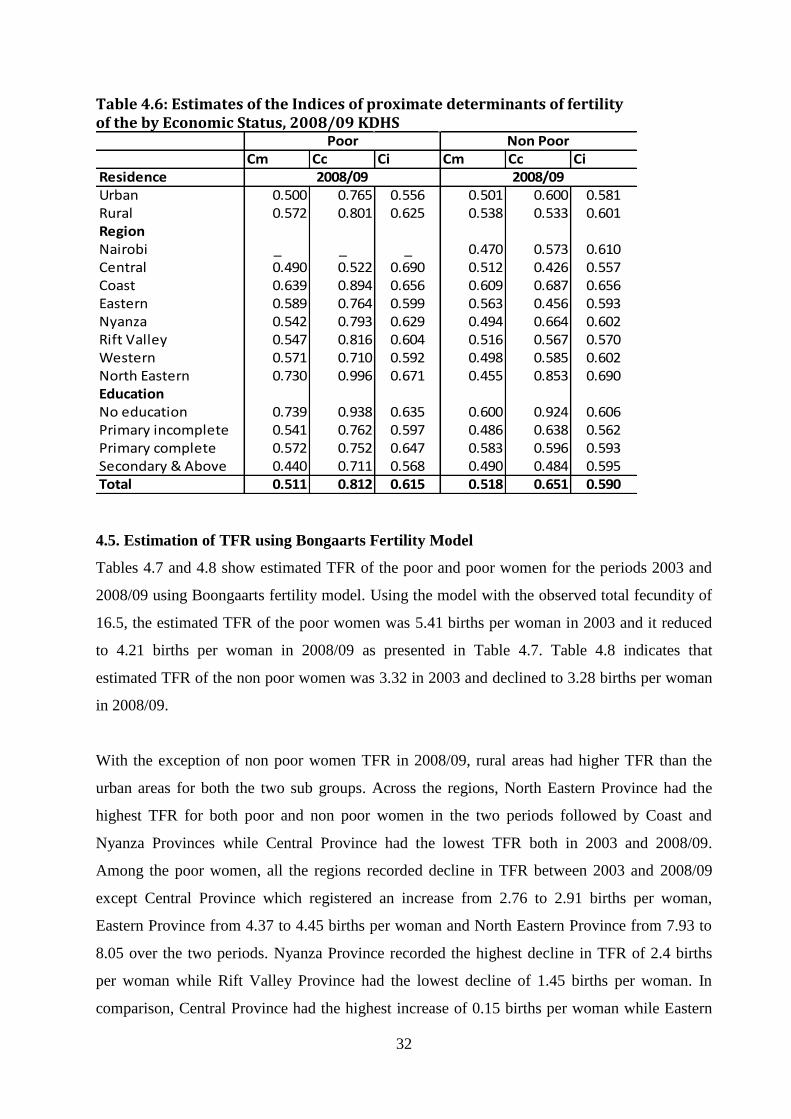
32
Table 4.6: Estimates of the Indices of proximate determinants of fertility of the by Economic Status, 2008/09 KDHS
Cm Cc Ci Cm Cc CiResidenceUrban 0.500 0.765 0.556 0.501 0.600 0.581Rural 0.572 0.801 0.625 0.538 0.533 0.601RegionNairobi _ _ _ 0.470 0.573 0.610Central 0.490 0.522 0.690 0.512 0.426 0.557Coast 0.639 0.894 0.656 0.609 0.687 0.656Eastern 0.589 0.764 0.599 0.563 0.456 0.593Nyanza 0.542 0.793 0.629 0.494 0.664 0.602Rift Valley 0.547 0.816 0.604 0.516 0.567 0.570Western 0.571 0.710 0.592 0.498 0.585 0.602North Eastern 0.730 0.996 0.671 0.455 0.853 0.690EducationNo education 0.739 0.938 0.635 0.600 0.924 0.606Primary incomplete 0.541 0.762 0.597 0.486 0.638 0.562Primary complete 0.572 0.752 0.647 0.583 0.596 0.593Secondary & Above 0.440 0.711 0.568 0.490 0.484 0.595Total 0.511 0.812 0.615 0.518 0.651 0.590
2008/09 2008/09
Poor Non Poor
4.5. Estimation of TFR using Bongaarts Fertility Model
Tables 4.7 and 4.8 show estimated TFR of the poor and poor women for the periods 2003 and
2008/09 using Boongaarts fertility model. Using the model with the observed total fecundity of
16.5, the estimated TFR of the poor women was 5.41 births per woman in 2003 and it reduced
to 4.21 births per woman in 2008/09 as presented in Table 4.7. Table 4.8 indicates that
estimated TFR of the non poor women was 3.32 in 2003 and declined to 3.28 births per woman
in 2008/09.
With the exception of non poor women TFR in 2008/09, rural areas had higher TFR than the
urban areas for both the two sub groups. Across the regions, North Eastern Province had the
highest TFR for both poor and non poor women in the two periods followed by Coast and
Nyanza Provinces while Central Province had the lowest TFR both in 2003 and 2008/09.
Among the poor women, all the regions recorded decline in TFR between 2003 and 2008/09
except Central Province which registered an increase from 2.76 to 2.91 births per woman,
Eastern Province from 4.37 to 4.45 births per woman and North Eastern Province from 7.93 to
8.05 over the two periods. Nyanza Province recorded the highest decline in TFR of 2.4 births
per woman while Rift Valley Province had the lowest decline of 1.45 births per woman. In
comparison, Central Province had the highest increase of 0.15 births per woman while Eastern
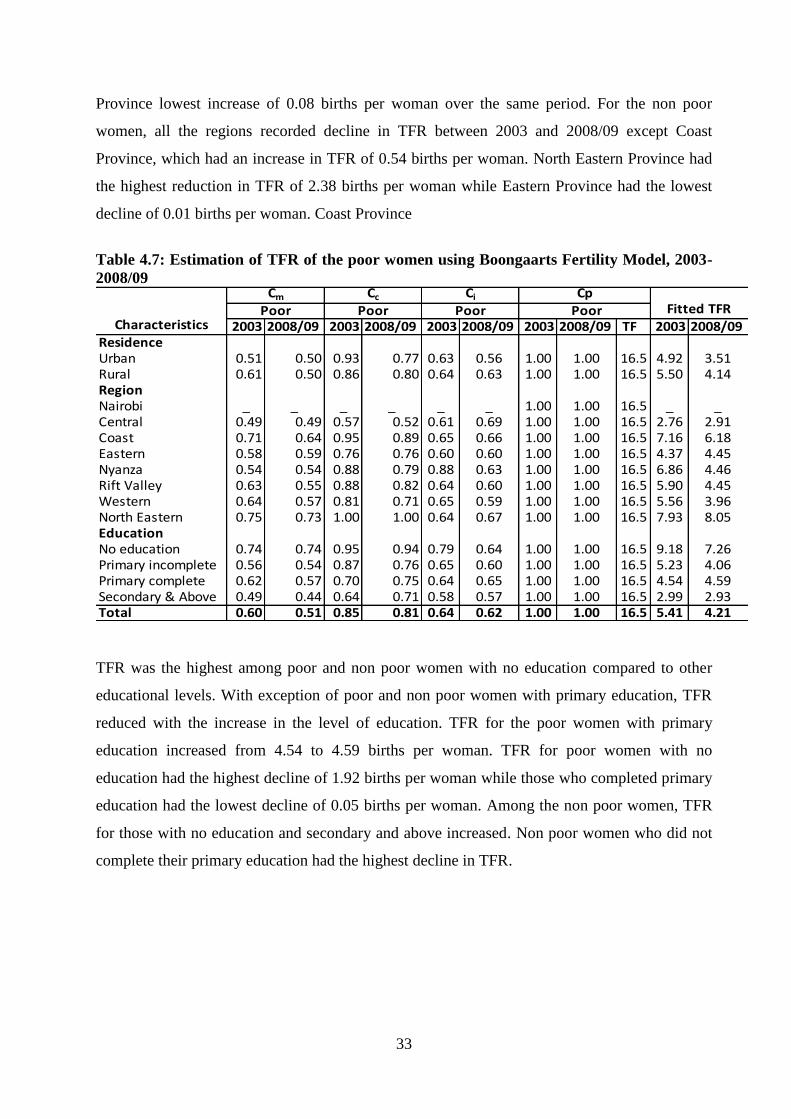
33
Province lowest increase of 0.08 births per woman over the same period. For the non poor
women, all the regions recorded decline in TFR between 2003 and 2008/09 except Coast
Province, which had an increase in TFR of 0.54 births per woman. North Eastern Province had
the highest reduction in TFR of 2.38 births per woman while Eastern Province had the lowest
decline of 0.01 births per woman. Coast Province
Table 4.7: Estimation of TFR of the poor women using Boongaarts Fertility Model, 2003-
2008/09
2003 2008/09 2003 2008/09 2003 2008/09 2003 2008/09 TF 2003 2008/09ResidenceUrban 0.51 0.50 0.93 0.77 0.63 0.56 1.00 1.00 16.5 4.92 3.51Rural 0.61 0.50 0.86 0.80 0.64 0.63 1.00 1.00 16.5 5.50 4.14RegionNairobi _ _ _ _ _ _ 1.00 1.00 16.5 _ _Central 0.49 0.49 0.57 0.52 0.61 0.69 1.00 1.00 16.5 2.76 2.91Coast 0.71 0.64 0.95 0.89 0.65 0.66 1.00 1.00 16.5 7.16 6.18Eastern 0.58 0.59 0.76 0.76 0.60 0.60 1.00 1.00 16.5 4.37 4.45Nyanza 0.54 0.54 0.88 0.79 0.88 0.63 1.00 1.00 16.5 6.86 4.46Rift Valley 0.63 0.55 0.88 0.82 0.64 0.60 1.00 1.00 16.5 5.90 4.45Western 0.64 0.57 0.81 0.71 0.65 0.59 1.00 1.00 16.5 5.56 3.96North Eastern 0.75 0.73 1.00 1.00 0.64 0.67 1.00 1.00 16.5 7.93 8.05EducationNo education 0.74 0.74 0.95 0.94 0.79 0.64 1.00 1.00 16.5 9.18 7.26Primary incomplete 0.56 0.54 0.87 0.76 0.65 0.60 1.00 1.00 16.5 5.23 4.06Primary complete 0.62 0.57 0.70 0.75 0.64 0.65 1.00 1.00 16.5 4.54 4.59Secondary & Above 0.49 0.44 0.64 0.71 0.58 0.57 1.00 1.00 16.5 2.99 2.93Total 0.60 0.51 0.85 0.81 0.64 0.62 1.00 1.00 16.5 5.41 4.21
Characteristics
Cm Cc Ci CpFitted TFRPoor Poor Poor Poor
TFR was the highest among poor and non poor women with no education compared to other
educational levels. With exception of poor and non poor women with primary education, TFR
reduced with the increase in the level of education. TFR for the poor women with primary
education increased from 4.54 to 4.59 births per woman. TFR for poor women with no
education had the highest decline of 1.92 births per woman while those who completed primary
education had the lowest decline of 0.05 births per woman. Among the non poor women, TFR
for those with no education and secondary and above increased. Non poor women who did not
complete their primary education had the highest decline in TFR.
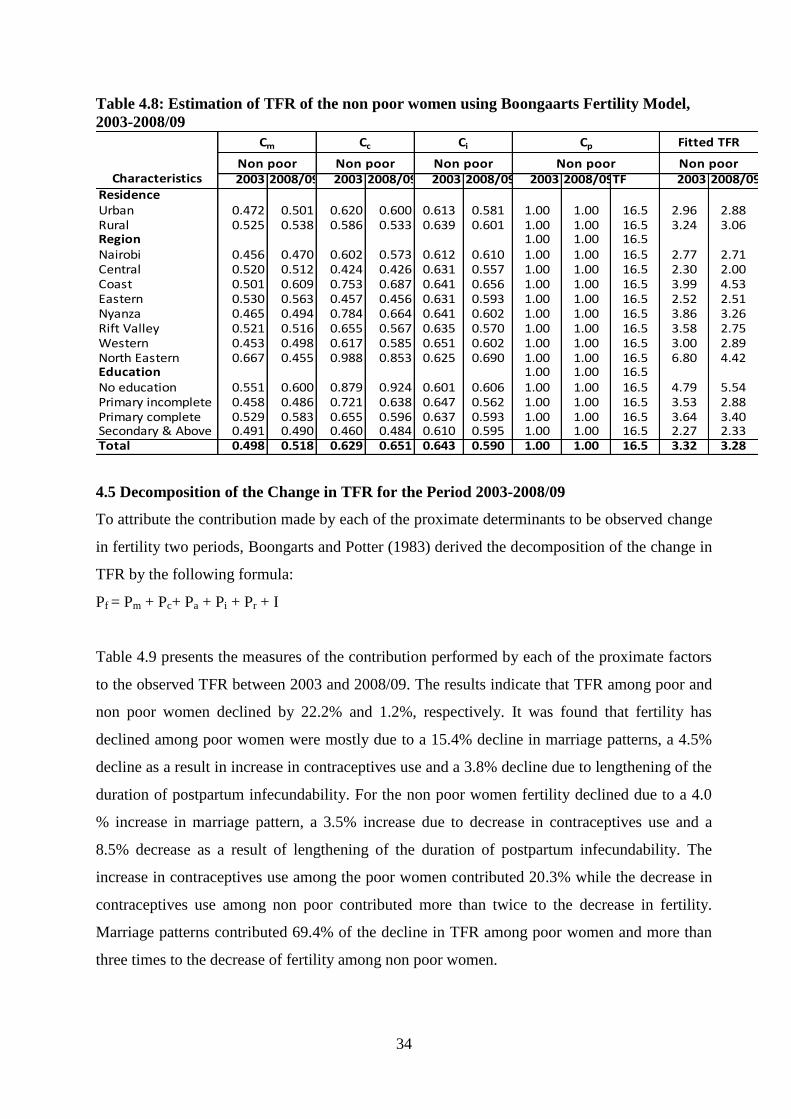
34
Table 4.8: Estimation of TFR of the non poor women using Boongaarts Fertility Model,
2003-2008/09
2003 2008/09 2003 2008/09 2003 2008/09 2003 2008/09TF 2003 2008/09ResidenceUrban 0.472 0.501 0.620 0.600 0.613 0.581 1.00 1.00 16.5 2.96 2.88Rural 0.525 0.538 0.586 0.533 0.639 0.601 1.00 1.00 16.5 3.24 3.06Region 1.00 1.00 16.5Nairobi 0.456 0.470 0.602 0.573 0.612 0.610 1.00 1.00 16.5 2.77 2.71Central 0.520 0.512 0.424 0.426 0.631 0.557 1.00 1.00 16.5 2.30 2.00Coast 0.501 0.609 0.753 0.687 0.641 0.656 1.00 1.00 16.5 3.99 4.53Eastern 0.530 0.563 0.457 0.456 0.631 0.593 1.00 1.00 16.5 2.52 2.51Nyanza 0.465 0.494 0.784 0.664 0.641 0.602 1.00 1.00 16.5 3.86 3.26Rift Valley 0.521 0.516 0.655 0.567 0.635 0.570 1.00 1.00 16.5 3.58 2.75Western 0.453 0.498 0.617 0.585 0.651 0.602 1.00 1.00 16.5 3.00 2.89North Eastern 0.667 0.455 0.988 0.853 0.625 0.690 1.00 1.00 16.5 6.80 4.42Education 1.00 1.00 16.5No education 0.551 0.600 0.879 0.924 0.601 0.606 1.00 1.00 16.5 4.79 5.54Primary incomplete 0.458 0.486 0.721 0.638 0.647 0.562 1.00 1.00 16.5 3.53 2.88Primary complete 0.529 0.583 0.655 0.596 0.637 0.593 1.00 1.00 16.5 3.64 3.40Secondary & Above 0.491 0.490 0.460 0.484 0.610 0.595 1.00 1.00 16.5 2.27 2.33Total 0.498 0.518 0.629 0.651 0.643 0.590 1.00 1.00 16.5 3.32 3.28
Cc Ci
Non poor Non poor Non poor
Cm Cp
Non poorCharacteristics
Fitted TFR
Non poor
4.5 Decomposition of the Change in TFR for the Period 2003-2008/09
To attribute the contribution made by each of the proximate determinants to be observed change
in fertility two periods, Boongarts and Potter (1983) derived the decomposition of the change in
TFR by the following formula:
Pf = Pm + Pc+ Pa + Pi + Pr + I
Table 4.9 presents the measures of the contribution performed by each of the proximate factors
to the observed TFR between 2003 and 2008/09. The results indicate that TFR among poor and
non poor women declined by 22.2% and 1.2%, respectively. It was found that fertility has
declined among poor women were mostly due to a 15.4% decline in marriage patterns, a 4.5%
decline as a result in increase in contraceptives use and a 3.8% decline due to lengthening of the
duration of postpartum infecundability. For the non poor women fertility declined due to a 4.0
% increase in marriage pattern, a 3.5% increase due to decrease in contraceptives use and a
8.5% decrease as a result of lengthening of the duration of postpartum infecundability. The
increase in contraceptives use among the poor women contributed 20.3% while the decrease in
contraceptives use among non poor contributed more than twice to the decrease in fertility.
Marriage patterns contributed 69.4% of the decline in TFR among poor women and more than
three times to the decrease of fertility among non poor women.
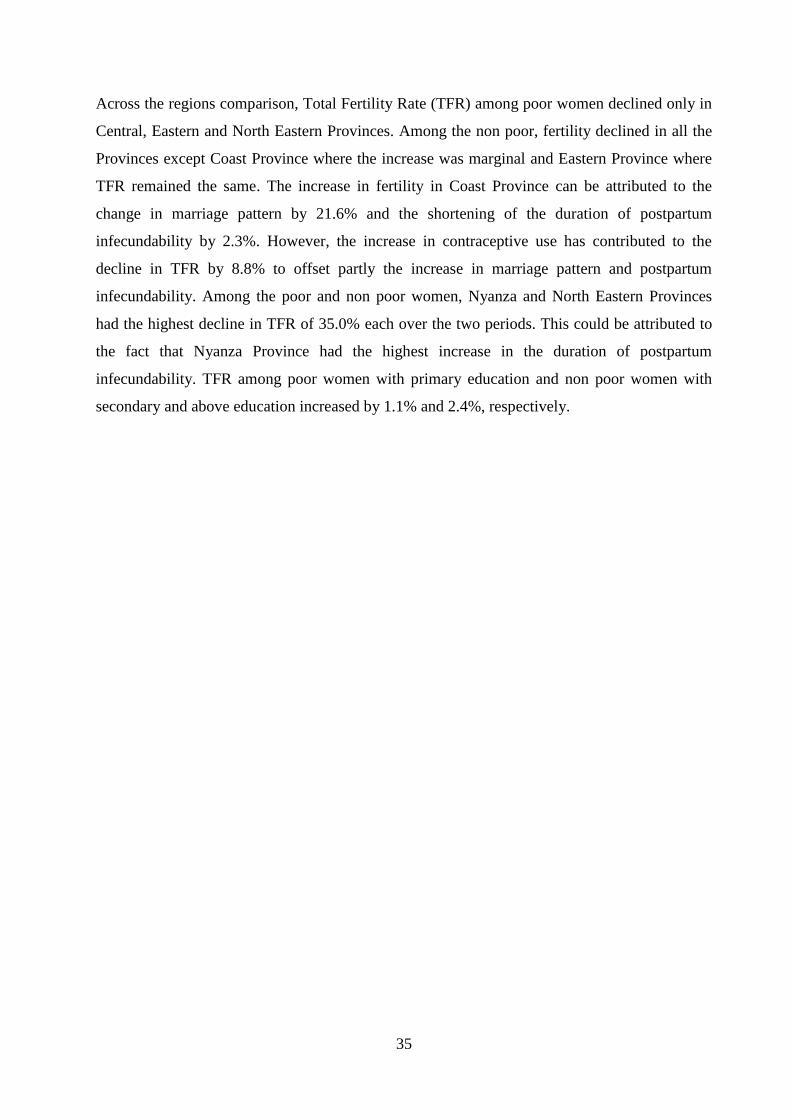
35
Across the regions comparison, Total Fertility Rate (TFR) among poor women declined only in
Central, Eastern and North Eastern Provinces. Among the non poor, fertility declined in all the
Provinces except Coast Province where the increase was marginal and Eastern Province where
TFR remained the same. The increase in fertility in Coast Province can be attributed to the
change in marriage pattern by 21.6% and the shortening of the duration of postpartum
infecundability by 2.3%. However, the increase in contraceptive use has contributed to the
decline in TFR by 8.8% to offset partly the increase in marriage pattern and postpartum
infecundability. Among the poor and non poor women, Nyanza and North Eastern Provinces
had the highest decline in TFR of 35.0% each over the two periods. This could be attributed to
the fact that Nyanza Province had the highest increase in the duration of postpartum
infecundability. TFR among poor women with primary education and non poor women with
secondary and above education increased by 1.1% and 2.4%, respectively.
36
Table 4.9: Decomposition of the change in Total fertility rate (TFR) for Poor and Non Poor Women from 2003 to 2008/09
Characteristics Pf Pm Pc Pi Pp I
Absolute
change in
TFR Pf Pm Pc Pi Pp I
Absolute
change in
TFR
ResidenceUrban -28.7 -1.4 -18.0 -11.9 0.0 2.5 -1.4 -2.6 6.1 -3.2 -5.2 0.0 -0.3 -0.1Rural -24.8 -5.6 -6.4 -2.8 0.0 -10.0 -1.4 -5.8 2.5 -9.0 -5.9 0.0 6.7 -0.2RegionNairobi _ _ _ _ _ _ _ -2.2 3.1 -4.8 -0.3 0.0 -0.1 -0.1Central 5.4 0.8 -7.6 13.1 0.0 -1.0 0.1 -12.7 -1.5 0.5 -11.7 0.0 0.1 -0.3Coast -13.7 -9.4 -6.1 1.4 0.0 0.4 -1.0 13.5 21.6 -8.8 2.3 0.0 -1.6 0.5Eastern 1.9 2.3 0.1 -0.5 0.0 0.0 0.1 -0.4 6.2 -0.2 -6.0 0.0 -0.4 0.0Nyanza -35.0 1.1 -10.0 -28.6 0.0 2.5 -2.4 -15.5 6.2 -15.3 -6.1 0.0 -0.3 -0.6Rift Valley -24.6 -13.2 -7.6 -6.1 0.0 2.2 -1.5 -23.0 -1.0 -13.4 -10.2 0.0 1.6 -0.8Western -28.8 -10.8 -11.8 -9.5 0.0 3.3 -1.6 -3.6 9.9 -5.2 -7.5 0.0 -0.8 -0.1North Eastern 1.5 -2.9 -0.4 5.0 0.0 -0.2 0.1 -35.0 -31.8 -13.7 10.4 0.0 0.1 -2.4EducationNo education -20.9 0.3 -1.7 -19.7 0.0 0.3 -1.9 15.6 8.9 5.1 0.8 0.0 0.8 0.7Primary incomplete -22.4 -2.7 -12.6 -8.7 0.0 1.6 -1.2 -18.4 6.1 -11.5 -13.1 0.0 0.1 -0.6Primary complete 1.1 -7.7 7.9 1.6 0.0 -0.6 0.0 -6.6 10.2 -9.0 -6.9 0.0 -0.9 -0.2Secondary & Above -1.8 -9.8 11.8 -2.6 0.0 -1.2 -0.1 2.4 -0.2 5.2 -2.5 0.0 -0.1 0.1Total -22.2 -15.4 -4.5 -3.8 0.0 1.4 -1.2 -1.2 4.0 3.5 -8.2 0.0 -0.5 0.0
Poor Non Poor
37
CHAPTER FIVE
SUMMARY, CONCLUSIONS AND RECOMMENDATIONS
5.1. Introduction
This chapter presents the summary of the study, conclusions of the results and recommendations for
policy and further research.
5.2. Summary
The general objective of the study was to examine the role of the proximate determinants of fertility
inhibiting effects among the poor and non poor in Kenya over the period 2003 to 2008/09. It sought to
determine the fertility inhibiting effect of each of the principal proximate determinants of fertility to
change in TFR. The basic analytical technique used in this study was the Bongaarts model (Bongaarts,
1978, Bongaarts and Potter, 1983). The variables selected in the study included contraceptive use,
postpartum infecundibility, proportion married and sterility. The findings are analyzed using three
socio economic characteristic of educational level, region and residence. Due to lack of data, induced
abortion was not assessed in the study. The computation procedures are first used to estimate the four
indexes of contraceptive use, postpartum infecundibility, proportion married and sterility to measure
the inhibiting effect. Second, TFR is estimated using the Bongaarts Fertility Model. Lastly, the indexes
are decomposed to determine the contribution made by each of the proximate determinants to be
observed change in fertility.
5.3. Conclusions
Kenya has experienced a decline in fertility rate between 2003 and 2008/09. But this change in fertility
is not shared equally among the poor and non poor women. The study revealed that effects of the
proximate determinants of fertility among the poor and non poor vary based on rural-urban residence,
region of residence and educational levels. It showed marriage pattern was the most important fertility
inhibiting factor at the aggregate level for both poor and non poor women in the two surveys periods.
Among the sub groups, the study found that marriage pattern of the poor women contributed to the
decline in fertility while that of non poor women was responsible for the increase in fertility. This
shows that the poor women were delaying marriage while non poor women enter into marriage earlier
than they did in the past. The results also show that poor women in both urban and rural areas delayed
entry into marriage while non poor women in urban and rural areas entered marriage earlier in 2008/09
compared to 2003. Furthermore, poor women with no education and those in Eastern and Nyanza

38
provinces tend to marry earlier than before while for non poor women, those with secondary and
above education and from Coast, Rift Valley and North Eastern Provinces tend to marry later.
Over time, contraception has played a major role in the decline of fertility in Kenya. Earlier studies by
Njenga (2010) and Ekisa and Hinde (2005) found that contraceptive use was the most important
determinant of fertility. Examination of the changes in the use of contraception in this study reveals
that poor women contributed more towards fertility decline than the non poor women over the two
periods. Generally, contraceptive use among poor and non poor women increased in all the sub
population except for the poor women in Eastern Province, among poor women who did not complete
primary education and those with secondary and above education as well for the non poor women in
Central Province, among non poor women with no education and those with secondary and above
education. This result shows that contraception practice plays an important role in the reduction of
fertility among the two sub groups. It, therefore, provides Kenya with an opportunity to increase its
contraceptive use among these two sub groups since the CPR of the current married women of 46.0%
is still very low and in particular the CPR of 20.1 % among the poor. Against exceptions, reasons as to
why contraceptive use among all women with secondary and above education reduced needs to be
examined so as to reduce this existing gap
Kavali (1998) and Kizito et al (1991) found that postpartum infecundability was the most important
fertility inhibiting in Kenya. This study revealed that at the aggregate level, urban and rural both poor
and non poor women had a longer period of postpartum infecundibility. Poor women with primary
education and those in Central, Coast and North Eastern Provinces and the non poor women who
completed primary education and among non poor women with no education and non poor women in
Coast and North Eastern Provinces had a shorter period of postpartum infecundibility. For all level of
education, non poor women had a higher effect of reducing fertility than the poor women. This means
that non poor women had a longer period of postpartum infecundibility than poor women within the
same level of education. There is, therefore, need to investigate as to why this is so, given that it is
expected that poor women are expected to have time to breastfeed their children more than the non
poor women who in most cases are career women.
5.3. Recommendations
5.3.1. Recommendations for Policy
This study showed that both the poor and non poor women made different contribution towards
fertility decline. The TFR as estimated by the Bongaarts Model for the poor women reduced from 5.41
39
births per woman in 2003 to 4.21 births per woman in 2008/09. Similarly, TFR for the non poor
women reduced from 3.32 births per woman to 3.28 births per woman over the same period. The
reproductive needs of both the two sub groups, therefore, cannot be ignored if the country has to
achieve the replacement level of 2.1 births per woman.
Various policy implications can be drawn from the results of this study. The results of the study have
shown the important role marriage has played in fertility decline. However, at the sub group level, it
was found that non poor women had contributed to the increase in fertility while the poor women had
contributed to the decline in fertility. It showed that at the aggregate level, urban and rural areas poor
women are delaying marriage while non poor women enter into marriage earlier in 2008/09 than in
2003. It was also found that poor women with no education and those in Eastern and Nyanza
provinces tend to enter marriage earlier than before while for non poor women, those with secondary
and above education and from Coast, Rift Valley and North Eastern Provinces tend to marry later.
The government should put programmes that will reach the poor and non poor women especially in
regions where women tend to enter marriage earlier than in the past. These include putting in place
education programmes to improve on the literacy level among the poor and non poor women.
.The findings showed that poor women used contraceptive more than non poor women. This could be
attributed to the past government policies to manage population targeting the poor women only. The
government, therefore, should put in place population policy that will incorporate the non poor
women. This policy should address the contraception needs of the non poor women including
providing education to all women. It should also be noted that despite the increase in use of
contraceptive over the period for the poor women, the inhibiting fertility effect for the poor women
was much lower than that for the non poor women. The government should, therefore, increase efforts
to promote the use of contraceptive and provide effective contraceptive methods, especially in areas
where contraceptive use rates are low among the two sub groups. There should be more focus in areas
where such as North Eastern Province where the use of contraception is very low.
The analysis revealed that both poor and non poor women had a longer period of postpartum
infecundibility. Poor women in Central, Coast and North Eastern Provinces and non poor women who
completed primary education and those with no educationas well as non poor women in Coast and
North Eastern Provinces had a shorter period of postpartum infecundibility. Against expectation, non
poor women had a longer period of postpartum infecundibility than poor women within the same level

40
of education. The government should target the poor women in their breastfeeding practices through
the breastfeeding policy and programmes.
5.3.1. Recommendations for further Research
The findings from this study show that there is need for further research in four
areas. First, further research should focus on similar study to this one on the proximate determinants
of fertility among poor and non poor women focussing on the county level. Second, further research is
needed on the factors responsible for the increase in fertility among the non poor women. Third, future
research is also needed on the effect of marriage among in North Eastern and Cosat Province among
the poor women. Fourth, future research should be done on the effect of marriage among in North
Eastern among the non poor women.
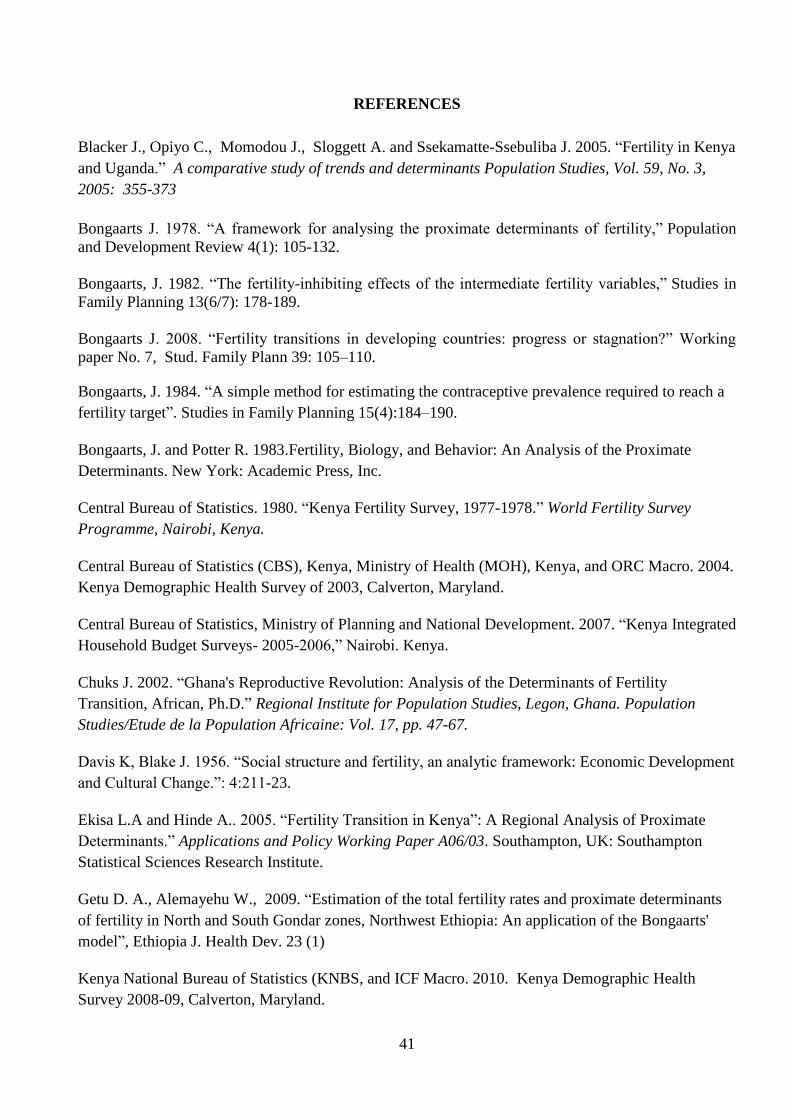
41
REFERENCES
Blacker J., Opiyo C., Momodou J., Sloggett A. and Ssekamatte-Ssebuliba J. 2005. “Fertility in Kenya
and Uganda.” A comparative study of trends and determinants Population Studies, Vol. 59, No. 3,
2005: 355-373
Bongaarts J. 1978. “A framework for analysing the proximate determinants of fertility,” Population
and Development Review 4(1): 105-132.
Bongaarts, J. 1982. “The fertility-inhibiting effects of the intermediate fertility variables,” Studies in
Family Planning 13(6/7): 178-189.
Bongaarts J. 2008. “Fertility transitions in developing countries: progress or stagnation?” Working
paper No. 7, Stud. Family Plann 39: 105–110.
Bongaarts, J. 1984. “A simple method for estimating the contraceptive prevalence required to reach a
fertility target”. Studies in Family Planning 15(4):184–190.
Bongaarts, J. and Potter R. 1983.Fertility, Biology, and Behavior: An Analysis of the Proximate
Determinants. New York: Academic Press, Inc.
Central Bureau of Statistics. 1980. “Kenya Fertility Survey, 1977-1978.” World Fertility Survey
Programme, Nairobi, Kenya.
Central Bureau of Statistics (CBS), Kenya, Ministry of Health (MOH), Kenya, and ORC Macro. 2004.
Kenya Demographic Health Survey of 2003, Calverton, Maryland.
Central Bureau of Statistics, Ministry of Planning and National Development. 2007. “Kenya Integrated
Household Budget Surveys- 2005-2006,” Nairobi. Kenya.
Chuks J. 2002. “Ghana's Reproductive Revolution: Analysis of the Determinants of Fertility
Transition, African, Ph.D.” Regional Institute for Population Studies, Legon, Ghana. Population
Studies/Etude de la Population Africaine: Vol. 17, pp. 47-67.
Davis K, Blake J. 1956. “Social structure and fertility, an analytic framework: Economic Development
and Cultural Change.”: 4:211-23.
Ekisa L.A and Hinde A.. 2005. “Fertility Transition in Kenya”: A Regional Analysis of Proximate
Determinants.” Applications and Policy Working Paper A06/03. Southampton, UK: Southampton
Statistical Sciences Research Institute.
Getu D. A., Alemayehu W., 2009. “Estimation of the total fertility rates and proximate determinants
of fertility in North and South Gondar zones, Northwest Ethiopia: An application of the Bongaarts'
model”, Ethiopia J. Health Dev. 23 (1)
Kenya National Bureau of Statistics (KNBS, and ICF Macro. 2010. Kenya Demographic Health
Survey 2008-09, Calverton, Maryland.

42
Kiersten J., Abderrahim N. and Rutstein S. O. 2011. “Changes in the Direct and Indirect Determinants
of Fertility in Sub Saharan Africa.” DHS Analytical Studies No. 23. Calverton,Maryland, USA: ICF
Macro.
Madhavan Supriya 2013. “An Analysis of the Proximate Determinants of Fertility in Sub-Saharan
Africa,” Johns Hopkins Bloomberg School of Public Health, PFRH Jean-Pierre François
GUENGANT, IRD Institut de Recherche pour le Development
Teklu HailemariamTeklu, Alula Sebhatu and Tesfayi Gebreselassie. 2013. “Components of Fertility
Change in Ethiopia. Further analysis of the 2000, 2005 and 2011 Demographic and Health Surveys.”
DHS Further Analysis Reports No.80. Calverton, Maryland, USA: ICF International.
Kalule-Sabiti. 1984. “Bongaarts' pr oximate determinants of fertility applied to group data from the
Kenya Fertility Survey 1977/78.” Journal of Biosocial Science, 16: 205-218.
Kizito P.M.L., Obungo W., Kibet M., Njogu W. 1991. “Fertility Transition in Kenya: DHS Further
Analysis Studies 11”, Macro International Inc., Calverton, USA.
Lubaale Y. A., Kayizzi J. B. 2007. “Using the Bongaarts model in explaining fertility decline in urban
areas of Uganda,” A paper presented during the Fifth African Population Conference, Session
"Emerging issues in the Demography of East Africa”.
Mutetei Kavali. 1998. “The proximate determinants of fertility: Evidence from the 1993 Kenya
Demographic and Health Survey,” Unpublished MSc thesis in Population studies, University of
Nairobi
Nabanita M. and Faujdar R. 2013. “Fertility among Poor: explaining the Role of Proximate
Determinants of Fertility,” International Institute for Population Sciences, Fertility, IIPS
Njenga J. N. 2010. “Impact of Proximate Determinants of Fertility on Change in Total Fertility Rate in
Kenya between 2003 and 2008/09,” Unpublished MSc Research project in Population studies,
University of Nairobi
Richard P., Cincotta and Robert Engelman. 1997. Economics and Rapid Change: The influence of
population growth,” Population Action international.
Republic of Kenya. 2012. “Sessional Paper No. 3 of 2012 on Population Policy for National
Development, Kenya Situational Analysis,” National Council for Population and Development.
Republic of Kenya. 2007. “Kenya Vision 2030, the Popular Version,” Nairobi: Government Printer
Rutstein S. O. and Kiersten J. 2004. “The DHS wealth index” DHS Comparative Reports No. 6.
Calverton, Maryland, USA, ORC Macro.
Stover J. 1998. “Revising the Proximate Determinants of Fertility Framework: What Have We
Learned in the Past 20 Years?” Studies in Family Planning 29(3): 255-267

43
Tanha M. and Imran A. 2011. “Analyzing Bongaarts model and its applications in the context of
Bangladesh,” Curtin University, Australia University of Dhaka, Bangladesh ,19th International
Congress on Modelling and Simulation, Perth,
Oketch T. C., Wawire N. W. and Mburu T. K. 2011. “Contraceptive Use among Women of
Reproductive Age in Kenya’s City Slums,” International Journal of Business and Social Science Vol.
2 No.1, January 2011.