providing a more comprehensive and personalized … webinar.pdfproviding a more comprehensive and...
TRANSCRIPT
Providing a More Comprehensive and Personalized Approach to Genetic Disorders
through Next Generation Sequencing
Karl V. Voelkerding, MD Professor of Pathology
University of Utah Medical Director for Genomics and Bioinformatics
ARUP Laboratories
ARUP Institute for Learning Webinar June 18, 2013

Notice of Faculty Disclosure
The individual below has no relevant financial relationships with commercial interests to disclose
Karl V. Voelkerding, M.D.

Learning Objectives
• Describe how NGS has provided a new technological approach that has expanded the ability to improve the diagnosis of genetic disorders.
• Relate the essential and complex role of bioinformatics in deriving diagnostic results from NGS data.
• Discuss the impact of exome sequencing in the diagnostic evaluation of patients with undiagnosed disorders.

First Next Generation Sequencing Report - 2005
454 Life Sciences
Nature 437 (7057) 376-380

Genomic DNA
Fragmentation
Repair Ends and Ligate Oligonucleotide Adapters
Fragment A Adapter Adapter
“Randomly Overlapping Fragment Library”
NGS Process Steps
(150 – 400 bp)
Fragment B Adapter Adapter
Fragment C Adapter Adapter
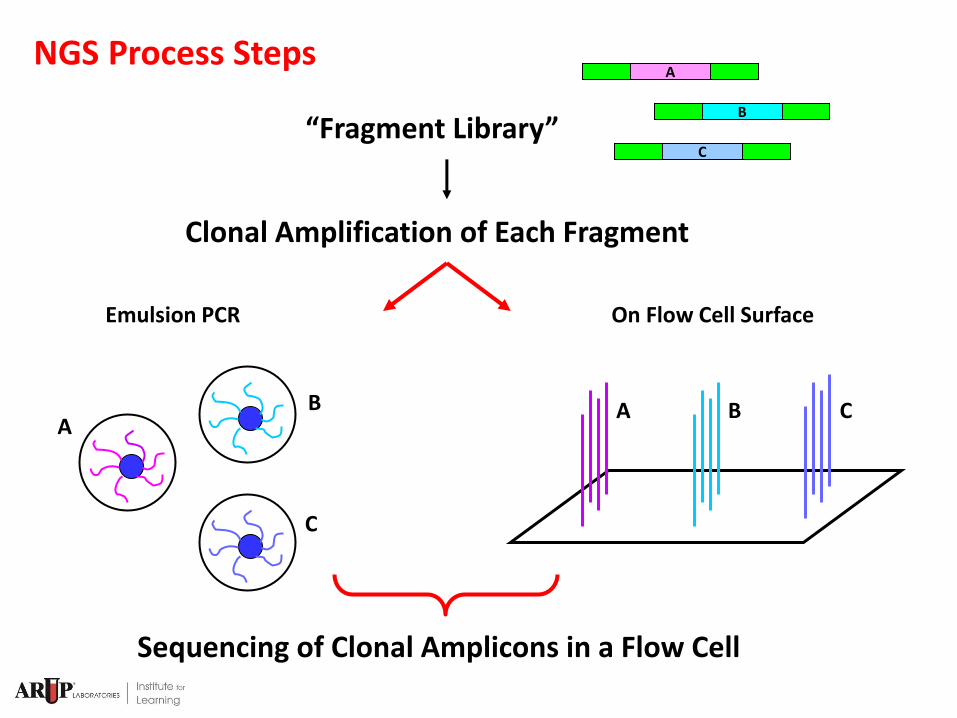
Clonal Amplification of Each Fragment
Sequencing of Clonal Amplicons in a Flow Cell
“Fragment Library”
A
B
C
Emulsion PCR On Flow Cell Surface
C B A A
B
C
NGS Process Steps
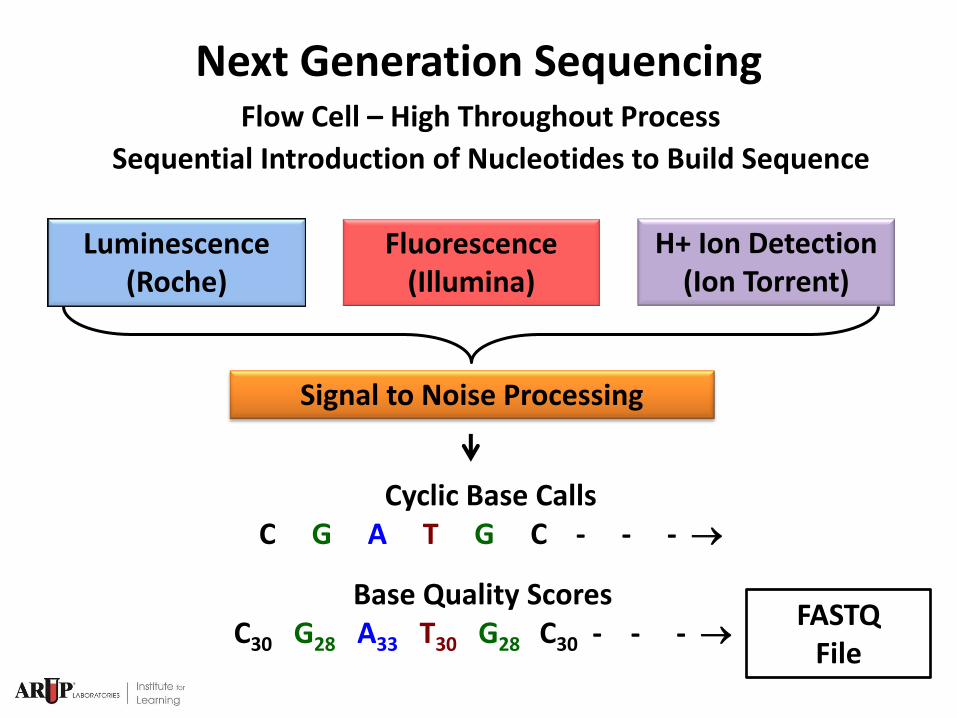
Luminescence (Roche)
Fluorescence (Illumina)
H+ Ion Detection (Ion Torrent)
Signal to Noise Processing
Cyclic Base Calls C G A T G C - - -
Base Quality Scores C30 G28 A33 T30 G28 C30 - - -
Next Generation Sequencing Flow Cell – High Throughout Process
Sequential Introduction of Nucleotides to Build Sequence
FASTQ File
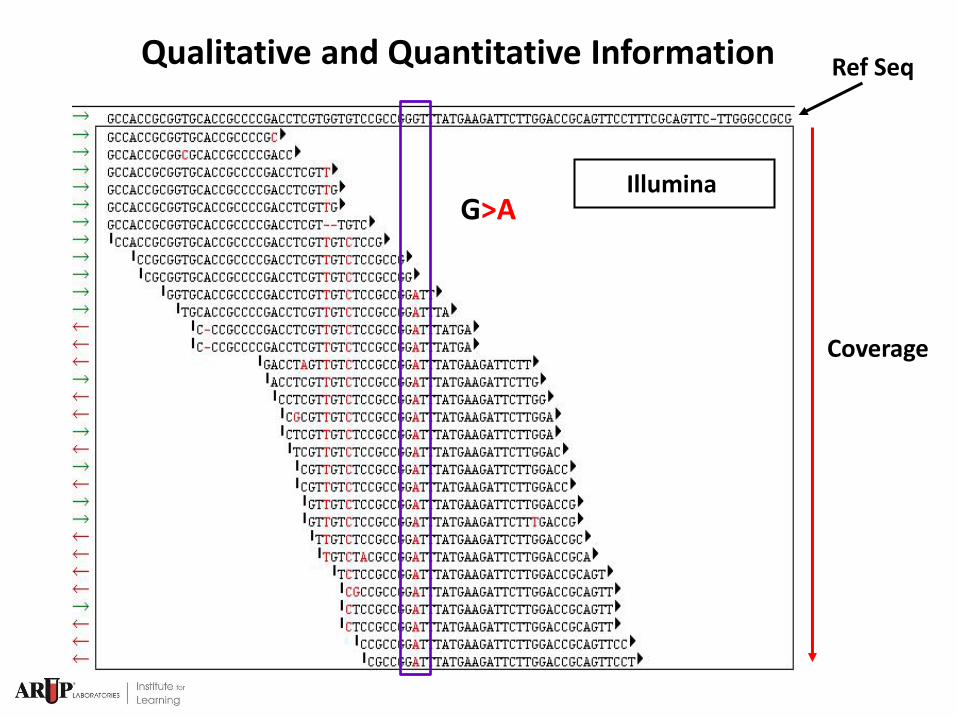
Qualitative and Quantitative Information
Coverage
Ref Seq
G>A Illumina

NGS Platform Summary
Voelkerding et al
FDA Submission
Cystic Fibrosis

Genetic Testing Paradigm Shift
Sanger Sequencing Qualitative
Next Generation Sequencing Qualitative and Quantitative
High Throughput

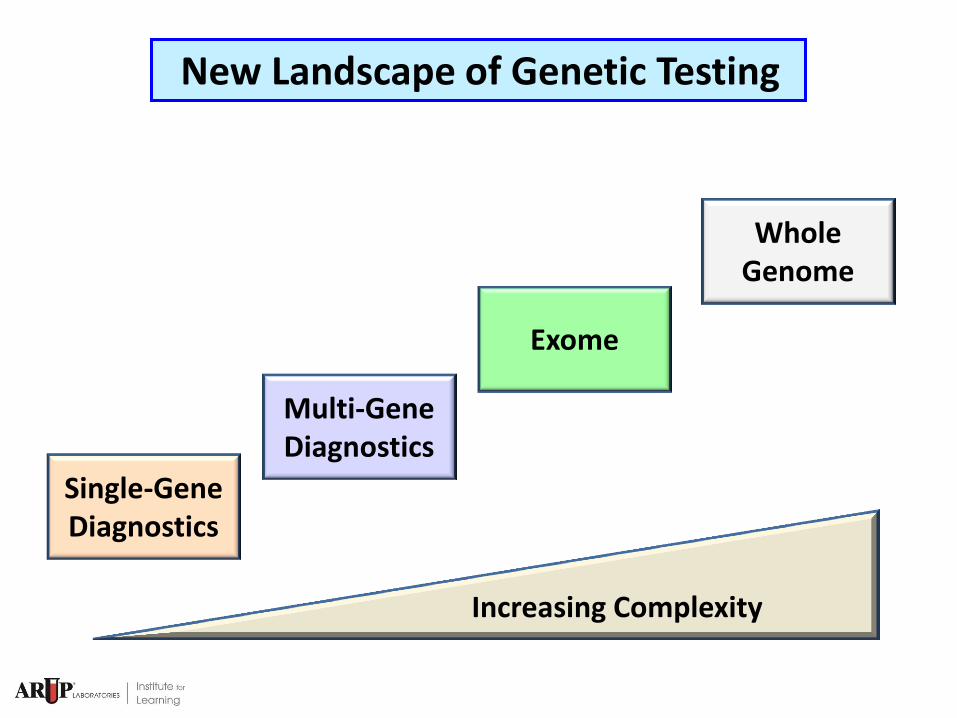
Exome
Whole Genome
Multi-Gene Diagnostics
Increasing Complexity
Single-Gene Diagnostics
New Landscape of Genetic Testing

Multiple Genes Responsible
Clinical Phenotype
Locus Heterogeneity Allelic Heterogeneity
Multiple Mutations Possible
Multi-Gene Panel Diagnostics
Technically Difficult to Test For by Sanger Sequencing
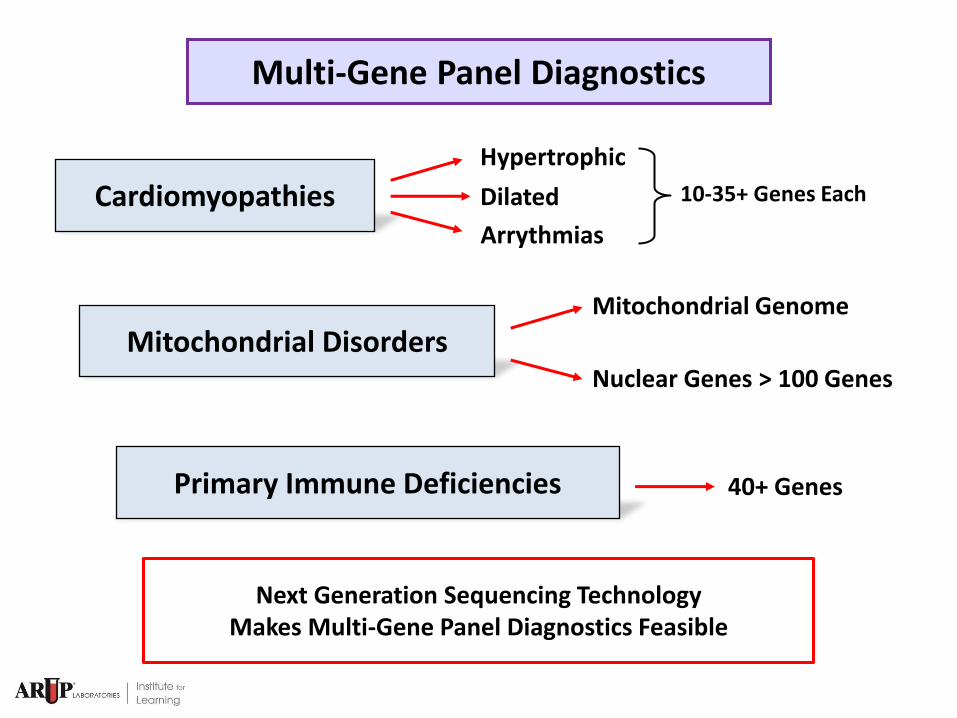
Cardiomyopathies
Hypertrophic
Dilated
Arrythmias
Mitochondrial Disorders Mitochondrial Genome
Nuclear Genes > 100 Genes
Primary Immune Deficiencies 40+ Genes
10-35+ Genes Each
Next Generation Sequencing Technology Makes Multi-Gene Panel Diagnostics Feasible
Multi-Gene Panel Diagnostics

Normal
Nishimura RA, et al. Circulation 11;108(19)
Hypertrophic Cardiomyopathy – Model for Multi-Gene Diagnostics
Prevalence = ~ 1 in 500 – 1,000
Teenage to Adult Onset
Autosomal Dominant
Arrythmias/Angina Sudden Death
Hypertrophic
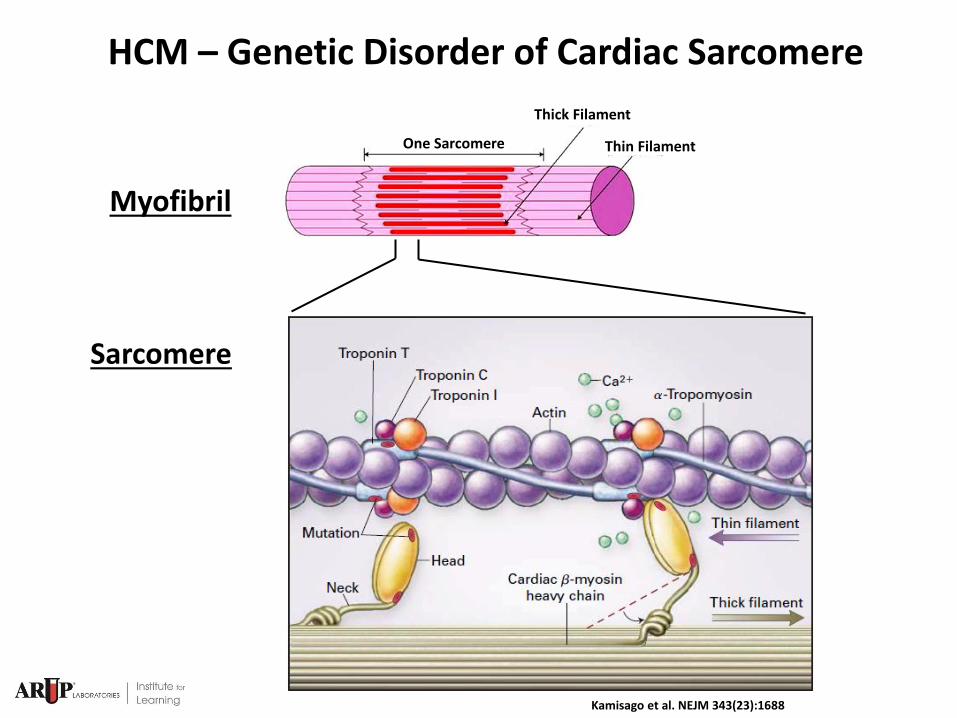
Kamisago et al. NEJM 343(23):1688
HCM – Genetic Disorder of Cardiac Sarcomere
One Sarcomere
Thick Filament
Thin Filament
Myofibril
Sarcomere

Soor et al, J Clin Pathol 2008
HCM – Myocyte Disarray
http://www.umanitoba.ca
Normal Myocytes

Protein Gene Mutations Gene Size bp
Myosin, heavy chain 7 (MYH7) 193 32,628
Myosin binding protein C (MYBPC3) 138 28,280
Troponin T type 2 (TNNT2) 33 25,673
Troponin I type 3 (TNNI3) 32 12,963
Cysteine and glycine-rich protein 3 (CSRP3) 12 27,024
Tropomyosin 1, a (TPM1) 11 36,274
Myosin, light chain 2 (MYL2) 10 16,758
Actin (ACTC) 7 14,631
Myosin, light chain 3 (MYL3) 5 12,617
Protein kinase, AMP-activated, g2 (PRKAG2) 4 328,114
Phospholamban (PLN) 2 19,112
Troponin C type 1 (TNNC1) 1 9,041
Titin (TTN) 2 281,434
Myosin, heavy chain 6 (MYH6) 2 32,628
Titin-cap (TCAP) 2 9,361
Caveolin 3 (CAV3) 1 20,199
455 906,737
Hypertrophic Cardiomyopathy Genes
Sanger

Protein Gene Mutations Gene Size bp
Myosin, heavy chain 7 (MYH7) 193 32,628
Myosin binding protein C (MYBPC3) 138 28,280
Troponin T type 2 (TNNT2) 33 25,673
Troponin I type 3 (TNNI3) 32 12,963
Cysteine and glycine-rich protein 3 (CSRP3) 12 27,024
Tropomyosin 1, a (TPM1) 11 36,274
Myosin, light chain 2 (MYL2) 10 16,758
Actin (ACTC) 7 14,631
Myosin, light chain 3 (MYL3) 5 12,617
Protein kinase, AMP-activated, g2 (PRKAG2) 4 328,114
Phospholamban (PLN) 2 19,112
Troponin C type 1 (TNNC1) 1 9,041
Titin (TTN) 2 281,434
Myosin, heavy chain 6 (MYH6) 2 32,628
Titin-cap (TCAP) 2 9,361
Caveolin 3 (CAV3) 1 20,199
455 906,737
NGS
Hypertrophic Cardiomyopathy Genes

Value of Genetic Testing
Confirm Genetic Etiology
Family Risk Counseling/Testing
Medical Management
Beta and Calcium Channel Blockers
Antiarrythmics – Cardioversion – Implantable Defibrillators
Transplantation
Specific Mutation Identification
Hypertrophic Cardiomyopathy – Model for Multi-Gene Diagnostics

More Comprehensive Compared to Single Gene Sanger Sequencing
Gene Content = Based on Current Knowledge
Facilitated by New Platforms Lower Capital Costs
Faster Sequencing Process Illumina MiSeq Ion Torrent PGM
Multi-Gene Panel Diagnostics

PCR or LR-PCR RainDance ePCR
Fluidigm Ion Torrent and Illumina
Agilent Haloplex
Amplification Based
Genomic DNA
Enriched Genes NGS
Array Capture Based
In Solution Target Probes
Agilent Nimblegen
Illumina
Multi-Gene Diagnostics Require Gene Enrichment

PCR or LR-PCR RainDance ePCR
Fluidigm Ion Torrent and Illumina
Agilent Haloplex
Amplification Based
Genomic DNA
Array Capture Based
In Solution Target Probes
Agilent Nimblegen
Illumina
Enrichment Method - Difficult Choice - Substantial Cost Investment
Multi-Gene Diagnostics Require Gene Enrichment

Considerations in Designing Multi-Gene Panels
Suitability of Enrichment Method for Laboratory
Is the Technical Workflow (Manual) Adoptable in Your Setting? Is it Possible to Automate the Workflow?
Is the Enrichment Method Compatible with Your Sequencing Platform?
How Many Samples can be Barcoded and Pooled for Sequencing?
What Data Analysis Pipeline will be Required? Vendor Supplied or In House Custom Developed

Perform In Silico Designs with Enrichment Methods
Free Designs Using Vendor Software
Valuable to Compare Design Results between Method Options
What Percentage of Gene Targets will be Enriched?
Are there In Silico Predicted Problem Areas?
Considerations in Designing Multi-Gene Panels

Expect In Silico versus Empiric Results Differences
Characterize Problem Areas Inadequate Sequence Coverage of Some Target Regions
Regions where Data Analysis indicates Homologous Sequence Interference
Considerations in Designing Multi-Gene Panels

Case Example Multi-Gene Panel Design
Project Goal
Multi-Gene Panel for Primary Immune Deficiencies
Sequencing Platform – Illumina MiSeq
In Silico Designs Performed and Agilent Haloplex Chosen
In House Custom Data Analysis

1. Digest and Denature Genomic DNA
Restriction Enzymes
2. Hybridize Biotin Target Probe Library to Form “Tri-Molecular” Circular Complexes
Haloplex Enrichment Theory and Practice
3. Capture and Ligate to Form Closed Target Circles
Target (s)
Biotin Probe
Target

4. PCR Amplify Targets and Incorporate Sequencing Adapters and Indexes
Target NGS
Target (s)
Haloplex Enrichment Theory and Practice
Adapter Indexes

0
10
20
30
40
50
60
70
80
90
100
IFNGR1 IFNGR2 STAT1 IL12B IL12RB1 IKBKG TYK2 CYBB IRF8 ISG15
Co
vera
ge (
%)
Exome
Halo 150
Halo 250
100 100 100 100 100 37 100 99.9 100 100
Predicted Target
Coverage %
Pseudogene Prevents
Full Coverage Design

Genomic DNA
Enrichment
Target Genes
NGS Library Prep
Next Generation Sequencing
Interpretation
Bioinformatics
Genomic DNA
PCR
“Target Gene Gaps”
Big Dye Terminators
Sanger Sequencing
Bioinformatics
Interpretation
Addressing “Gaps” in Multi-Gene Panels

Becoming a “New First Tier” Approach Application to a Growing Number of Inherited Disorders
Implementation Challenges for Laboratories
Choosing a Technical Approach Assay Optimization and Data Analysis
Scaling Gene Numbers Increases Interpretive Review Time
Multi-Gene Panel Diagnostics - Summary

Exome
Whole Genome
Multi-Gene Diagnostics
Increasing Complexity
Single-Gene Diagnostics
New Landscape of Genetic Testing
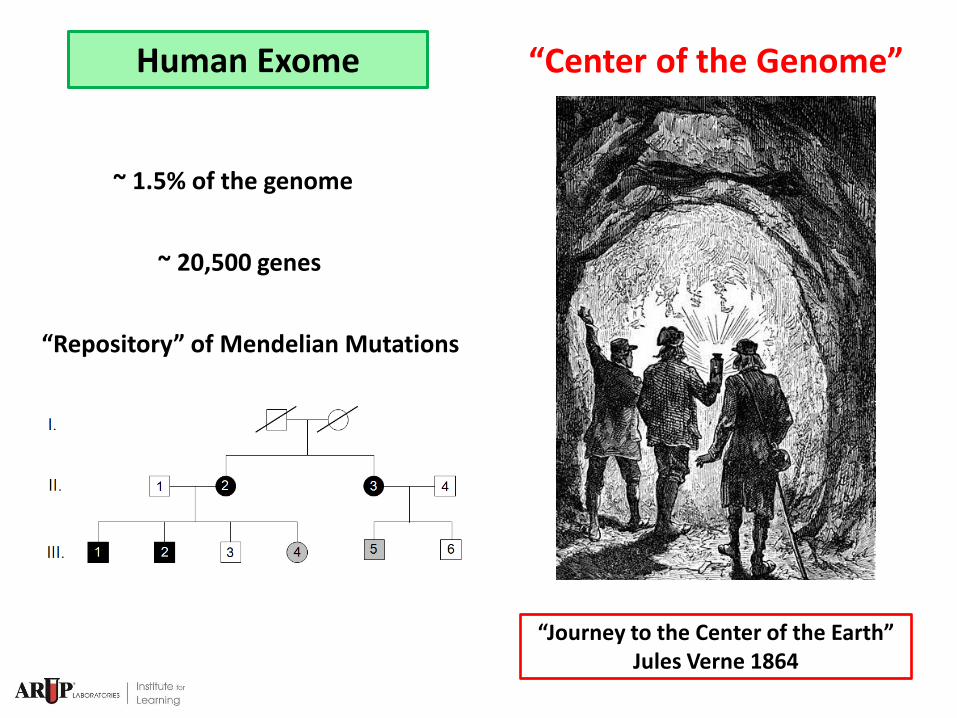
Human Exome
~ 1.5% of the genome
~ 20,500 genes
“Journey to the Center of the Earth” Jules Verne 1864
“Repository” of Mendelian Mutations
“Center of the Genome”

History of Exome Sequencing
“Genetic Diagnosis by Whole Exome Capture and Massively Parallel DNA Sequencing”
Choi et al PNAS 2009 – Congenital Chloride Diarrhea Gene
>200 Gene Discoveries Recessive-Dominant-De Novo
June 2013
OMIM Database - June 2013 7430 Disorders with Known or Suspected Mendelian Inheritance
3,805 Disorders with Molecular Basis Known Potential for Further Molecular Diagnoses is Substantial
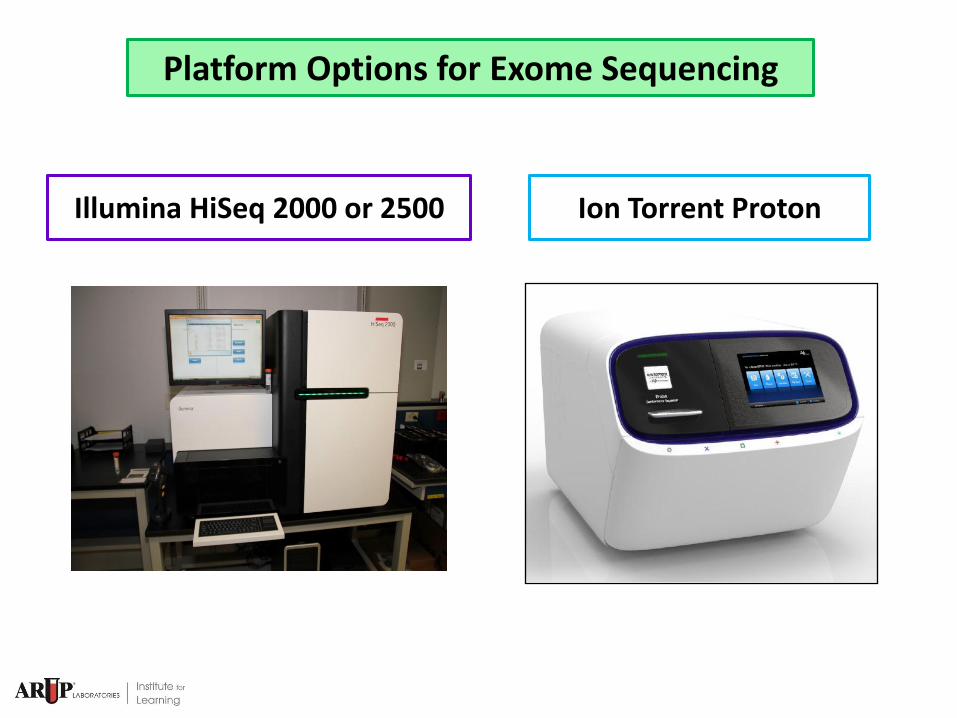
Platform Options for Exome Sequencing
Illumina HiSeq 2000 or 2500 Ion Torrent Proton
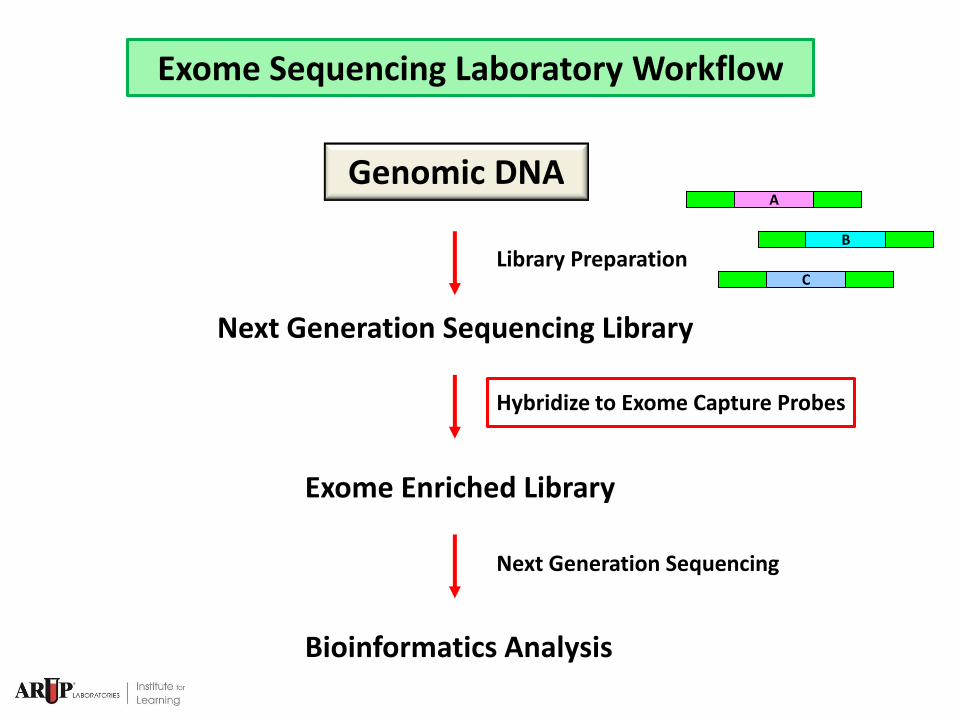
Library Preparation
Next Generation Sequencing Library
Exome Enriched Library
Bioinformatics Analysis
Next Generation Sequencing
Genomic DNA
Hybridize to Exome Capture Probes
A
B
C
Exome Sequencing Laboratory Workflow

Exome Sequencing Read Data
Primary Sequence Alignment
BWA/Novoalign
Refined Sequence Alignment GATK
Variant Calling SAMTools/GATK
Variant Annotation Annovar
@HW-ST573_75:1:1:1353:4122/11
CAATCGAATGGAATTATCGAATGCAATCGA
ATAGAATCATCGAATGGACTCGAATGGAAT
CATCGAA
+
ggfggggggggggggfgggggggfgegggg
fdfeefeggggggggegbgegegggdeYed
gggggeg
@HW-ST573_75:1:1:1347:4151/11
ATCTGTTCTTGTCTTTAACTCTCAAGGCAC
CACCTTCCATGGTCAATAATGAACAACGCC
AGCATGC
+
effffggggggggggggfgggggggggggg
gdggggfgggfgdggaffffgfggffgdgg
ggggdfg
@HW-ST573_75:1:1:1485:4153/11
GAGGAGAGATATTTTGACTTCCTCTCTTCA
TATTTGGATGCTTTTTACTTATCTCTCTTG
ACTAATT
+
dZdddbXc`_ccccbeeedbeaedeeeee^
aeeedcaZca_`^c[eeeeed]eeecd[dd
^eeba[d
FastQ File Format
FASTQ File
SAM/BAM File
VCF File

Annotated Exome Variants ~ 20,000
Prioritization by Heuristic Filtering Prioritization by Likelihood Prediction
Filter Out Common Variants
Pathogenicity Prediction Filtering
Variant Impact Prioritization
Candidate Variants/Genes Several to Dozens
Cross Reference Databases
Pedigree Information Genetic Linkage
dbSNP/1000 genomes Variant Frequency
SIFT/PolyPhen GERP
Intersects
HGMD/OMIM/Locus Specific
VAAST Algorithm Case + Controls Allele Comparison
Amino Acid Change Impact
Missense Nonsense/Frameshift/Splice Site/Indels
Workflow for Causal/Candidate Gene Identification
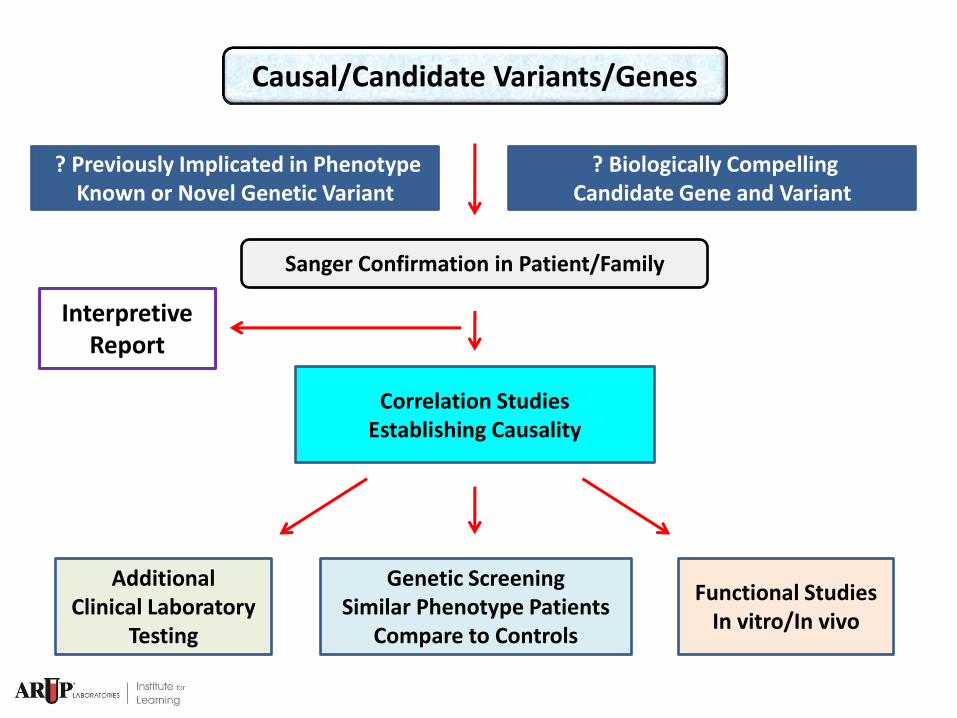
Sanger Confirmation in Patient/Family
Functional Studies
In vitro/In vivo
Additional
Clinical Laboratory Testing
Genetic Screening
Similar Phenotype Patients Compare to Controls
? Previously Implicated in Phenotype Known or Novel Genetic Variant
? Biologically Compelling Candidate Gene and Variant
Correlation Studies
Establishing Causality
Causal/Candidate Variants/Genes
Interpretive Report

Criteria for Choosing Patients for Exome Sequencing
Genetic Etiology Strongly Suspected
Standard Testing Negative or Impractical
Diagnosis Likely to Impact
Treatment and/or Management Decisions
Diagnostic Yield is Greater in Family Studies
Families with Multiple Affected Members

NIH Undiagnosed Disease Program – 2011 Report
5 Molecular Diagnoses in 30 Patients/Families (17%) Several Compelling Candidate Genes
Exome Sequencing – “Diagnostic Yield”
Currently: Largely Single Case Reports Anecdotal Series ~20-30% Diagnosis
Difficult to Determine [Yet]

Diagnostic Yield Expected to Increase - By How Much ?
Driving Forces
Increasingly Sophisticated
Bioinformatics Will Improve Variant Detection
Growth in Knowledge Base
of Disease Causing Genes and Variants
Conversion to Whole Genome Sequencing
Filling in the Gaps
Exome Sequencing – “Diagnostic Yield”
Exome Sequencing – Case Vignette
“Diagnostic Odyssey”
8th Century BC

Dystonia Dystonia
Exomes for “Diagnostic Odyssey”
First Year of Life: Seizures/Dystonia
Third Year of Life: MRI with Leukodystrophy

Dystonia Leukodystrophy
Heuristic Filtering + VAAST + Interpretive Review
Top Three Candidate Genes 1 Recessive
2 X-Linked
Dystonia Leukodystrophy
Exomes for “Diagnostic Odyssey”
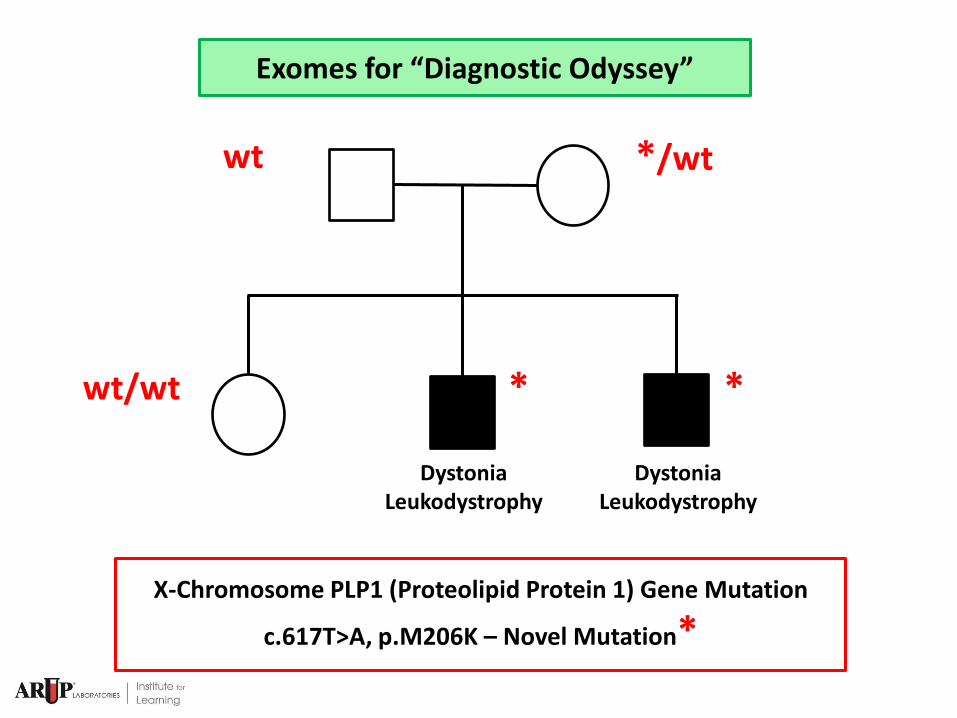
X-Chromosome PLP1 (Proteolipid Protein 1) Gene Mutation
c.617T>A, p.M206K – Novel Mutation*
Dystonia Leukodystrophy
Dystonia Leukodystrophy
* *
*/wt wt
wt/wt
Exomes for “Diagnostic Odyssey”

PMD = Pelizaeus-Merzbacher Disorder
Dysmyelination/Leukodystrophy PLP1 Mutations
p.M206K
PLP1 = Major Myelin Protein SIFT Score 0.01
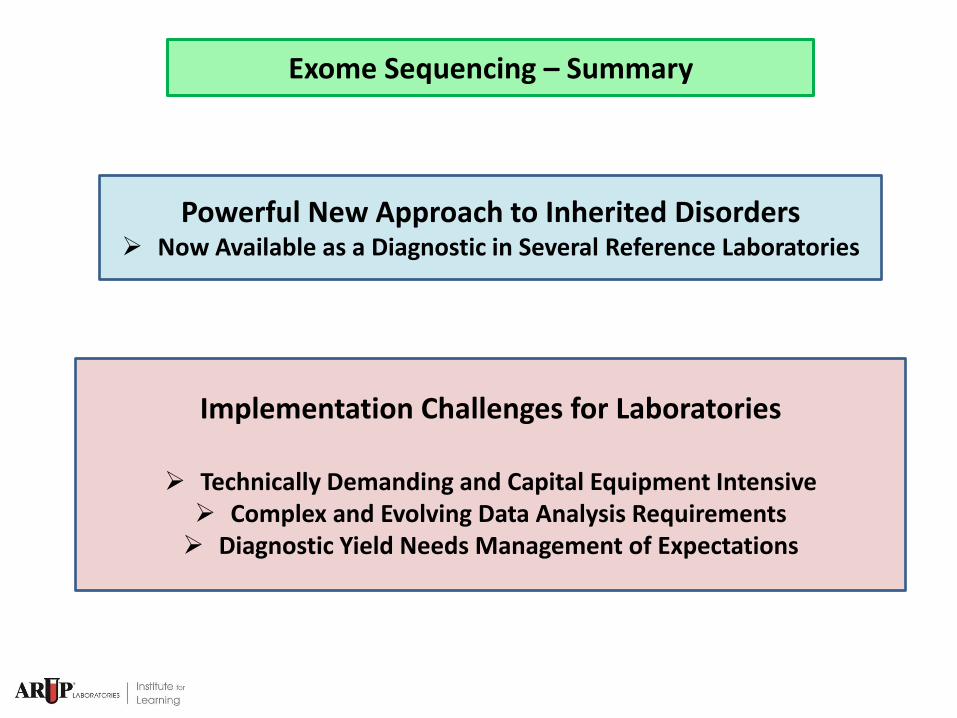
Exome Sequencing – Summary
Powerful New Approach to Inherited Disorders Now Available as a Diagnostic in Several Reference Laboratories
Implementation Challenges for Laboratories
Technically Demanding and Capital Equipment Intensive Complex and Evolving Data Analysis Requirements Diagnostic Yield Needs Management of Expectations
Exome
Whole Genome
Multi-Gene Diagnostics
Increasing Complexity
Single-Gene Diagnostics
New Landscape of Genetic Testing