proteomics informatics workshop part i: protein identification david fenyö february 4, 2011...
TRANSCRIPT
Proteomics Informatics WorkshopPart I: Protein Identification
David Fenyö
February 4, 2011
• Introduction to proteomics• Introduction to mass spectrometry• Analysis of mass spectra• Database searching• Spectrum library searching• de novo sequencing• Significance testing
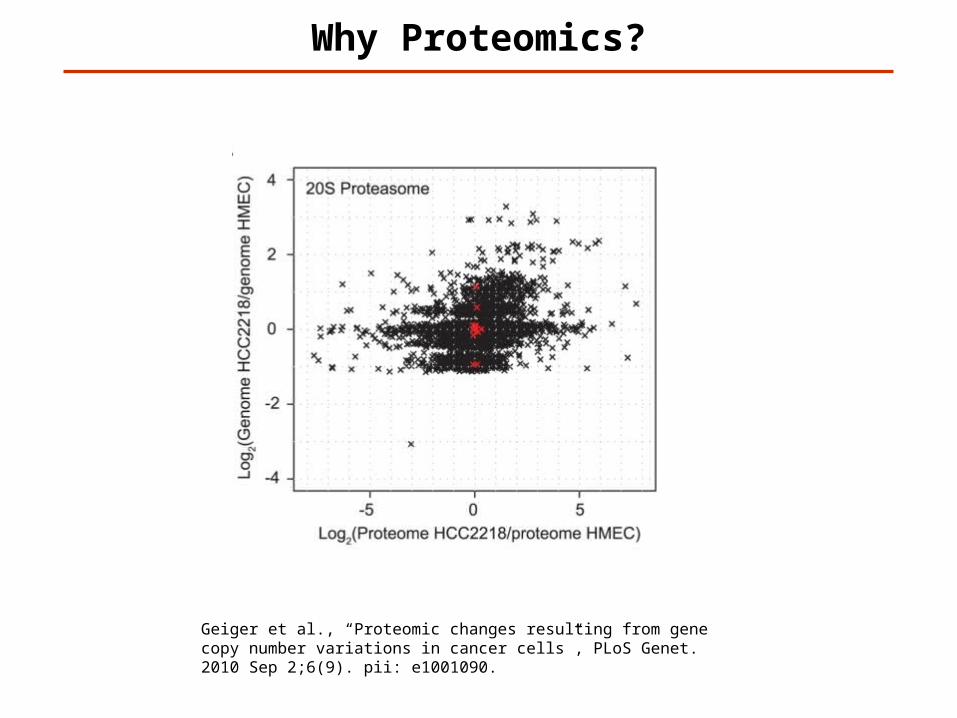
Why Proteomics?
Geiger et al., “Proteomic changes resulting from gene copy number variations in cancer cells”, PLoS Genet. 2010 Sep 2;6(9). pii: e1001090.
MSMS/MS
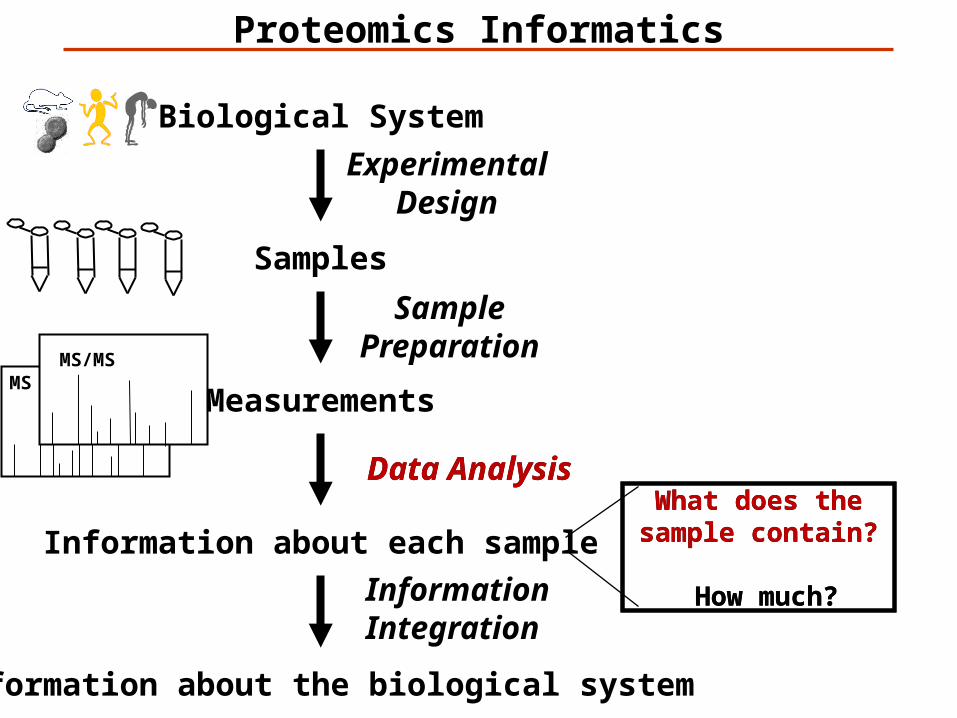
Biological System
Samples
Information about each sample
Information about the biological system
Measurements
What does the sample contain?
How much?
Proteomics Informatics
ExperimentalDesign
Data Analysis
InformationIntegration
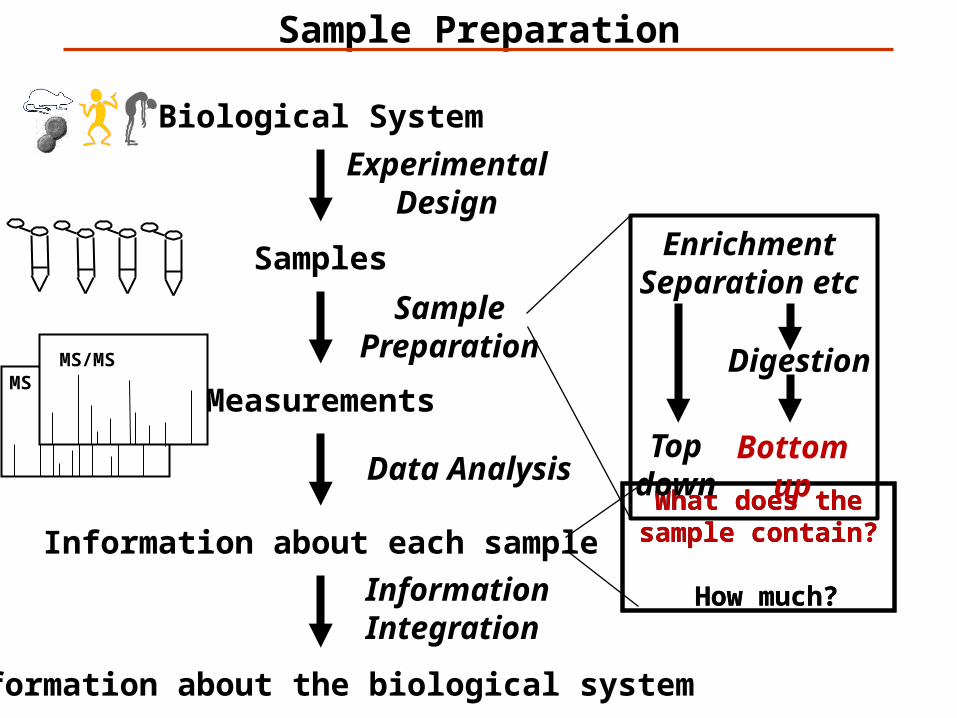
SamplePreparation
What does the sample contain?
How much?
Data Analysis
Biological System
Information about each sample
Information about the biological system
What does the sample contain?
How much?
Sample Preparation
ExperimentalDesign
Data Analysis
InformationIntegration
MSMS/MS
Samples
Measurements
SamplePreparation
What does the sample contain?
How much?
EnrichmentSeparation etc
Digestion
Topdown
Bottomup
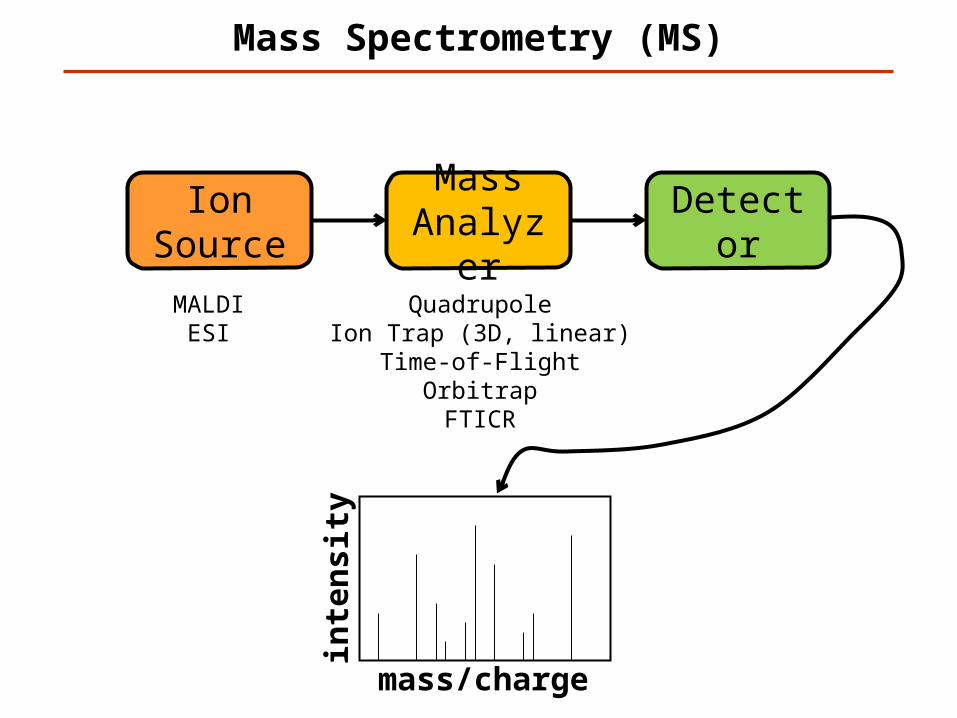
Mass Spectrometry (MS)
Ion Source
Mass Analyzer
Detector
MALDIESI
QuadrupoleIon Trap (3D, linear)
Time-of-FlightOrbitrapFTICR
mass/charge
inte
nsi
ty
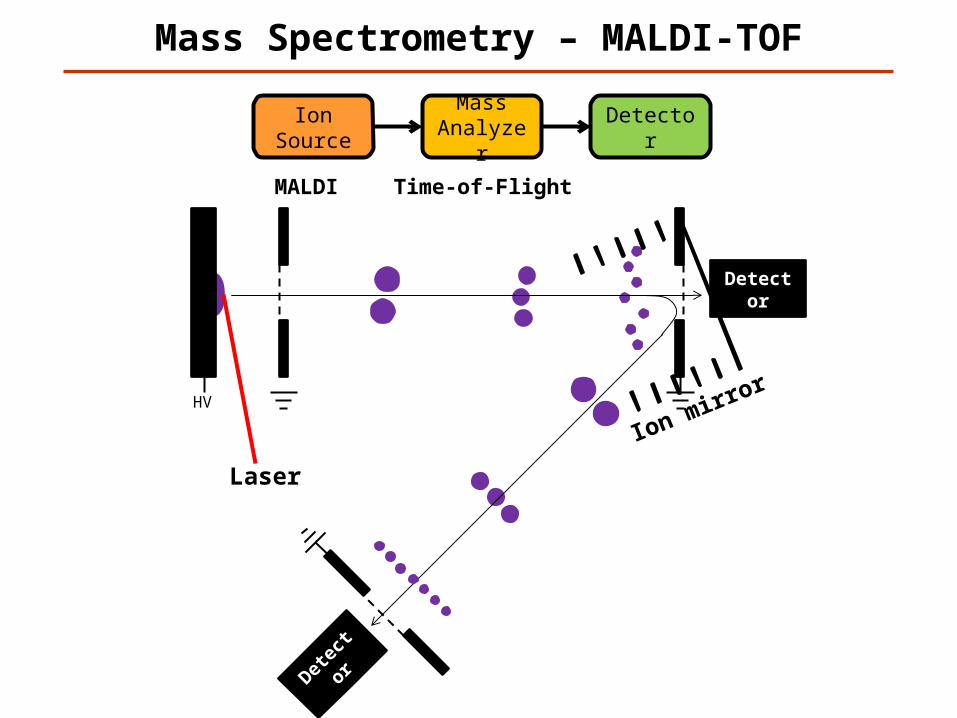
Mass Spectrometry – MALDI-TOF
Ion Source
Mass Analyzer
Detector
MALDI Time-of-Flight
Laser
Detector
Detec
tor
Ion mirror
HV
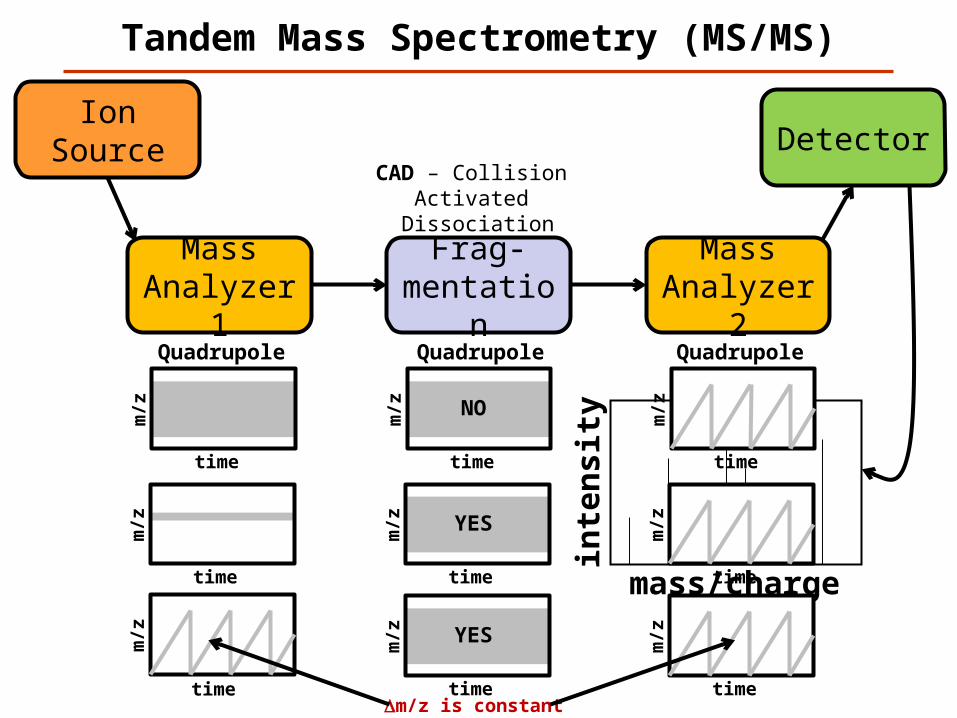
Tandem Mass Spectrometry (MS/MS)
Mass Analyzer 1
Frag-mentation
Detector
mass/chargein
ten
sity
Ion Source
Mass Analyzer 2
CAD – Collision Activated
Dissociation
Quadrupole Quadrupole Quadrupole
time
m/z
time
m/z
time
m/z
time
m/z
time
m/z
time
m/z
NO
YES
time
m/z
time
m/z YESm/z
timeDm/z is constant
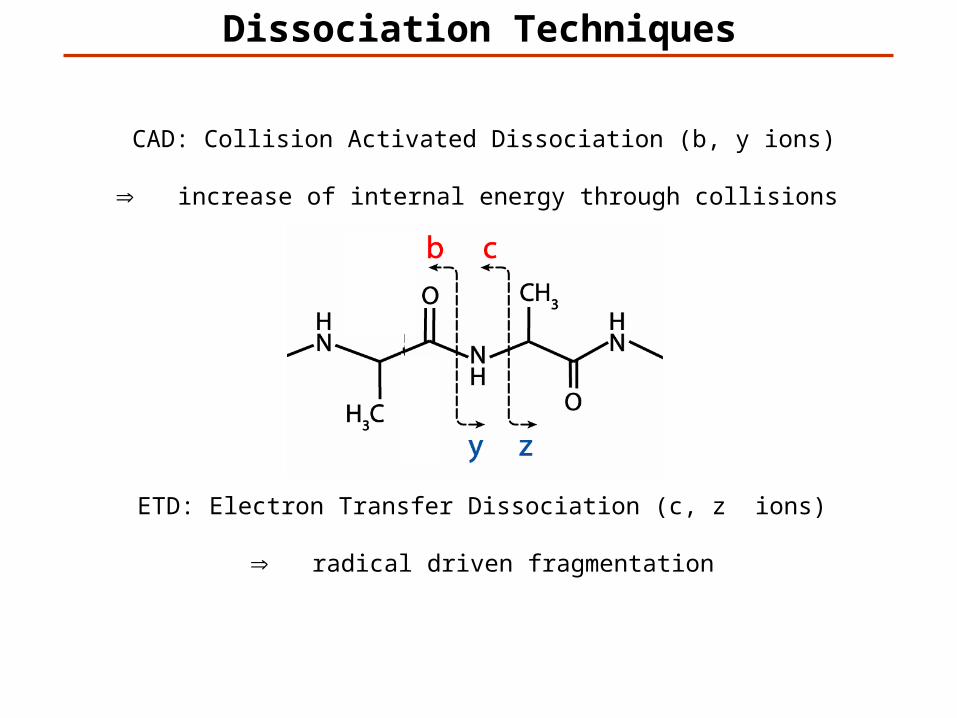
Dissociation Techniques
CAD: Collision Activated Dissociation (b, y ions)
increase of internal energy through collisions
ETD: Electron Transfer Dissociation (c, z ions)
radical driven fragmentation
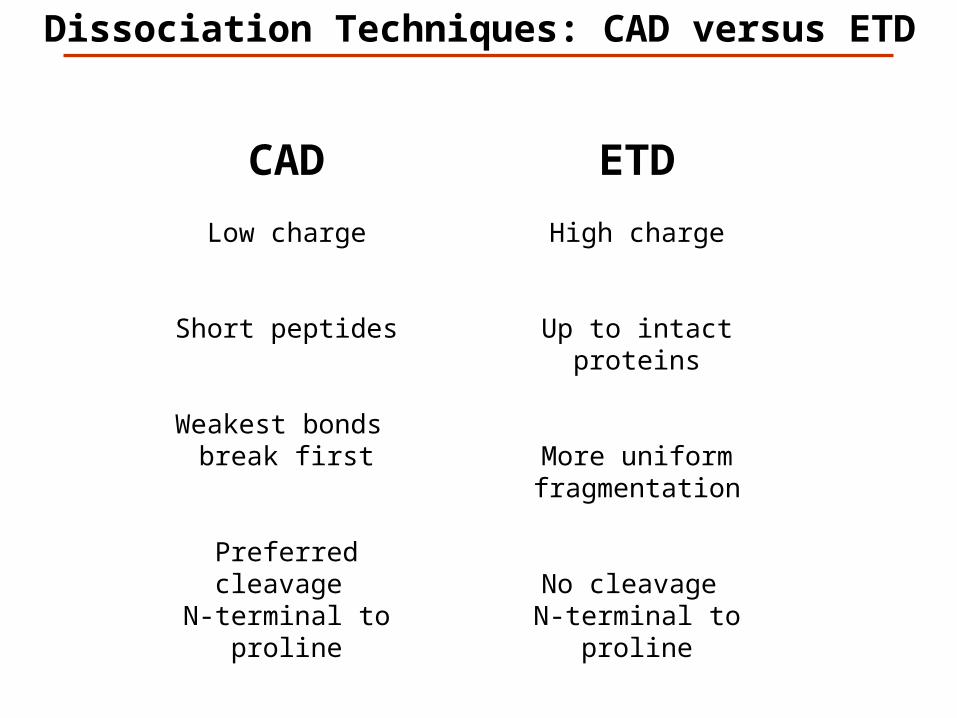
Dissociation Techniques: CAD versus ETD
CAD
Low charge
Short peptides
Weakest bonds break first
Preferred cleavage N-terminal to proline
ETD
High charge
Up to intact proteins
More uniform fragmentation
No cleavage N-terminal to proline
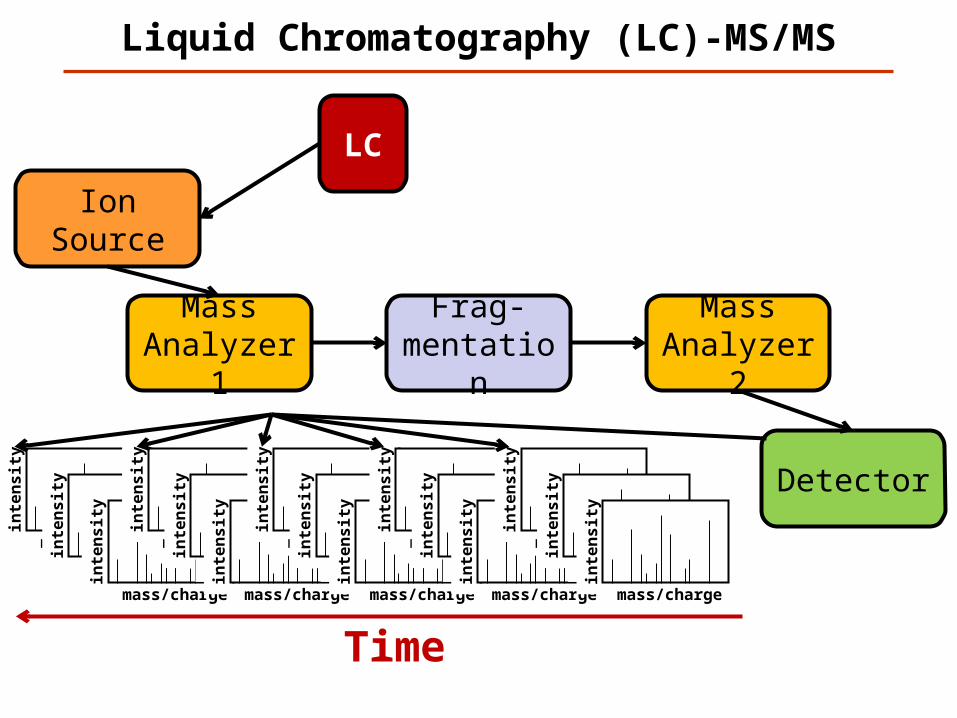
Liquid Chromatography (LC)-MS/MS
Mass Analyzer 1
Frag-mentation
Detector
inte
ns
ity
mass/charge
Ion Source
Mass Analyzer 2
LC
inte
ns
ity
mass/chargeinte
ns
ity
mass/charge
inte
ns
ity
mass/chargeinte
ns
ity
mass/chargeinte
ns
ity
mass/charge
Time
inte
ns
ity
mass/chargeinte
ns
ity
mass/chargeinte
ns
ity
mass/charge
inte
ns
ity
mass/chargeinte
ns
ity
mass/chargeinte
ns
ity
mass/charge
inte
ns
ity
mass/chargeinte
ns
ity
mass/chargeinte
ns
ity
mass/charge
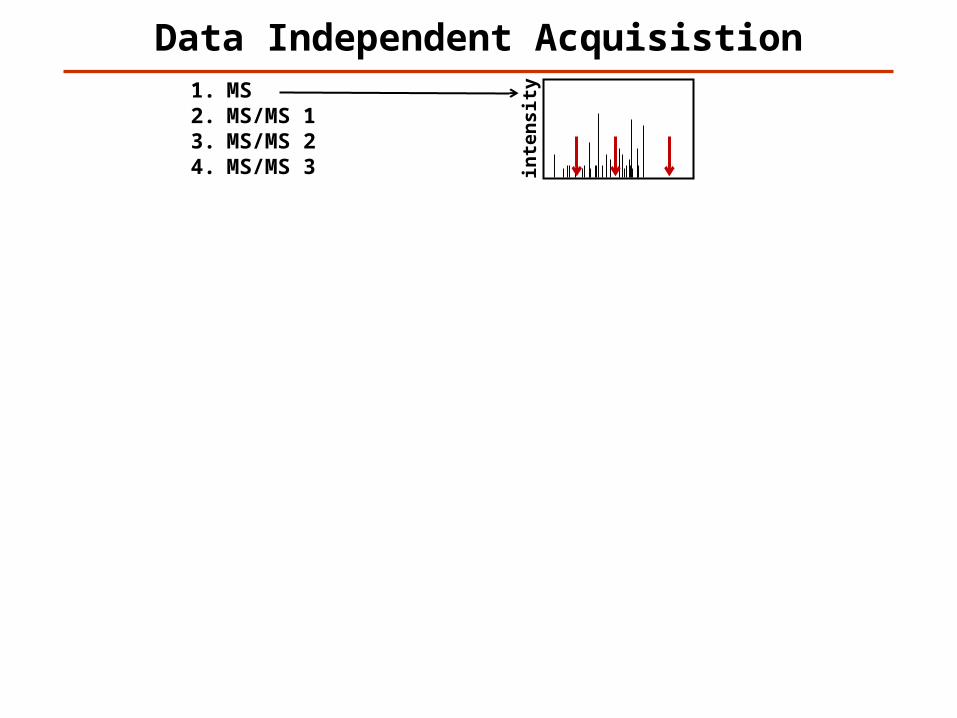
Data Independent Acquisistion
mass/charge
inte
nsi
ty
mass/charge
inte
nsi
ty
mass/charge
inte
nsi
ty
mass/charge
inte
nsi
ty
mass/charge
inte
nsi
ty
mass/charge
inte
nsi
ty
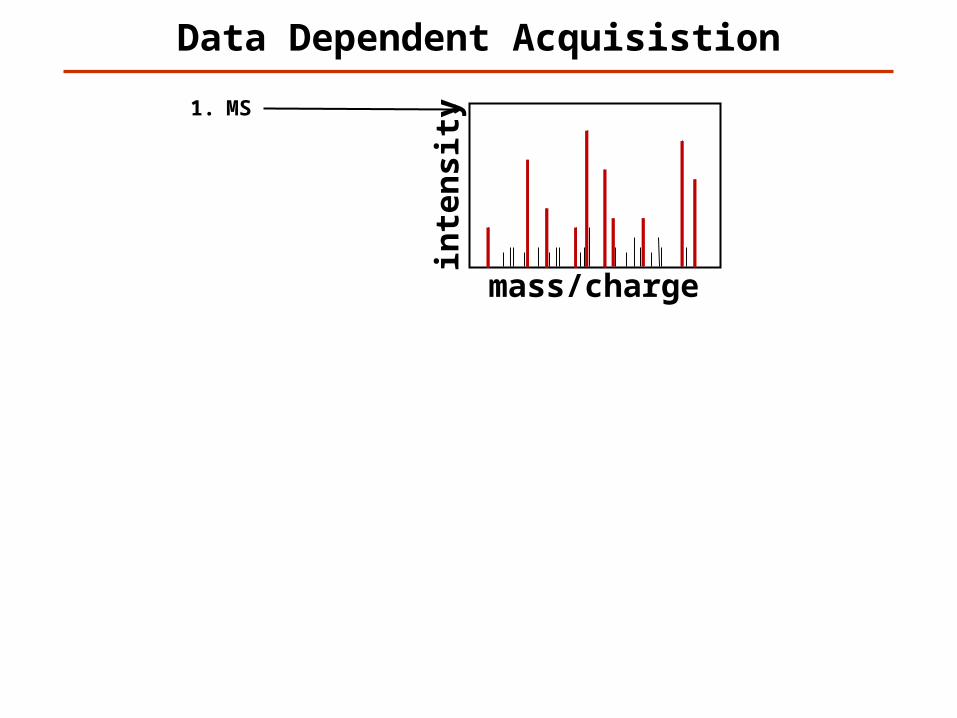
1. MS2. MS/MS 13. MS/MS 24. MS/MS 35. MS6. MS/MS 17. MS/MS 28. MS/MS 39. MS10. MS/MS 111. MS/MS 212. MS/MS 313. MS14. MS/MS 115. MS/MS 216. MS/MS 317. MS18. MS/MS 119. MS/MS 220. MS/MS 321. MS22. MS/MS 123. MS/MS 224. MS/MS 3…
1. MS2. MS/MS 13. MS/MS 24. MS/MS 35. MS/MS 46. MS/MS 57. MS/MS 68. MS/MS 79. MS/MS 810. MS/MS 911. MS/MS 10
12. MS13. MS/MS 114. MS/MS 215. MS/MS 316. MS/MS 417. MS/MS 518. MS/MS 619. MS/MS 720. MS/MS 821. MS/MS 922. MS/MS 10…
Data Dependent Acquisistion
mass/charge
inte
nsi
ty
mass/charge
inte
nsi
ty
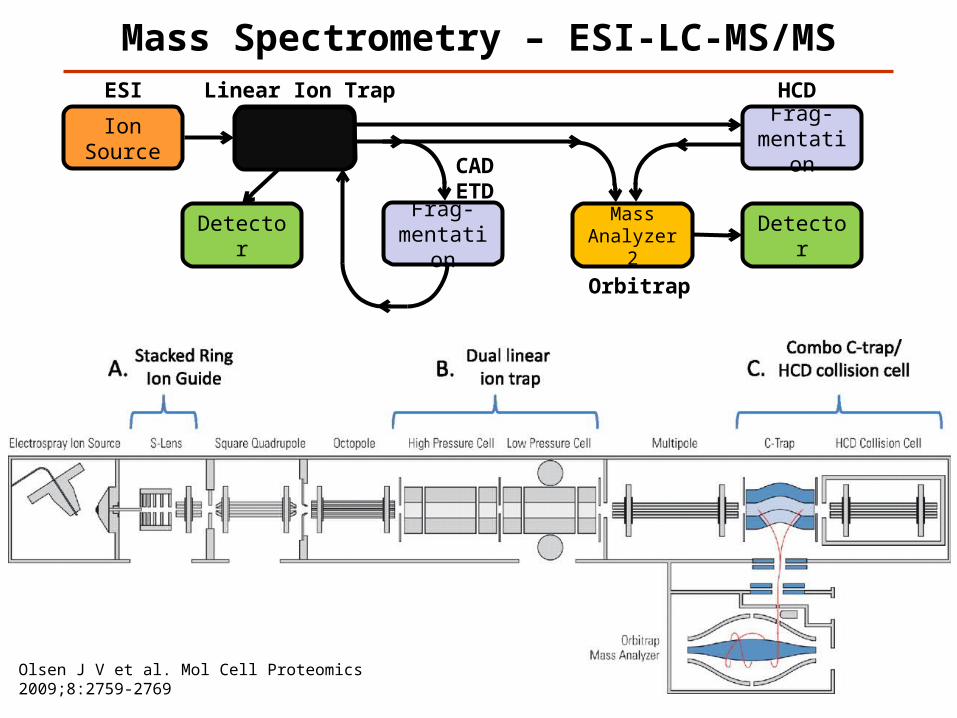
Mass Spectrometry – ESI-LC-MS/MS
Mass Analyzer 1
Frag-mentation
Detector
Ion Source
Mass Analyzer 2
ESI Linear Ion Trap
Orbitrap
CADETD
Olsen J V et al. Mol Cell Proteomics 2009;8:2759-2769
Frag-mentation
HCD
Detector
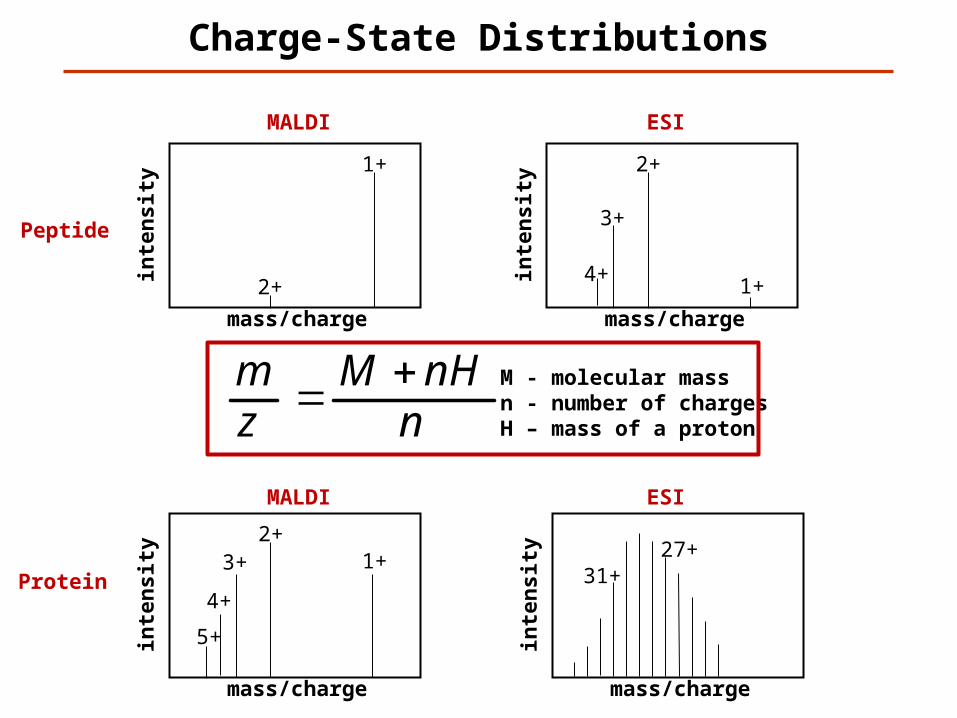
Charge-State Distributions
mass/charge
inte
nsi
tyMALDI ESI
mass/charge
inte
nsi
ty
1+
1+ 2+
3+
4+
Peptide
Protein
2+
nnHM
zm M - molecular mass
n - number of chargesH – mass of a proton
mass/charge
inte
nsi
ty
mass/charge
inte
nsi
ty 1+ 27+2+
3+
4+
MALDI ESI
5+
31+
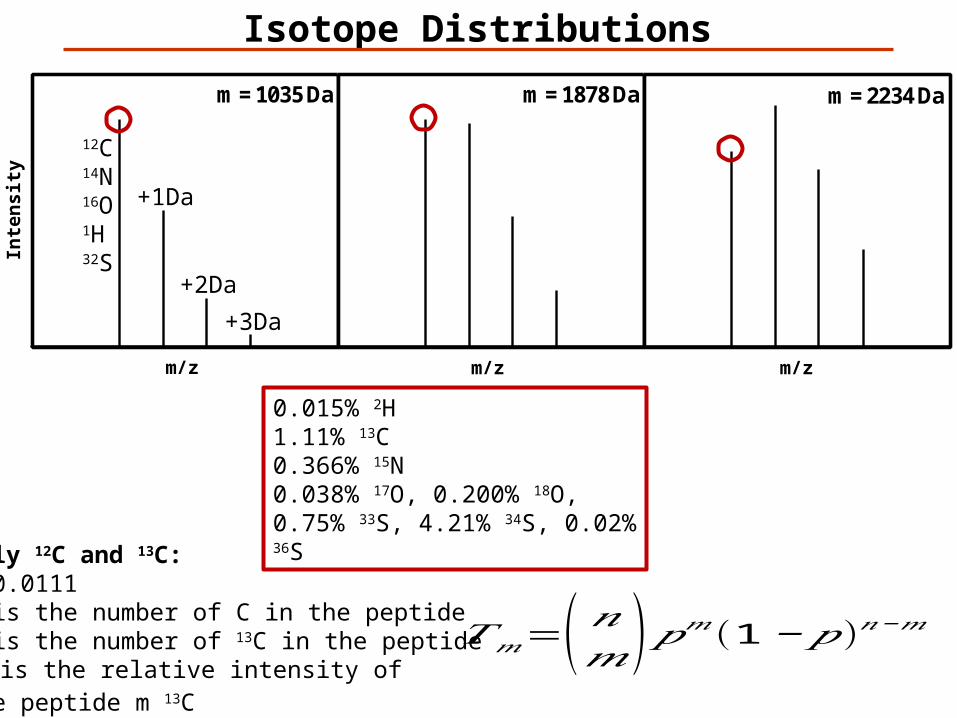
m = 1035 Da m = 1878 Da m = 2234 Da
Isotope Distributions
m/z m/z m/z
Inte
nsi
ty
0.015% 2H1.11% 13C 0.366% 15N0.038% 17O, 0.200% 18O, 0.75% 33S, 4.21% 34S, 0.02% 36S
Only 12C and 13C:p=0.0111n is the number of C in the peptidem is the number of 13C in the peptideTm is the relative intensity of the peptide m 13C
𝑇𝑚=( 𝑛𝑚)𝑝𝑚(1−𝑝)𝑛−𝑚
12C14N16O1H32S
+1Da
+2Da
+3Da
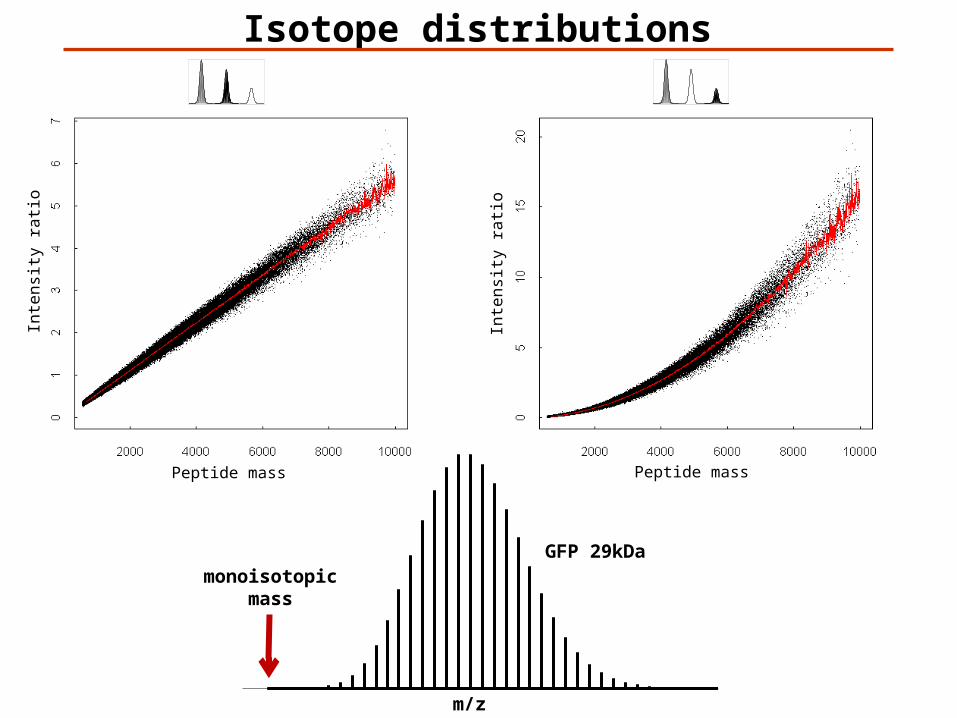
Isotope distributions
Peptide mass
Inte
nsi
ty r
atio
Peptide mass
Inte
nsi
ty r
atio
m/z
monoisotopicmass
GFP 29kDa
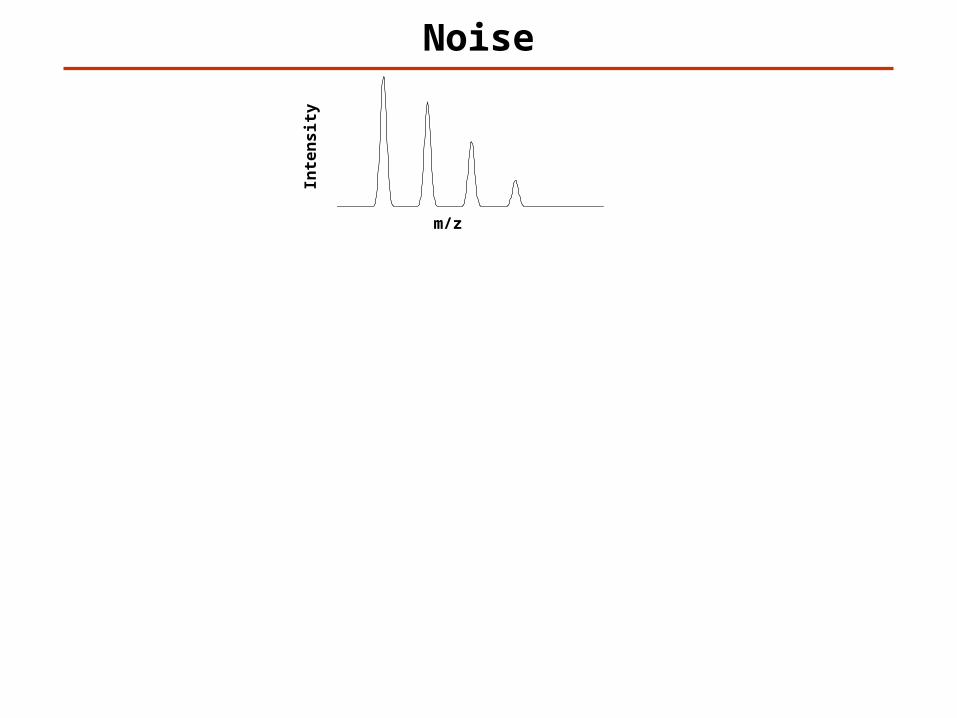
Noise
m/z
Inte
ns
ity
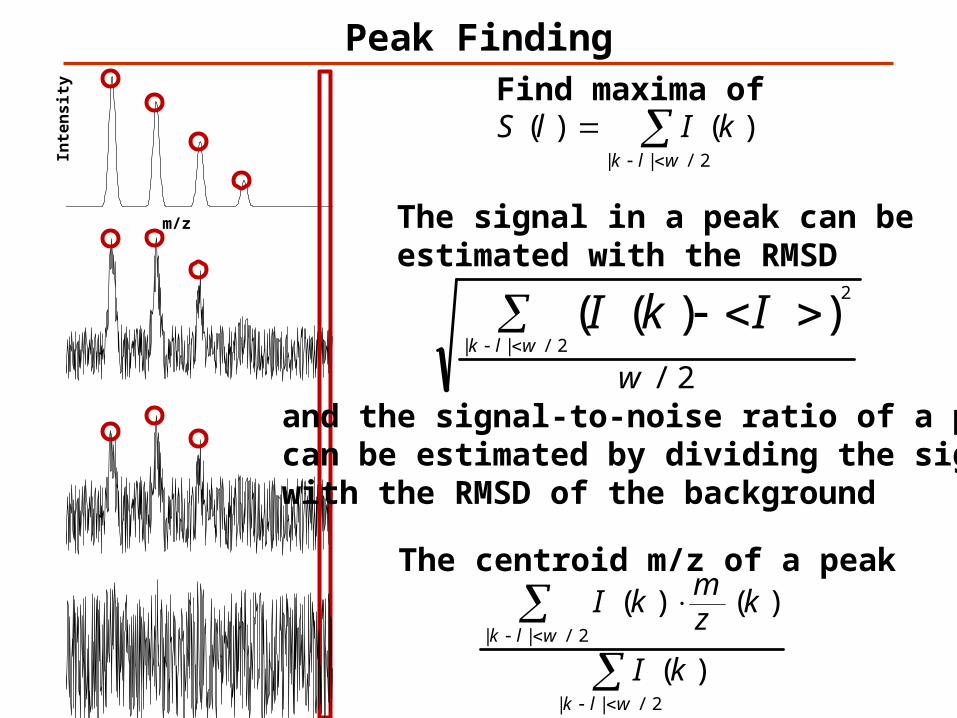
Peak Finding
m/z
Inte
ns
ity
2/||
)()(wlk
kIlSFind maxima of
The centroid m/z of a peak
2
2
/||
/||
)(
)()(
wlk
wlk
kI
kzmkI
The signal in a peak can beestimated with the RMSD
22
2
//||
))((w
wlkIkI
and the signal-to-noise ratio of a peak can be estimated by dividing the signal with the RMSD of the background
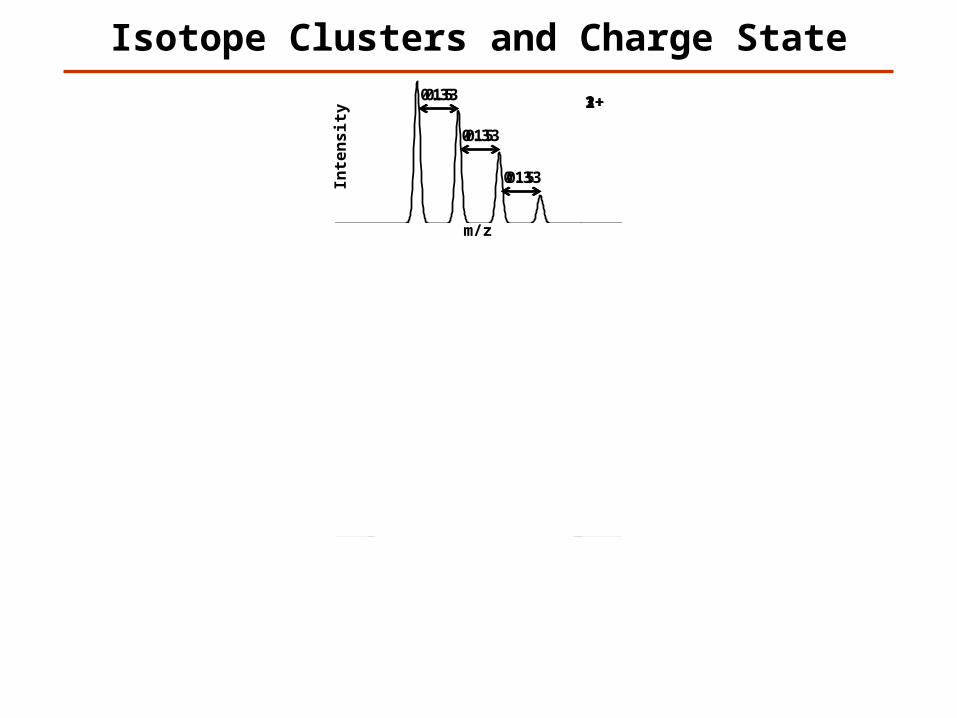
Isotope Clusters and Charge State
m/z
Inte
ns
ity
Possible to Determine Charge?
Yes
Yes
Maybe
No
1+1
1
1
2+0.5
0.5
0.5
3+0.33
0.33
0.33
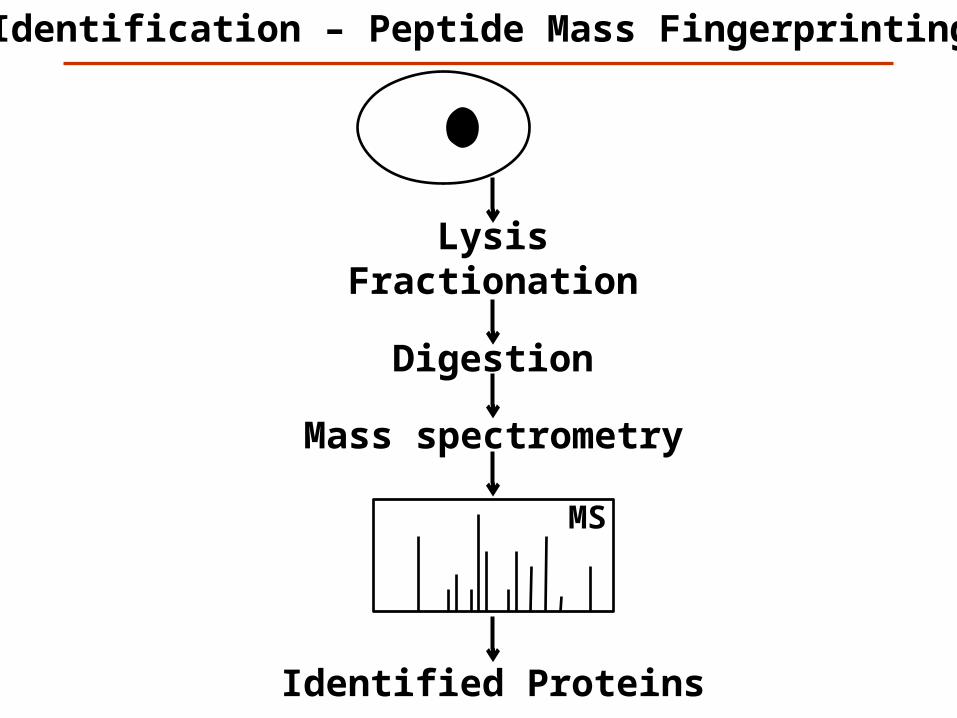
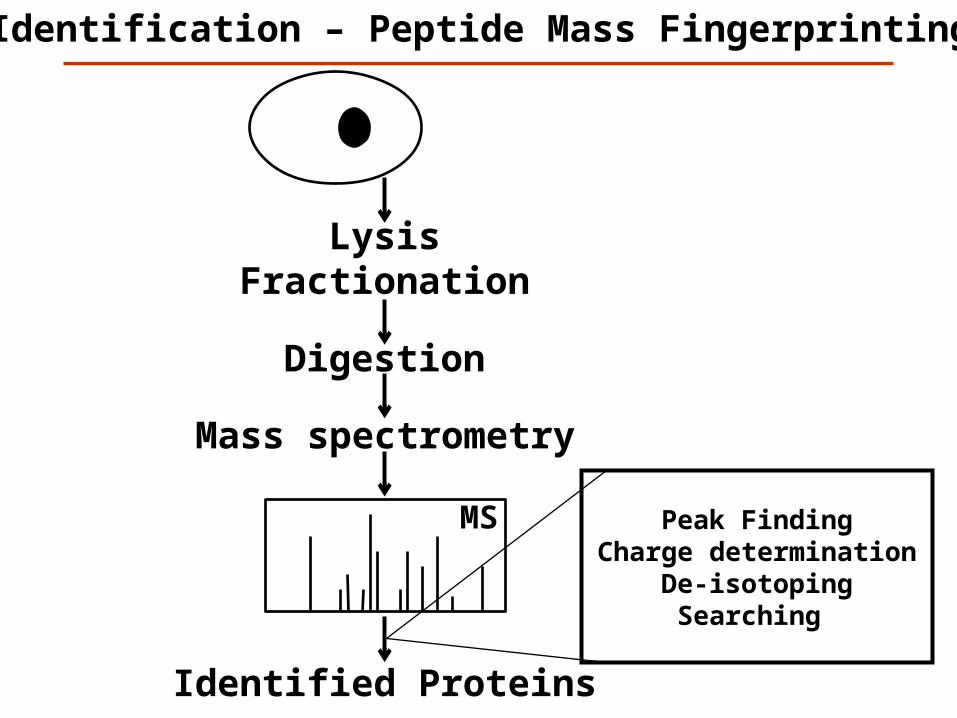
Mass spectrometry
LysisFractionation
Identification – Peptide Mass Fingerprinting
MS
Digestion
Identified Proteins
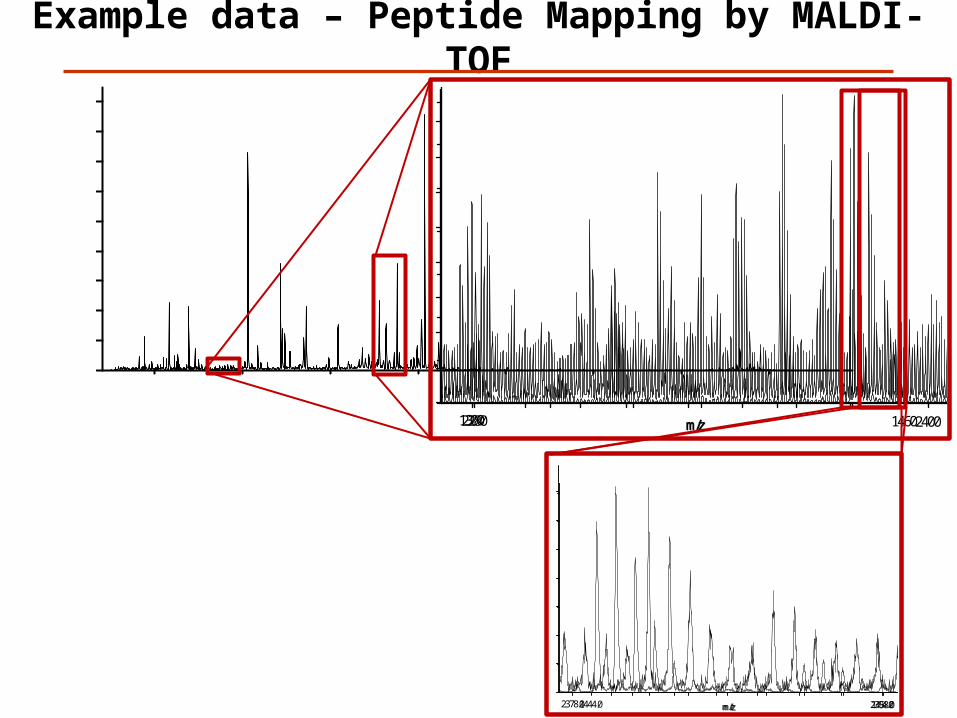
Example data – Peptide Mapping by MALDI-TOF
m/z1000 4500
Inte
nsity
1800
0
D:\Users\Fenyo\Desktop\ATP.txt (15:42 02/03/11)Description: none available m/z2280 2400
Inte
nsi
ty
700
0
D:\Users\Fenyo\Desktop\ATP.txt (15:46 02/03/11)Description: none available
m/z1300 1460In
ten
sity
45
0
D:\Users\Fenyo\Desktop\ATP.txt (15:50 02/03/11)Description: none available
m/z1444.0 1458.0
Inte
nsi
ty
35
0
D:\Users\Fenyo\Desktop\ATP.txt (15:54 02/03/11)Description: none available
m/z2378.0 2394.0
Inte
nsi
ty
700
0
D:\Users\Fenyo\Desktop\ATP.txt (16:07 02/03/11)Description: none available
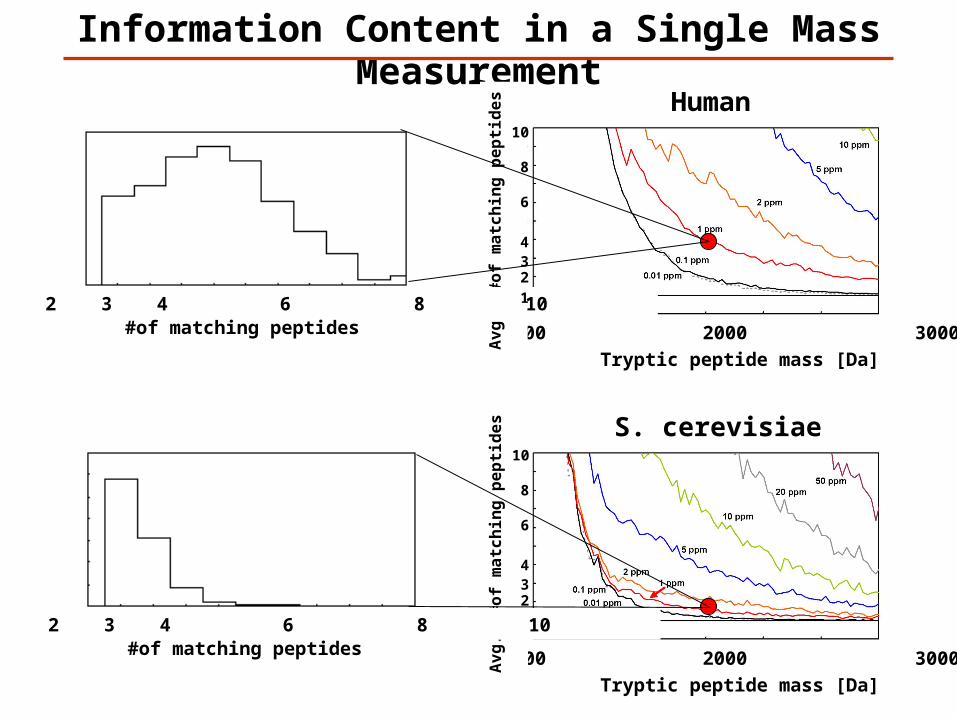
S. cerevisiae
Human
Information Content in a Single Mass Measurement
Tryptic peptide mass [Da]
1000 2000 3000
Tryptic peptide mass [Da]
1000 2000 3000
Av
g.
#o
f m
atc
hin
g p
ep
tid
es
#of matching peptides 1 2 3 4 6 8 10
10
8
6
432
1
Av
g.
#o
f m
atc
hin
g p
ep
tid
es
10
8
6
432
1
#of matching peptides 1 2 3 4 6 8 10
Mass spectrometry
LysisFractionation
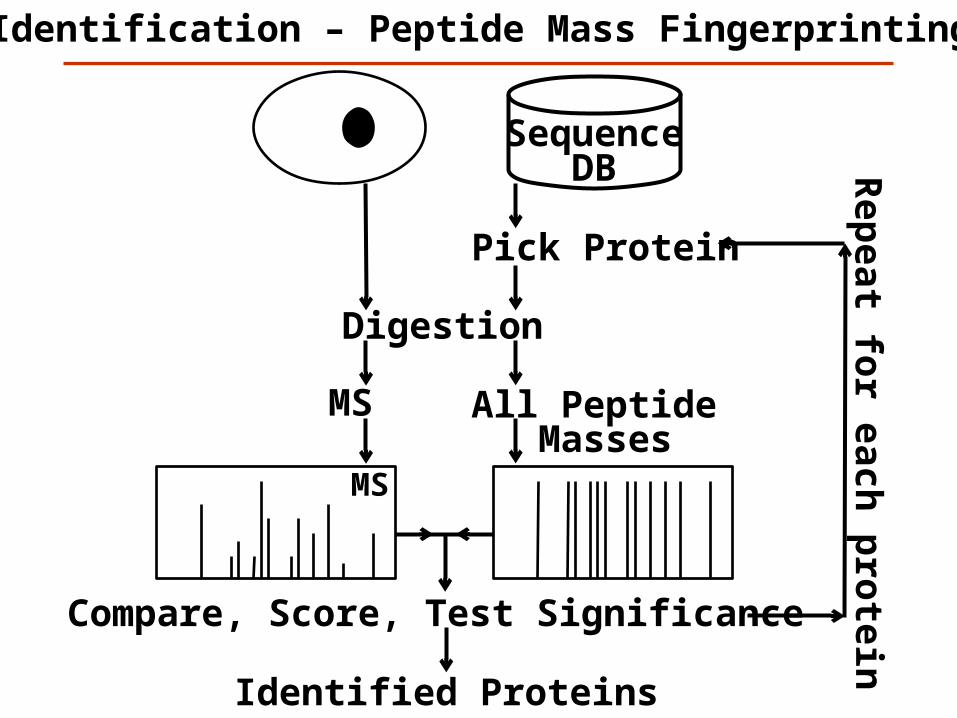
Identification – Peptide Mass Fingerprinting
MS
Digestion
Identified Proteins
Peak Finding Charge determination
De-isotopingSearching
MS
Identification – Peptide Mass Fingerprinting
MS
Digestion
All Peptide Masses
Pick Protein
Compare, Score, Test Significance
Rep
eat for each
pro
teinSequence
DB
Identified Proteins
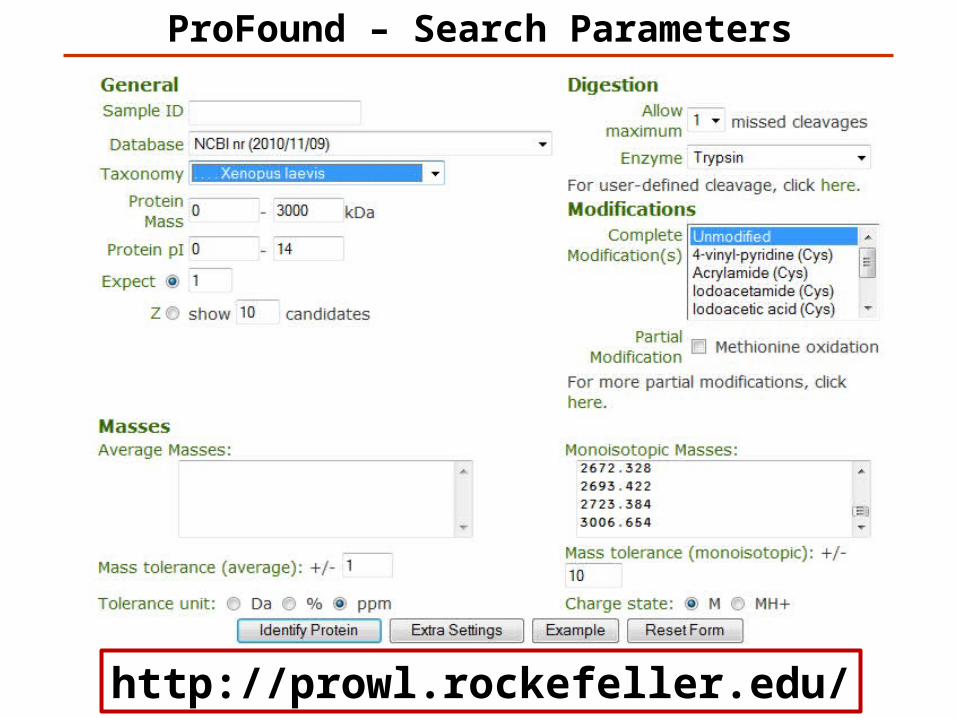
ProFound – Search Parameters
http://prowl.rockefeller.edu/
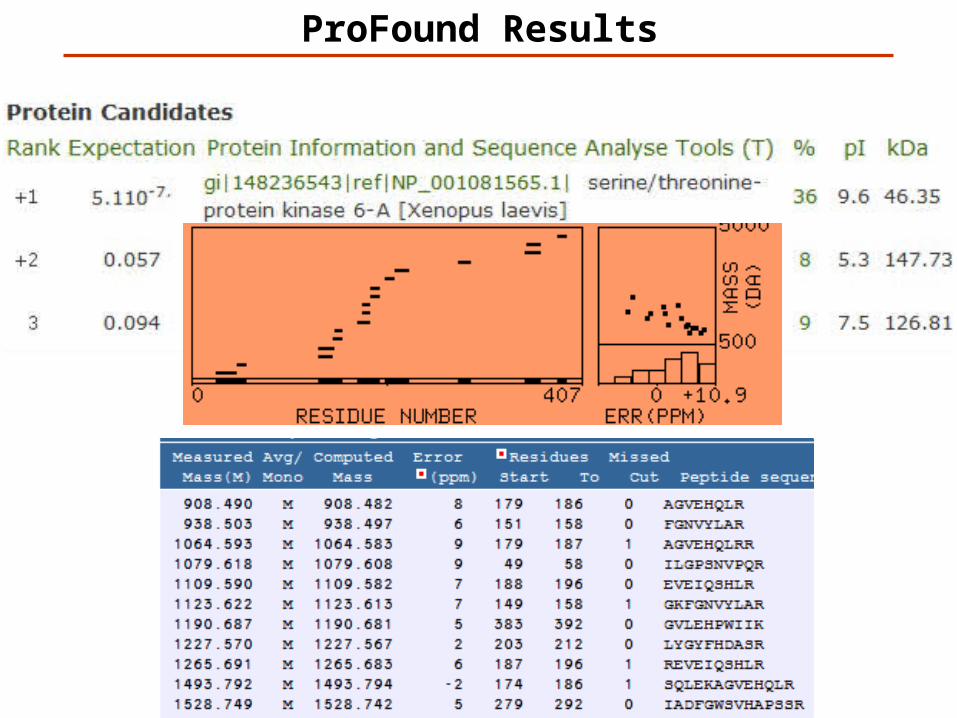
ProFound Results
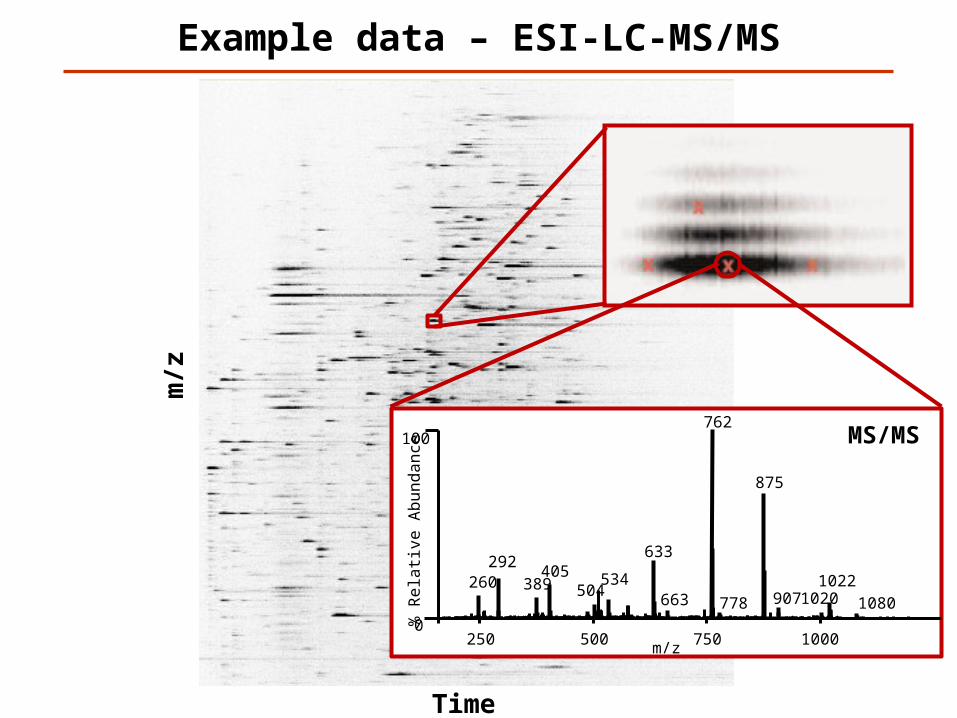
Example data – ESI-LC-MS/MS
Time
m/z
m/z
% R
ela
tive
Ab
un
da
nce
100
0250 500 750 1000
[M+2H]2+
762
260 389 504
633
875
292405 534
9071020663 778 1080
1022
MS/MS
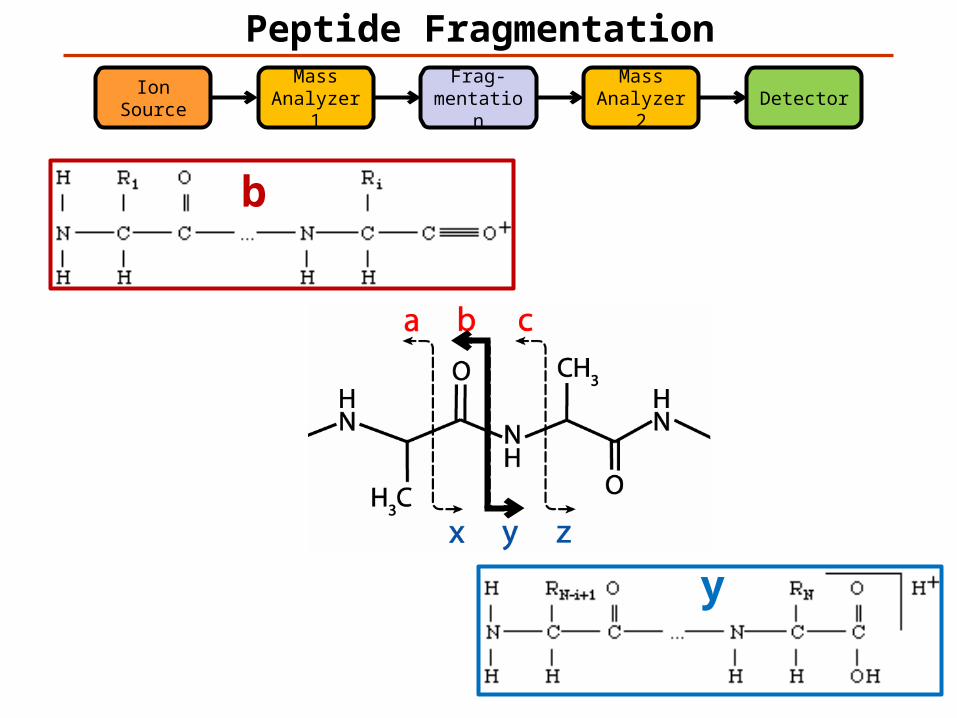
Peptide FragmentationMass
Analyzer 1Frag-
mentationDetector
Ion Source
Mass Analyzer 2
b
y
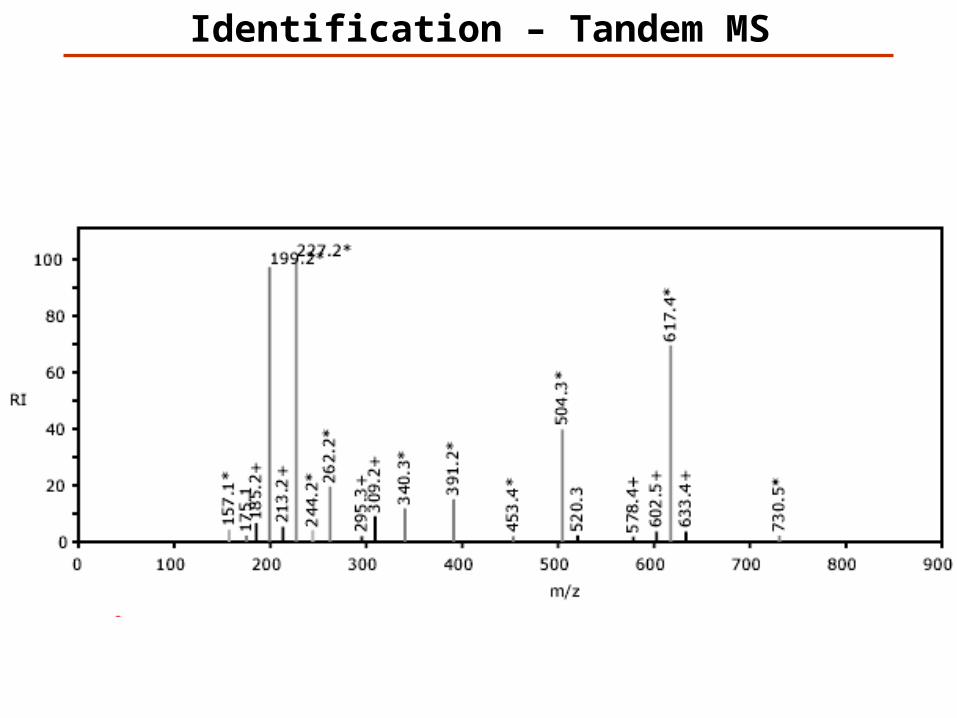
Identification – Tandem MS
m/z
% R
elat
ive
Abu
ndan
ce
100
0250 500 750 1000
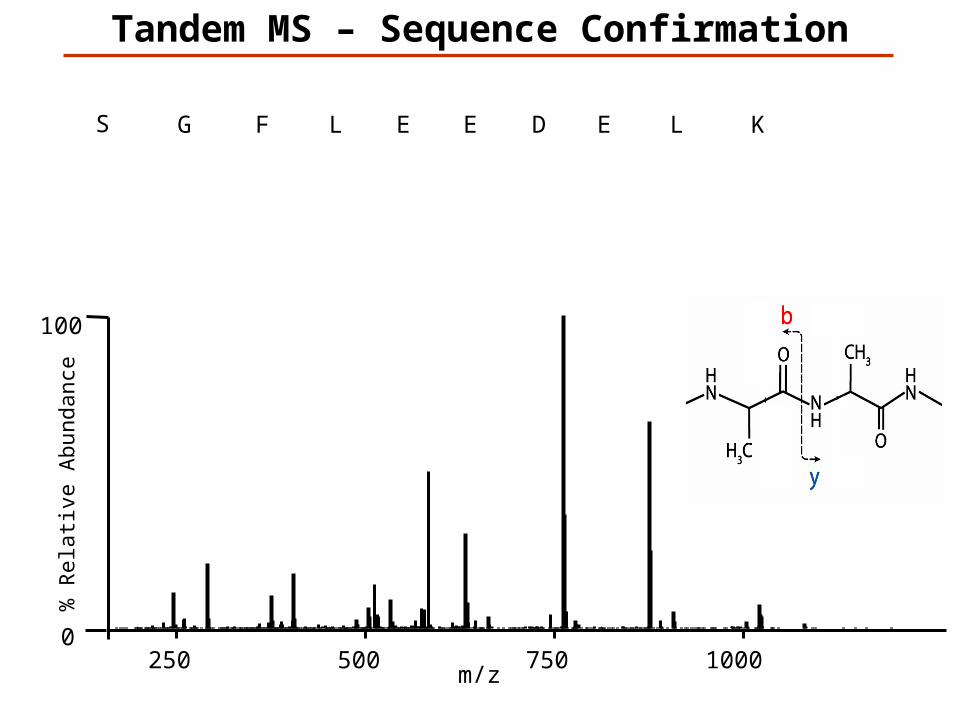
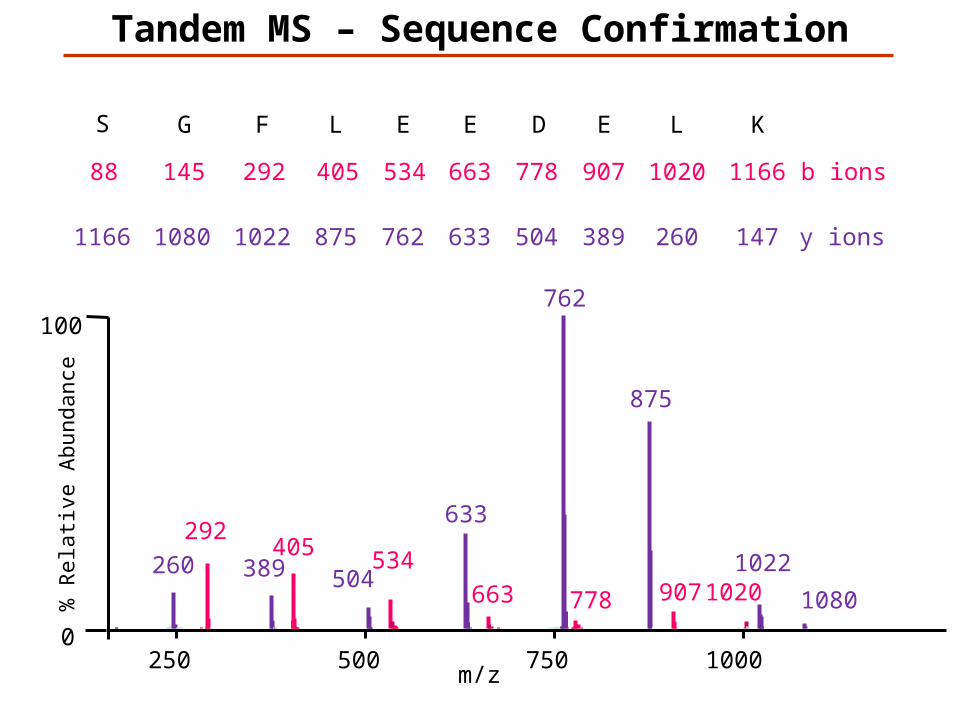
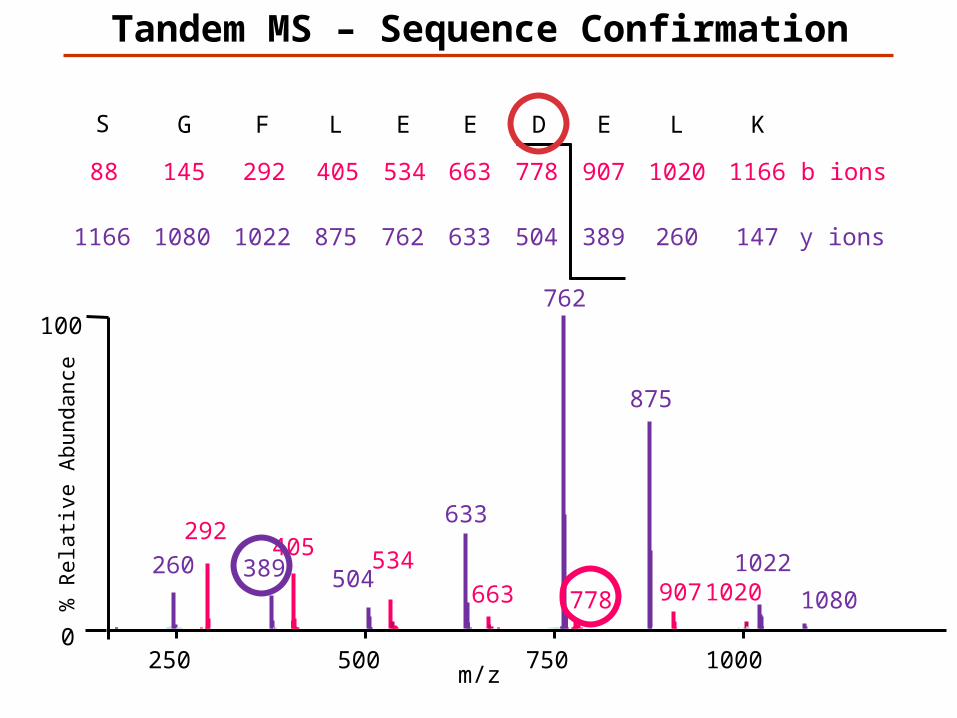
Tandem MS – Sequence Confirmation
KLEDEELFGS
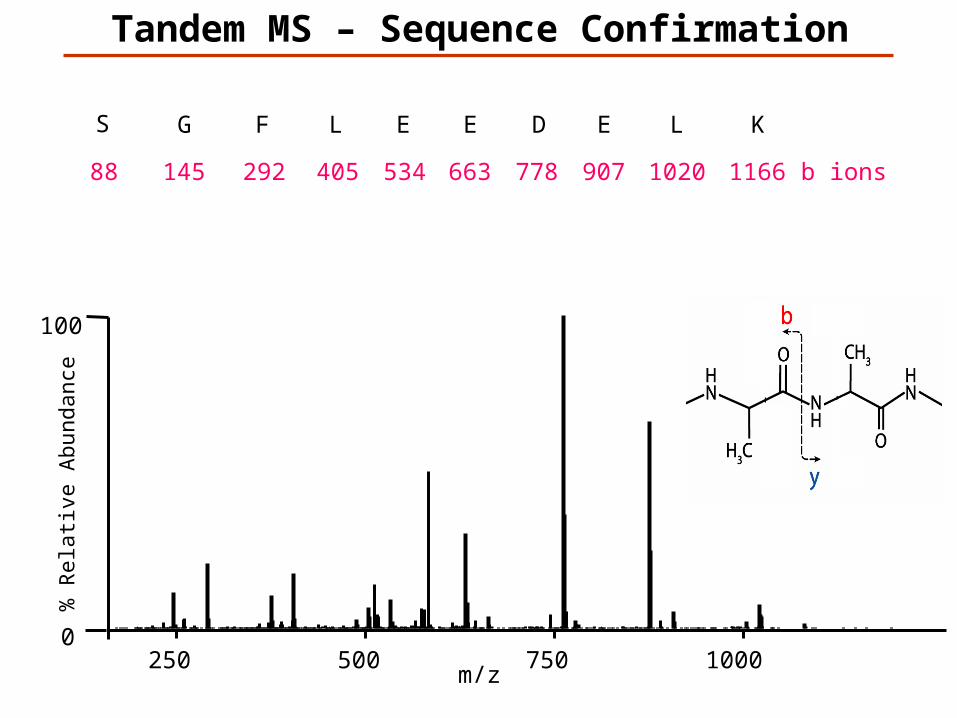
K1166
L1020
E907
D778
E663
E534
L405
F292
G145
S88 b ions
m/z
% R
elat
ive
Abu
ndan
ce
100
0250 500 750 1000
KLEDEELFGS
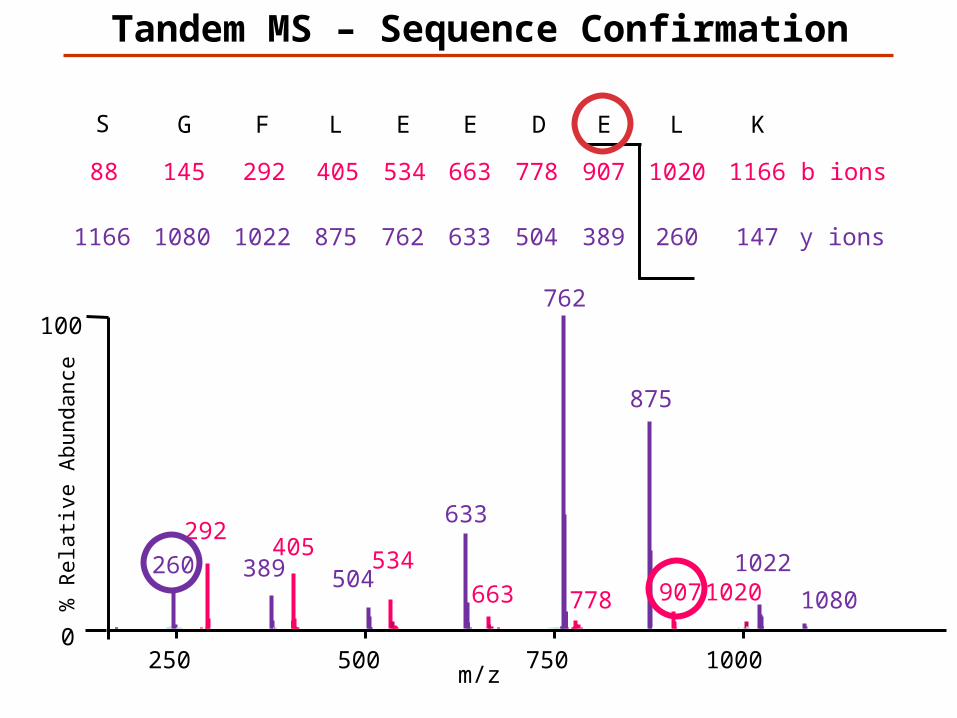
Tandem MS – Sequence Confirmation
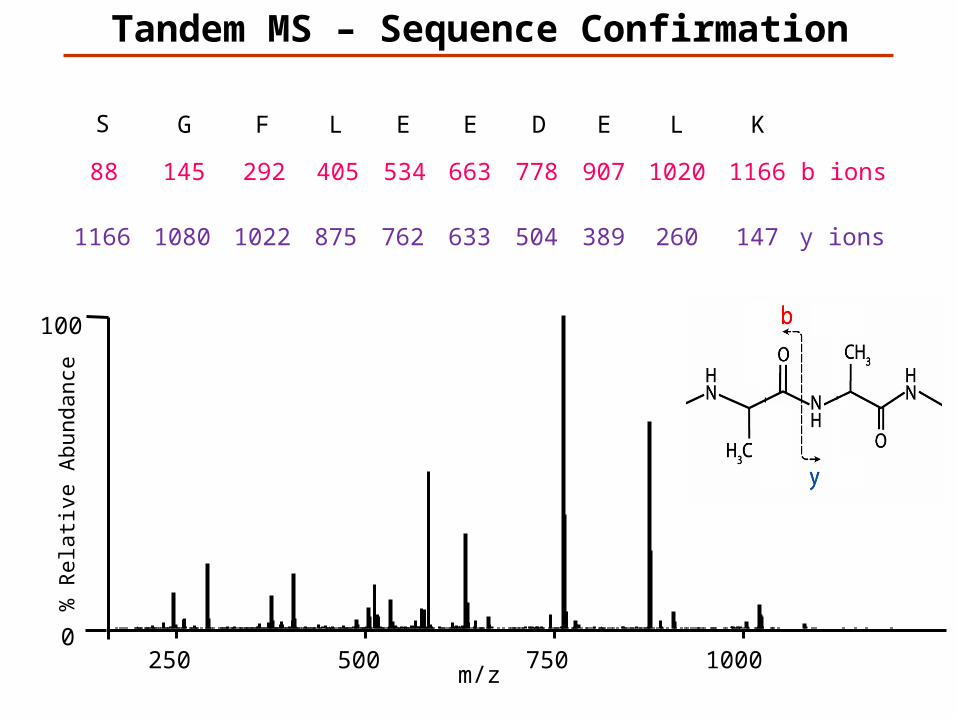
147K
1166L
260
1020E
389
907D
504
778E
633
663E
762
534L
875
405F
1022
292G
1080
145S
1166
88
y ions
b ions
m/z
% R
elat
ive
Abu
ndan
ce
100
0250 500 750 1000
KLEDEELFGS
Tandem MS – Sequence Confirmation
147K
1166L
260
1020E
389
907D
504
778E
633
663E
762
534L
875
405F
1022
292G
1080
145S
1166
88
y ions
b ions
m/z
% R
elat
ive
Abu
ndan
ce
100
0250 500 750 1000
[M+2H]2+
762
260 389 504
633
875
292405 534
907 1020663 778 1080
1022
KLEDEELFGS
Tandem MS – Sequence Confirmation

147K
1166L
260
1020E
389
907D
504
778E
633
663E
762
534L
875
405F
1022
292G
1080
145S
1166
88
y ions
b ions
m/z
% R
elat
ive
Abu
ndan
ce
100
0250 500 750 1000
[M+2H]2+
762
260 389 504
633
875
292405 534
907 1020663 778 1080
1022
KLEDEELFGS
Tandem MS – Sequence Confirmation
147K
1166L
260
1020E
389
907D
504
778E
633
663E
762
534L
875
405F
1022
292G
1080
145S
1166
88
y ions
b ions
m/z
% R
elat
ive
Abu
ndan
ce
100
0250 500 750 1000
[M+2H]2+
762
260 389 504
633
875
292405 534
907 1020663 778 1080
1022
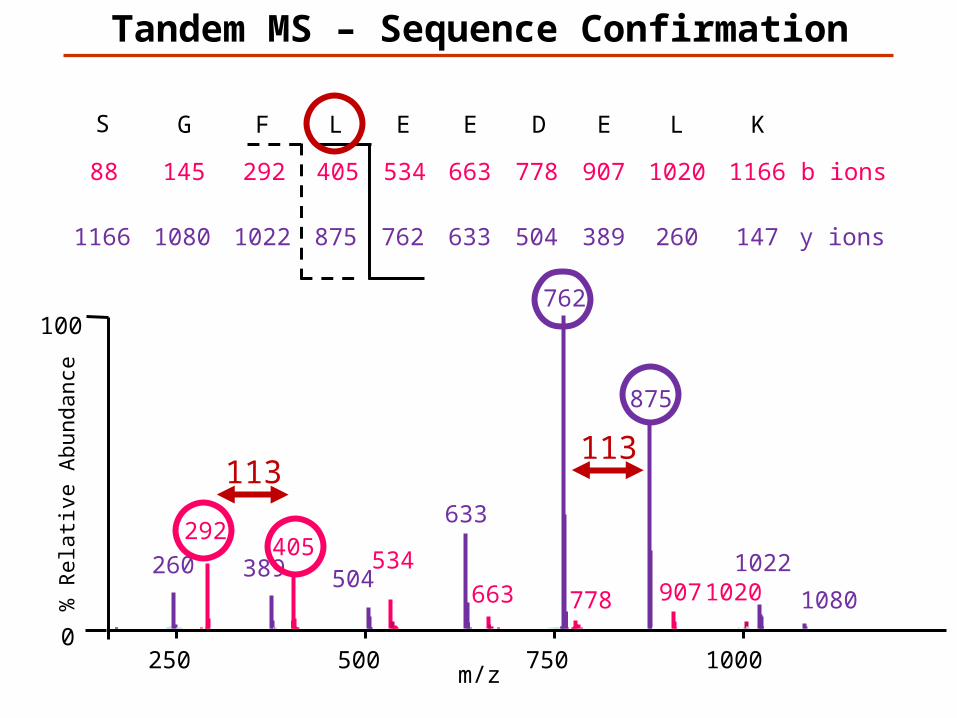
113
KLEDEELFGS
113
Tandem MS – Sequence Confirmation
147K
1166L
260
1020E
389
907D
504
778E
633
663E
762
534L
875
405F
1022
292G
1080
145S
1166
88
y ions
b ions
m/z
% R
elat
ive
Abu
ndan
ce
100
0250 500 750 1000
[M+2H]2+
762
260 389 504
633
875
292405 534
907 1020663 778 1080
1022
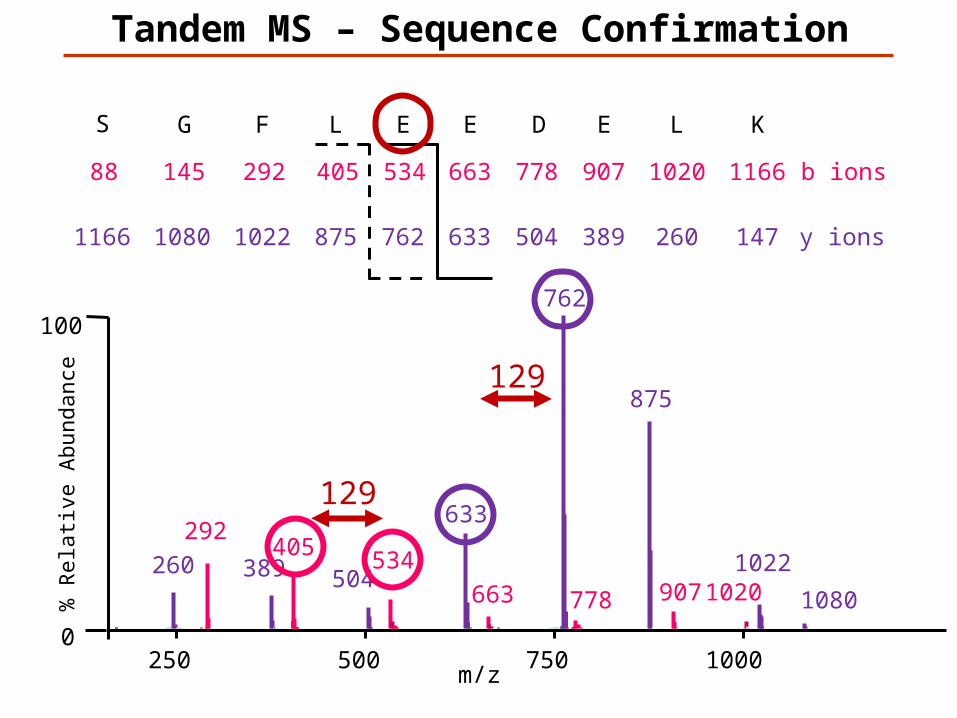
129
129
KLEDEELFGS
Tandem MS – Sequence Confirmation
KLEDEELFGS
147K
1166L
260
1020E
389
907D
504
778E
633
663E
762
534L
875
405F
1022
292G
1080
145S
1166
88
y ions
b ions
m/z
% R
elat
ive
Abu
ndan
ce
100
0250 500 750 1000
[M+2H]2+
762
260 389 504
633
875
292405 534
907 1020663 778 1080
1022
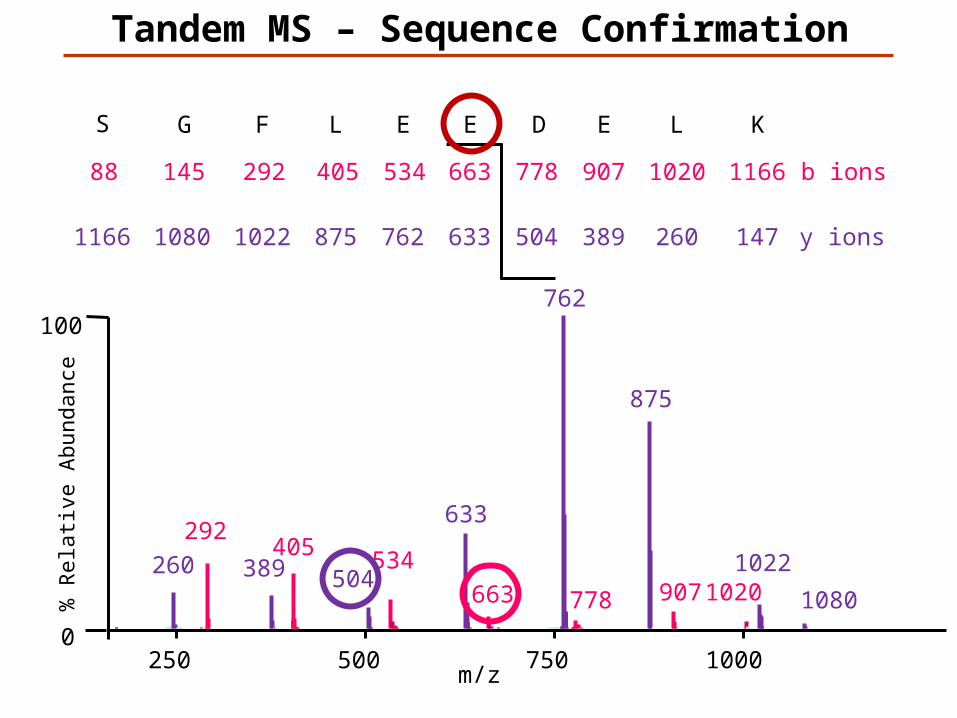
Tandem MS – Sequence Confirmation
KLEDEELFGS
147K
1166L
260
1020E
389
907D
504
778E
633
663E
762
534L
875
405F
1022
292G
1080
145S
1166
88
y ions
b ions
m/z
% R
elat
ive
Abu
ndan
ce
100
0250 500 750 1000
[M+2H]2+
762
260 389 504
633
875
292405 534
907 1020663 778 1080
1022
Tandem MS – Sequence Confirmation
KLEDEELFGS
147K
1166L
260
1020E
389
907D
504
778E
633
663E
762
534L
875
405F
1022
292G
1080
145S
1166
88
y ions
b ions
m/z
% R
elat
ive
Abu
ndan
ce
100
0250 500 750 1000
[M+2H]2+
762
260 389 504
633
875
292405 534
907 1020663 778 1080
1022
Tandem MS – Sequence Confirmation
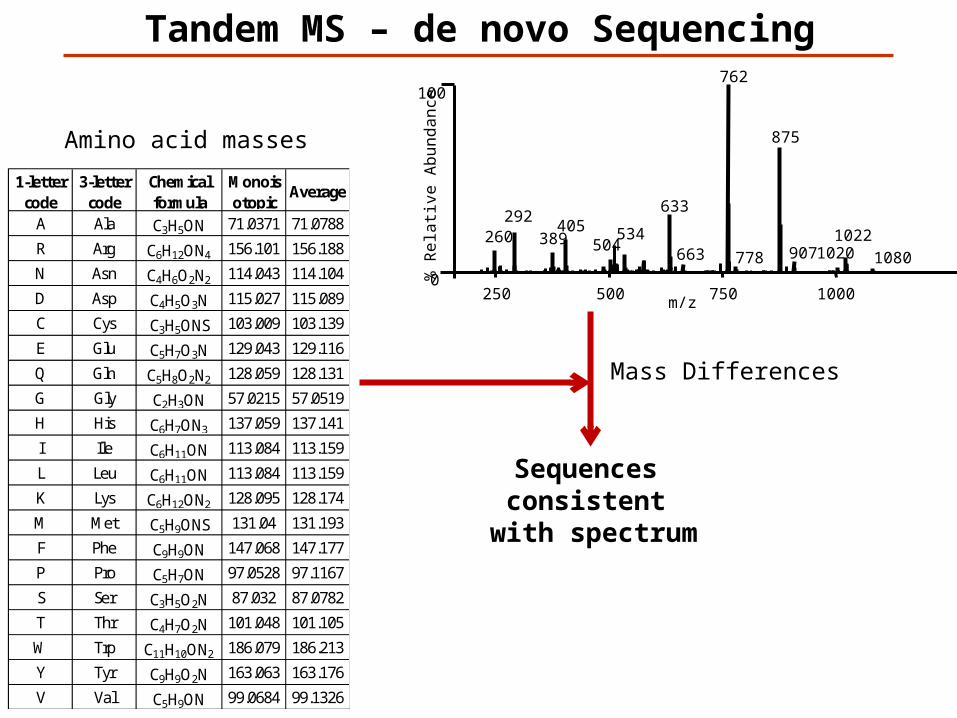
Tandem MS – de novo Sequencing
m/z
% R
ela
tive
Ab
un
da
nce
100
0250 500 750 1000
[M+2H]2+
762
260 389 504
633
875
292405 534
9071020663 778 1080
1022
Mass Differences
1-letter code
3-letter code
Chemical formula
Monoisotopic
Average
A Ala C3H5ON 71.0371 71.0788
R Arg C6H12ON4 156.101 156.188
N Asn C4H6O2N2 114.043 114.104
D Asp C4H5O3N 115.027 115.089
C Cys C3H5ONS 103.009 103.139
E Glu C5H7O3N 129.043 129.116
Q Gln C5H8O2N2 128.059 128.131
G Gly C2H3ON 57.0215 57.0519
H His C6H7ON3 137.059 137.141
I Ile C6H11ON 113.084 113.159
L Leu C6H11ON 113.084 113.159
K Lys C6H12ON2 128.095 128.174
M Met C5H9ONS 131.04 131.193
F Phe C9H9ON 147.068 147.177
P Pro C5H7ON 97.0528 97.1167
S Ser C3H5O2N 87.032 87.0782
T Thr C4H7O2N 101.048 101.105
W Trp C11H10ON2 186.079 186.213
Y Tyr C9H9O2N 163.063 163.176
V Val C5H9ON 99.0684 99.1326
Amino acid masses
Sequences consistent
with spectrum
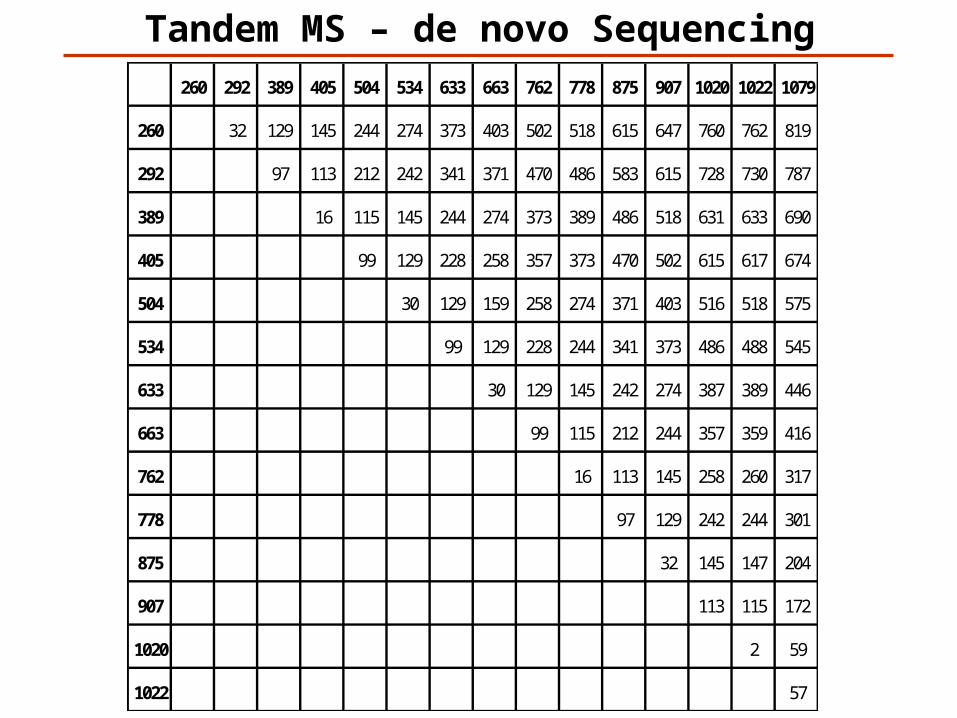
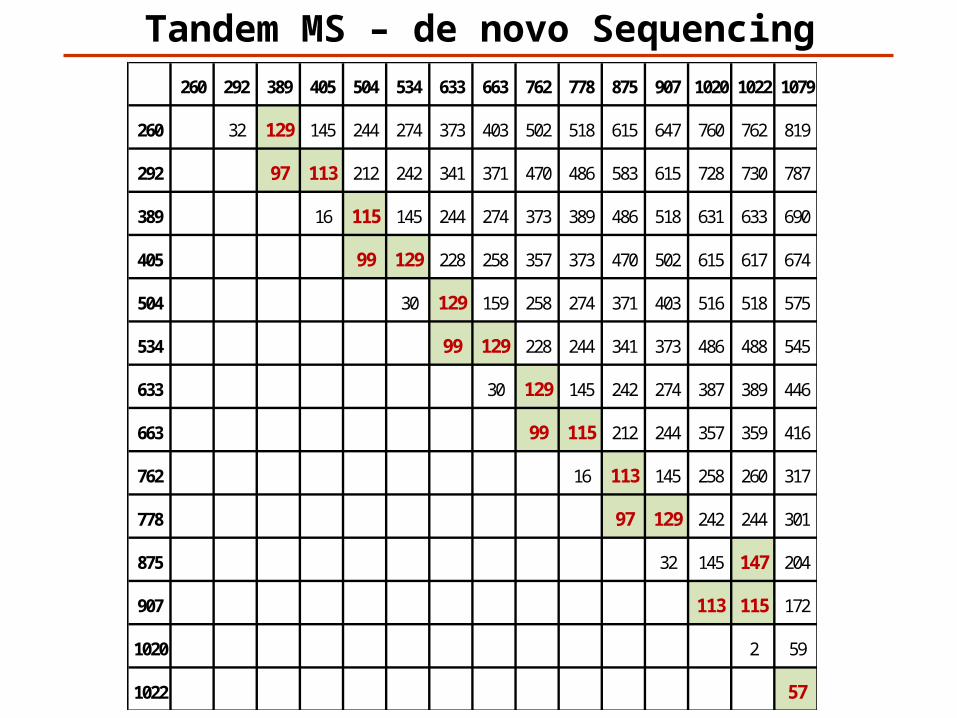
Tandem MS – de novo Sequencing260 292 389 405 504 534 633 663 762 778 875 907 1020 1022 1079
260 32 129 145 244 274 373 403 502 518 615 647 760 762 819
292 97 113 212 242 341 371 470 486 583 615 728 730 787
389 16 115 145 244 274 373 389 486 518 631 633 690
405 99 129 228 258 357 373 470 502 615 617 674
504 30 129 159 258 274 371 403 516 518 575
534 99 129 228 244 341 373 486 488 545
633 30 129 145 242 274 387 389 446
663 99 115 212 244 357 359 416
762 16 113 145 258 260 317
778 97 129 242 244 301
875 32 145 147 204
907 113 115 172
1020 2 59
1022 57
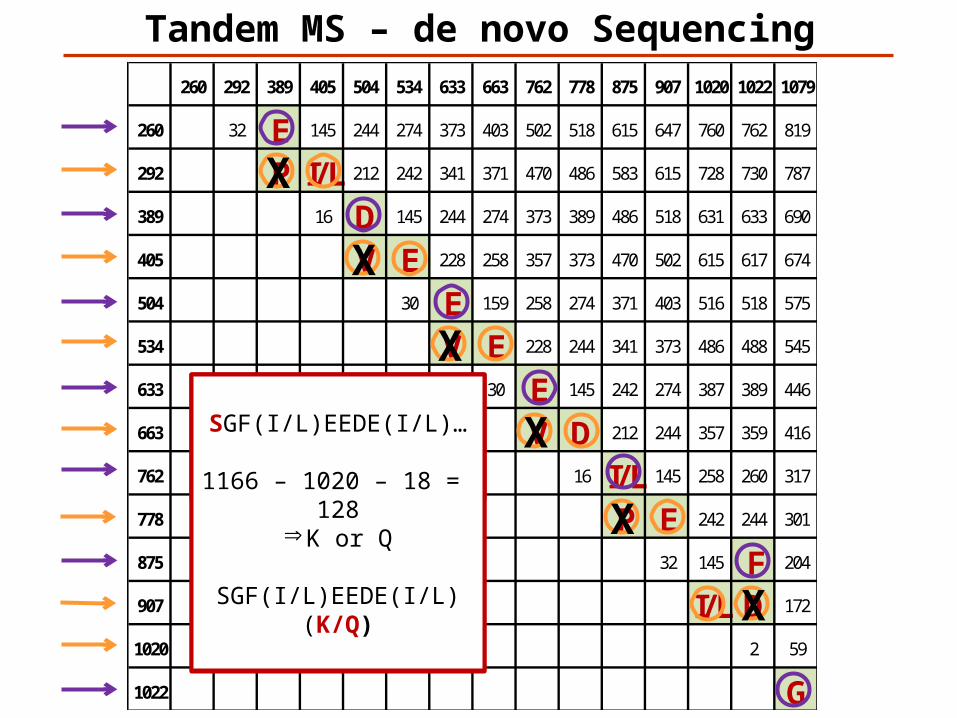
260 292 389 405 504 534 633 663 762 778 875 907 1020 1022 1079
260 32 E 145 244 274 373 403 502 518 615 647 760 762 819
292 P I/L 212 242 341 371 470 486 583 615 728 730 787
389 16 D 145 244 274 373 389 486 518 631 633 690
405 V E 228 258 357 373 470 502 615 617 674
504 30 E 159 258 274 371 403 516 518 575
534 V E 228 244 341 373 486 488 545
633 30 E 145 242 274 387 389 446
663 V D 212 244 357 359 416
762 16 I/L 145 258 260 317
778 P E 242 244 301
875 32 145 F 204
907 I/L D 172
1020 2 59
1022 G
Tandem MS – de novo Sequencing
X
X
X
X
X
X
…GF(I/L)EEDE(I/L)……(I/L)EDEE(I/L)FG……GF(I/L)EEDE(I/L)……(I/L)EDEE(I/L)FG…
Peptide M+H = 11661166 -1079 = 87 => S
SGF(I/L)EEDE(I/L)…
SGF(I/L)EEDE(I/L)…
1166 – 1020 – 18 = 128Þ K or Q
SGF(I/L)EEDE(I/L)(K/Q)
Tandem MS – de novo Sequencing
Challenges in de novo sequencing
Neutral loss (-H2O, -NH3)
Modifications
Background peaks
Incomplete information
Challenges in de novo sequencing
Neutral loss (-H2O, -NH3)
Modifications
Background peaks
Incomplete information
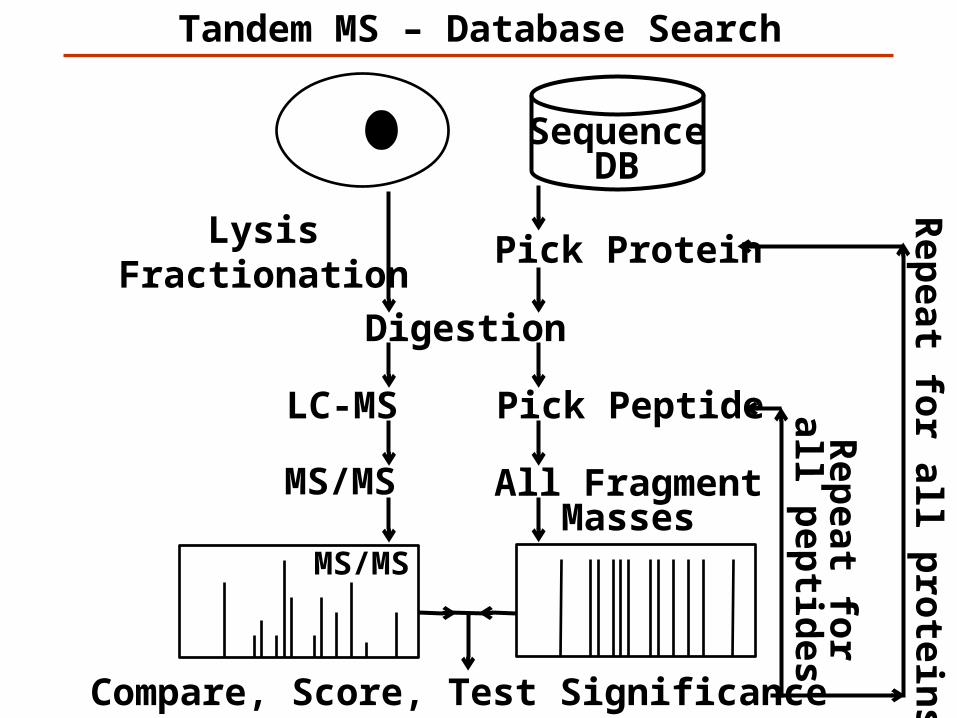
MS/MS
LysisFractionation
Tandem MS – Database Search
MS/MS
Digestion
SequenceDB
All FragmentMasses
Pick Protein
Compare, Score, Test Significance
Rep
eat for all p
rotein
s
Pick PeptideLC-MS
Rep
eat for
all pep
tides
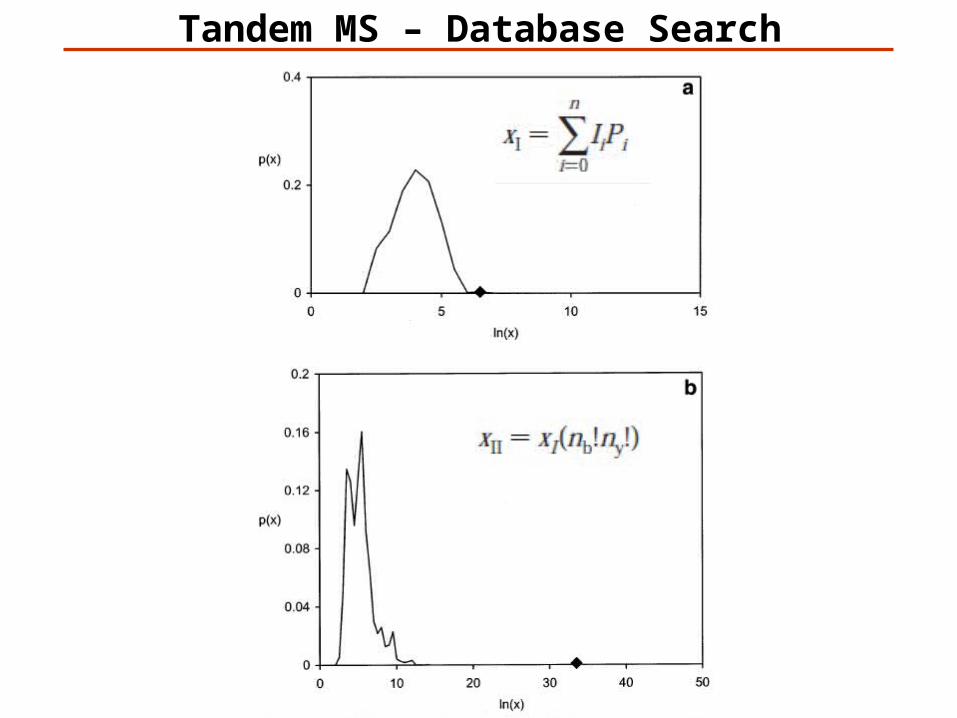
Tandem MS – Database Search
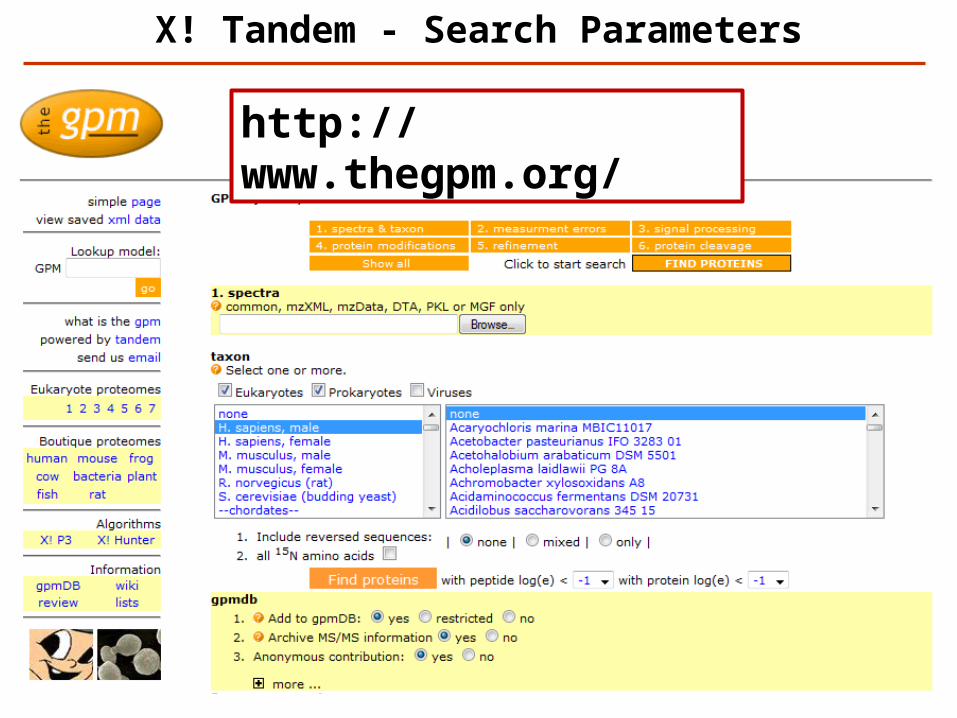
X! Tandem - Search Parameters
http://www.thegpm.org/
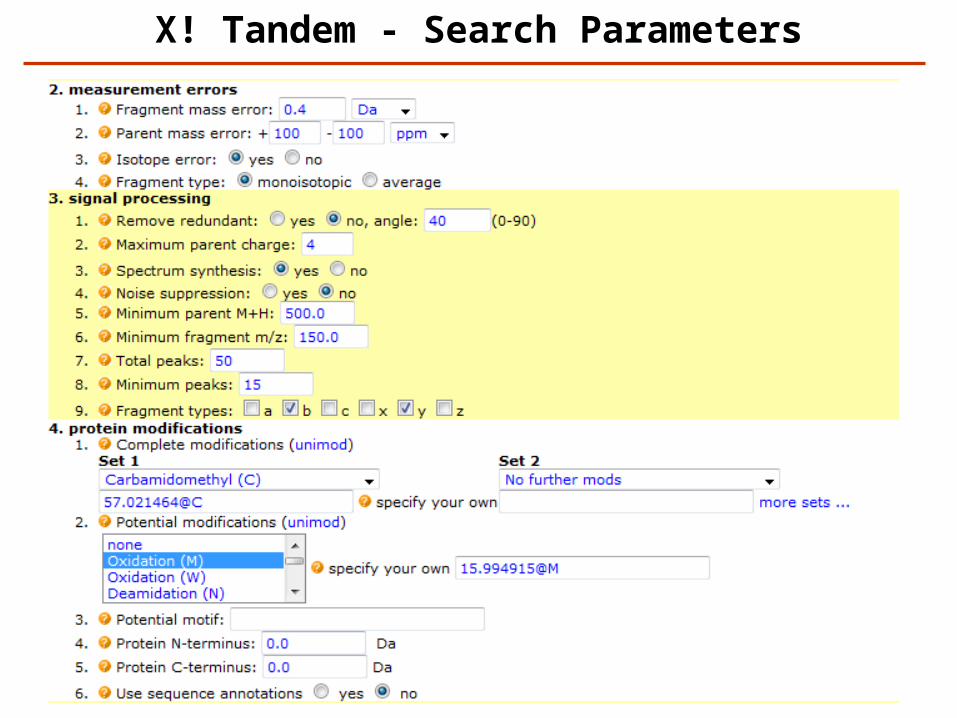
X! Tandem - Search Parameters
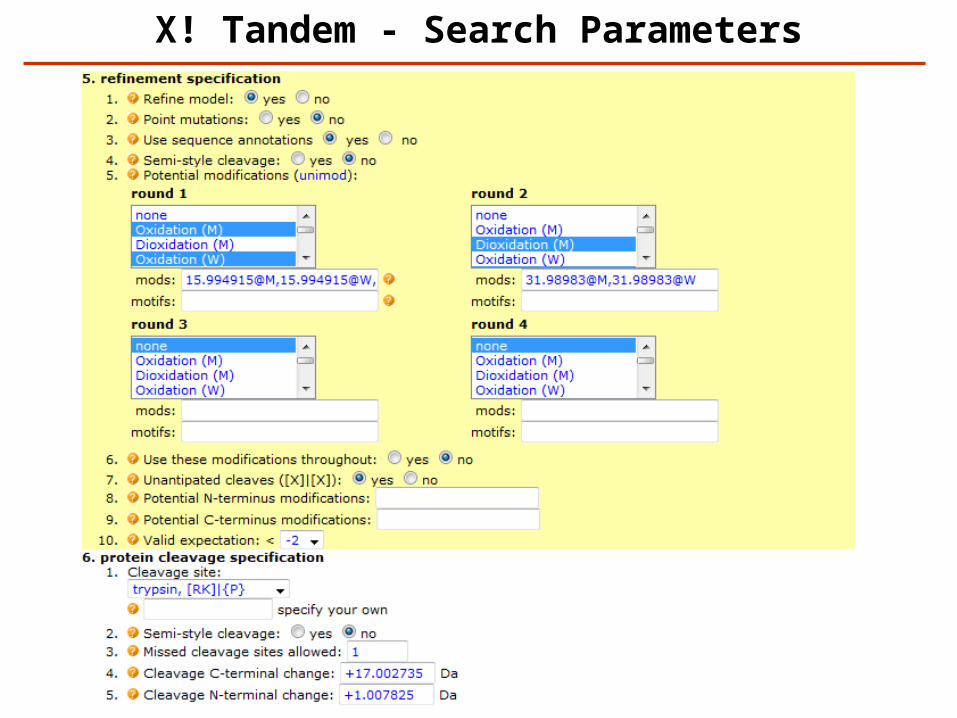
X! Tandem - Search Parameters
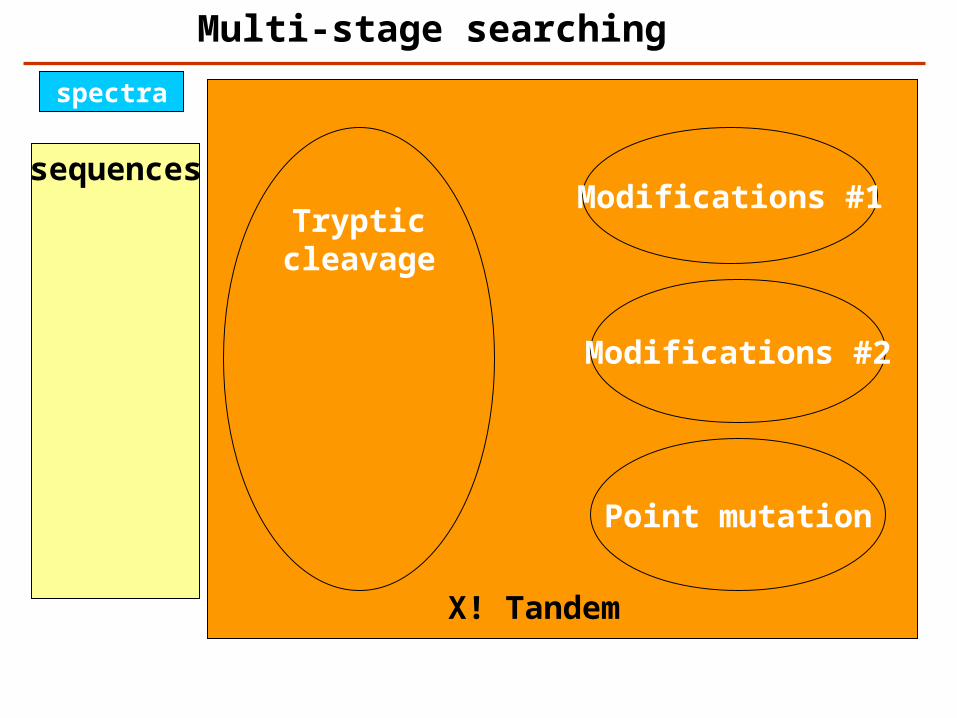
sequences
sequences
spectra
Multi-stage searching
Trypticcleavage
Modifications #1
Modifications #2
Point mutation
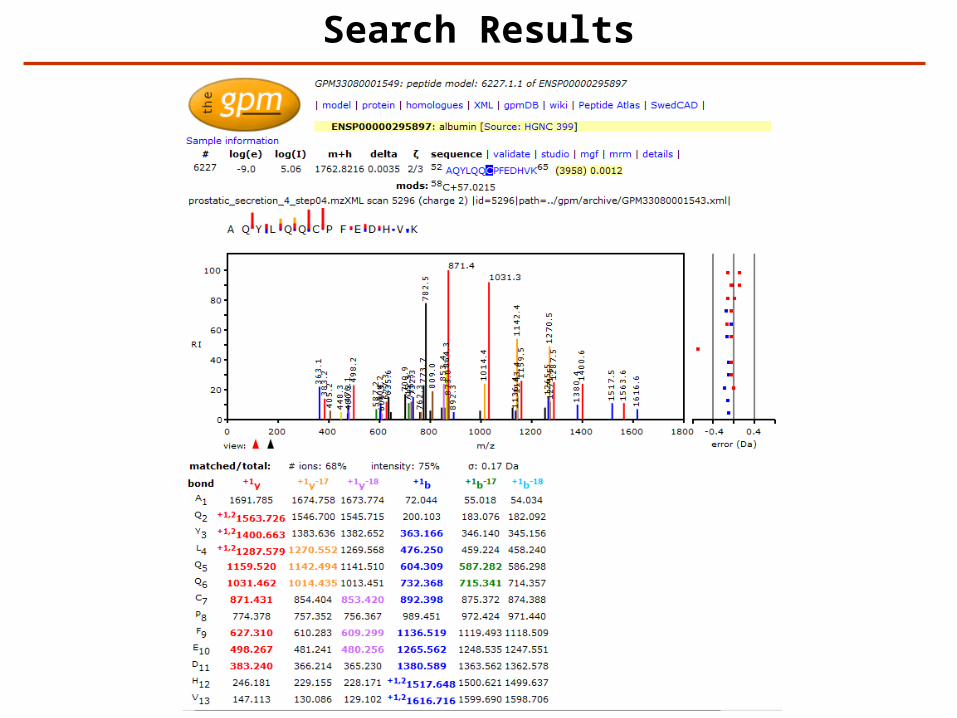
X! Tandem
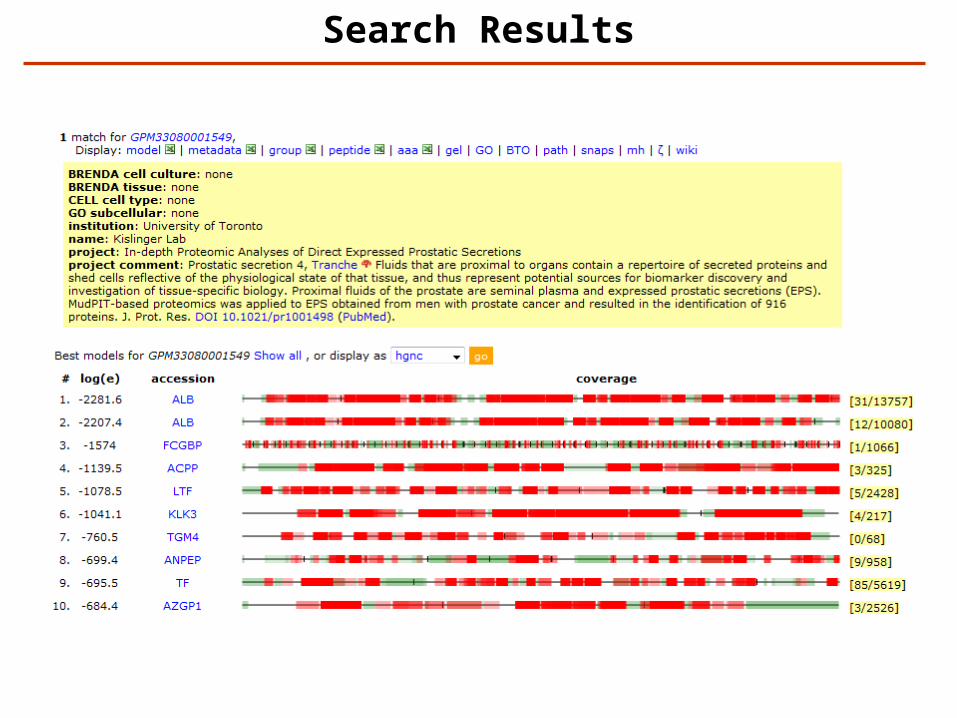
Search Results
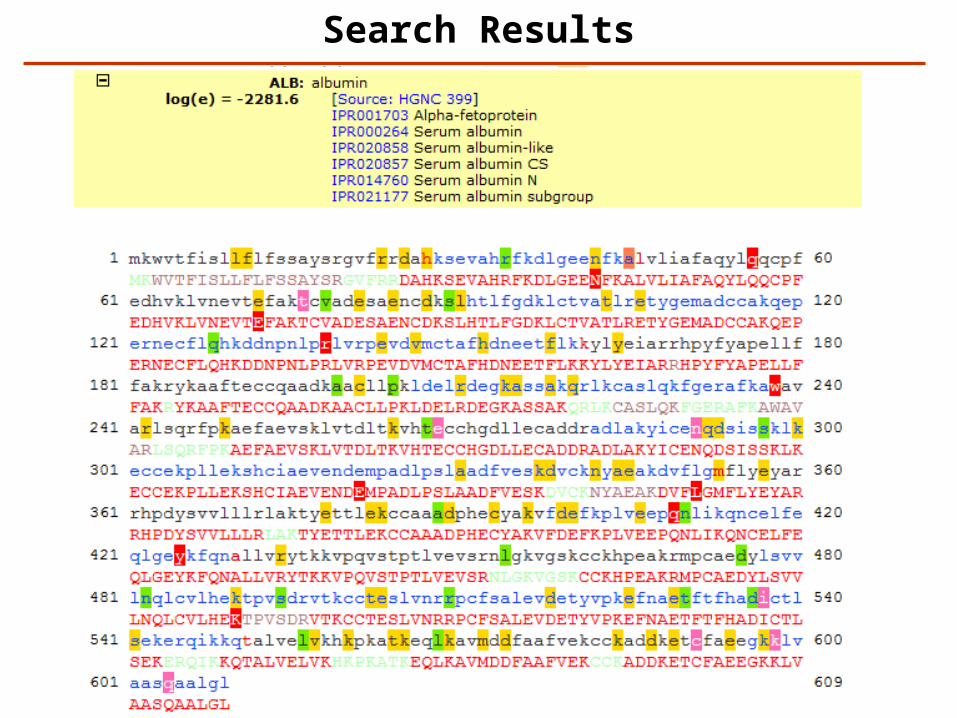
Search Results
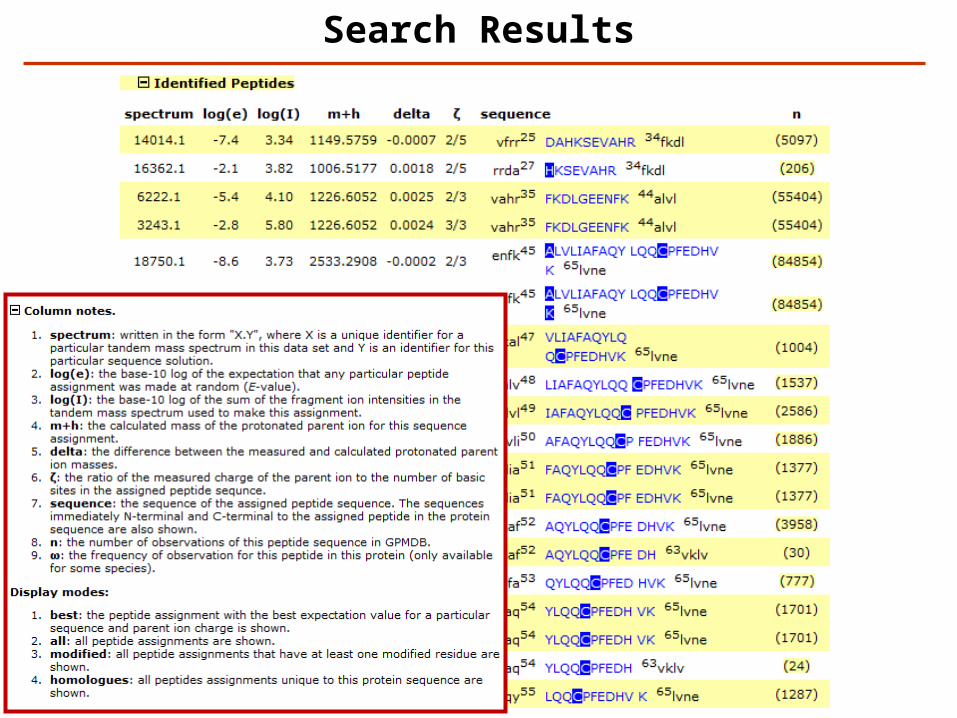
Search Results
Search Results
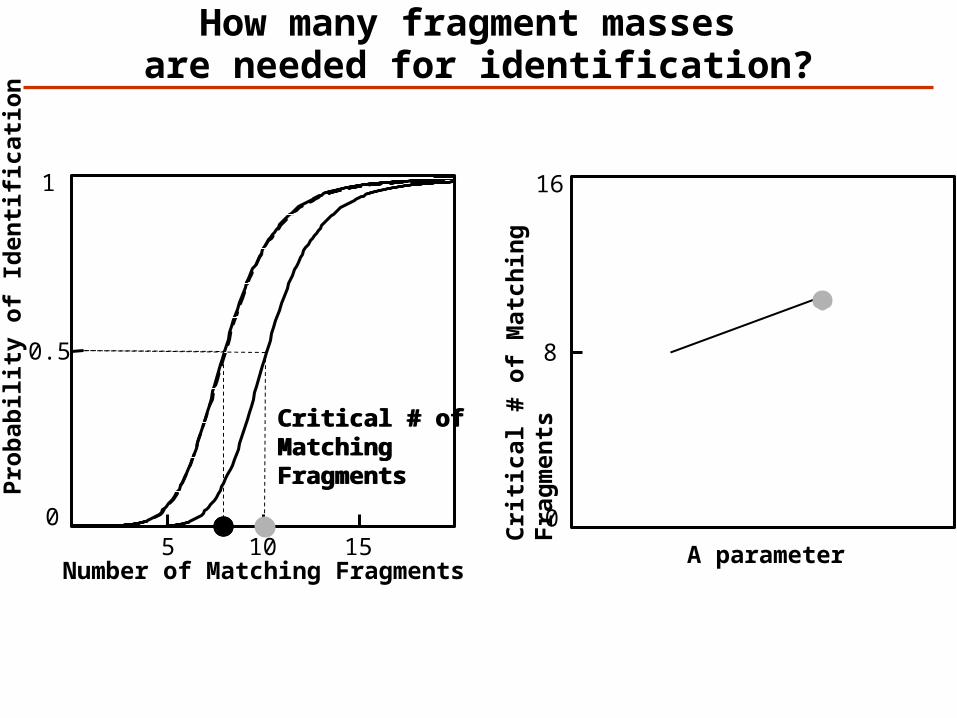
How many fragment masses are needed for identification?
1
0
0.5
5 10 15Number of Matching Fragments
Pro
bab
ilit
y o
f Id
enti
fica
tio
n
Critical # ofMatching Fragments
16
0
8
A parameter
Cri
tica
l #
of
Mat
chin
g F
rag
men
ts
Critical # ofMatching Fragments
0
0.2
0.4
0.6
0.8
1
1.2
0 5 10 15 20
Pro
ba
bili
ty o
f Id
en
tifi
ca
tio
n
Number of fragment ions
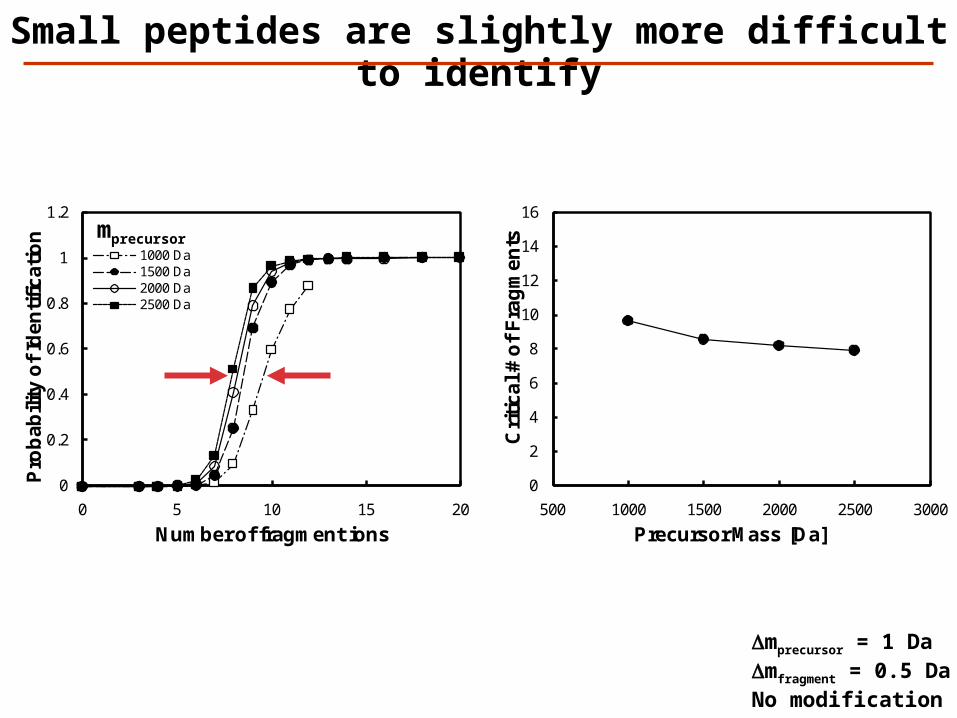
1000 Da1500 Da2000 Da2500 Da
Small peptides are slightly more difficult to identify
Dmprecursor = 1 DaDmfragment = 0.5 DaNo modification
mprecursor
0
2
4
6
8
10
12
14
16
500 1000 1500 2000 2500 3000C
riti
ca
l #
of
Fra
gm
en
tsPrecursor Mass [Da]
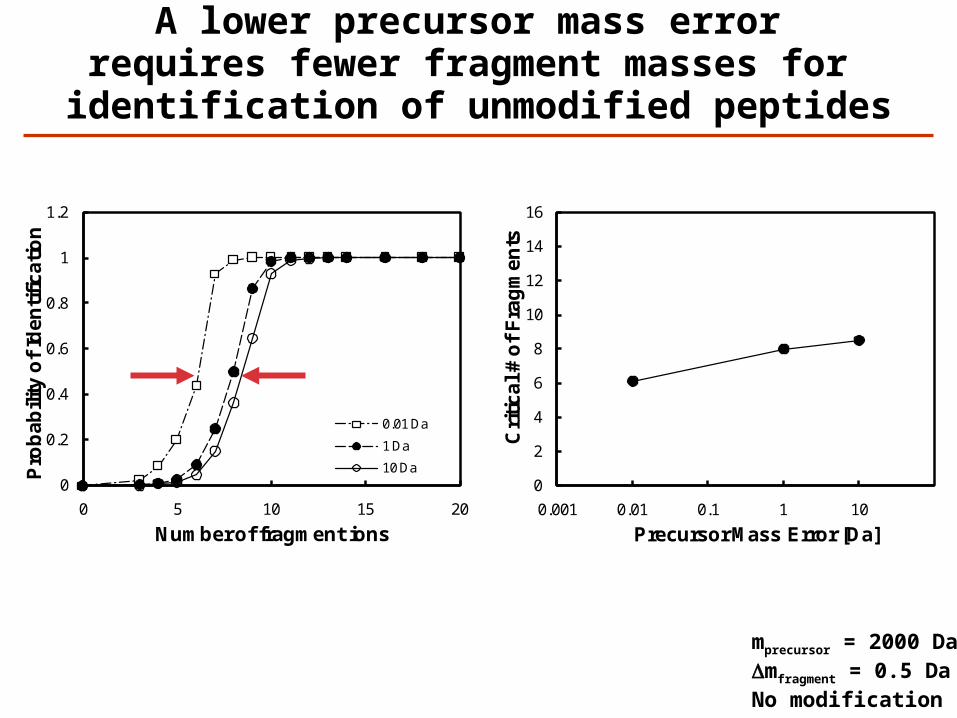
A lower precursor mass error requires fewer fragment masses for identification of unmodified peptides
0
0.2
0.4
0.6
0.8
1
1.2
0 5 10 15 20
Pro
ba
bili
ty o
f Id
en
tifi
ca
tio
n
Number of fragment ions
0.01 Da
1 Da
10 Da
mprecursor = 2000 DaDmfragment = 0.5 DaNo modification
0
2
4
6
8
10
12
14
16
0.001 0.01 0.1 1 10C
riti
ca
l #
of
Fra
gm
en
tsPrecursor Mass Error [Da]
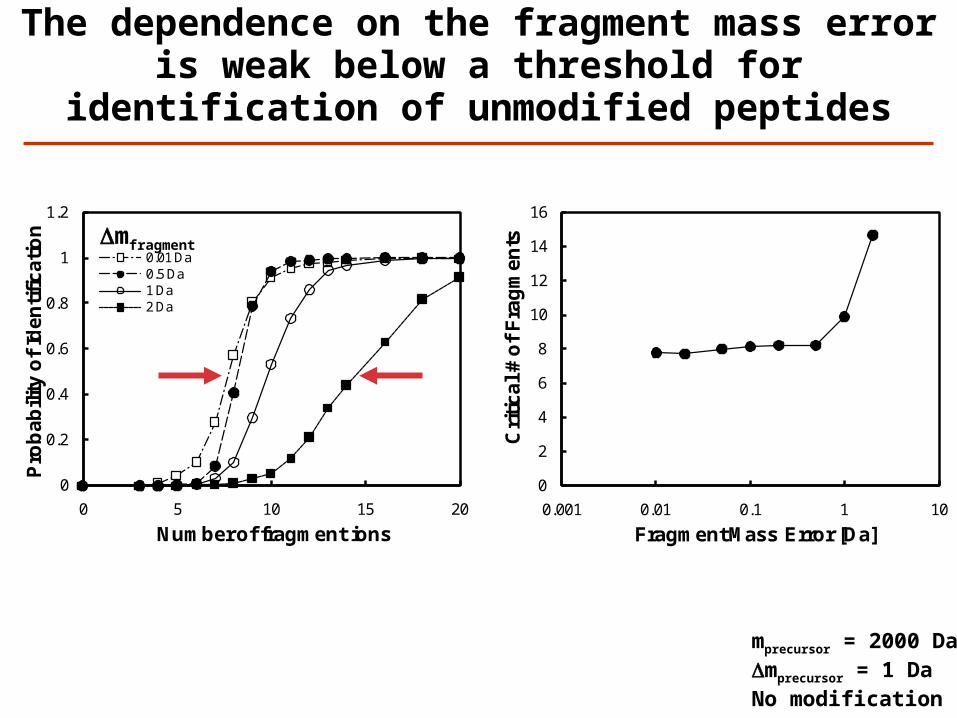
0
0.2
0.4
0.6
0.8
1
1.2
0 5 10 15 20
Pro
ba
bili
ty o
f Id
en
tifi
ca
tio
n
Number of fragment ions
0.01 Da0.5 Da1 Da2 Da
The dependence on the fragment mass error is weak below a threshold for identification
of unmodified peptides
Dmfragment
mprecursor = 2000 DaDmprecursor = 1 DaNo modification
0
2
4
6
8
10
12
14
16
0.001 0.01 0.1 1 10C
riti
ca
l #
of
Fra
gm
en
tsFragment Mass Error [Da]
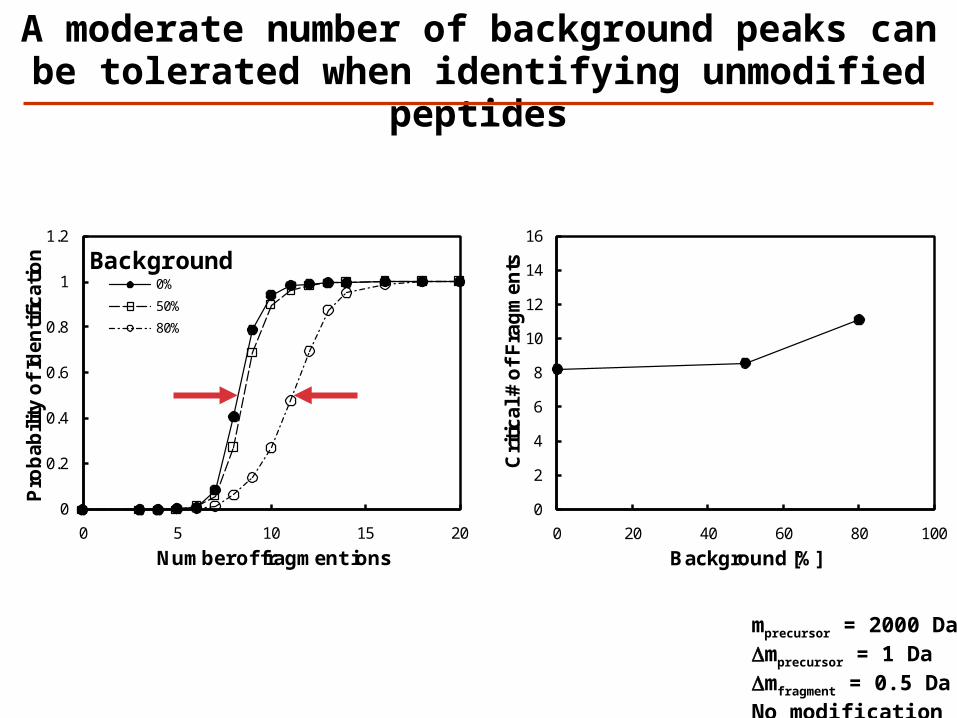
0
0.2
0.4
0.6
0.8
1
1.2
0 5 10 15 20
Pro
ba
bili
ty o
f Id
en
tifi
ca
tio
n
Number of fragment ions
0%
50%
80%
A moderate number of background peaks can be tolerated when identifying
unmodified peptides
mprecursor = 2000 DaDmprecursor = 1 DaDmfragment = 0.5 DaNo modification
Background
0
2
4
6
8
10
12
14
16
0 20 40 60 80 100C
riti
ca
l #
of
Fra
gm
en
ts
Background [%]
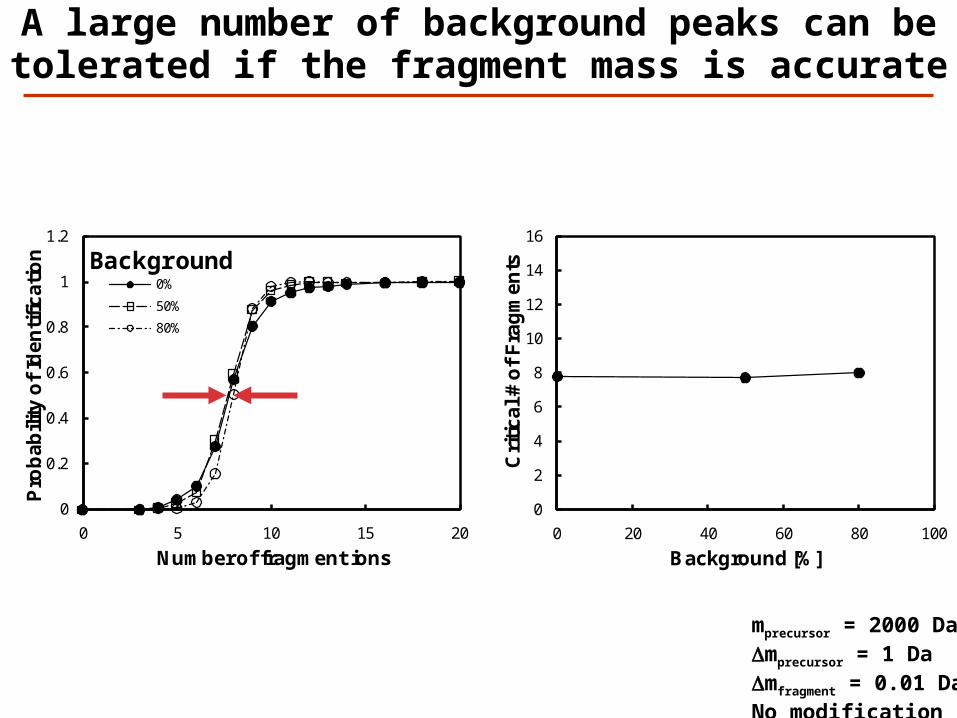
A large number of background peaks can be tolerated if the fragment mass is accurate
mprecursor = 2000 DaDmprecursor = 1 DaDmfragment = 0.01 DaNo modification
0
0.2
0.4
0.6
0.8
1
1.2
0 5 10 15 20
Pro
ba
bili
ty o
f Id
en
tifi
ca
tio
n
Number of fragment ions
0%
50%
80%
0
2
4
6
8
10
12
14
16
0 20 40 60 80 100C
riti
ca
l #
of
Fra
gm
en
ts
Background [%]
Background
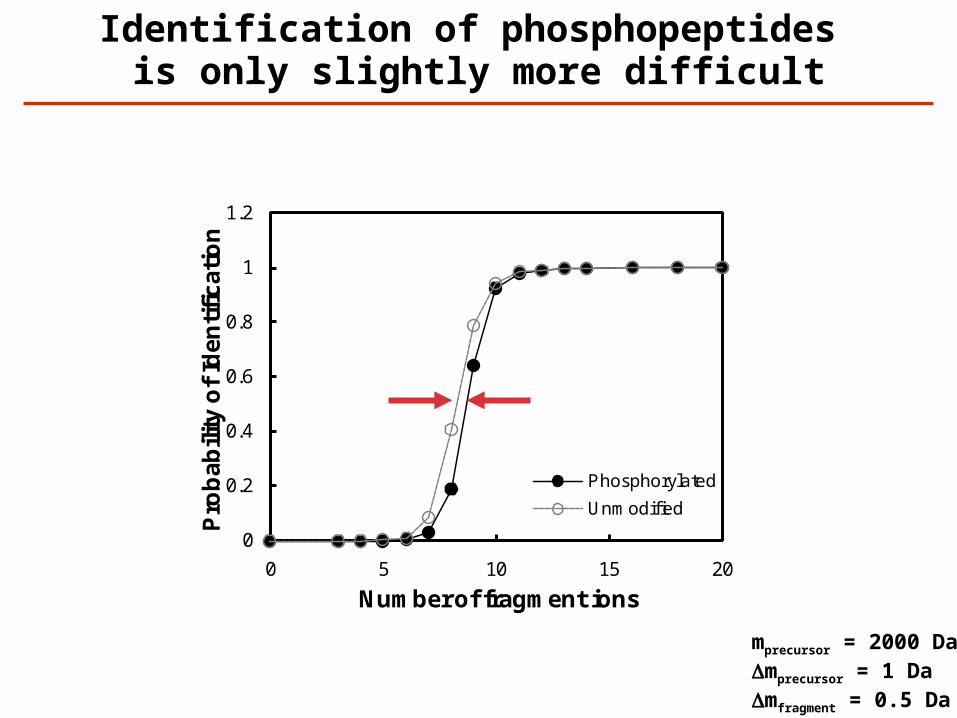
0
0.2
0.4
0.6
0.8
1
1.2
0 5 10 15 20
Pro
ba
bili
ty o
f Id
en
tifi
ca
tio
n
Number of fragment ions
Phosphorylated
Unmodified
Identification of phosphopeptides is only slightly more difficult
mprecursor = 2000 DaDmprecursor = 1 DaDmfragment = 0.5 Da
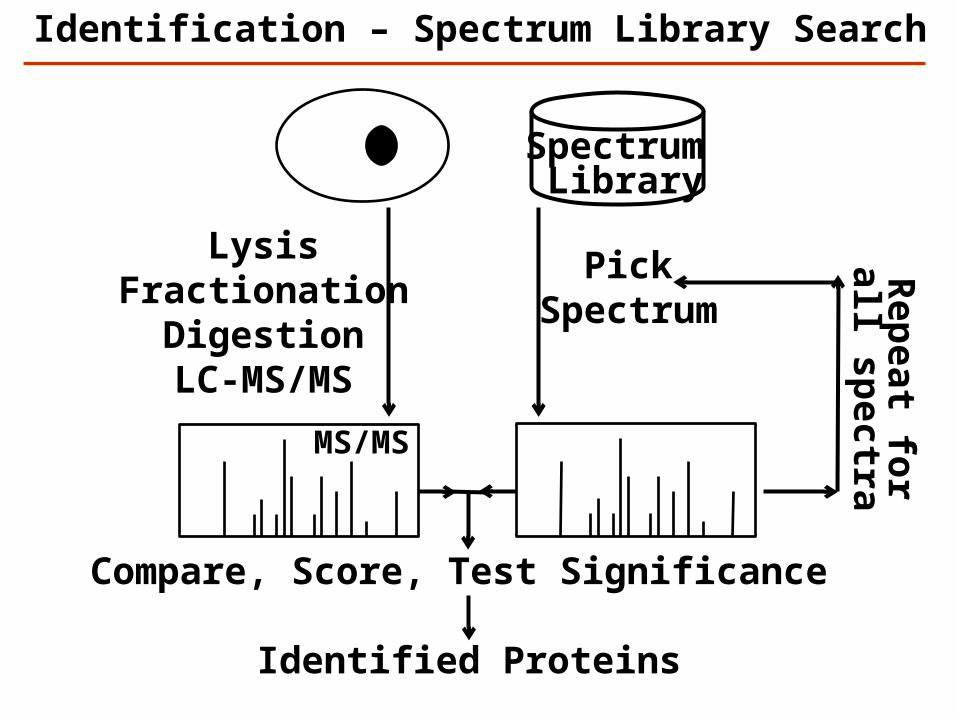
LysisFractionation
DigestionLC-MS/MS
Identification – Spectrum Library Search
MS/MS
Spectrum Library
PickSpectrum
Compare, Score, Test Significance
Rep
eat for
all spectra
Identified Proteins
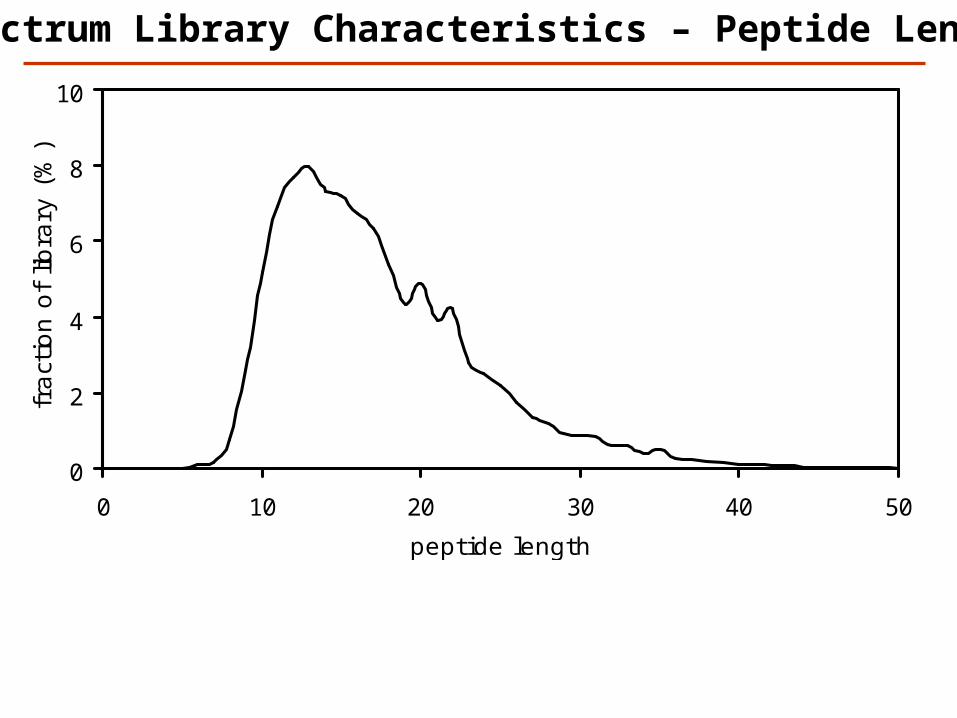
0
2
4
6
8
10
0 10 20 30 40 50
peptide length
fract
ion o
f lib
rary
(%
)Spectrum Library Characteristics – Peptide Length
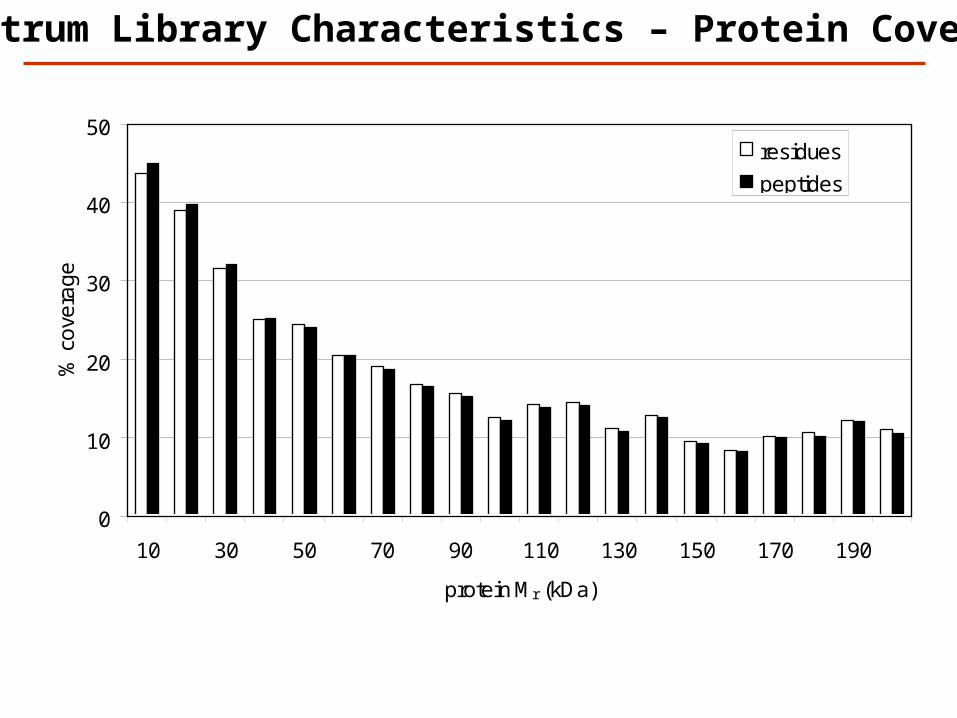
0
10
20
30
40
50
10 30 50 70 90 110 130 150 170 190
protein Mr (kDa)
% c
ove
rag
e
residues
peptides
Spectrum Library Characteristics – Protein Coverage
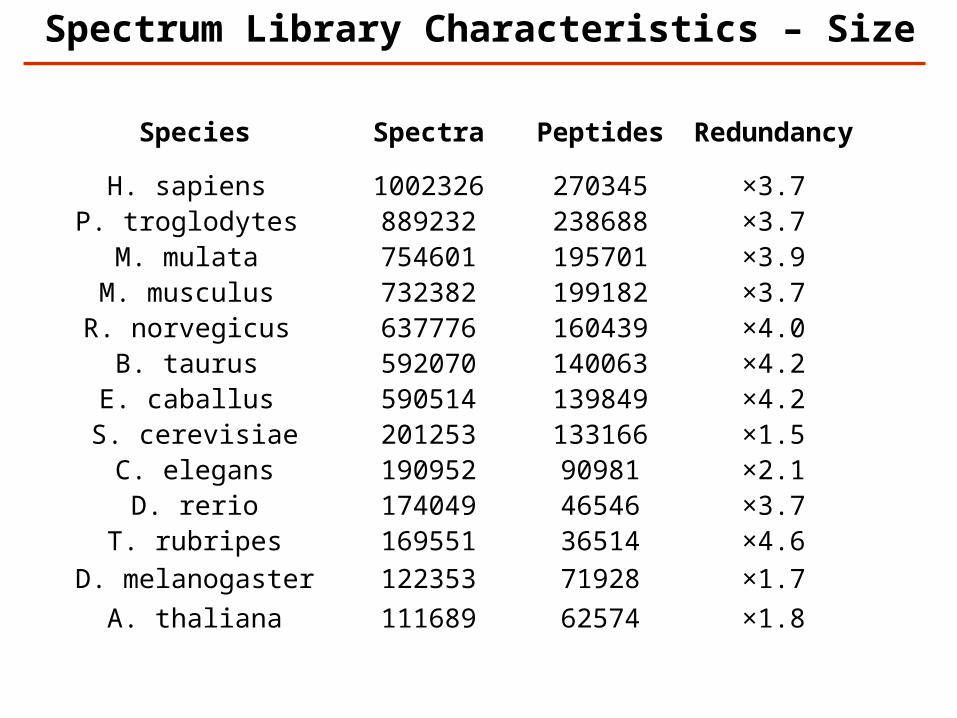
Spectrum Library Characteristics – Size
Species Spectra Peptides Redundancy
H. sapiens 1002326 270345 ×3.7P. troglodytes 889232 238688 ×3.7
M. mulata 754601 195701 ×3.9M. musculus 732382 199182 ×3.7R. norvegicus 637776 160439 ×4.0
B. taurus 592070 140063 ×4.2E. caballus 590514 139849 ×4.2
S. cerevisiae 201253 133166 ×1.5C. elegans 190952 90981 ×2.1
D. rerio 174049 46546 ×3.7T. rubripes 169551 36514 ×4.6
D. melanogaster 122353 71928 ×1.7A. thaliana 111689 62574 ×1.8
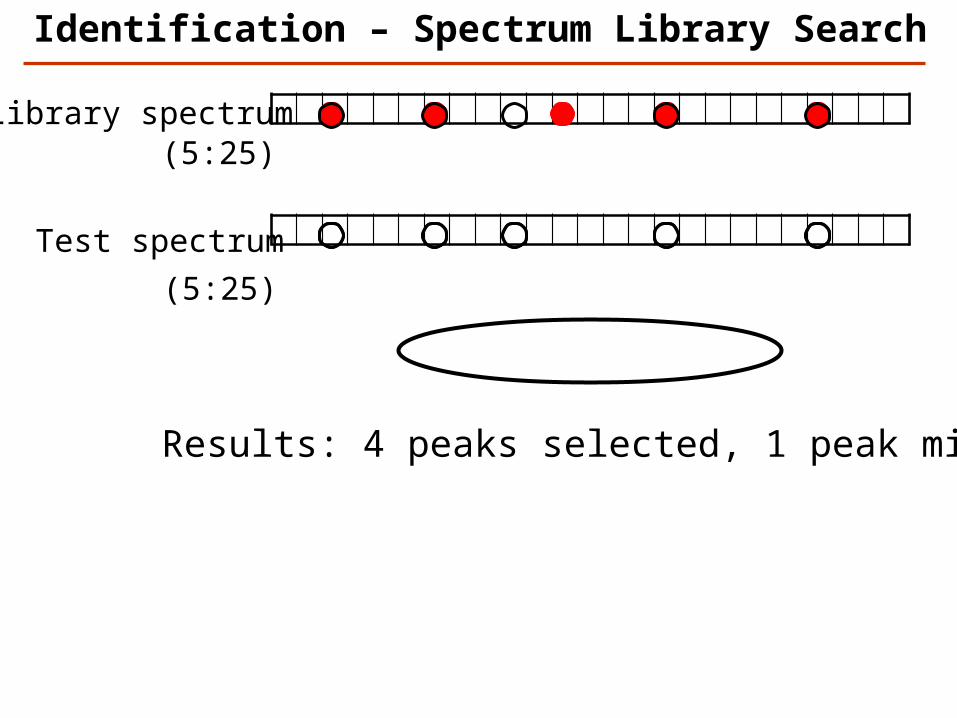
Library spectrum
Test spectrum
(5:25)
(5:25)
Results: 4 peaks selected, 1 peak missed
Identification – Spectrum Library Search
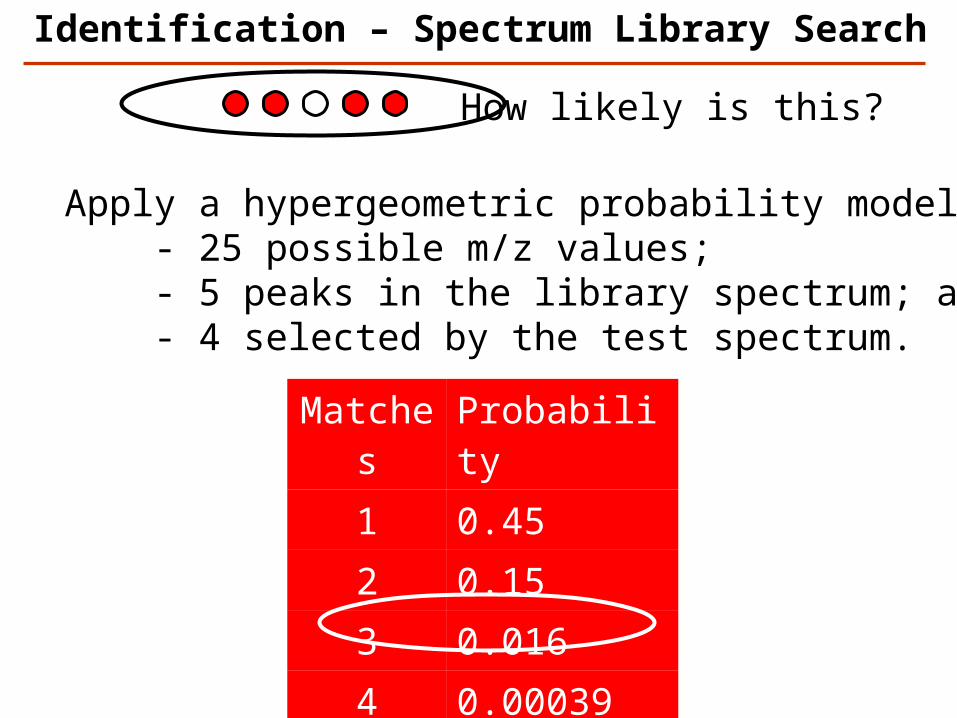
Matches Probability
1 0.452 0.153 0.0164 0.000395 0.0000037
Apply a hypergeometric probability model: - 25 possible m/z values; - 5 peaks in the library spectrum; and - 4 selected by the test spectrum.
How likely is this?
Identification – Spectrum Library Search
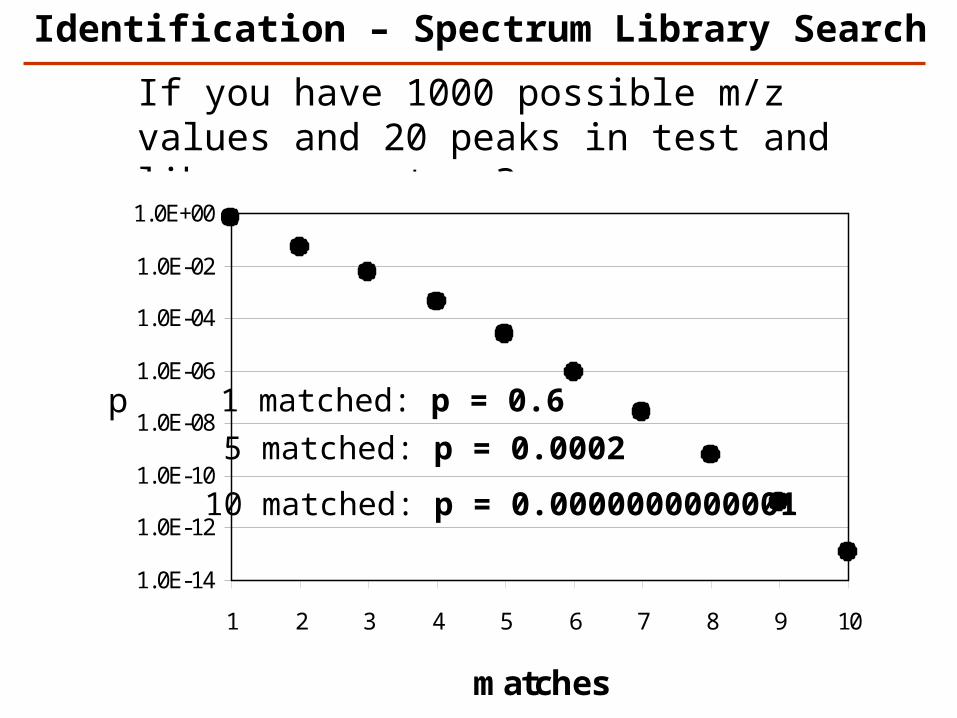
If you have 1000 possible m/z values and 20 peaks in test and library spectrum?
1.0E-14
1.0E-12
1.0E-10
1.0E-08
1.0E-06
1.0E-04
1.0E-02
1.0E+00
1 2 3 4 5 6 7 8 9 10
matches
p 1 matched: p = 0.6
5 matched: p = 0.0002
10 matched: p = 0.0000000000001
Identification – Spectrum Library Search
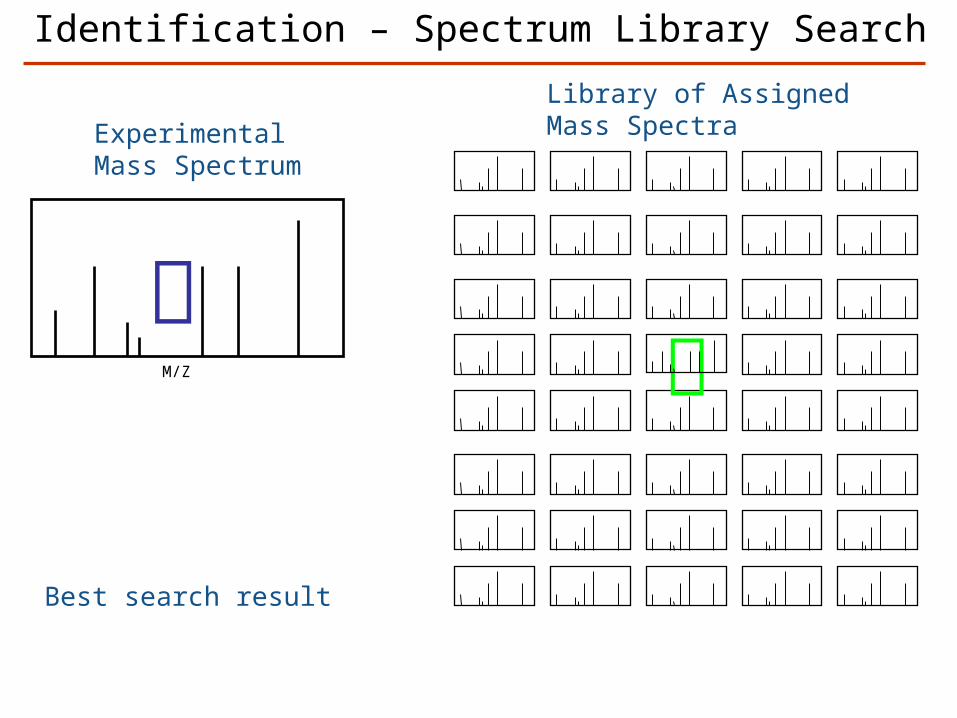
ExperimentalMass Spectrum
Library of AssignedMass Spectra
M/Z
Best search result
Identification – Spectrum Library Search
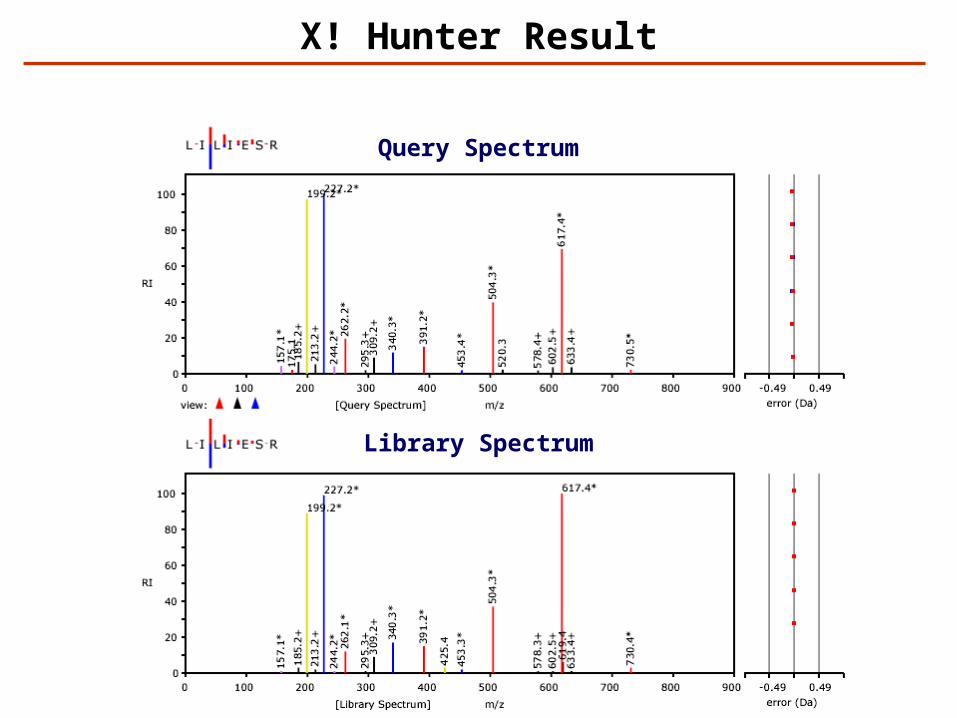
X! Hunter Result
Query Spectrum
Library Spectrum
Significance Testing
False protein identification is caused by random matching
An objective criterion for testing the significance of protein identification results is necessary.
The significance of protein identifications can be tested once the distribution of scores for false results is known.
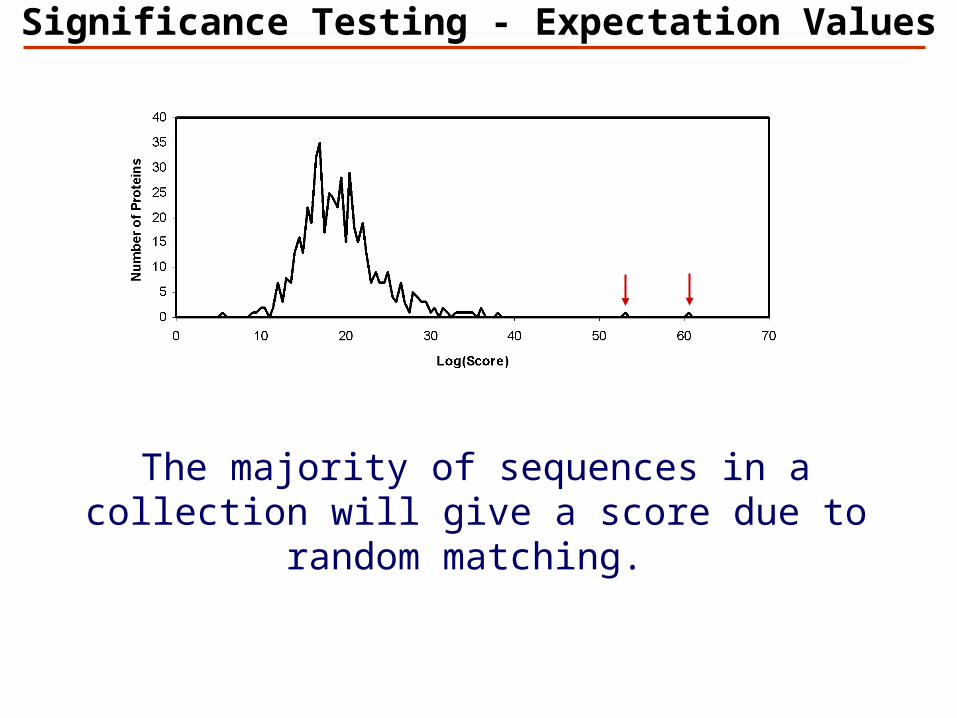
Significance Testing - Expectation Values
The majority of sequences in a collection will give a score due to random matching.
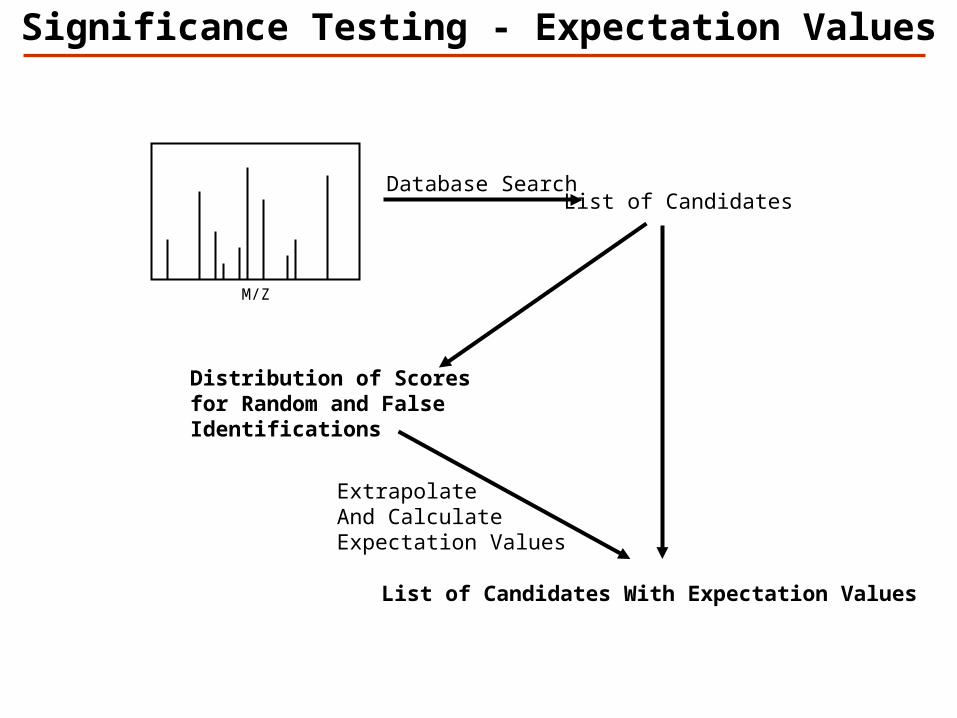
Database Search
M/Z
List of Candidates
ExtrapolateAnd Calculate Expectation Values
List of Candidates With Expectation Values
Distribution of Scoresfor Random and False Identifications
Significance Testing - Expectation Values
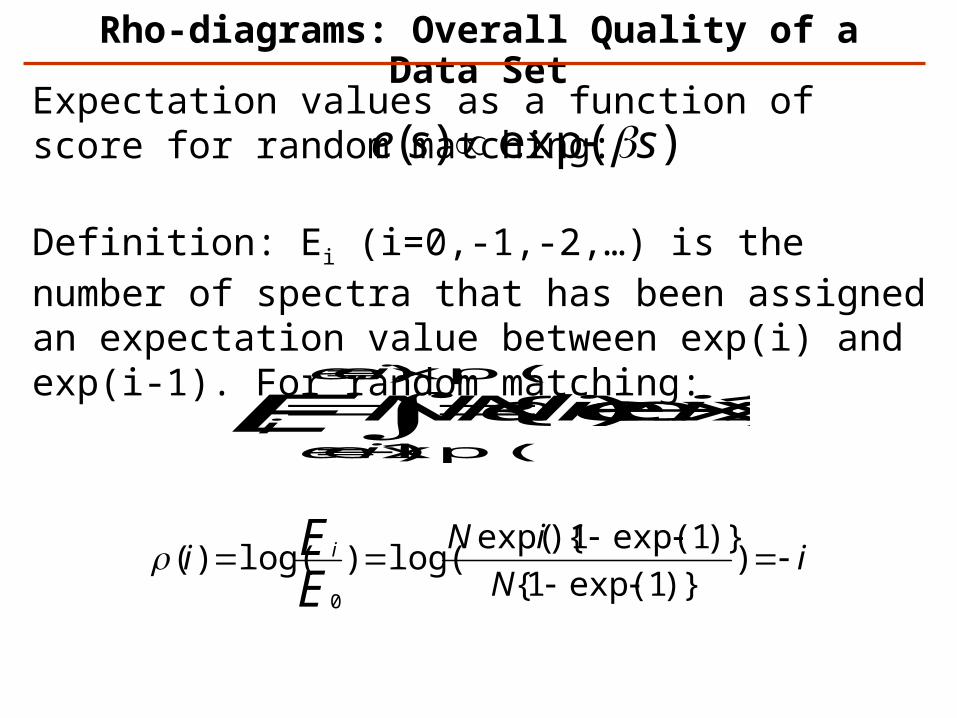
Rho-diagrams: Overall Quality of a Data Set
)exp()( sse
iN
iNi
EE i
))}1exp(1{
)}1exp(1){exp(log()log()(
0
)}1exp(){exp()exp(
)1exp(
iiNNdeie
ieiE
Definition: Ei (i=0,-1,-2,…) is the number of spectra that has been assigned an expectation value between exp(i) and exp(i-1). For random matching:
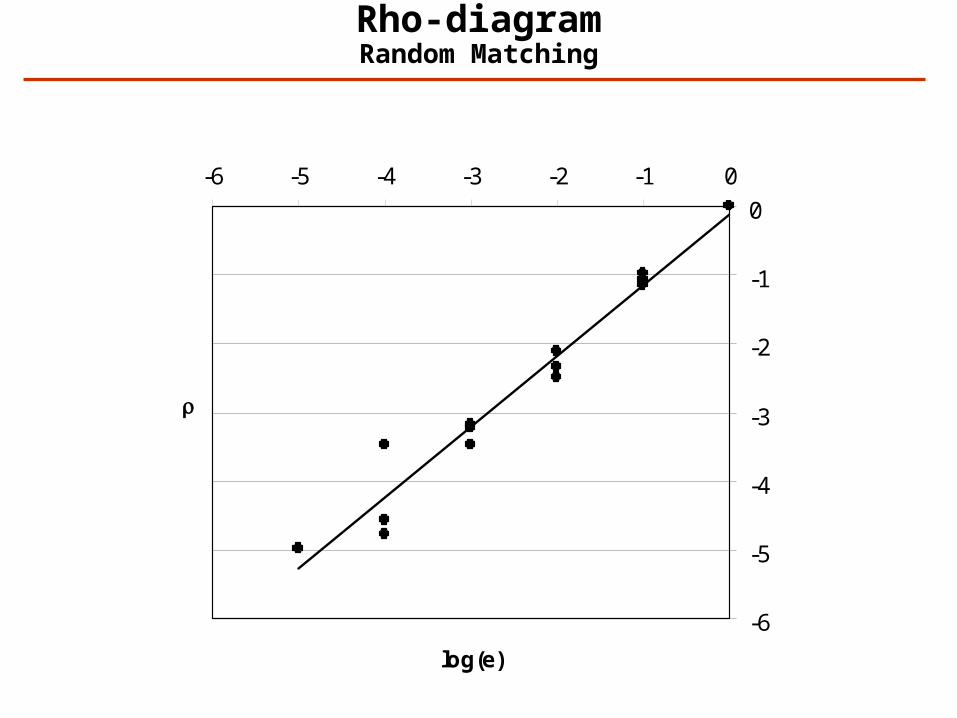
Expectation values as a function of score for random matching:
-6
-5
-4
-3
-2
-1
0
-6 -5 -4 -3 -2 -1 0
log(e)
Rho-diagramRandom Matching
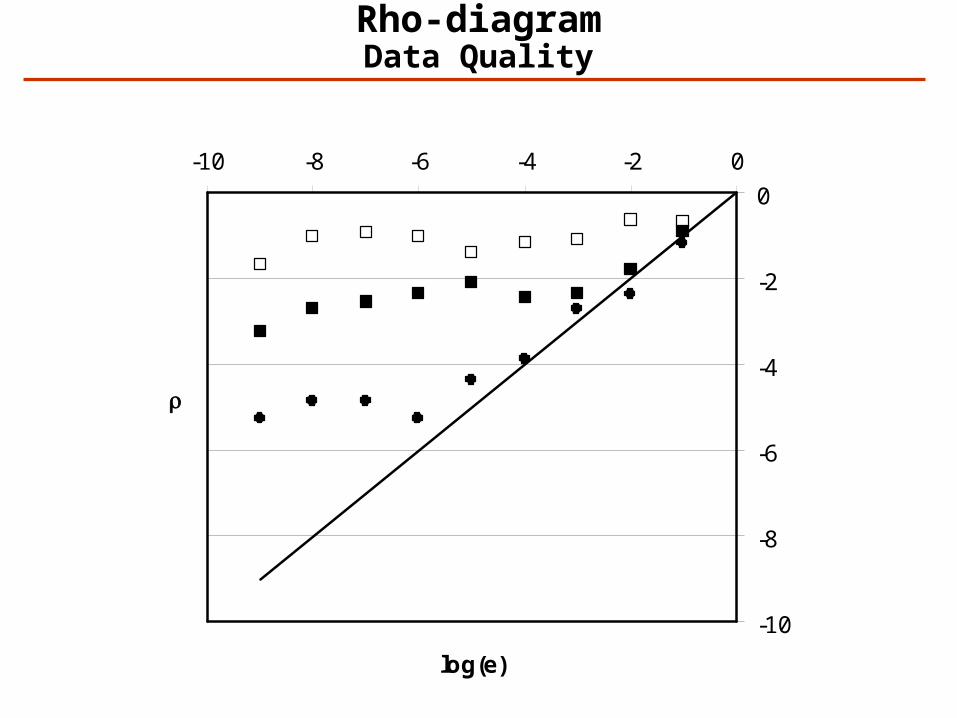
Rho-diagramData Quality
-10
-8
-6
-4
-2
0
-10 -8 -6 -4 -2 0
log(e)
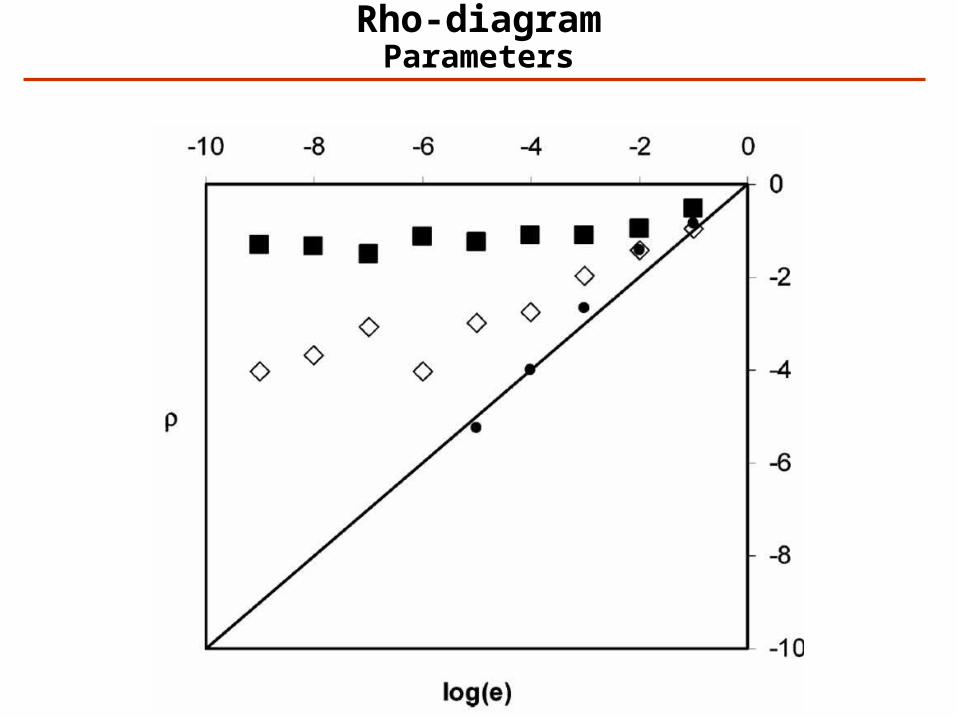
Rho-diagramParameters
Summary
Protein identification strategies:- de Novo Sequencing- Searching Sequence Collections- Searching Spectrum Libraries
It is important to report the significance of the results
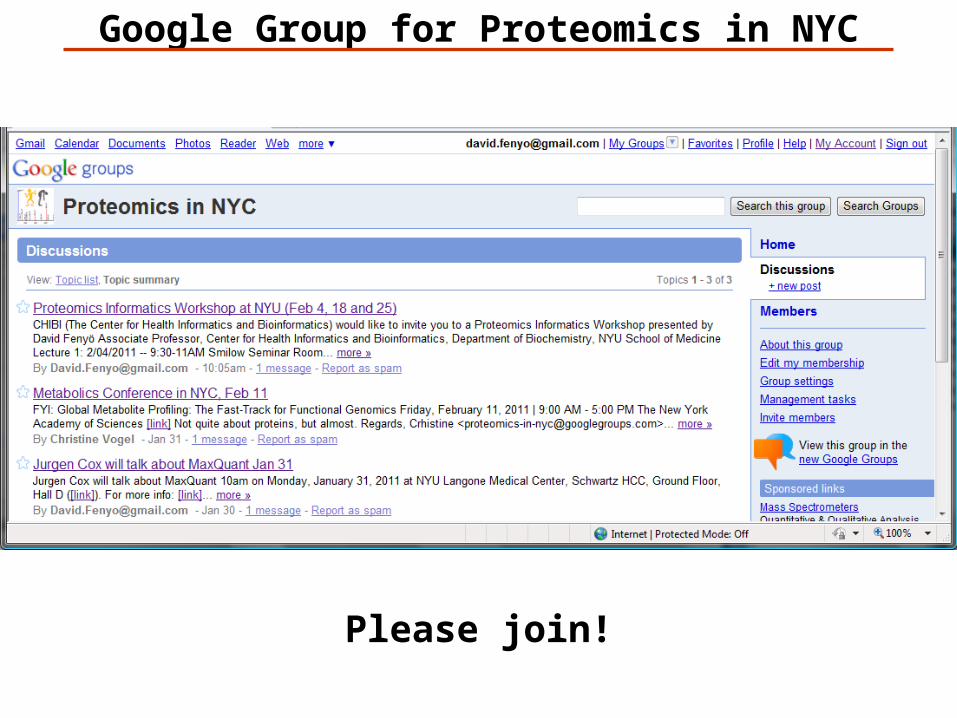
Google Group for Proteomics in NYC
Please join!
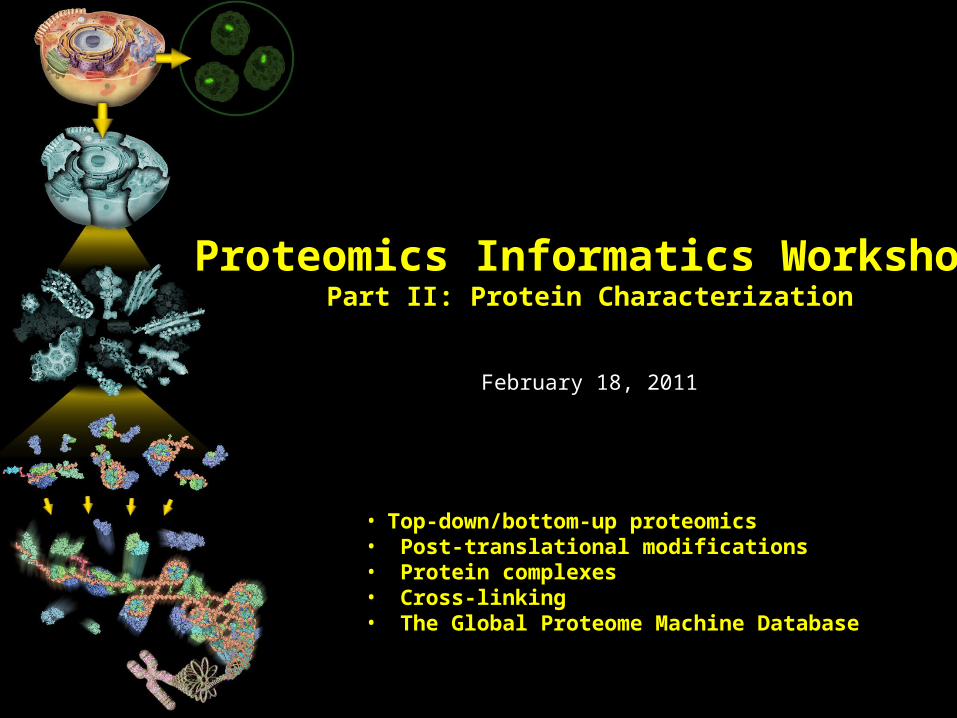
Proteomics Informatics WorkshopPart II: Protein Characterization
February 18, 2011
• Top-down/bottom-up proteomics• Post-translational modifications• Protein complexes• Cross-linking• The Global Proteome Machine Database
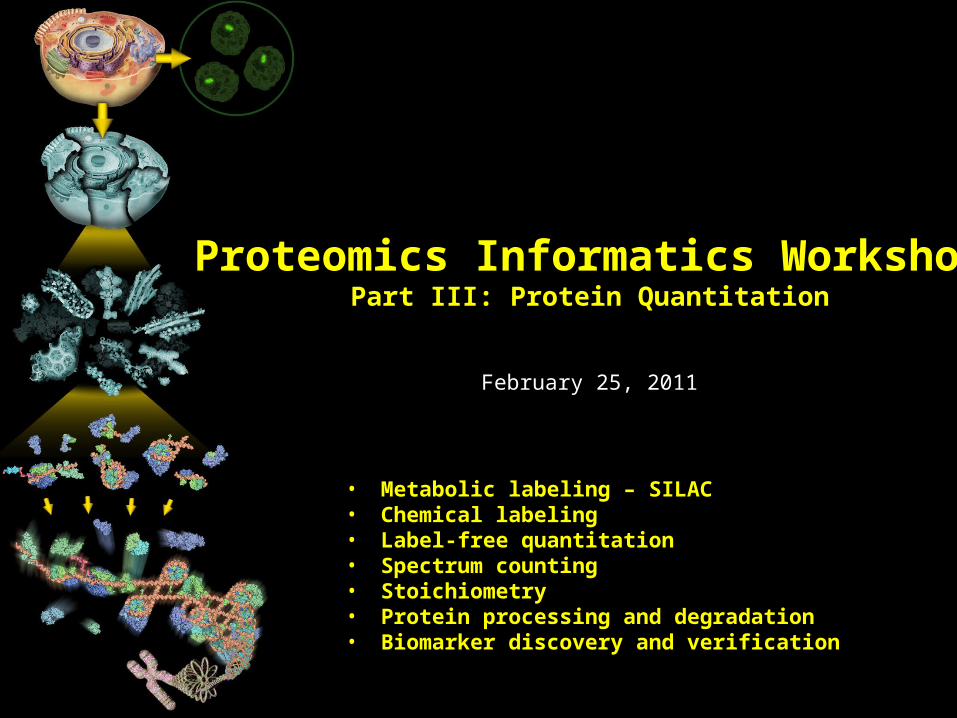
Proteomics Informatics WorkshopPart III: Protein Quantitation
February 25, 2011
• Metabolic labeling – SILAC• Chemical labeling• Label-free quantitation• Spectrum counting• Stoichiometry• Protein processing and degradation• Biomarker discovery and verification
Proteomics Informatics Workshop
Part I: Protein Identification, February 4, 2011
Part II: Protein Characterization, February 18, 2011
Part III: Protein Quantitation, February 25, 2011