proposal for a modification of the (u*, v*, w*) system
TRANSCRIPT
840 L E T T E R S T O T H E E D I T O R Vol. 57
Proposal for a Modification of the (U*, V*, W*) System
RYUICHI HIOKI AND MASAKO SATO Department of Applied Physics, Faculty of Engineering,
University of Tokyo, Tokyo, Japan (Received 27 December 1966)
INDEX HEADINGS: Color; Colorimetry.
WYSZECKF1 proposed the (U*,V*,W*) system as a visually uniform color coordinate system based upon simple
mathematical formulas. In 1964, the Commission Internationale de I'Eclairage (CIE)2 recommended provisionally the use of the (U*,V*,W*) system—that is, the 1964 CIE-UCS system—whenever a three-dimensional spacing perceptually more uniform than that provided by the (X,Y,Z) system is desired.
The recommended coordinate system is formed in rectangular coordinates by employing the following transformation in terms of the tristimulus values X, Y, Z:
where u and v are defined as
and 0 and v0 are values of these variables for the nominally achromatic color placed at the origin of the (U*,V*) chromatic-ness-scale diagram.
Wyszecki3 reported that in a field trial the 1964 CIE color-difference formula1,2 based on the (U*,V*,W*) system predicted observed color differences ranging from about 4 to about 60 CIE units, with reasonable accuracy. However, results of checking the (U*,V*,W*) system against equal visual intervals have not yet been reported in detail.
As a preliminary to such an investigation, we have attempted to examine the (U*,V*,W*) system with respect to equal lightness intervals and the apparent change in saturation due to change in lightness when the chromaticness indexes U* and V* are kept constant. The Munsell renotation system4 has been adopted as the criterion of checking, because it was designed specifically to show equal visual intervals and seems to be widely regarded as exhibiting approximately equispaced visual scales.
In an attempt to examine the lightness index with respect to equal visual intervals, the root-mean-square deviation from the Munsell value criterion has been calculated for Munsell values from 1.0 to 9.0 using 1.0 value increments. The smaller the root-mean-square deviation, the closer the lightness index approximates the criterion, within the range of values specified. The result has been represented in Munsell value steps and then compared with the general mean of the value limen, which is found to be 0.021 Munsell value steps, with a range of 0.002-0.049 according to the data reported by Bellamy and Newhall.&
The lightness index shows a root-mean-square deviation of 0.046 Munsell value steps, which is about two times the size of the general mean oî the value limen but is within the range oî the individual differences in the limen. This result suggests that the lightness index approximates the Munsell value criterion in the practically important range of value with less than a perceptually significant root-mean-square deviation; thus it may be stated that, from a practical point of view, Eq. (1) is in excellent agreement with the Munsell value function.
As to the (U*,V*) chromaticness-scale diagram which is produced by the chromaticness indices defined by Eqs. (2a) and (2b), the diagram seems to indicate excessive changes of saturation due to changes of lightness; those changes are referred to hereafter as the value effect. A new color coordinate system which reduces the overadjustment for the "value effect" has been formulated.
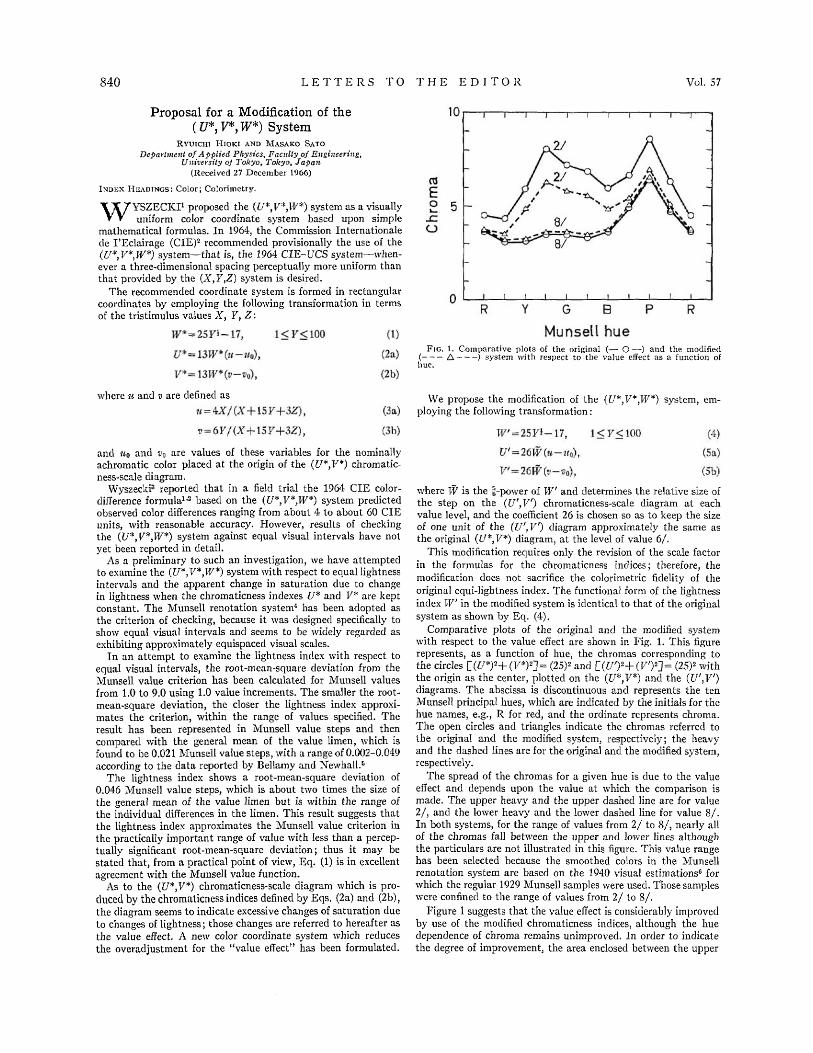
FIG. 1. Comparative plots of the original (— O—) and the modified (- - - Δ- - -) system with respect to the value effect as a function of hue.
We propose the modification of the (U*,V*,W*) system, employing the following transformation:
where W is the 6/5-power of W and determines the relative size of the step on the (U',V') chromaticness-scale diagram at each value level, and the coefficient 26 is chosen so as to keep the size of one unit of the (U',V) diagram approximately the same as the original (U*,V*) diagram, at the level of value 6/.
This modification requires only the revision of the scale factor in the formulas for the chromaticness indices; therefore, the modification does not sacrifice the colorimetric fidelity of the original equi-lightness index. The functional form of the lightness index W' in the modified system is identical to that of the original system as shown by Eq. (4).
Comparative plots of the original and the modified system with respect to the value effect are shown in Fig. 1. This figure represents, as a function of hue, the chromas corresponding to the circles [(U*)2+(V*)2]= (25)2 and [ (U ' ) 2 +(V' ) 2 ]= (25)2 with the origin as the center, plotted on the (U*,V*) and the (U',V) diagrams. The abscissa is discontinuous and represents the ten Munsell principal hues, which are indicated by the initials for the hue names, e.g., R for red, and the ordinate represents chroma. The open circles and triangles indicate the chromas referred to the original and the modified system, respectively; the heavy and the dashed lines are for the original and the modified system, respectively.
The spread of the chromas for a given hue is due to the value effect and depends upon the value at which the comparison is made. The upper heavy and the upper dashed line are for value 2/, and the lower heavy and the lower dashed line for value 8/. In both systems, for the range of values from 2/ to 8/, nearly all of the chromas fall between the upper and lower lines although the particulars are not illustrated in this figure. This value range has been selected because the smoothed colors in the Munsell renotation system are based on the 1940 visual estimations6 for which the regular 1929 Munsell samples were used. Those samples were confined to the range of values from 2/ to 8/.
Figure 1 suggests that the value effect is considerably improved by use of the modified chromaticness indices, although the hue dependence of chroma remains unimproved. In order to indicate the degree of improvement, the area enclosed between the upper
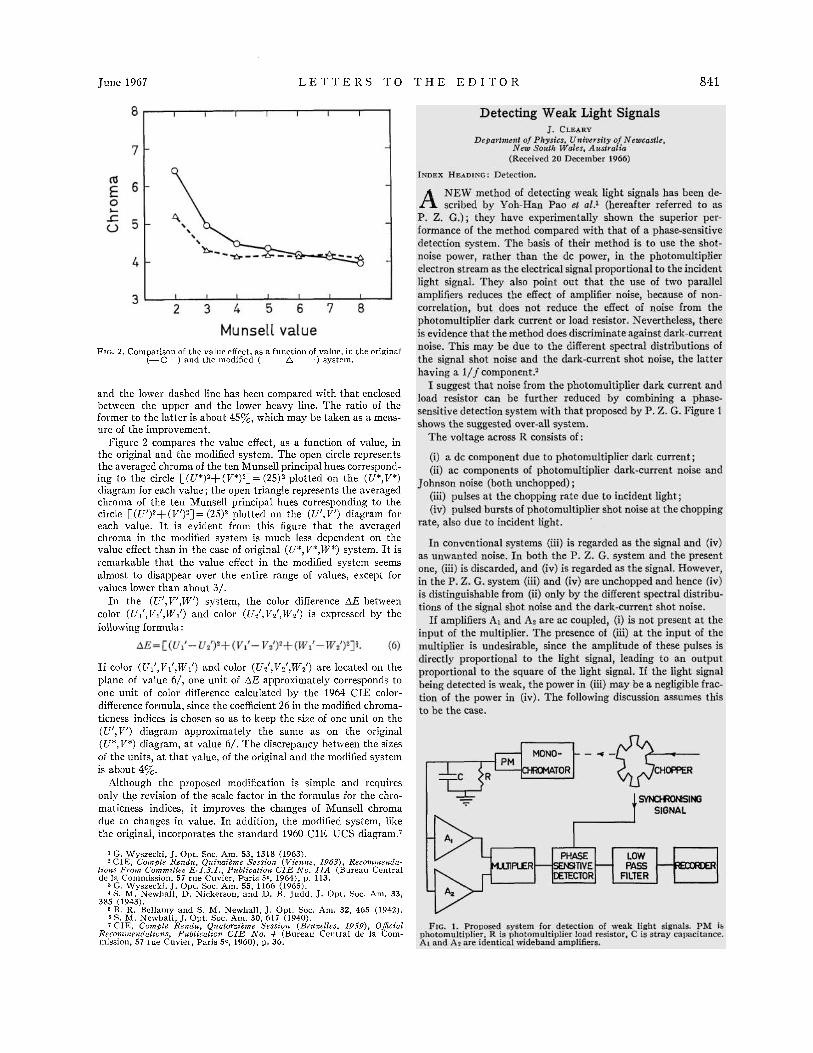
FIG. 2. Comparison of the value effect, as a function of value, in the original (— O—) and the modified (- - - Δ- - -) system.
and the lower dashed line has been compared with that enclosed between the upper and the lower heavy line. The ratio of the former to the latter is about 45%, which may be taken as a measure of the improvement.
Figure 2 compares the value effect, as a function of value, in the original and the modified system. The open circle represents the averaged chroma of the ten Munsell principal hues corresponding to the circle [(U*)2+(V*)2]= (25)2 plotted on the (U*,V*) diagram for each value; the open triangle represents the averaged chroma of the ten Munsell principal hues corresponding to the circle [(U')2+(V')2] = (25)2 plotted on the (U',V) diagram for each value. I t is evident from this figure that the averaged chroma in the modified system is much less dependent on the value effect than in the case of original (U*,V*,W*) system. It is remarkable that the value effect in the modified system seems almost to disappear over the entire range of values, except for values lower than about 3 / .
In the (U',V',W) system, the color difference ΔE between color (U1',V1',W1') and color (U2',V2',W2') is expressed by the following formula:
If color (U1',V1',W1') and color (U2 ',F2 ',W2 ') are located on the plane of value 6/, one unit of ΔE approximately corresponds to one unit of color difference calculated by the 1964 CIE color-difference formula, since the coefficient 26 in the modified chroma-ticness indices is chosen so as to keep the size of one unit on the (U',V') diagram approximately the same as on the original (U*,V*) diagram, at value 6/. The discrepancy between the sizes of the units, at that value, of the original and the modified system is about 4%.
Although the proposed modification is simple and requires only the revision of the scale factor in the formulas for the chro-maticness indices, it improves the changes of Munsell chroma due to changes in value. In addition, the modified system, like the original, incorporates the standard 1960 CIE–UCS diagram.7
1 G. Wyszecki, J. Opt. Soc. Am. 53, 1318 (1963). 2 CIE, Coinpte Rendu, Quinzihne Session (Vienne, 1963), Recommendations From Committee E-1.3.1., Publication CIE No. 11A (Bureau Central de la Commission, 57 rue Cuvier, Paris 5e, 1964), p. 113. 3 G. Wyszecki, J. Opt. Soc. Am. 55, 1166 (1965). 4 S. M. Newhall, D. Nickerson, and D. B. Judd, J. Opt. Soc. Am. 33, 385 (1943). 5 B. R. Bellamy and S. M. Newhall, J. Opt. Soc. Am. 32, 465 (1942). 6 S. M. Newhall, J. Opt. Soc. Am. 30, 617 (1940). 7 CIE, Coinpte Rendu, Quatorzième Session (Bruxelles, 1959), Official Recommendations, Publication CIE No. 4 (Bureau Central de la Commission, 57 rue Cuvier, Paris 5e, 1960), p. 36.
June 1967 L E T T E R S T O T H E E D I T O R 841