property index overview of european residential markets · 2020-07-03 · residential markets in...
TRANSCRIPT

Property IndexOverview of European Residential Markets9th edition, July 2020
Property Index | 9th edition, July 2020
3
Property Index | 9th edition, July 2020
2
Introduction 3
Highlights 5
Impacts of the Coronavirus Pandemic on Residential Markets in Selected Countries 6
Economic Development in Europe 7
Comparison of Residential Markets – Housing Development Intensity 10
Comparison of Residential Property Prices in Selected Countries and Cities 15
Mortgage Markets in Europe 30
Annex: Comments on Residential Markets 32
Contacts 45
Authors 46
IntroductionWe are pleased to present you the ninth edition of the Property Index, Overview of European Residential Markets. During almost a decade, Property Index has become one of the most important and popular European real estate publications and has acted as a valuable source for professionals, institutions and general public.
Property index analyses factors shaping the residential markets and their development and compares residential property prices across selected European countries and cities.
The publication aims to provide you with European residential market data on a regular basis and to answer questions on how Europeans live and at what costs.
Despite the fact that the publication’s focus is to provide a complex overview of the past year’s development on residential markets in European countries, we could not ignore the current unprecedented situation caused by the coronavirus pandemic. We included a brief overview of early impacts of the pandemic and related measures on residential markets in the participating countries and their expected future development.
We hope you will find this edition of Property index interesting and that it will provide you with insights and information you need.
5
Property Index | 9th edition, July 2020
4
This year, we analyzed residential markets in:
• Austria (AT);
• Belgium (BE);
• Bosnia and Herzegovina (BA);
• Bulgaria (BG);
• Croatia (HR);
• Czech Republic (CZ);
• Denmark (DK);
• France (FR);
• Germany (DE);
• Hungary (HU);
• Ireland (IE);
• Israel (IL);
• Italy (IT);
• Latvia (LV);
• Luxembourg (LU);
• Netherlands (NL);
• Norway (NO);
• Poland (PL);
• Portugal (PT);
• Serbia (RS);
• Slovakia (SK);
• Spain (ES); and
• United Kingdom (UK).
This edition of Property Index has the historically highest number of participating countries with Bosnia and Herzegovina, Bulgaria, Ireland, Israel, Luxembourg, Serbia and Slovakia joining the publication.
Most presented indicators are on a year-on-year basis and are to some extent also influenced by geopolitical situation and various factors affecting the volume of supply and demand.
A proven international and cross-functional team of Deloitte professionals in the development, mortgage and real estate markets prepared the Property Index. This publication has been prepared using data collected by individual Deloitte offices in the participating countries.
Property Index capitalizes on Deloitte’s extensive knowledge of the real estate and development industry, enabling us to provide you with independent and credible information.
Property Index | 9th edition, July 2020
Highlights
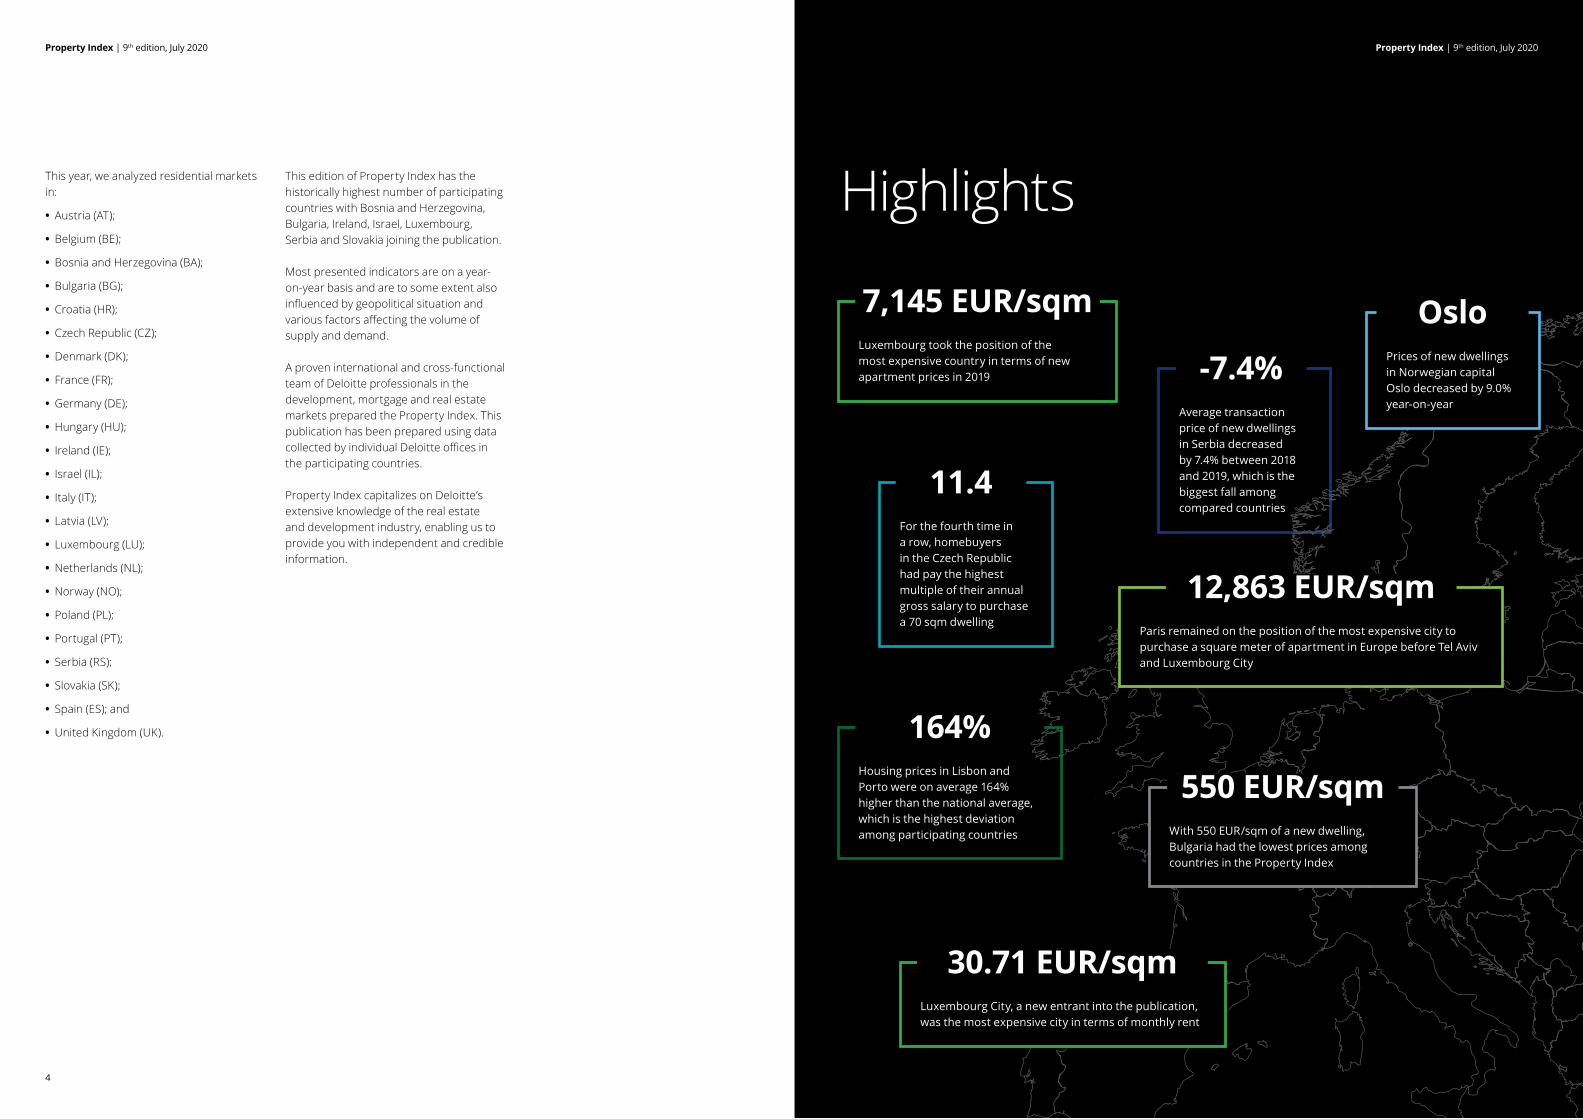
Luxembourg took the position of the most expensive country in terms of new apartment prices in 2019
Average transaction price of new dwellings in Serbia decreased by 7.4% between 2018 and 2019, which is the biggest fall among compared countries
Housing prices in Lisbon and Porto were on average 164% higher than the national average, which is the highest deviation among participating countries
For the fourth time in a row, homebuyers in the Czech Republic had pay the highest multiple of their annual gross salary to purchase a 70 sqm dwelling
7,145 EUR/sqm
-7.4%
164%
11.4
Paris remained on the position of the most expensive city to purchase a square meter of apartment in Europe before Tel Aviv and Luxembourg City
12,863 EUR/sqm
Prices of new dwellings in Norwegian capital Oslo decreased by 9.0% year-on-year
Oslo
With 550 EUR/sqm of a new dwelling, Bulgaria had the lowest prices among countries in the Property Index
550 EUR/sqm
Luxembourg City, a new entrant into the publication, was the most expensive city in terms of monthly rent
30.71 EUR/sqm

Property Index | 9th edition, July 2020
7
Property Index | 9th edition, July 2020
6
Impacts of the Coronavirus Pandemic on Residential Real Estate MarketsHow did residential markets in selected countries react to the outbreak of the virus and what is expected to happen in the near future?
After several years of growth across all segments of the real estate market, year 2020 was anticipated to confirm this trend. Nevertheless, since late December 2019 a new type of coronavirus started to spread across the world from China. In February and March 2020, most of the European countries were hit by the pandemic and were forced to impose restrictive measures on their economies and the free movement of citizens. Together with the rest of the economy, residential real estate market has also been affected.
The economic crisis that will follow the pandemic is expected by many experts to be the worst since the Great Depression. However, from the perspective of real estate market, this crisis is different from the previous one in years 2008 – 2010. Negligence of banks in terms of property financing and consequent trading of derivatives based on these loans caused the financial crisis. The current economic downturn have been caused by disruptions from the government’s side to prevent the spread of Covid-19 disease. Banks
and developers are in a better financial condition than on the edge of the previous crisis.
We asked our real estate experts from participating countries to share their thoughts and observations about the immediate impacts the coronavirus had on the residential markets and how will markets develop in the upcoming months.
During the past crisis, we witnessed a huge shrink in construction activity, when many developers had financial problems and most of the projects were put on hold. This resulted in record low numbers of initiated and completed dwellings in years after the crisis, which in combination with low financing costs and economic upturn kick-started the residential price growth across Europe and deepened the shortage of dwellings in several countries. Our experts agree that in case of a long-lasting economic downturn, a similar pattern may appear on some markets. Nevertheless, development companies are in a better position to handle complications and
although a slight delay in permitting processes and construction may occur, there must not be a significant outage of production in order to protect the housing market. The role of government help, either in form of guarantees or direct financial involvement, will be crucial to tackle this imminence.
Immediately after the implementation of protecting measures in the participating countries, residential markets in most of them effectively froze. The majority of pending transactions, which were in early phases of the process, were put on hold. Almost no new deals were initiated, as personal property inspections were almost impossible to perform. Some countries reported a year-on-year decline in transactions by up to 80%. The effect on construction activity varied between countries based on the tightness of protective measures. For example in France, works on 90% of construction sites were interrupted, while in the Czech Republic, workers only needed to adapt to additional hygienic rules. Another threat to
construction works might be the shortage of labor, especially in countries, where most of the construction workers are from abroad and returned home after the outbreak of the coronavirus.
Rental markets in most of the participating countries demonstrated the fastest response to new circumstances on the market. Especially in major cities, such as Paris, Rome, Prague or Budapest, restrictive measures effectively stopped the inflow of tourists and many of apartments located in city centers, originally used for P2P accommodation services, were introduced to the long-term rental market, which created a pressure on rents to decrease. However, it is uncertain, whether these dwellings will return to the short-term market once tourism activity recovers.
The development of the residential real estate market across Europe varies from country to country. In ten out of 23 participating countries, stagnation is expected on the residential market in terms of price and a decline in terms of transaction activity. Experts from six countries have negative expectations in terms of price development and overall market activity in the future. These countries being ones, which were hit hard by the virus (the United Kingdom, Croatia) or ones with already slowing markets (Hungary). Contrary, a positive outlook is being articulated by representatives from countries, which have strong fundaments for further development of the residential market. These countries being Belgium, where prices were growing constantly for the last 37 years, the Netherlands, Norway, Israel, Slovakia and the Czech Republic. In any case, these predictions were made with currently available information on the epidemiologic and economic situation and might change in case of unexpected events.
Transaction activity in Q2 2020 is expected to be significantly lower than in the previous years on most of the selected markets. A decline will be caused by uncertainty in terms of economic and epidemiologic development that might encourage potential buyers to postpone their decisions into safer times. Moreover, most of the banks across the participating countries have already applied stricter conditions, such as lower LTV ratio or higher disposable income of applicants, on new mortgage loan applications. On the other hand, interest rates of almost every central bank in Europe are close to zero, which means that mortgage interest rates will remain low for the upcoming period. This might encourage people with stable income to invest into residential real estate.
In terms of price development, most countries expect property prices to stagnate or undergo a slight correction in 2020 before returning to growth in 2021 or 2022. Most positive outlooks are in countries with limited available land bank, which are also attractive for foreign professionals, such as Luxembourg, Belgium or the Netherlands. Contrary, a steep decline is expected in the United Kingdom after the market fully understands the economic impacts of the pandemic and the still uncertain form of Brexit. Hungary also expects an accelerated decline on the already cooling residential market. Other countries that will be negatively affected by the protective measures and cautious behavior of people will be traditional summer holiday destinations as Croatia, Spain or Italy, whose economies are highly dependent on tourism. Especially prices of second homes in these countries might decrease significantly, as demand will be weak.
Curious circumstances can be observed on the real estate market in Bosnia and Herzegovina. Its future development is closely intertwined with economic development of Western Europe, as big share of buyers are from the numerous BiH diaspora living and working abroad. A similar phenomenon, although to a smaller extent, is to be seen also on other eastern European real estate markets.
The current unexpected situation brought several restrictions into the functioning of the residential real estate market. In the immediate future, numerous technological solutions could emerge and change the unwieldy processes on the market. In many countries, virtual property inspections via video calls were enabled to tackle the social distancing measures. The pandemic might change the way people think about housing. Spread of the option to work remotely will possibly redirect part of the demand from cities into more peripheral regions and adjust price levels across countries to be more even. Furthermore, implementation of technologies such as electronic validation of contract certificates via block chain may become part of the sales process together with virtual reality tours in development projects currently in construction.
This crisis gives the whole market a new perspective on how people across Europe live and has a potential to change it.
Property Index | 9th edition, July 2020
9
Property Index | 9th edition, July 2020
8
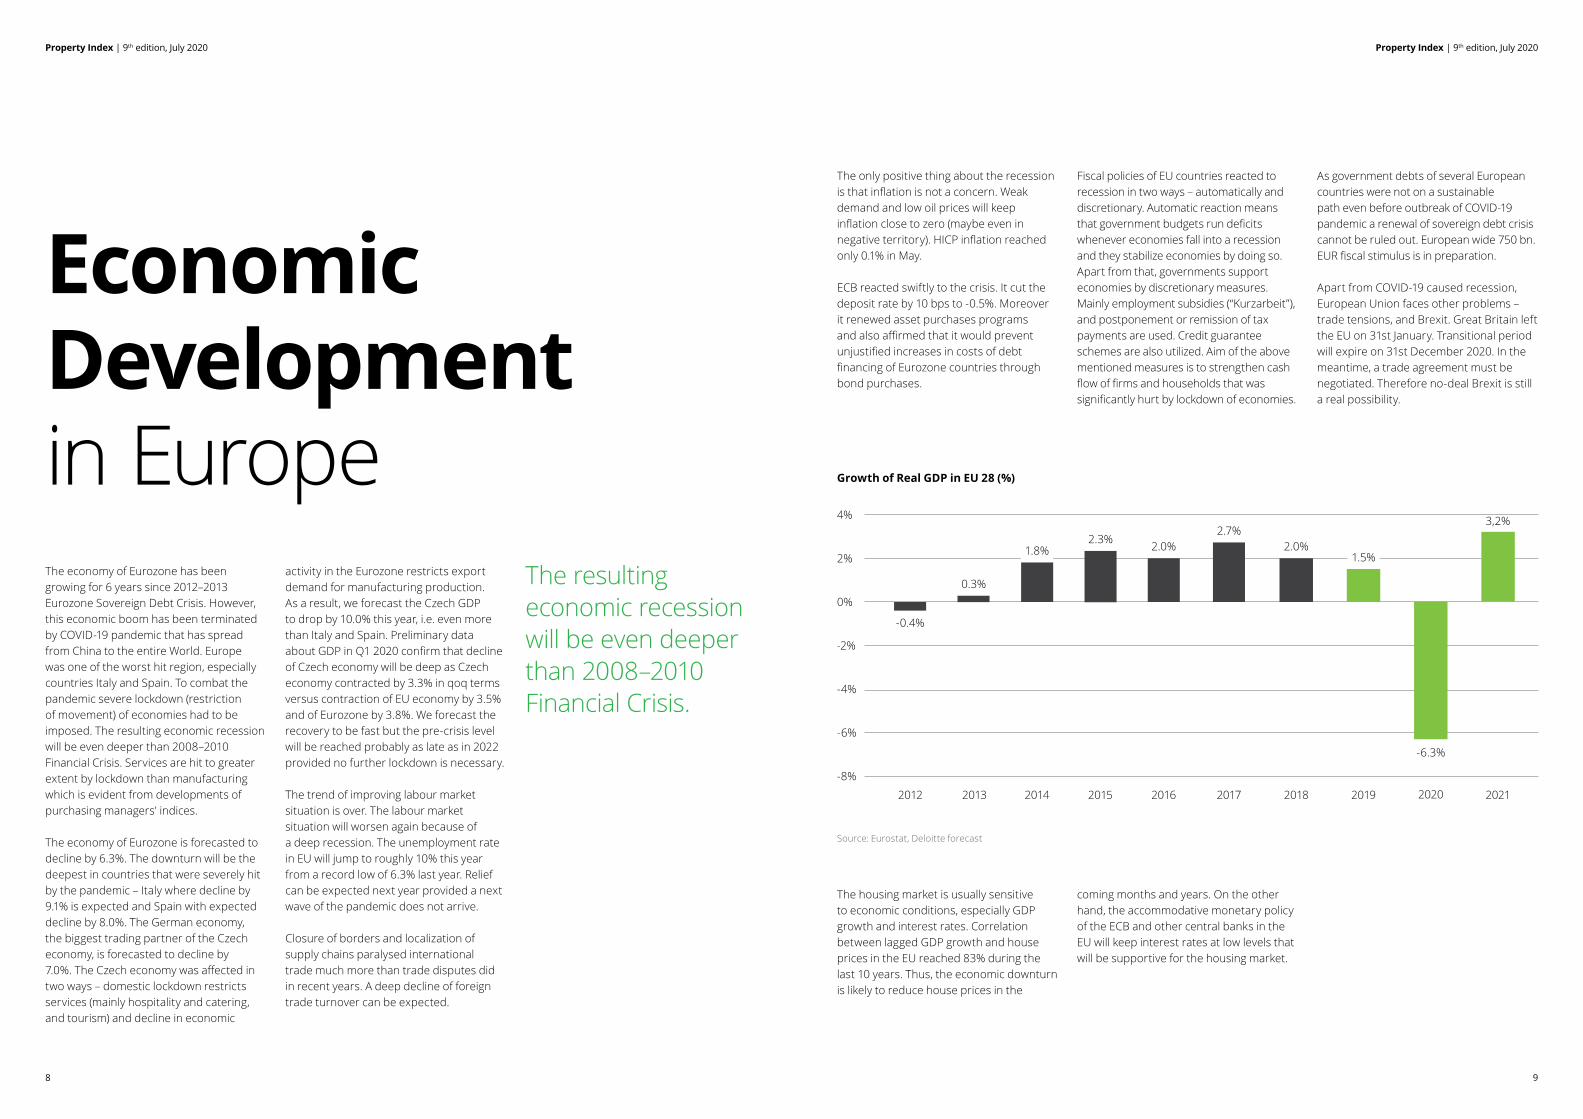
Economic Developmentin EuropeThe economy of Eurozone has been growing for 6 years since 2012–2013 Eurozone Sovereign Debt Crisis. However, this economic boom has been terminated by COVID-19 pandemic that has spread from China to the entire World. Europe was one of the worst hit region, especially countries Italy and Spain. To combat the pandemic severe lockdown (restriction of movement) of economies had to be imposed. The resulting economic recession will be even deeper than 2008–2010 Financial Crisis. Services are hit to greater extent by lockdown than manufacturing which is evident from developments of purchasing managers' indices.
The economy of Eurozone is forecasted to decline by 6.3%. The downturn will be the deepest in countries that were severely hit by the pandemic – Italy where decline by 9.1% is expected and Spain with expected decline by 8.0%. The German economy, the biggest trading partner of the Czech economy, is forecasted to decline by 7.0%. The Czech economy was affected in two ways – domestic lockdown restricts services (mainly hospitality and catering, and tourism) and decline in economic
activity in the Eurozone restricts export demand for manufacturing production. As a result, we forecast the Czech GDP to drop by 10.0% this year, i.e. even more than Italy and Spain. Preliminary data about GDP in Q1 2020 confirm that decline of Czech economy will be deep as Czech economy contracted by 3.3% in qoq terms versus contraction of EU economy by 3.5% and of Eurozone by 3.8%. We forecast the recovery to be fast but the pre-crisis level will be reached probably as late as in 2022 provided no further lockdown is necessary.
The trend of improving labour market situation is over. The labour market situation will worsen again because of a deep recession. The unemployment rate in EU will jump to roughly 10% this year from a record low of 6.3% last year. Relief can be expected next year provided a next wave of the pandemic does not arrive.
Closure of borders and localization of supply chains paralysed international trade much more than trade disputes did in recent years. A deep decline of foreign trade turnover can be expected.
The only positive thing about the recession is that inflation is not a concern. Weak demand and low oil prices will keep inflation close to zero (maybe even in negative territory). HICP inflation reached only 0.1% in May.
ECB reacted swiftly to the crisis. It cut the deposit rate by 10 bps to -0.5%. Moreover it renewed asset purchases programs and also affirmed that it would prevent unjustified increases in costs of debt financing of Eurozone countries through bond purchases.
Fiscal policies of EU countries reacted to recession in two ways – automatically and discretionary. Automatic reaction means that government budgets run deficits whenever economies fall into a recession and they stabilize economies by doing so. Apart from that, governments support economies by discretionary measures. Mainly employment subsidies (“Kurzarbeit”), and postponement or remission of tax payments are used. Credit guarantee schemes are also utilized. Aim of the above mentioned measures is to strengthen cash flow of firms and households that was significantly hurt by lockdown of economies.
As government debts of several European countries were not on a sustainable path even before outbreak of COVID-19 pandemic a renewal of sovereign debt crisis cannot be ruled out. European wide 750 bn. EUR fiscal stimulus is in preparation.
Apart from COVID-19 caused recession, European Union faces other problems – trade tensions, and Brexit. Great Britain left the EU on 31st January. Transitional period will expire on 31st December 2020. In the meantime, a trade agreement must be negotiated. Therefore no-deal Brexit is still a real possibility.
The housing market is usually sensitive to economic conditions, especially GDP growth and interest rates. Correlation between lagged GDP growth and house prices in the EU reached 83% during the last 10 years. Thus, the economic downturn is likely to reduce house prices in the
coming months and years. On the other hand, the accommodative monetary policy of the ECB and other central banks in the EU will keep interest rates at low levels that will be supportive for the housing market.
Growth of Real GDP in EU 28 (%)
Source: Eurostat, Deloitte forecast
4%
2%
0%
-2%
-4%
-8%
-6%
-0.4%
2012 2013
0.3%
2014
1.8%
2015
2.3%
2016
2.0%
2019
1.5%
2021
3,2%
2020
-6.3%
2018
2.0%
2017
2.7%
The resulting economic recession will be even deeper than 2008–2010 Financial Crisis.
Property Index | 9th edition, July 2020
11
Property Index | 9th edition, July 2020
10
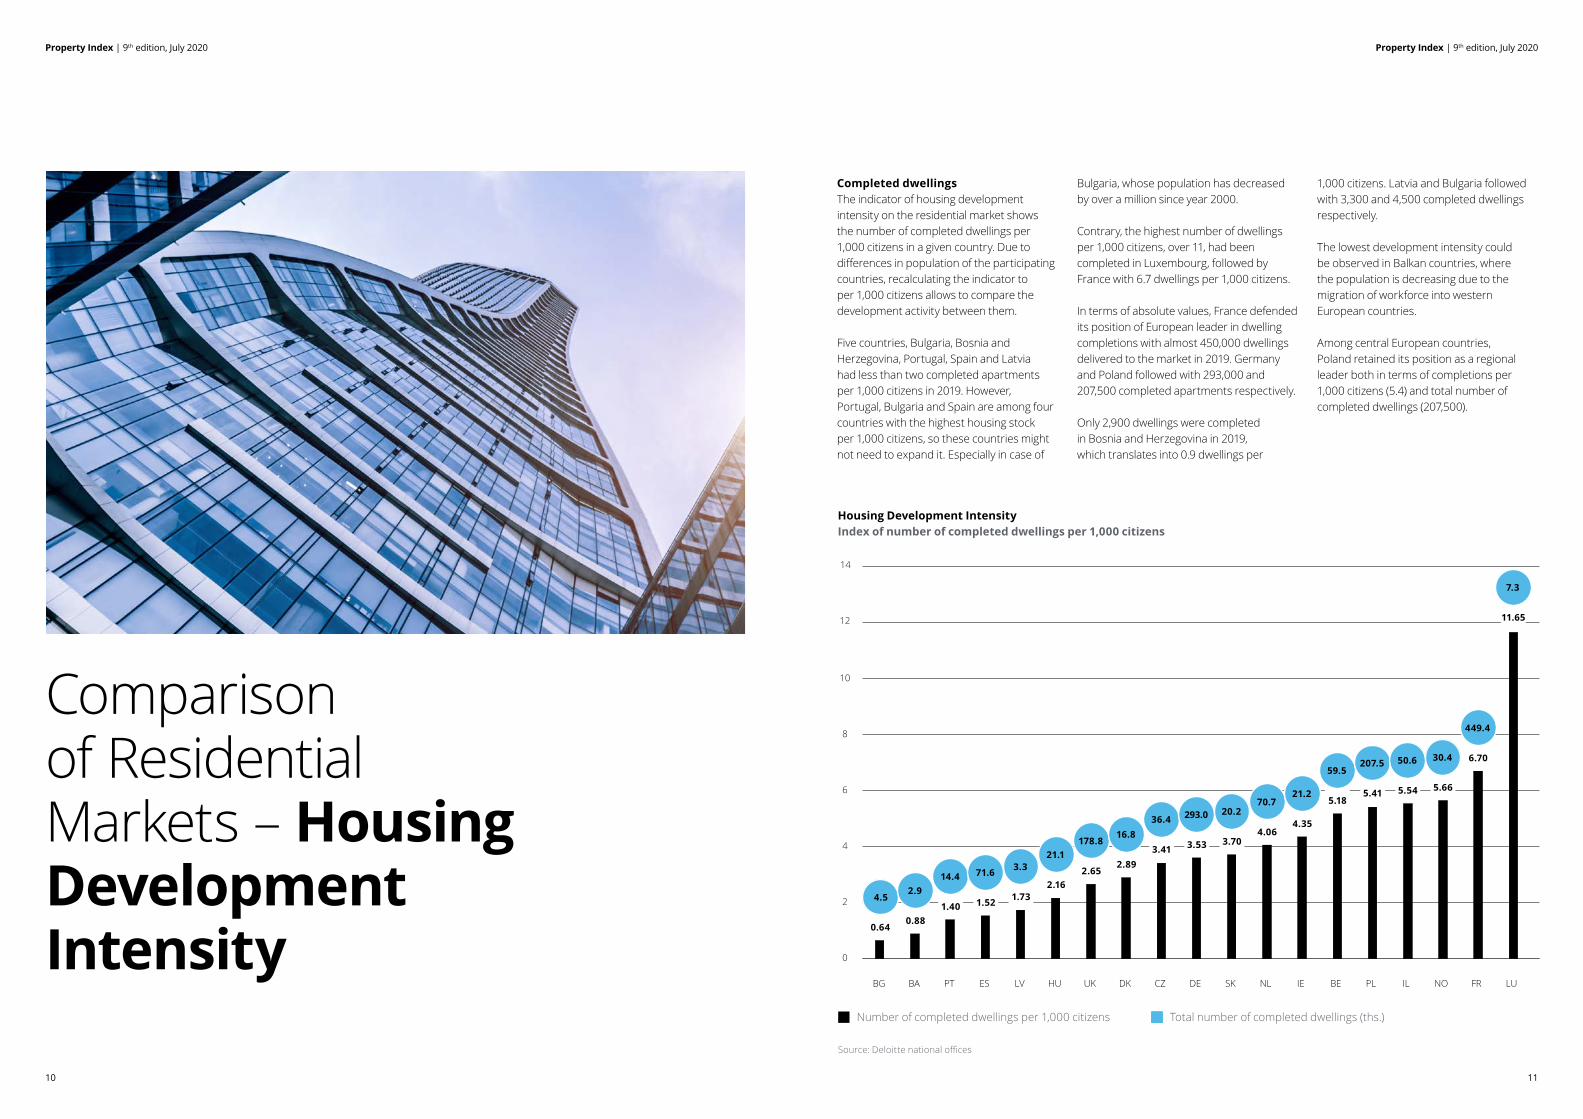
Completed dwellingsThe indicator of housing development intensity on the residential market shows the number of completed dwellings per 1,000 citizens in a given country. Due to differences in population of the participating countries, recalculating the indicator to per 1,000 citizens allows to compare the development activity between them.
Five countries, Bulgaria, Bosnia and Herzegovina, Portugal, Spain and Latvia had less than two completed apartments per 1,000 citizens in 2019. However, Portugal, Bulgaria and Spain are among four countries with the highest housing stock per 1,000 citizens, so these countries might not need to expand it. Especially in case of
Bulgaria, whose population has decreased by over a million since year 2000.
Contrary, the highest number of dwellings per 1,000 citizens, over 11, had been completed in Luxembourg, followed by France with 6.7 dwellings per 1,000 citizens.
In terms of absolute values, France defended its position of European leader in dwelling completions with almost 450,000 dwellings delivered to the market in 2019. Germany and Poland followed with 293,000 and 207,500 completed apartments respectively.
Only 2,900 dwellings were completed in Bosnia and Herzegovina in 2019, which translates into 0.9 dwellings per
1,000 citizens. Latvia and Bulgaria followed with 3,300 and 4,500 completed dwellings respectively.
The lowest development intensity could be observed in Balkan countries, where the population is decreasing due to the migration of workforce into western European countries.
Among central European countries, Poland retained its position as a regional leader both in terms of completions per 1,000 citizens (5.4) and total number of completed dwellings (207,500).
Comparison of Residential Markets – Housing Development Intensity
Housing Development Intensity Index of number of completed dwellings per 1,000 citizens
Source: Deloitte national offices
Number of completed dwellings per 1,000 citizens Total number of completed dwellings (ths.)
BG BA PT ES LV HU UK DK CZ DE SK NL IE BE PL IL NO FR LU
0
2
4
6
8
10
12
14
0
2
4
6
8
10
12
14
0%
40%
80%
120%
160%
200%
0%
1%
2%
3%
4%
5%
0
100
200
300
400
500
600
700
0
2
4
6
8
10
4.5
0.64
2.9
0.88
14.4
1.40
71.6
1.52
3.3
1.73
21.1
2.16
178.8
2.65
16.8
2.89
36.4
3.41
293.0
3.53
20.2
3.70
70.7
4.06
21.2
4.35
59.5
5.18
207.5
5.41
50.6
5.54
30.4
5.66
449.4
6.70
7.3
11.65
13
Property Index | 9th edition, July 2020
12
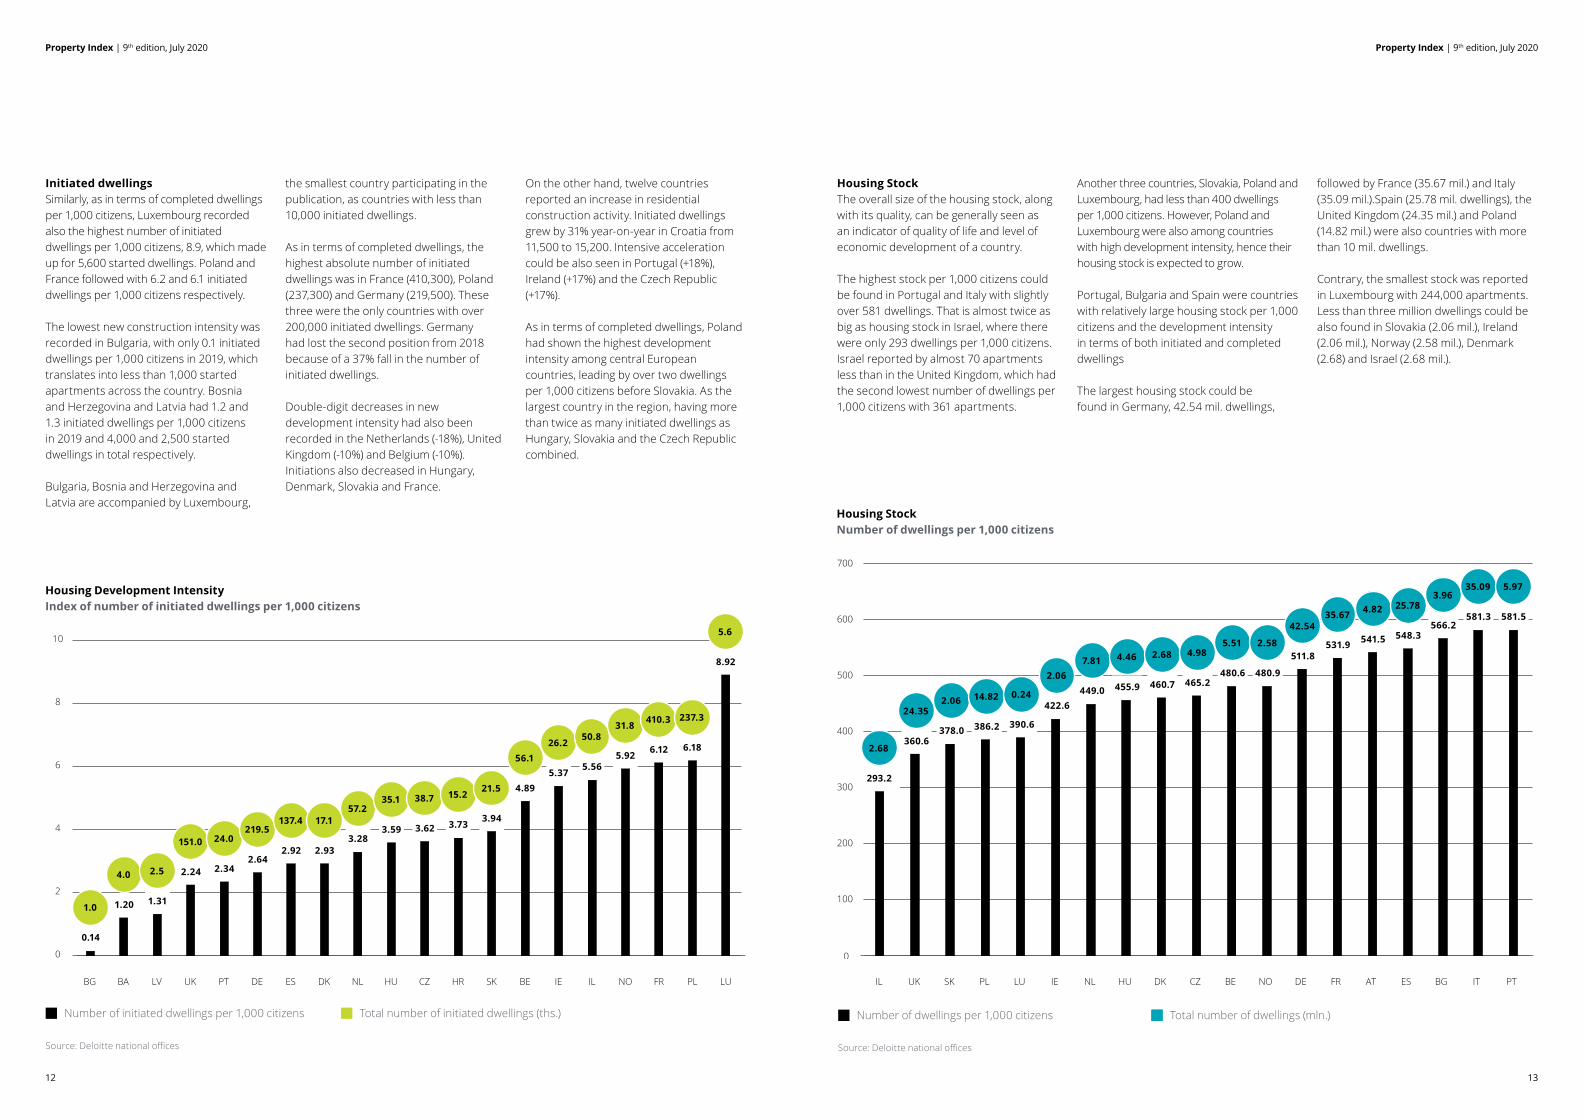
Housing StockThe overall size of the housing stock, along with its quality, can be generally seen as an indicator of quality of life and level of economic development of a country.
The highest stock per 1,000 citizens could be found in Portugal and Italy with slightly over 581 dwellings. That is almost twice as big as housing stock in Israel, where there were only 293 dwellings per 1,000 citizens. Israel reported by almost 70 apartments less than in the United Kingdom, which had the second lowest number of dwellings per 1,000 citizens with 361 apartments.
Another three countries, Slovakia, Poland and Luxembourg, had less than 400 dwellings per 1,000 citizens. However, Poland and Luxembourg were also among countries with high development intensity, hence their housing stock is expected to grow.
Portugal, Bulgaria and Spain were countries with relatively large housing stock per 1,000 citizens and the development intensity in terms of both initiated and completed dwellings
The largest housing stock could be found in Germany, 42.54 mil. dwellings,
followed by France (35.67 mil.) and Italy (35.09 mil.).Spain (25.78 mil. dwellings), the United Kingdom (24.35 mil.) and Poland (14.82 mil.) were also countries with more than 10 mil. dwellings.
Contrary, the smallest stock was reported in Luxembourg with 244,000 apartments. Less than three million dwellings could be also found in Slovakia (2.06 mil.), Ireland (2.06 mil.), Norway (2.58 mil.), Denmark (2.68) and Israel (2.68 mil.).
Property Index | 9th edition, July 2020
Initiated dwellingsSimilarly, as in terms of completed dwellings per 1,000 citizens, Luxembourg recorded also the highest number of initiated dwellings per 1,000 citizens, 8.9, which made up for 5,600 started dwellings. Poland and France followed with 6.2 and 6.1 initiated dwellings per 1,000 citizens respectively.
The lowest new construction intensity was recorded in Bulgaria, with only 0.1 initiated dwellings per 1,000 citizens in 2019, which translates into less than 1,000 started apartments across the country. Bosnia and Herzegovina and Latvia had 1.2 and 1.3 initiated dwellings per 1,000 citizens in 2019 and 4,000 and 2,500 started dwellings in total respectively.
Bulgaria, Bosnia and Herzegovina and Latvia are accompanied by Luxembourg,
the smallest country participating in the publication, as countries with less than 10,000 initiated dwellings.
As in terms of completed dwellings, the highest absolute number of initiated dwellings was in France (410,300), Poland (237,300) and Germany (219,500). These three were the only countries with over 200,000 initiated dwellings. Germany had lost the second position from 2018 because of a 37% fall in the number of initiated dwellings.
Double-digit decreases in new development intensity had also been recorded in the Netherlands (-18%), United Kingdom (-10%) and Belgium (-10%). Initiations also decreased in Hungary, Denmark, Slovakia and France.
On the other hand, twelve countries reported an increase in residential construction activity. Initiated dwellings grew by 31% year-on-year in Croatia from 11,500 to 15,200. Intensive acceleration could be also seen in Portugal (+18%), Ireland (+17%) and the Czech Republic (+17%).
As in terms of completed dwellings, Poland had shown the highest development intensity among central European countries, leading by over two dwellings per 1,000 citizens before Slovakia. As the largest country in the region, having more than twice as many initiated dwellings as Hungary, Slovakia and the Czech Republic combined.
Housing Development Intensity Index of number of initiated dwellings per 1,000 citizens
Source: Deloitte national offices
Number of initiated dwellings per 1,000 citizens Total number of initiated dwellings (ths.)
Source: Deloitte national offices
Number of dwellings per 1,000 citizens Total number of dwellings (mln.)
IL UK SK PL LU IE NL HU DK CZ BE NO DE FR AT ES BG IT PTBG BA LV UK PT DE ES DK NL HU CZ HR SK BE IE IL NO FR PL LU
0
2
4
6
8
10
12
14
0
2
4
6
8
10
12
14
0%
40%
80%
120%
160%
200%
0%
1%
2%
3%
4%
5%
0
100
200
300
400
500
600
700
0
2
4
6
8
10
0
2
4
6
8
10
12
14
0
2
4
6
8
10
12
14
0%
40%
80%
120%
160%
200%
0%
1%
2%
3%
4%
5%
0
100
200
300
400
500
600
700
0
2
4
6
8
10
24.35
360.6
2.06
378.0
14.82
386.2
0.24
390.6
2.06
422.6
7.81
449.0
4.46
455.9
2.68
460.7
4.98
465.2
5.51
480.6
2.58
480.9
42.54
511.8
35.67
531.9
4.82
541.5
25.78
548.3
3.96
566.2
35.09
581.3
5.97
581.5
1.0
0.14
4.0
1.20
2.5
1.31
151.0
2.24
24.0
2.34
219.5
2.64
137.4
2.92
17.1
2.93
57.2
3.28
35.1
3.59
38.7
3.62
15.2
3.73
21.5
3.94
56.1
4.89
26.2
5.37
50.8
5.56
31.8
5.92
410.3
6.12
237.3
6.18
5.6
8.92
Housing Stock Number of dwellings per 1,000 citizens
2.68
293.2
Property Index | 9th edition, July 2020
1514
Property Index | 9th edition, July 2020
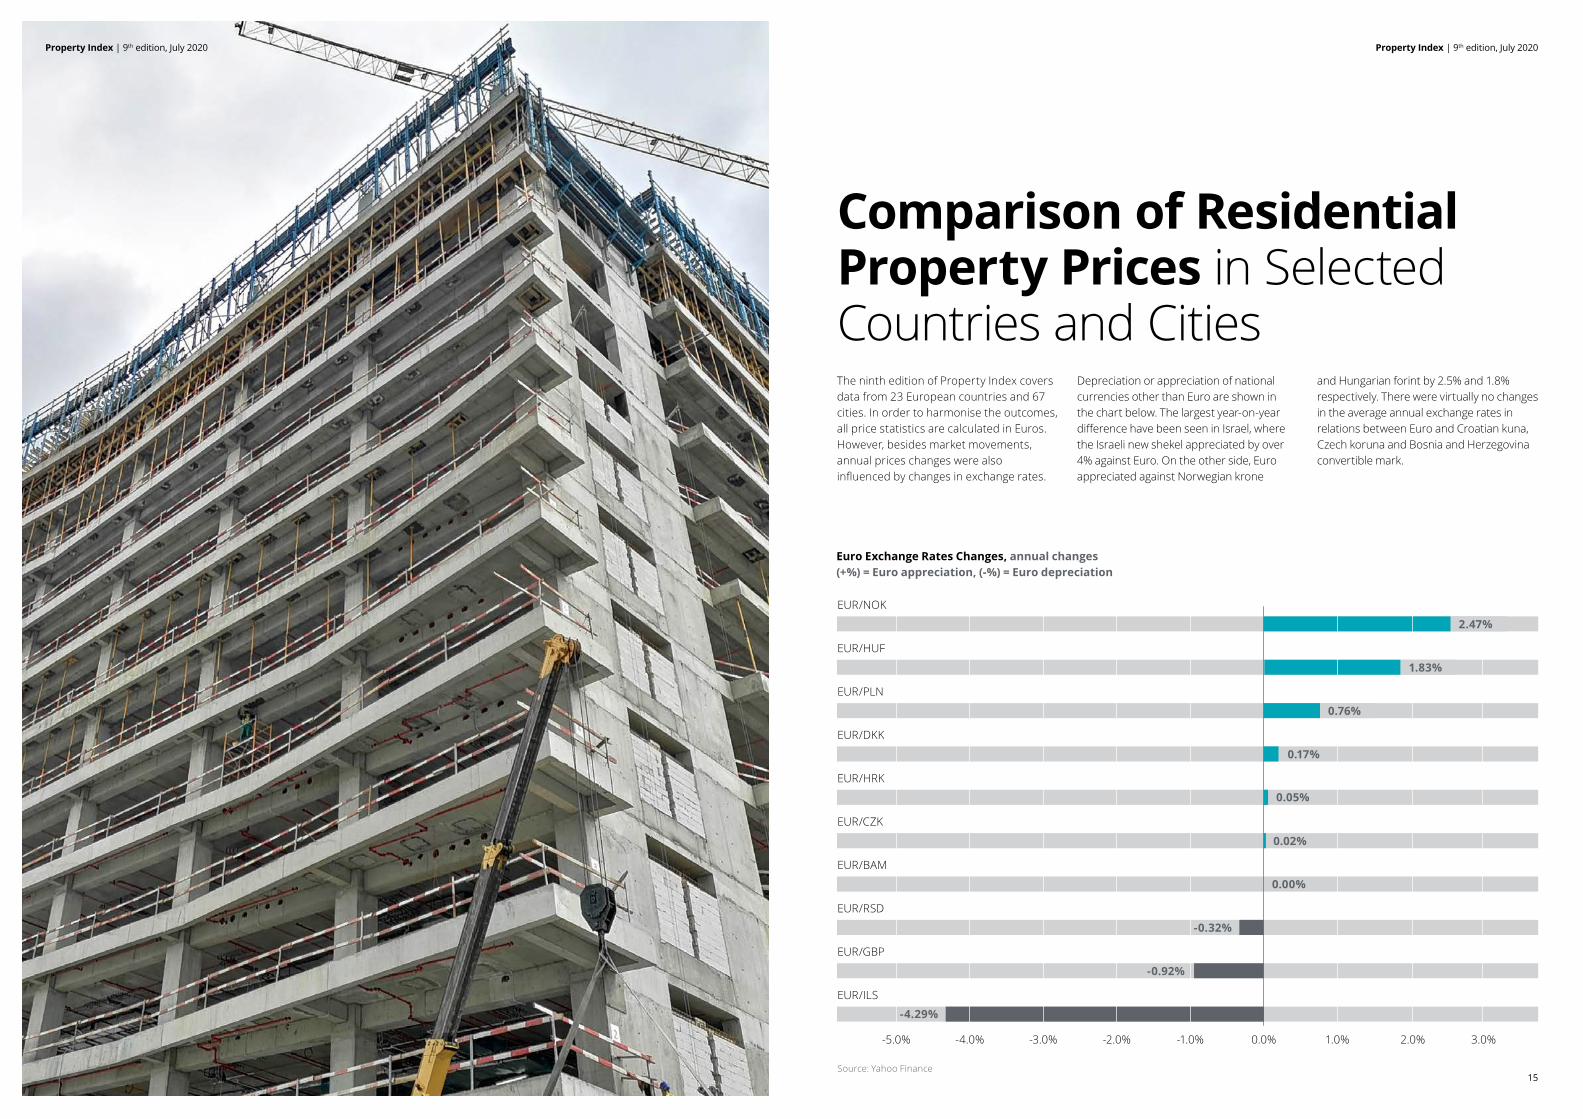
Comparison of Residential Property Prices in Selected Countries and CitiesThe ninth edition of Property Index covers data from 23 European countries and 67 cities. In order to harmonise the outcomes, all price statistics are calculated in Euros. However, besides market movements, annual prices changes were also influenced by changes in exchange rates.
Depreciation or appreciation of national currencies other than Euro are shown in the chart below. The largest year-on-year difference have been seen in Israel, where the Israeli new shekel appreciated by over 4% against Euro. On the other side, Euro appreciated against Norwegian krone
and Hungarian forint by 2.5% and 1.8% respectively. There were virtually no changes in the average annual exchange rates in relations between Euro and Croatian kuna, Czech koruna and Bosnia and Herzegovina convertible mark.
Source: Yahoo Finance
Euro Exchange Rates Changes, annual changes(+%) = Euro appreciation, (-%) = Euro depreciation
EUR/NOK
EUR/HUF
EUR/PLN
EUR/DKK
EUR/HRK
EUR/CZK
EUR/BAM
EUR/RSD
EUR/GBP
EUR/ILS
0.17%
0.05%
0.02%
0.00%
-0.32%
-0.92%
-4.29%
1.0%-1.0%-2.0%-3.0%-4.0%-5.0% 0.0% 2.0% 3.0%
2.47%
0.76%
1.83%
Property Index | 9th edition, July 2020
16 17
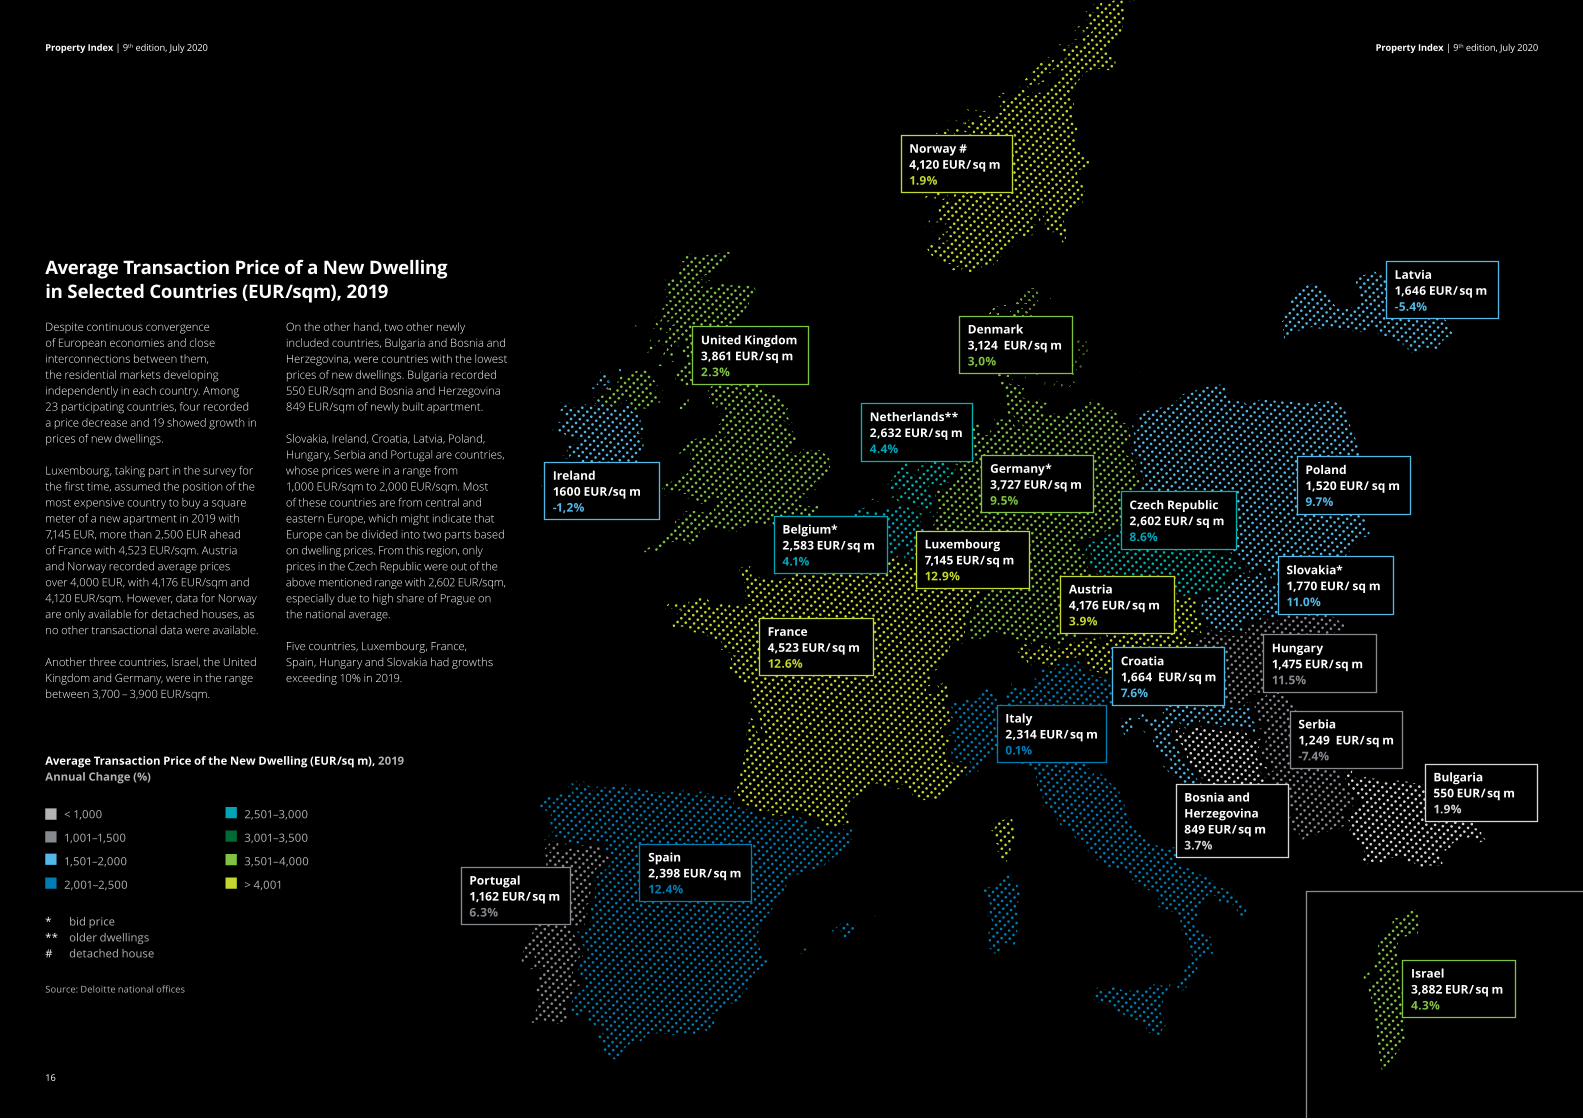
Average Transaction Price of a New Dwelling in Selected Countries (EUR/sqm), 2019
Despite continuous convergence of European economies and close interconnections between them, the residential markets developing independently in each country. Among 23 participating countries, four recorded a price decrease and 19 showed growth in prices of new dwellings.
Luxembourg, taking part in the survey for the first time, assumed the position of the most expensive country to buy a square meter of a new apartment in 2019 with 7,145 EUR, more than 2,500 EUR ahead of France with 4,523 EUR/sqm. Austria and Norway recorded average prices over 4,000 EUR, with 4,176 EUR/sqm and 4,120 EUR/sqm. However, data for Norway are only available for detached houses, as no other transactional data were available.
Another three countries, Israel, the United Kingdom and Germany, were in the range between 3,700 – 3,900 EUR/sqm.
On the other hand, two other newly included countries, Bulgaria and Bosnia and Herzegovina, were countries with the lowest prices of new dwellings. Bulgaria recorded 550 EUR/sqm and Bosnia and Herzegovina 849 EUR/sqm of newly built apartment.
Slovakia, Ireland, Croatia, Latvia, Poland, Hungary, Serbia and Portugal are countries, whose prices were in a range from 1,000 EUR/sqm to 2,000 EUR/sqm. Most of these countries are from central and eastern Europe, which might indicate that Europe can be divided into two parts based on dwelling prices. From this region, only prices in the Czech Republic were out of the above mentioned range with 2,602 EUR/sqm, especially due to high share of Prague on the national average.
Five countries, Luxembourg, France, Spain, Hungary and Slovakia had growths exceeding 10% in 2019.
< 1,000
1,001–1,500
1,501–2,000
2,001–2,500
2,501–3,000
3,001–3,500
3,501–4,000
> 4,001
Average Transaction Price of the New Dwelling (EUR/sq m), 2019Annual Change (%)
* bid price** older dwellings# detached house
Source: Deloitte national offices
Germany*3,727 EUR/ sq m9.5%
Denmark3,124 EUR/ sq m3,0%
Netherlands**2,632 EUR/ sq m4.4%
Belgium*2,583 EUR/ sq m4.1%
Luxembourg7,145 EUR/ sq m12.9%
France4,523 EUR/ sq m12.6%
United Kingdom3,861 EUR/ sq m2.3%
Ireland1600 EUR/sq m-1,2%
Spain2,398 EUR/ sq m12.4%
Portugal1,162 EUR/ sq m6.3%
Italy2,314 EUR/ sq m0.1%
Austria4,176 EUR/ sq m3.9%
Czech Republic2,602 EUR/ sq m8.6%
Latvia1,646 EUR/ sq m-5.4%
Norway #4,120 EUR/ sq m1.9%
Croatia1,664 EUR/ sq m7.6%
Israel3,882 EUR/ sq m4.3%
Hungary1,475 EUR/ sq m11.5%
Serbia1,249 EUR/ sq m-7.4%
Slovakia*1,770 EUR/ sq m11.0%
Poland1,520 EUR/ sq m9.7%
Bulgaria550 EUR/ sq m1.9%
Bosnia and Herzegovina849 EUR/ sq m3.7%
Property Index | 9th edition, July 2020
Property Index | 9th edition, July 2020
19
Property Index | 9th edition, July 2020
18
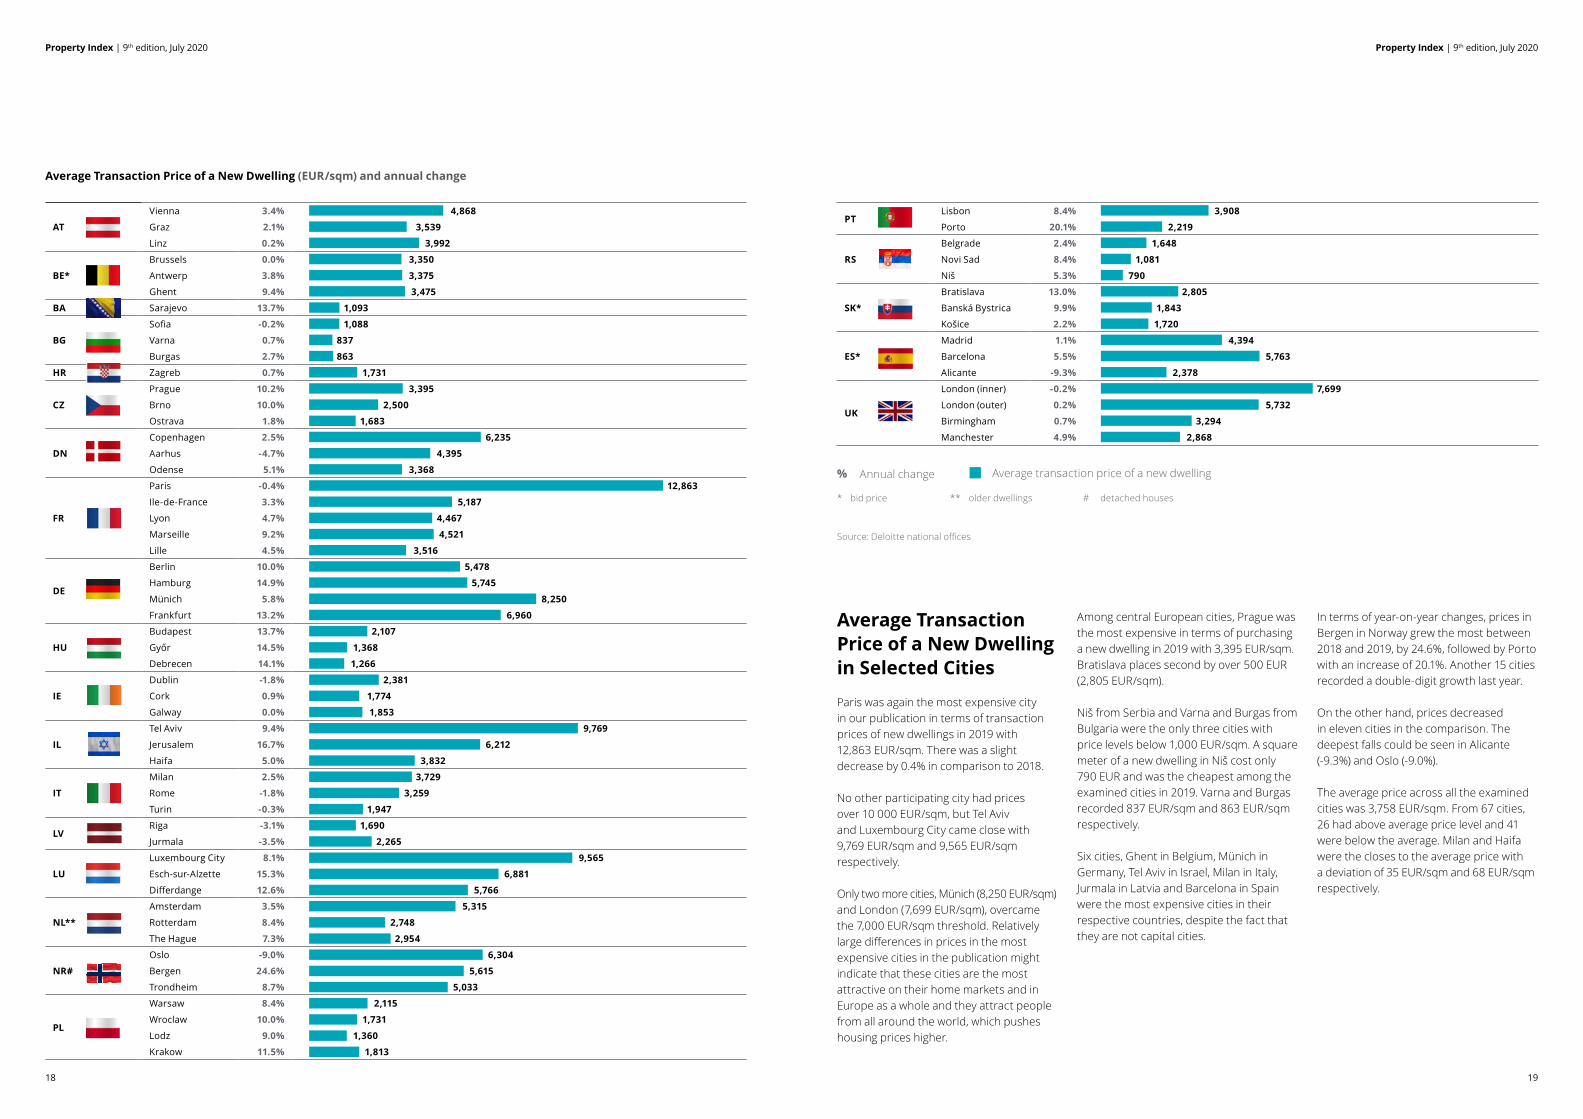
Average Transaction Price of a New Dwelling (EUR/sqm) and annual change
Average Transaction Price of a New Dwelling in Selected Cities
Paris was again the most expensive city in our publication in terms of transaction prices of new dwellings in 2019 with 12,863 EUR/sqm. There was a slight decrease by 0.4% in comparison to 2018.
No other participating city had prices over 10 000 EUR/sqm, but Tel Aviv and Luxembourg City came close with 9,769 EUR/sqm and 9,565 EUR/sqm respectively.
Only two more cities, Münich (8,250 EUR/sqm) and London (7,699 EUR/sqm), overcame the 7,000 EUR/sqm threshold. Relatively large differences in prices in the most expensive cities in the publication might indicate that these cities are the most attractive on their home markets and in Europe as a whole and they attract people from all around the world, which pushes housing prices higher.
Among central European cities, Prague was the most expensive in terms of purchasing a new dwelling in 2019 with 3,395 EUR/sqm. Bratislava places second by over 500 EUR (2,805 EUR/sqm).
Niš from Serbia and Varna and Burgas from Bulgaria were the only three cities with price levels below 1,000 EUR/sqm. A square meter of a new dwelling in Niš cost only 790 EUR and was the cheapest among the examined cities in 2019. Varna and Burgas recorded 837 EUR/sqm and 863 EUR/sqm respectively.
Six cities, Ghent in Belgium, Münich in Germany, Tel Aviv in Israel, Milan in Italy, Jurmala in Latvia and Barcelona in Spain were the most expensive cities in their respective countries, despite the fact that they are not capital cities.
In terms of year-on-year changes, prices in Bergen in Norway grew the most between 2018 and 2019, by 24.6%, followed by Porto with an increase of 20.1%. Another 15 cities recorded a double-digit growth last year.
On the other hand, prices decreased in eleven cities in the comparison. The deepest falls could be seen in Alicante (-9.3%) and Oslo (-9.0%).
The average price across all the examined cities was 3,758 EUR/sqm. From 67 cities, 26 had above average price level and 41 were below the average. Milan and Haifa were the closes to the average price with a deviation of 35 EUR/sqm and 68 EUR/sqm respectively.
Average transaction price of a new dwellingAnnual change%
Source: Deloitte national offices
* bid price ** older dwellings # detached houses
AT
Vienna 3.4% 4,868
Graz 2.1% 3,539
Linz 0.2% 3,992
BE*
Brussels 0.0% 3,350
Antwerp 3.8% 3,375
Ghent 9.4% 3,475
BA Sarajevo 13.7% 1,093
BG
Sofia -0.2% 1,088
Varna 0.7% 837
Burgas 2.7% 863
HR Zagreb 0.7% 1,731
CZ
Prague 10.2% 3,395
Brno 10.0% 2,500
Ostrava 1.8% 1,683
DN
Copenhagen 2.5% 6,235
Aarhus -4.7% 4,395
Odense 5.1% 3,368
FR
Paris -0.4% 12,863
Ile-de-France 3.3% 5,187
Lyon 4.7% 4,467
Marseille 9.2% 4,521
Lille 4.5% 3,516
DE
Berlin 10.0% 5,478
Hamburg 14.9% 5,745
Münich 5.8% 8,250
Frankfurt 13.2% 6,960
HU
Budapest 13.7% 2,107
Győr 14.5% 1,368
Debrecen 14.1% 1,266
IE
Dublin -1.8% 2,381
Cork 0.9% 1,774
Galway 0.0% 1,853
IL
Tel Aviv 9.4% 9,769
Jerusalem 16.7% 6,212
Haifa 5.0% 3,832
IT
Milan 2.5% 3,729
Rome -1.8% 3,259
Turin -0.3% 1,947
LVRiga -3.1% 1,690
Jurmala -3.5% 2,265
LU
Luxembourg City 8.1% 9,565
Esch-sur-Alzette 15.3% 6,881
Differdange 12.6% 5,766
NL**
Amsterdam 3.5% 5,315
Rotterdam 8.4% 2,748
The Hague 7.3% 2,954
NR#
Oslo -9.0% 6,304
Bergen 24.6% 5,615
Trondheim 8.7% 5,033
PL
Warsaw 8.4% 2,115
Wroclaw 10.0% 1,731
Lodz 9.0% 1,360
Krakow 11.5% 1,813
PTLisbon 8.4% 3,908
Porto 20.1% 2,219
RS
Belgrade 2.4% 1,648
Novi Sad 8.4% 1,081
Niš 5.3% 790
SK*
Bratislava 13.0% 2,805
Banská Bystrica 9.9% 1,843
Košice 2.2% 1,720
ES*
Madrid 1.1% 4,394
Barcelona 5.5% 5,763
Alicante -9.3% 2,378
UK
London (inner) -0.2% 7,699
London (outer) 0.2% 5,732
Birmingham 0.7% 3,294
Manchester 4.9% 2,868
Property Index | 9th edition, July 2020
21
Property Index | 9th edition, July 2020
20
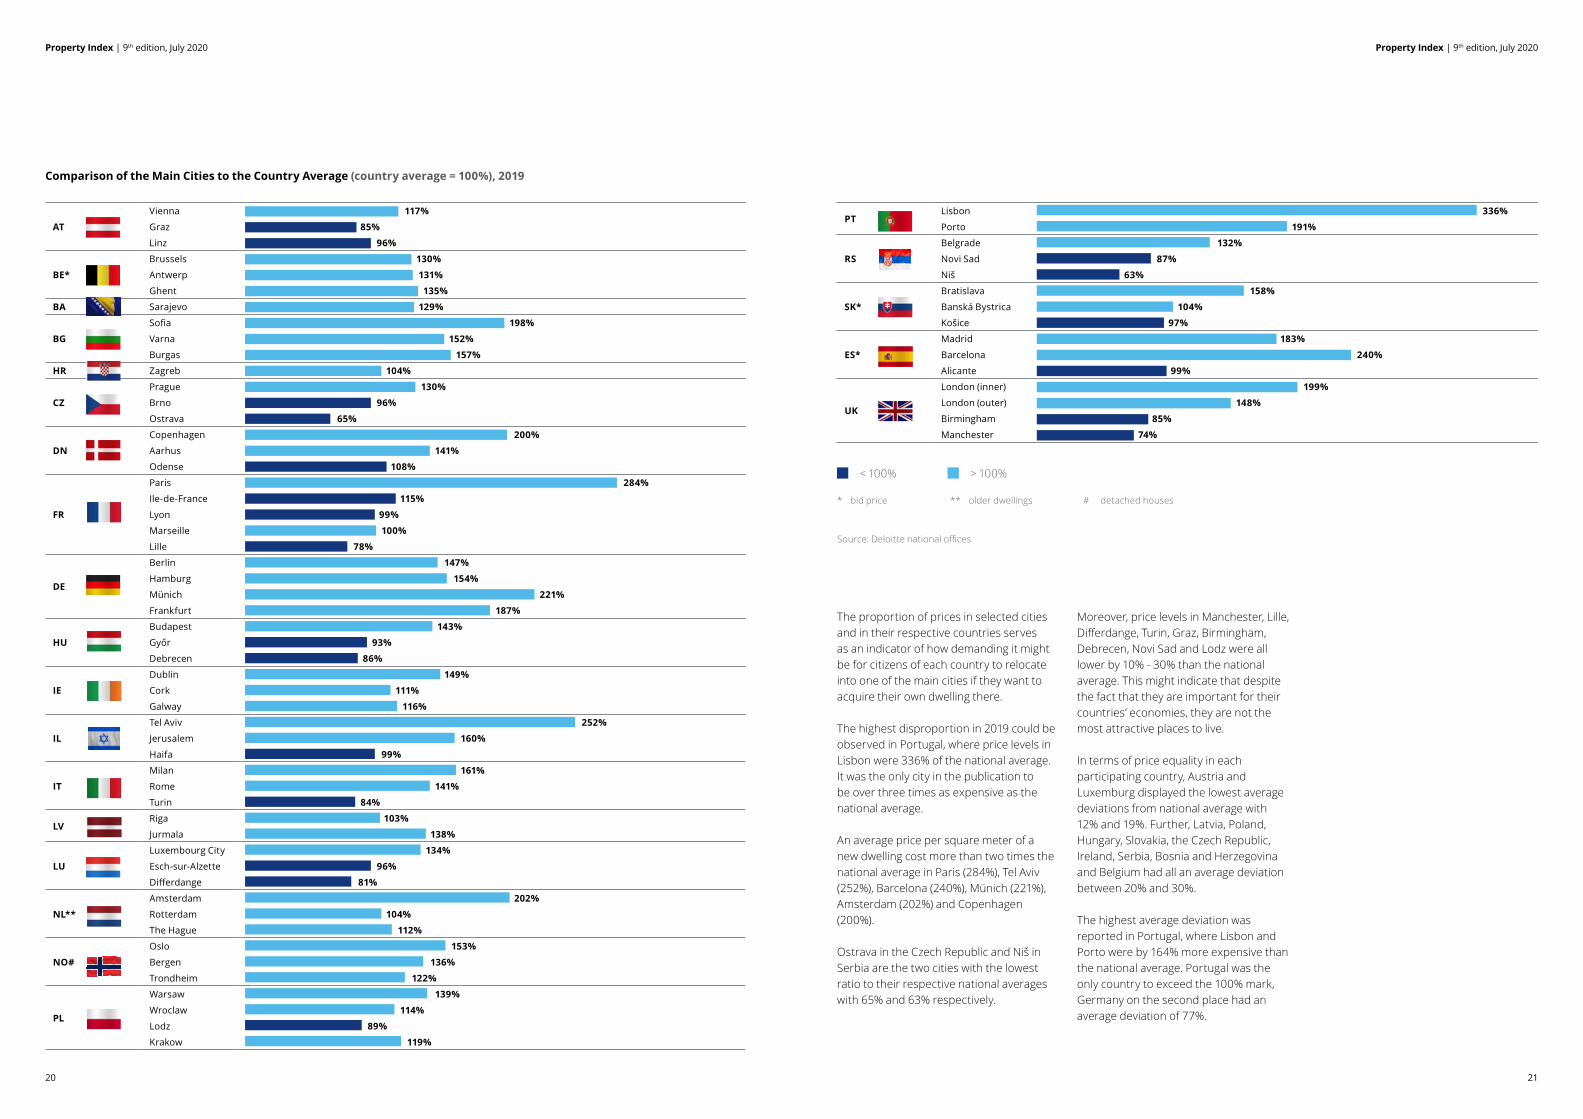
Comparison of the Main Cities to the Country Average (country average = 100%), 2019
The proportion of prices in selected cities and in their respective countries serves as an indicator of how demanding it might be for citizens of each country to relocate into one of the main cities if they want to acquire their own dwelling there.
The highest disproportion in 2019 could be observed in Portugal, where price levels in Lisbon were 336% of the national average. It was the only city in the publication to be over three times as expensive as the national average.
An average price per square meter of a new dwelling cost more than two times the national average in Paris (284%), Tel Aviv (252%), Barcelona (240%), Münich (221%), Amsterdam (202%) and Copenhagen (200%).
Ostrava in the Czech Republic and Niš in Serbia are the two cities with the lowest ratio to their respective national averages with 65% and 63% respectively.
Moreover, price levels in Manchester, Lille, Differdange, Turin, Graz, Birmingham, Debrecen, Novi Sad and Lodz were all lower by 10% - 30% than the national average. This might indicate that despite the fact that they are important for their countries’ economies, they are not the most attractive places to live.
In terms of price equality in each participating country, Austria and Luxemburg displayed the lowest average deviations from national average with 12% and 19%. Further, Latvia, Poland, Hungary, Slovakia, the Czech Republic, Ireland, Serbia, Bosnia and Herzegovina and Belgium had all an average deviation between 20% and 30%.
The highest average deviation was reported in Portugal, where Lisbon and Porto were by 164% more expensive than the national average. Portugal was the only country to exceed the 100% mark, Germany on the second place had an average deviation of 77%.
AT
Vienna 117%
Graz 85%
Linz 96%
BE*
Brussels 130%
Antwerp 131%
Ghent 135%
BA Sarajevo 129%
BG
Sofia 198%
Varna 152%
Burgas 157%
HR Zagreb 104%
CZ
Prague 130%
Brno 96%
Ostrava 65%
DN
Copenhagen 200%
Aarhus 141%
Odense 108%
FR
Paris 284%
Ile-de-France 115%
Lyon 99%
Marseille 100%
Lille 78%
DE
Berlin 147%
Hamburg 154%
Münich 221%
Frankfurt 187%
HU
Budapest 143%
Győr 93%
Debrecen 86%
IE
Dublin 149%
Cork 111%
Galway 116%
IL
Tel Aviv 252%
Jerusalem 160%
Haifa 99%
IT
Milan 161%
Rome 141%
Turin 84%
LVRiga 103%
Jurmala 138%
LU
Luxembourg City 134%
Esch-sur-Alzette 96%
Differdange 81%
NL**
Amsterdam 202%
Rotterdam 104%
The Hague 112%
NO#
Oslo 153%
Bergen 136%
Trondheim 122%
PL
Warsaw 139%
Wroclaw 114%
Lodz 89%
Krakow 119%
Source: Deloitte national offices
* bid price ** older dwellings # detached houses
> 100% < 100%
PTLisbon 336%
Porto 191%
RS
Belgrade 132%
Novi Sad 87%
Niš 63%
SK*
Bratislava 158%
Banská Bystrica 104%
Košice 97%
ES*
Madrid 183%
Barcelona 240%
Alicante 99%
UK
London (inner) 199%
London (outer) 148%
Birmingham 85%
Manchester 74%
Property Index | 9th edition, July 2020
23
Property Index | 9th edition, July 2020
22
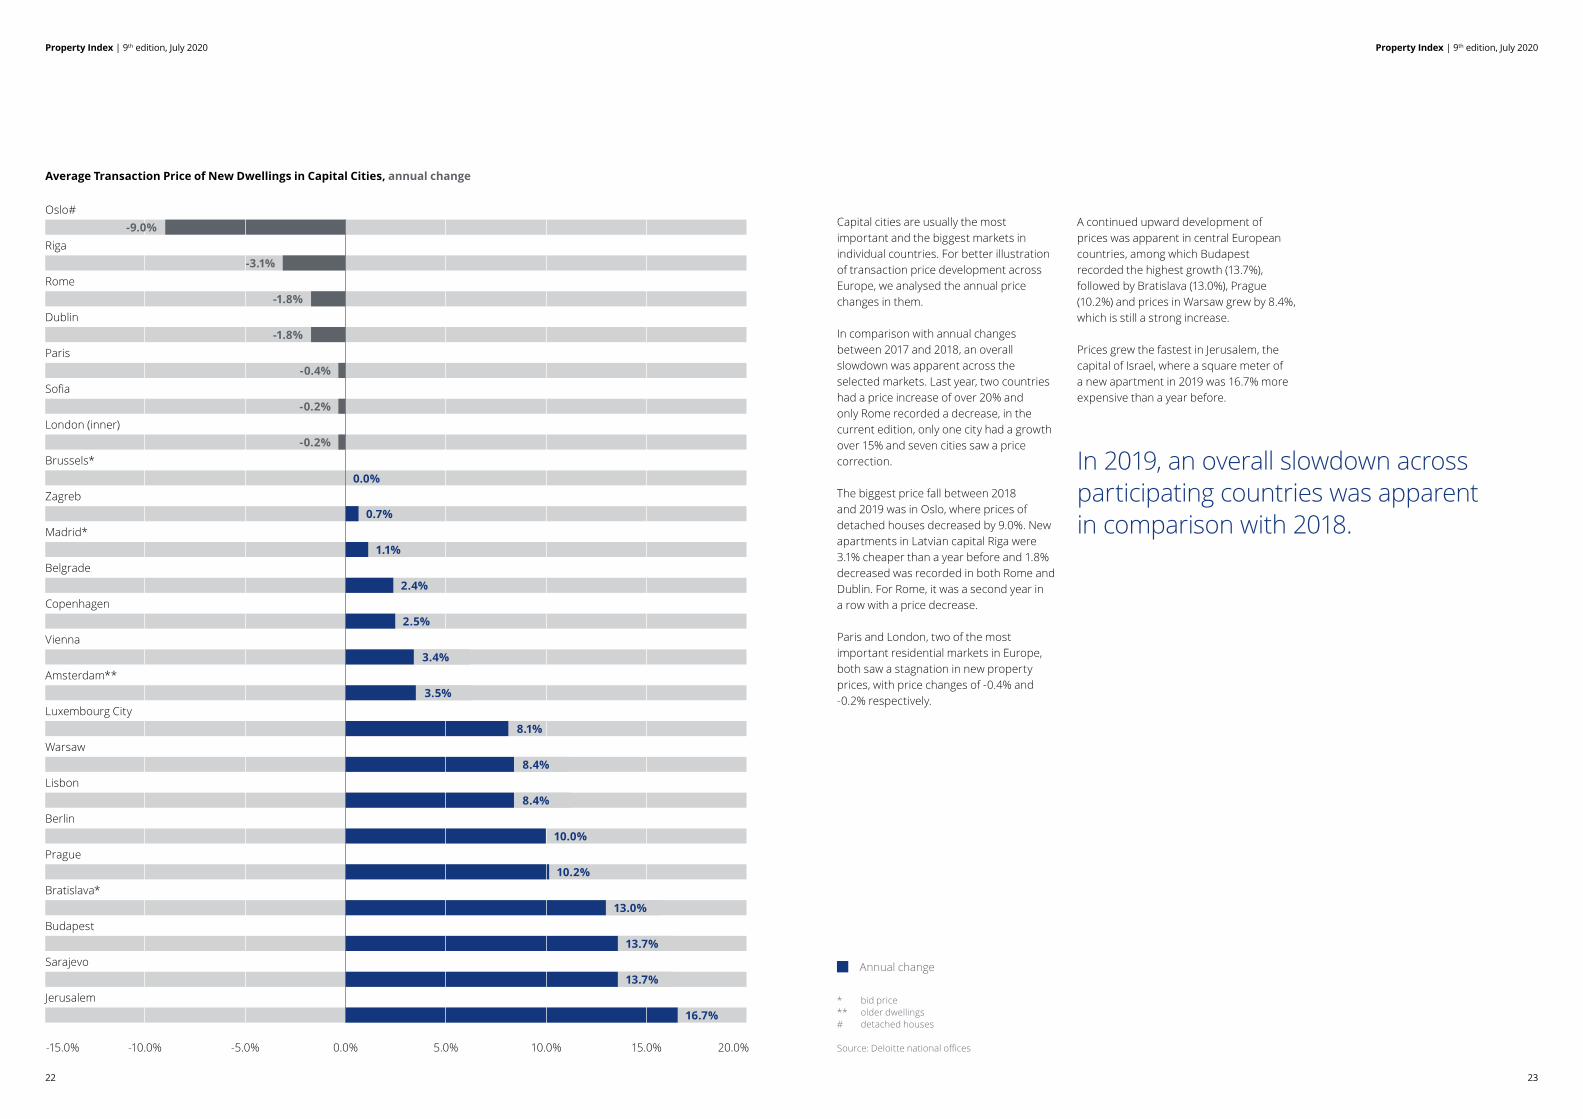
Capital cities are usually the most important and the biggest markets in individual countries. For better illustration of transaction price development across Europe, we analysed the annual price changes in them.
In comparison with annual changes between 2017 and 2018, an overall slowdown was apparent across the selected markets. Last year, two countries had a price increase of over 20% and only Rome recorded a decrease, in the current edition, only one city had a growth over 15% and seven cities saw a price correction.
The biggest price fall between 2018 and 2019 was in Oslo, where prices of detached houses decreased by 9.0%. New apartments in Latvian capital Riga were 3.1% cheaper than a year before and 1.8% decreased was recorded in both Rome and Dublin. For Rome, it was a second year in a row with a price decrease.
Paris and London, two of the most important residential markets in Europe, both saw a stagnation in new property prices, with price changes of -0.4% and -0.2% respectively.
A continued upward development of prices was apparent in central European countries, among which Budapest recorded the highest growth (13.7%), followed by Bratislava (13.0%), Prague (10.2%) and prices in Warsaw grew by 8.4%, which is still a strong increase.
Prices grew the fastest in Jerusalem, the capital of Israel, where a square meter of a new apartment in 2019 was 16.7% more expensive than a year before.
Average Transaction Price of New Dwellings in Capital Cities, annual change
* bid price** older dwellings# detached houses
Source: Deloitte national offices
Oslo#
Riga
Rome
Dublin
Paris
Sofia
London (inner)
Brussels*
Zagreb
Madrid*
Belgrade
Copenhagen
Vienna
Amsterdam**
Luxembourg City
Warsaw
Lisbon
Berlin
Prague
Bratislava*
Budapest
Sarajevo
Jerusalem
Annual change
0.0%
0.7%
1.1%
2.4%
2.5%
10.0%
10.2%
16.7%
-3.1%
-1.8%
-1.8%
-0.4%
-0.2%
-0.2%
15.0%-15.0% 10.0%-10.0% 5.0%-5.0% 0.0% 20.0%
8.1%
3.4%
3.5%
-9.0%
8.4%
8.4%
13.0%
13.7%
13.7%
In 2019, an overall slowdown across participating countries was apparent in comparison with 2018.
25
Property Index | 9th edition, July 2020
24
Property Index | 9th edition, July 2020
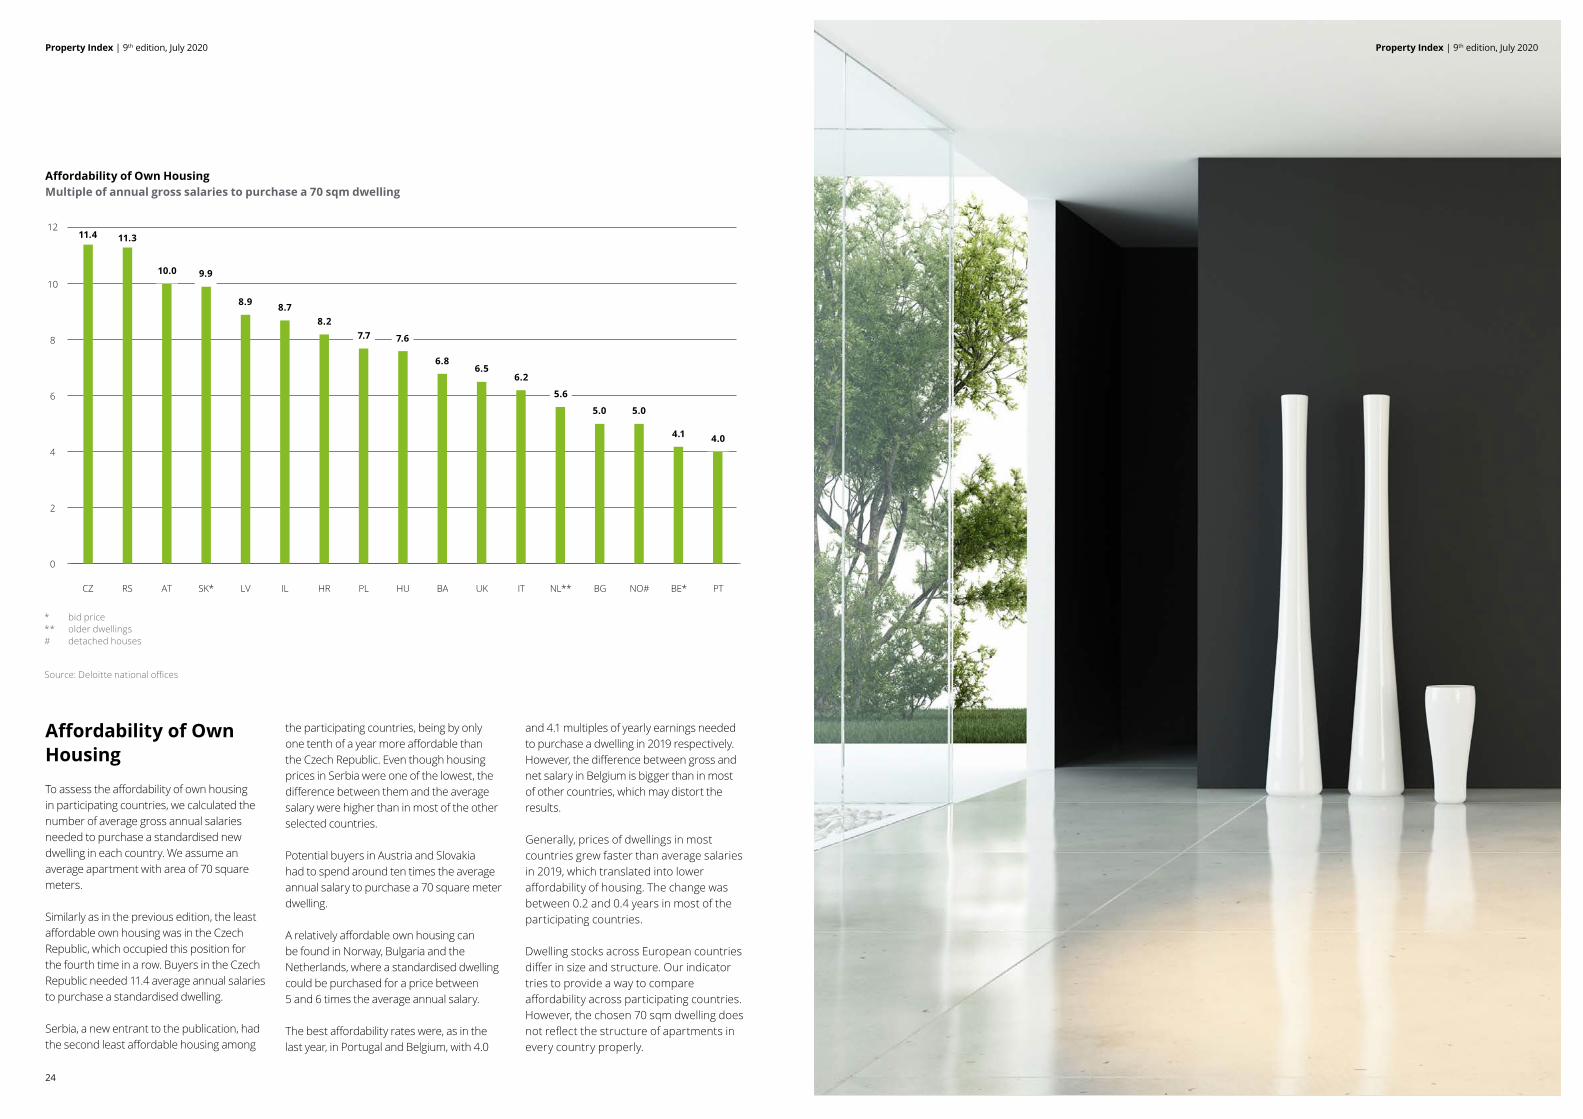
Affordability of Own HousingMultiple of annual gross salaries to purchase a 70 sqm dwelling
Affordability of Own Housing
To assess the affordability of own housing in participating countries, we calculated the number of average gross annual salaries needed to purchase a standardised new dwelling in each country. We assume an average apartment with area of 70 square meters.
Similarly as in the previous edition, the least affordable own housing was in the Czech Republic, which occupied this position for the fourth time in a row. Buyers in the Czech Republic needed 11.4 average annual salaries to purchase a standardised dwelling.
Serbia, a new entrant to the publication, had the second least affordable housing among
the participating countries, being by only one tenth of a year more affordable than the Czech Republic. Even though housing prices in Serbia were one of the lowest, the difference between them and the average salary were higher than in most of the other selected countries.
Potential buyers in Austria and Slovakia had to spend around ten times the average annual salary to purchase a 70 square meter dwelling.
A relatively affordable own housing can be found in Norway, Bulgaria and the Netherlands, where a standardised dwelling could be purchased for a price between 5 and 6 times the average annual salary.
The best affordability rates were, as in the last year, in Portugal and Belgium, with 4.0
and 4.1 multiples of yearly earnings needed to purchase a dwelling in 2019 respectively. However, the difference between gross and net salary in Belgium is bigger than in most of other countries, which may distort the results.
Generally, prices of dwellings in most countries grew faster than average salaries in 2019, which translated into lower affordability of housing. The change was between 0.2 and 0.4 years in most of the participating countries.
Dwelling stocks across European countries differ in size and structure. Our indicator tries to provide a way to compare affordability across participating countries. However, the chosen 70 sqm dwelling does not reflect the structure of apartments in every country properly.
Source: Deloitte national offices
0
2
4
6
8
10
12
14
0
2
4
6
8
10
12
14
0%
40%
80%
120%
160%
200%
0%
1%
2%
3%
4%
5%
0
100
200
300
400
500
600
700
0
2
4
6
8
10
CZ RS AT SK* LV IL HR PL HU BA UK IT NL** BG NO# BE* PT
* bid price** older dwellings# detached houses
11.4 11.3
10.0 9.9
8.9 8.78.2
7.7 7.6
6.86.5
6.2
5.6
5.0 5.0
4.1 4.0
Property Index | 9th edition, July 2020
27
Property Index | 9th edition, July 2020
26
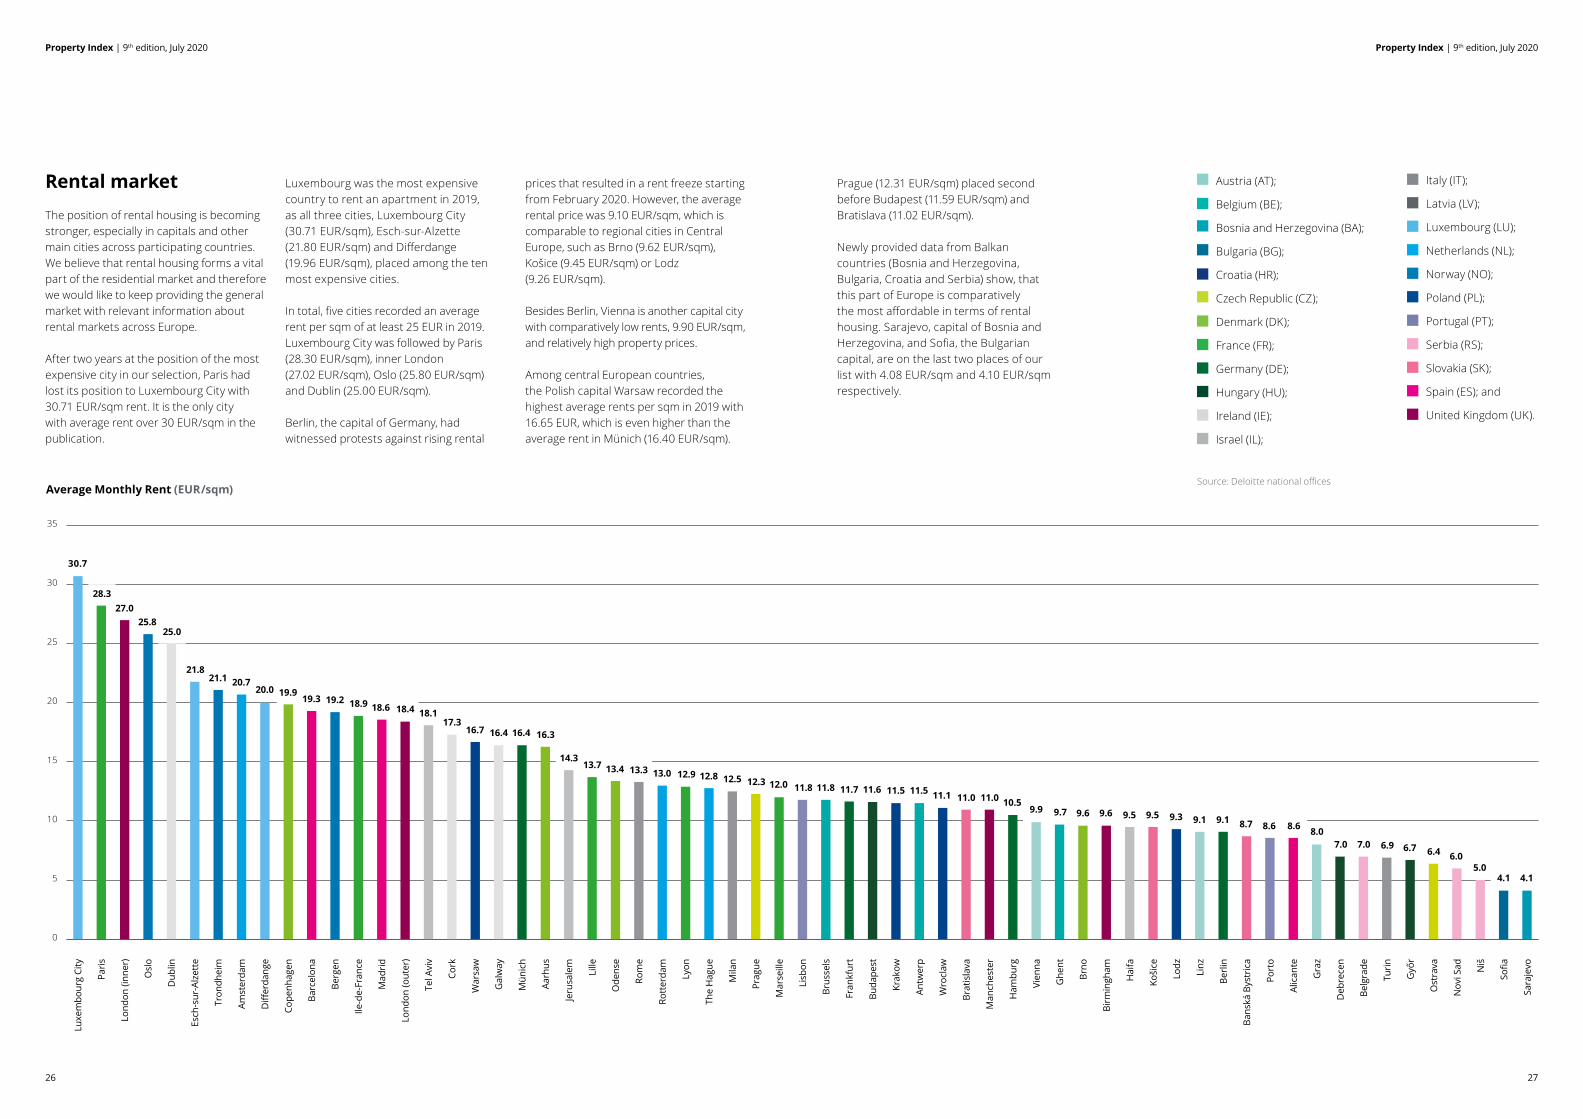
Rental marketThe position of rental housing is becoming stronger, especially in capitals and other main cities across participating countries. We believe that rental housing forms a vital part of the residential market and therefore we would like to keep providing the general market with relevant information about rental markets across Europe.
After two years at the position of the most expensive city in our selection, Paris had lost its position to Luxembourg City with 30.71 EUR/sqm rent. It is the only city with average rent over 30 EUR/sqm in the publication.
Luxembourg was the most expensive country to rent an apartment in 2019, as all three cities, Luxembourg City (30.71 EUR/sqm), Esch-sur-Alzette (21.80 EUR/sqm) and Differdange (19.96 EUR/sqm), placed among the ten most expensive cities.
In total, five cities recorded an average rent per sqm of at least 25 EUR in 2019. Luxembourg City was followed by Paris (28.30 EUR/sqm), inner London (27.02 EUR/sqm), Oslo (25.80 EUR/sqm) and Dublin (25.00 EUR/sqm).
Berlin, the capital of Germany, had witnessed protests against rising rental
prices that resulted in a rent freeze starting from February 2020. However, the average rental price was 9.10 EUR/sqm, which is comparable to regional cities in Central Europe, such as Brno (9.62 EUR/sqm), Košice (9.45 EUR/sqm) or Lodz (9.26 EUR/sqm).
Besides Berlin, Vienna is another capital city with comparatively low rents, 9.90 EUR/sqm, and relatively high property prices.
Among central European countries, the Polish capital Warsaw recorded the highest average rents per sqm in 2019 with 16.65 EUR, which is even higher than the average rent in Münich (16.40 EUR/sqm).
Average Monthly Rent (EUR/sqm)
Prague (12.31 EUR/sqm) placed second before Budapest (11.59 EUR/sqm) and Bratislava (11.02 EUR/sqm).
Newly provided data from Balkan countries (Bosnia and Herzegovina, Bulgaria, Croatia and Serbia) show, that this part of Europe is comparatively the most affordable in terms of rental housing. Sarajevo, capital of Bosnia and Herzegovina, and Sofia, the Bulgarian capital, are on the last two places of our list with 4.08 EUR/sqm and 4.10 EUR/sqm respectively.
Luxe
mbo
urg
City
Paris
Lond
on (i
nner
)
Osl
o
Dub
lin
Esch
-sur
-Alz
ette
Tron
dhei
m
Amst
erda
m
Diff
erda
nge
Cope
nhag
en
Barc
elon
a
Berg
en
Ile-d
e-Fr
ance
Mad
rid
Lond
on (o
uter
)
Tel A
viv
Cork
War
saw
Gal
way
Mün
ich
Aarh
us
Jeru
sale
m
Lille
Ode
nse
Rom
e
Rott
erda
m
Lyon
The
Hag
ue
Mila
n
Prag
ue
Mar
seill
e
Lisb
on
Brus
sels
Fran
kfur
t
Buda
pest
Krak
ow
Antw
erp
Wro
claw
Brat
isla
va
Man
ches
ter
Ham
burg
Vien
na
Ghe
nt
Brno
Birm
ingh
am
Hai
fa
Koši
ce
Lodz
Linz
Berli
n
Bans
ká B
ystr
ica
Port
o
Alic
ante
Gra
z
Deb
rece
n
Belg
rade
Turin
Győ
r
Ost
rava
Nov
i Sad Niš
Sofia
Sara
jevo
0
5
10
15
20
25
30
35
Source: Deloitte national offices
Austria (AT);
Belgium (BE);
Bosnia and Herzegovina (BA);
Bulgaria (BG);
Croatia (HR);
Czech Republic (CZ);
Denmark (DK);
France (FR);
Germany (DE);
Hungary (HU);
Ireland (IE);
Israel (IL);
Italy (IT);
Latvia (LV);
Luxembourg (LU);
Netherlands (NL);
Norway (NO);
Poland (PL);
Portugal (PT);
Serbia (RS);
Slovakia (SK);
Spain (ES); and
United Kingdom (UK).
30.7
28.327.0
25.825.0
21.821.1 20.7
20.0 19.919.3 19.2 18.9 18.6 18.4 18.1
17.316.7 16.4 16.4 16.3
14.313.7 13.4 13.3 13.0 12.9 12.8 12.5 12.3 12.0 11.8 11.8 11.7 11.6 11.5 11.5 11.1 11.0 11.0 10.5
9.9 9.7 9.6 9.6 9.5 9.5 9.3 9.1 9.1 8.7 8.6 8.6 8.07.0 7.0 6.9 6.7 6.4 6.0
5.04.1 4.1
29
Property Index | 9th edition, July 2020
28
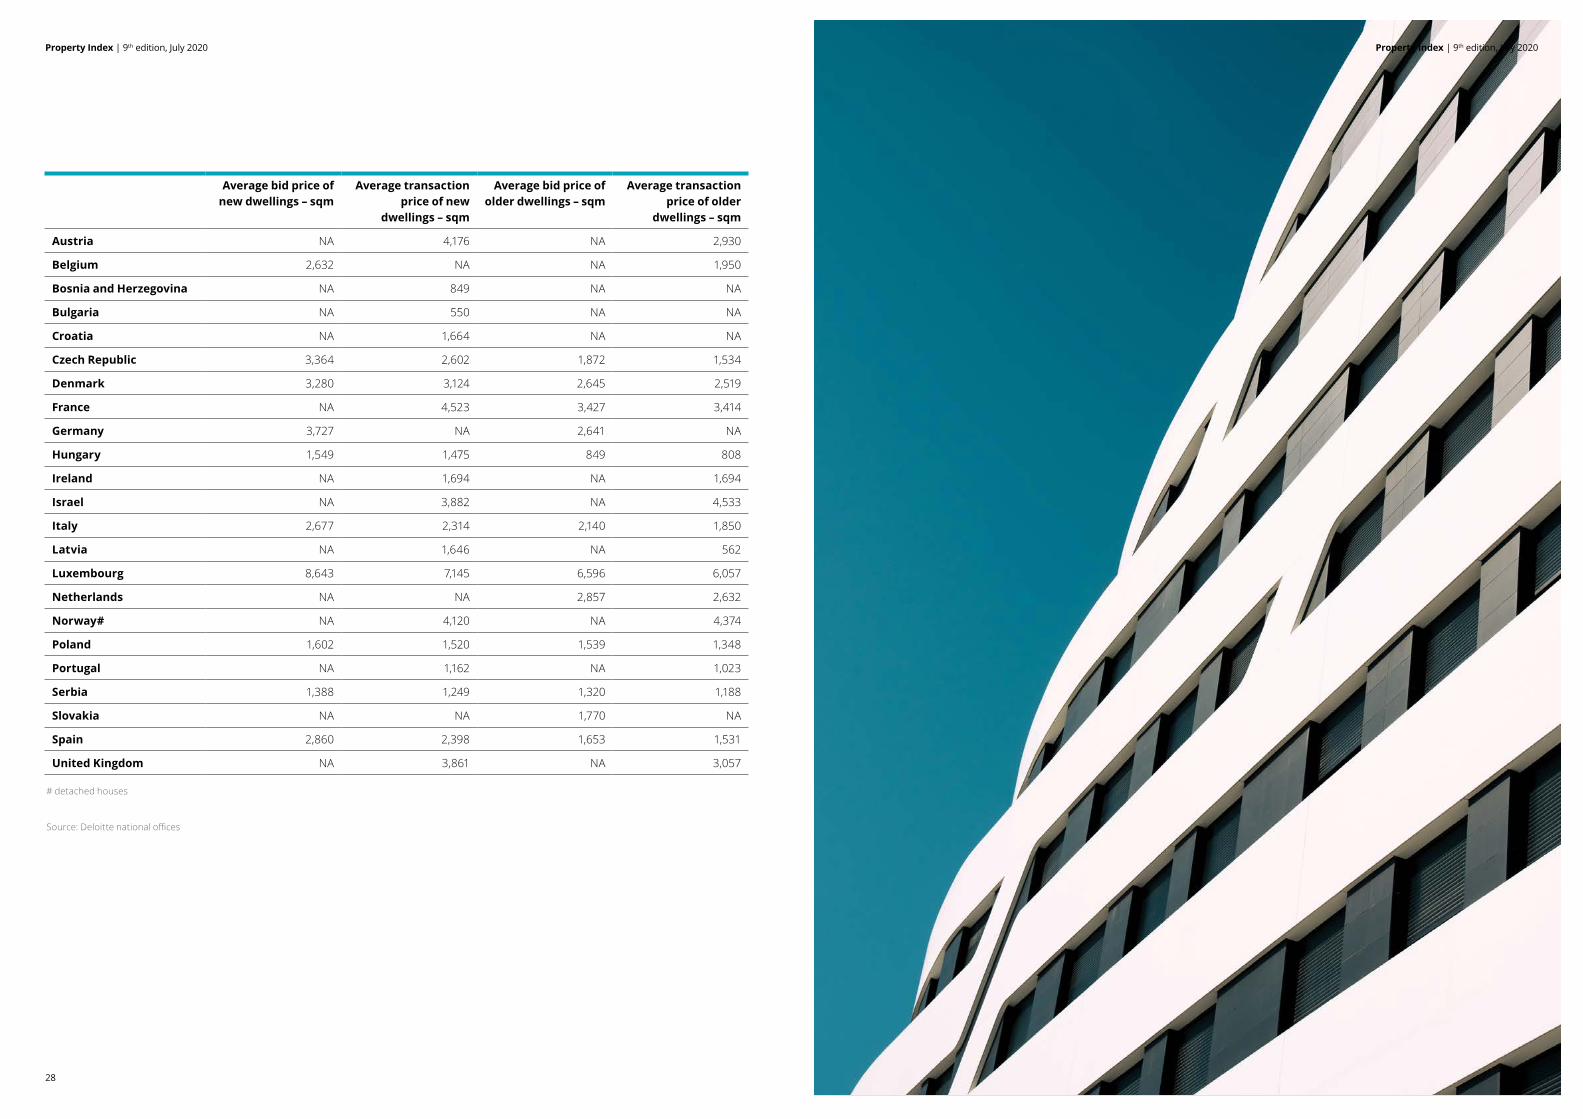
Average bid price of new dwellings – sqm
Average transaction price of new
dwellings – sqm
Average bid price of older dwellings – sqm
Average transaction price of older
dwellings – sqm
Austria NA 4,176 NA 2,930
Belgium 2,632 NA NA 1,950
Bosnia and Herzegovina NA 849 NA NA
Bulgaria NA 550 NA NA
Croatia NA 1,664 NA NA
Czech Republic 3,364 2,602 1,872 1,534
Denmark 3,280 3,124 2,645 2,519
France NA 4,523 3,427 3,414
Germany 3,727 NA 2,641 NA
Hungary 1,549 1,475 849 808
Ireland NA 1,694 NA 1,694
Israel NA 3,882 NA 4,533
Italy 2,677 2,314 2,140 1,850
Latvia NA 1,646 NA 562
Luxembourg 8,643 7,145 6,596 6,057
Netherlands NA NA 2,857 2,632
Norway# NA 4,120 NA 4,374
Poland 1,602 1,520 1,539 1,348
Portugal NA 1,162 NA 1,023
Serbia 1,388 1,249 1,320 1,188
Slovakia NA NA 1,770 NA
Spain 2,860 2,398 1,653 1,531
United Kingdom NA 3,861 NA 3,057
# detached houses
Source: Deloitte national offices
Property Index | 9th edition, July 2020
Property Index | 9th edition, July 2020
31
Property Index | 9th edition, July 2020
30
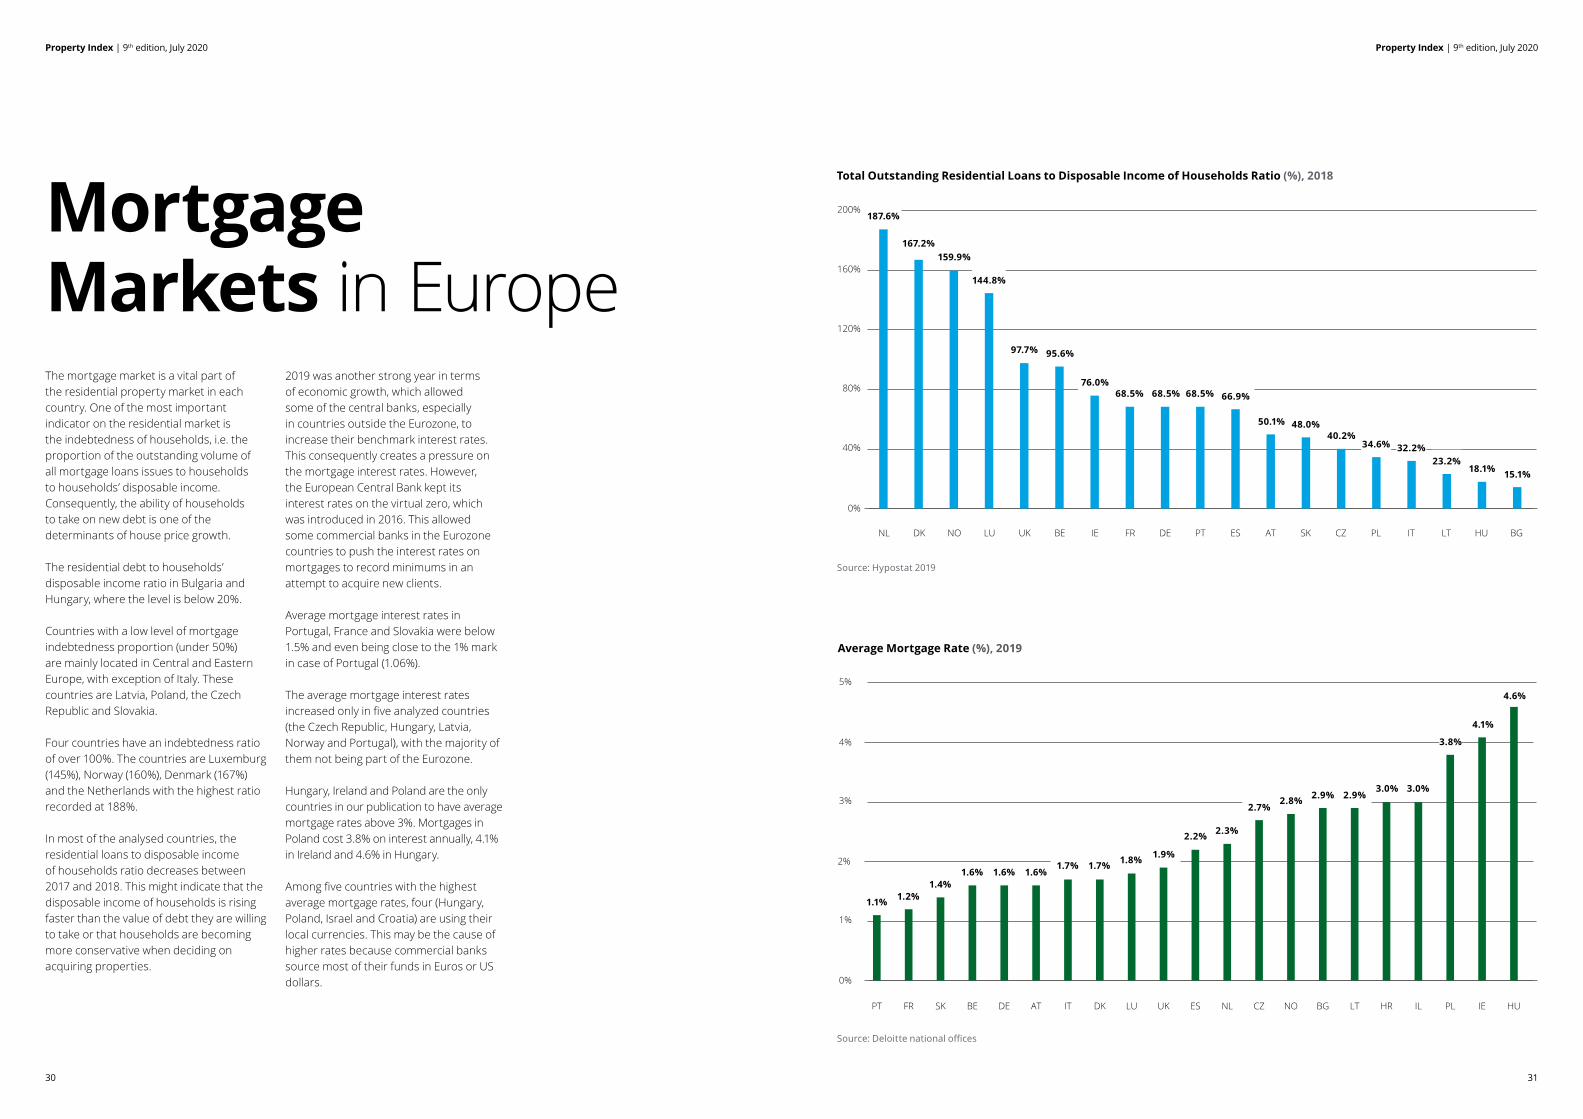
The mortgage market is a vital part of the residential property market in each country. One of the most important indicator on the residential market is the indebtedness of households, i.e. the proportion of the outstanding volume of all mortgage loans issues to households to households’ disposable income. Consequently, the ability of households to take on new debt is one of the determinants of house price growth.
The residential debt to households’ disposable income ratio in Bulgaria and Hungary, where the level is below 20%.
Countries with a low level of mortgage indebtedness proportion (under 50%) are mainly located in Central and Eastern Europe, with exception of Italy. These countries are Latvia, Poland, the Czech Republic and Slovakia.
Four countries have an indebtedness ratio of over 100%. The countries are Luxemburg (145%), Norway (160%), Denmark (167%) and the Netherlands with the highest ratio recorded at 188%.
In most of the analysed countries, the residential loans to disposable income of households ratio decreases between 2017 and 2018. This might indicate that the disposable income of households is rising faster than the value of debt they are willing to take or that households are becoming more conservative when deciding on acquiring properties.
2019 was another strong year in terms of economic growth, which allowed some of the central banks, especially in countries outside the Eurozone, to increase their benchmark interest rates. This consequently creates a pressure on the mortgage interest rates. However, the European Central Bank kept its interest rates on the virtual zero, which was introduced in 2016. This allowed some commercial banks in the Eurozone countries to push the interest rates on mortgages to record minimums in an attempt to acquire new clients.
Average mortgage interest rates in Portugal, France and Slovakia were below 1.5% and even being close to the 1% mark in case of Portugal (1.06%).
The average mortgage interest rates increased only in five analyzed countries (the Czech Republic, Hungary, Latvia, Norway and Portugal), with the majority of them not being part of the Eurozone.
Hungary, Ireland and Poland are the only countries in our publication to have average mortgage rates above 3%. Mortgages in Poland cost 3.8% on interest annually, 4.1% in Ireland and 4.6% in Hungary.
Among five countries with the highest average mortgage rates, four (Hungary, Poland, Israel and Croatia) are using their local currencies. This may be the cause of higher rates because commercial banks source most of their funds in Euros or US dollars.
Mortgage Markets in Europe
Source: Hypostat 2019
Total Outstanding Residential Loans to Disposable Income of Households Ratio (%), 2018
Source: Deloitte national offices
Average Mortgage Rate (%), 2019
0
2
4
6
8
10
12
14
0
2
4
6
8
10
12
14
0%
40%
80%
120%
160%
200%
0%
1%
2%
3%
4%
5%
0
100
200
300
400
500
600
700
0
2
4
6
8
10
NL DK NO LU UK BE IE FR DE PT ES AT SK CZ PL IT LT HU BG
187.6%
1.1% 1.2%1.4%
1.6% 1.6% 1.6%
167.2%159.9%
144.8%
97.7% 95.6%
76.0%68.5% 68.5% 68.5% 66.9%
50.1% 48.0%40.2%
34.6% 32.2%23.2%
18.1% 15.1%
0
2
4
6
8
10
12
14
0
2
4
6
8
10
12
14
0%
40%
80%
120%
160%
200%
0%
1%
2%
3%
4%
5%
0
100
200
300
400
500
600
700
0
2
4
6
8
10
PT FR SK BE DE AT IT DK LU UK ES NL CZ NO BG LT HR IL PL IE HU
1.7% 1.7% 1.8% 1.9%
2.2% 2.3%
2.7%2.8% 2.9% 2.9%
4.1%
3.0% 3.0%
3.8%
4.6%
3332
Property Index | 9th edition, July 2020Property Index | 9th edition, July 2020
Belgium
AustriaIn 2019, the land register recorded approximately 49,832 sold apartments. The transaction value of the residential properties sold amounted to approximately 12 bn. EUR, which represents an increase of 6.5% over the previous year. Vienna accounted for 29% of all apartment sales with a value share of approx. 35%.
Especially in Vienna, also the amount of newly constructed residential buildings exceeded the values of the previous years. The upward trend in purchase prices and rents on the Austrian residential property market continued in 2019. In particular, in urban areas, the demand for additional living space
continues to exceed the supply despite somewhat slower population growth. The increase in purchase prices can furthermore be attributed to the interest rate level and rising construction costs.
In Vienna, a change in the zoning provisions under the building Code led to lasting uncertainty among developers. In the case of rezoning of "rural" land into land zoned for residential buildings, two-thirds of the resulting living space must be publicly subsidized (or at least eligible for subsidy) if the target living space exceeds 5,000 square meters. This has a substantial effect on profitability, as the net rent for subsidized properties may not exceed five euros per square
meter, and the property may not be sold for a period of 40 years. Moreover, the change of the zoning provisions resulted in an increased number of subsidized constructions of residential properties, so that the number of subsidized rental apartments exceeded freely financed rental apartments.
The possibilities of compensating rising square meter prices and rents by reducing the size of the apartments appear to have been exhausted. However, as long as prices remain high, there will not be a trend shift towards larger apartments.
Although the increasing risk of various factors in the residential property market such as tax implications, rising interest rates and political and/or environmental changes, 2018 was followed by another record-breaking year. 2019 became the year in which the Belgian citizens were the most active ever. The number of transactions rose by an impressive 9% (including both houses and apartments). Also, the residential real estate prices recorded a notable increase of 4%, with the most pronounced increase in the sector of normal houses. Rents followed a similar trend, with especially a substantial increase in the Brussels Capital Region of more than 6%. These increases are all significantly higher than the inflation of around +1.4%, which is no surprise. It was also a record year for the number of mortgage loans. Even though, the BNB/NBB restricted the leverage ratio for investment real estate to 80% and imposed more regulations on granting mortgage loans, with €46.2 billion (including refinancing), the amount
granted increased by approximately 24% compared to 2018. However, the number of building permits fell by approximately 10% in 2019, partly because the increase in the number of dwellings in recent years was considerably higher than population growth.
The remarkable increase in the number of transactions is due to several aspects. On the one hand, the sustainability standards for rental homes became much stricter. As a result, the necessary adaptations, particularly in older apartments in the lower segment, became a capital-intensive matter. This resulted in owners selling their properties rather than renovating them. On the other hand, it was mainly the suppression of the ‘housing bonus’ (the tax advantage of owning a house) end of 2019 in Flanders that had the greatest impact on the number of transactions. In the last quarter of 2019, the number of transactions increased by 25%, with even a temporary peak of 122% during the
autumn holidays, compared to the same period last year. However, the expected decline in property prices due to the scrapping of the ‘housing bonus’ will be minimal compared to the consequences of the current health crisis. Furthermore, the so called ‘concrete stop’ (putting a halt on consuming unconstructed spaces) that was discussed in 2018 was suspended in 2019 and transformed into a vague ‘concrete shift’, with no or limited expected impact in the medium term.
In addition to these causes, the low interest rates, confirmed by the ECB to remain this low in the upcoming years, ensured that the property market remained an interesting and stable investment landscape. Unemployment rates continued to fall compared to 2018 and the possible increase in tax rates on home ownership also failed to materialize. From a political perspective, this will most likely not change in the short term now the government is concerned with the current health crisis.
Annex:Comments on Residential Markets

3534
Property Index | 9th edition, July 2020Property Index | 9th edition, July 2020
Czech Republic
Bulgaria
Croatia
Bosnia and Herzegovina
During 2019, residential property prices in Croatia continued to follow an increasing trend as new dwellings recorded a 7.6% price increase compared to 2018 on a country level (from 1,547 EUR to 1,664 EUR). Residential property market in Croatia has been centered around the country’s capital (Zagreb) and the coast, with prices in these areas showing significant deviation from the
country’s average. In 2018, average price per sqm for new dwellings in Zagreb was 11.2% higher than the country average, which decreased to 4.0% in 2019.
Apart from the continued RE price increase trend in 2019, the increasing supply trend has also been clear as newly started dwellings (expressed as the number of newly issued building permits)
have increased by 30.9%, from 11,586 in 2018 to 15,162 in 2019. This supply increase could have implications to the RE price movement in 2020 if demand levels start to shrink.
Price growth drivers:
1. Croatia recorded a continued GDP growth around 3% yearly since 2015, while GDP per capita has increased
Residential market gained additional momentum in 2019, continuing to follow the strong growth curve from 2018. The main factors behind the positive development have been lower interest rates on saving accounts and personal
mortgage loans, fewer initiated new residential projects, and favorable economic conditions in European countries, where the most of the BiH diaspora work and live. Prices rose in average by 5–10% compared to 2018.
The year 2019 on the Czech residential market was marked by a continuing rise in apartment prices. Although the cooling in the number of realized transactions was noticeable, especially in connection with the applied regulatory measures concerning housing financing, the expected and often mentioned price corrections did not occur. There was no reason for them, as the demand for owner-occupied housing, especially in large Czech cities, remained strong. Only the growth dynamics has adjusted, hence housing prices have not risen as sharply as in the previous three years.
Transaction prices grew year-on-year in almost all regional cities in the Czech Republic. From the perspective of individual market segments, transaction prices of apartments rose the most in older buildings. At the level of the
entire Czech Republic, sales prices of apartments in development increased by 15.4%. Rising prices of apartments in Prague and Brno and their immediate vicinity are the main driving force of the growth. In new development, the increase has been slower, average transaction price grew by 8.6%.
Throughout 2019, the mortgage market was adjusting to the stricter CNB regulation and recorded the worst results in five years. Compared to 2018, the total number of provided mortgage loans decreased by more than 22% to 77,388 contracts. Rising real estate prices prevented volumes from falling as much as the number of contracts, yet the total volume of provided mortgages fell by 16.9% to 181.6 bn. CZK. The volume-bound average interest rate increased to 2.68%.
2020 was expected to be similar to 2019, in terms of both development of apartment prices and the number of transactions. However, this was only valid until March. In the week starting on 16th March 2020, many things have changed. The real estate world has stopped day by day as fast as the coronavirus pandemic started. Along with the development market, the supply and sales part of the second-hand real estate market gradually hibernated. Further development of the residential real estate market will depend mainly on how long the economy will be artificially subdued and at the same time, what proposals of administrative changes the government will introduce.
The nationwide house price index rose by 7.3% (3.6% inflation-adjusted) during the year to Q1 2019, following y-o-y rises of 5.5% in Q4 2018, 6.3% in Q3, 7.5% in Q2 and 7.1% in Q1, according to the National Statistical Institute (NSI). During the latest quarter, house prices increased 2.6% (1.4% inflation-adjusted) in Q1 2019.
Prices of new dwellings rose by 11.9% (8% inflation-adjusted) during the year to Q1 2019, sharply up from the previous year’s 2.3% y-o-y rise. During the latest quarter, prices of new dwellings increased by 5.7% (4.4% inflation-adjusted). Prices of existing dwellings rose by 5% (1.3% inflation-adjusted) in Q1 2019 from a year earlier, lower than the 9.7% y-o-y growth in Q1 2018. Quarter-on-quarter, existing house prices increased by 1.1% (-0.1% inflation-adjusted).
The almost zero interest rates on bank deposits have encouraged people to invest in real estate, and encouraged purchases of pre-construction residential property. Sofia, Bulgaria’s capital, saw an overall house price increase of 9.5% y-o-y in Q1 2019. Prices for new dwellings rose strongly by 18.6% while existing dwellings saw a price increase of 5.3%.
In Plovdiv, the second largest city in Bulgaria, we saw house price rise by 7.1% during the year to Q1 2019. Prices of new dwellings increased by 12.6% while existing dwelling prices rose by 3.9%.
Varna, the largest city and seaside resort on the Black Sea Coast, recorded an overall house price rise of 4.1% during the year to Q1 2019. Over the same period, prices of new dwellings rose by 1.5%
while existing dwelling prices increased by 5.5%.
In Burgas, overall house prices rose by 8% during the year to Q1 2019. New dwelling prices rose by 9.6% while existing dwelling prices increased by 5.6%.
In Ruse, overall house prices rose by 3.3% in Q1 2019 from a year earlier. New dwelling prices increased by 4.6% while existing dwelling prices rose by 3.1%.
In Stara Zagora, overall house prices increased by 4.4% y-o-y in Q1 2019. New dwelling prices surged by 9% while existing dwelling prices rose by 2.9%
from 10,619 EUR in 2015 to 13,270 EUR in 2019. In the same period, average net salary in Croatia increased from 750 EUR in 2015 to 868 EUR in 2019 (+15.6%).
2. Interest rates for newly granted loans continued to fall in 2019 and shifted towards 3% during mid-2019. This is in line with the general interest rates' trends in the EU and globally and was one of the RE price increase drivers.
3. During the last few years, Croatia has recorded a strong tourism growth, with continued increase in arrivals and overnight stays. In 2018, total arrivals were 7.1% higher compared to 2017, while in 2019, further 4.8%
growth was recorded. In addition, revenue generated from tourism has increased by 6.4% in 2018 (total 10 bn. EUR recorded in 2018), while in 2019 8% growth is expected according to preliminary data. Positive tourism trends had significant impact on the RE market, being one of the price increase drivers. However, this effect is not equally spread throughout the country as coastal area and Zagreb city are the main beneficiaries of these trends.
Market specifics:Apart from the generally positive economic situation in Croatia in the last few years, one of the important drivers of the residential property price increase
was the Government housing subsidy program. According to the program, the government provides subsidy amounting to 30% to 50% of the monthly mortgage amount for people under 40 who are purchasing their first home. The subsidy is provided for 4 years and is extended by 2 years for each child born during the period. This program is effective since 2017 and becomes available once or twice per year for a one-month duration according to the government’s decision (usually September and March). Ever since it was introduced, this program has brought disruptions to the residential market, as prices tend to rise for the period when the subsidy gets announced and effective.
3736
Property Index | 9th edition, July 2020Property Index | 9th edition, July 2020
HungaryFrance
GermanyDenmarkRising rents, housing shortages and a great lack of social housing: The German housing market is tense. The country is undersupplied with affordable housing in the metropolitan areas. In the seven largest German cities between 2016 and 2018 less than three quarters of the apartments actually needed were completed. At the same time, there are many smaller districts concerned with an almost overturned construction of new houses and apartments. As there is a trend towards migration to the cities, especially for younger people, the demand in the big cities is increasing.
Therefore, price dynamics are no different in 2019 than in recent years: prices continue to rise, especially in the big cities, which are already expensive. The hoped-for deceleration did not occur in 2019. The price increase of real estate nationwide is around 8%, the prices for building plots have increased by around 11% and the condominiums have increased by 10–15%. The prices also show the divergence within Germany between the structurally weak regions with partly falling prices and the dynamic markets in metropolitan areas.
Overall, banks' private housing lending remained very cautious. No significantly more real estate housing loans were granted. The mortgage lending value of a property in Germany is still around 80 percent. However, there is an increasing spread of real estate financing in structurally weak regions, which in the event of a recession and due to the existing housing offers are prone to price collapses.
In general, 2019 was another good year for the Danish residential market, where high prices in major cities fueled increasing demand and development of new dwellings in other parts of Denmark. Despite a lower M&A volume for commercial and investment properties, the yield spread increased in 2019 due to decreasing interest rates on government bonds, making investments in real estate attractive. For logistics and office space, rental levels increased and expected return decreased for prime and secondary locations. The opposite trend was seen for retail due to online shopping. For residential properties, the
development depends on the location of the property. In general, buyers benefited from decreasing financing costs and high demand for apartments, in particular in Copenhagen, leading to increasing prices, whereas the development was more stable in Aarhus (#2) and Odense (#3). In 2019, there was an increasing concern and uncertainty about the impact of the new taxation model being developed by the Danish tax authorities. The new model has been postponed several times, and the impact is not yet known, which affects the appetite for acquiring residential properties, in particular in major cities.
In 2019, the Hungarian house prices continued to increase, although the number of transactions has started to decline for the first time in 6 years. There were approximately 10% less transactions in 2019 compared to 2018. One of the main drivers of the decline in the transaction numbers in the cities was the newly introduced Hungarian Government Bond Plus (Magyar Állampapír Plusz) which made the yields on the housing market less appealing for investors. In the small villages, however, the extension of the Hungarian Family Housing Support Program (CSOK) still could drive the housing market in 2019, which resulted in a slightly higher transaction numbers in villages than in 2018.
Despite the decreasing number of transaction, the residential price increase continued in 2019 in a year-on-year
comparison, which means that the transaction prices of new dwellings increased on average by 11.5%, while the older dwellings by 5.5%. The price level reached its peak in Q2 2019 and it has started to decline after it. The transaction market of new dwellings is characterized with strong concentration, as nearly 50% of all the new dwellings for sale in Hungary were built in five districts of Budapest and in 12 main cities in the countryside.
The Hungarian housing prices still show higher spatial heterogeneity and disparities between individual settlement types continued to increase in 2019. The difference between the average price level in Budapest and in the countryside continued to grow and exceeded the multiplier of 2.5.
In 2019, the number of completed dwellings increased by nearly 20%. However, the number of newly issued building permits declined by more than 4% compared to 2018. The main driver of increase in the growing housing supply in 2019 was the reduced VAT (5%) on housing transactions. However, in January 2020 the VAT was uplifted to 27%, hence the decreasing volume of started new dwellings.
The French residential market has been very dynamic in 2019, with more than one million transactions over the country, i.e. an 11% annual increase. This high level is supported by good access to financing, thanks to low-interest rate policy carried out by the European Central Bank (ECB).
However, these easy access conditions to mortgages could/should be affected by the recent announcements of the Haut Conseil de Stabilité Financière, which recommends limiting the mortgage effort rate (maximum 33%), and the mortgage duration (maximum of 25 years).
As of the residential construction sector, sales have been stable over 2019 with circa 130,000 sold housing units.
Regarding the transaction prices, they have increased over the last year by 3.7%. This upward trend is observed in the whole country for apartments: 6.6% in the Paris region, but also in other regions (increase of 4.9%). The province area -where the price increase has sped up- is driven by major cities, which benefitted from significant rise in price such as Nantes (13%), Lyon (12%), Rennes or Strasbourg (10% each). In Paris, the price per sqm reached 10,210 EUR in December 2019.
The price increase trend can also be observed on the rental market, showing the high rental demand (especially in large French cities). As a consequence, the appetite from investors should remain high, despite a more uncertain economic context.
3938
Property Index | 9th edition, July 2020Property Index | 9th edition, July 2020
Latvia
Israel
Italy
Ireland
In 2019, Italian GDP registered a growth of 0.3% compared to 1% reported for 2018. With respect to government debt, in 2019 the Government deficit narrowed to 1.6% of GDP from 2.2% of GDP in 2018 – the lowest government deficit to GDP achieved since 2007.
Residential household consumption expenditure grew by around 0.5% in 2019. The stabilization of unemployment and an increase in wages in the country supported the purchasing power of
households during the period. In turn, the unemployment rate slightly decreased in 2019 by around 1.3 p.p. from 10.5% in 2018 to 9.8% in 2019.
During 2019, the real estate sector in Italy remained essentially stable with an increase in demand in line with the increase in residential construction activity. Towards the end of 2019, the market outlook pre COVID ranged from general stability to continued improvement in the sector.
In terms of the number of transactions in residential real estate market the latest data available for 2018 reported around 580,000 transactions were made, an increase of around 10% compared to 2017 – this figure is expected to remain stable when the figures for 2019 are reported.
There remained a strong demand for residential housing in 2019, albeit in a relatively flat pricing environment, with low levels of price increases, and minimal transactional activity.
Institutional purchasers of residential (apartment) rental stock dominated the residential investment market with the majority of these purchasers contributing to build stock, along with a small quantum of development stock.
The rising rents continued to make it more difficult for first time buyers to save for deposits to meet the Central Banks mortgage lending criteria, permitting lending at 3.5 times the gross salary income, with deposits of 10%–30% required (first time buyers at 10%, second and subsequent buyers at 20%, and buy-to-let buyers at 30%). This thereby adversely affects the quantum of housing stock purchased.
There was an increase in construction, with a greater volume of residential units being delivered to the market, providing some respite in supply shortages to meet demand. Whilst the volume of units delivered, commenced and planning permissions granted were due to exceed the previous year’s volume, it is understood that output is still far below what is required, with the construction shortfall for 2019 alone estimated to be in the region approx. 15,000 units.
Latvian real estate sector keeps positive tendencies in its development. The residential real estate market have come closer to its equilibrium in 2019 with large number of commissioned buildings supported by steadily declining population.
During 2019, 21,205 apartments were sold in Latvia, including 9,840 in Riga, reflecting an increase of 2.6% and 6.8% in comparison to 2018 in Latvia and Riga respectively.
The demand on the residential market is determined by several factors. In accordance with immigration law, foreigners get a five-year residence permit in Latvia if they buy residential property with a value over 250 ths. EUR. Moreover, attractive rent yields and strong economic growth in Latvia up until Covid-19 outbreak improved business environment and contributed to high demand for residential real estate, which led to 2.3% increase in apartment prices compared to 2018.
According to Latvian information agency, supply of apartments in Riga went up in 2019 by 3% compared to 2018. Mortgage interest rates have slightly increased in comparison to 2018 mostly driven by Latvian economic growth.
Due to significant increase of prices over the last years, the government has implemented a program that subsidises land intended for apartment projects which are designated for young couples and those with low income. In 2018 and 2019, 20% of the new projects were under this program. Prices of apartments under
this program are 10–30% lower than similar non-subsidised apartments. As a result, prices are still going up but the curve has been flatter. Demand is still strong especially due to significant increase in population and stagnation in the increase of new started dwellings.
LuxembourgA low mortgage rates (below 2%), strong macroeconomic fundamentals and a very stable political environment drive the Luxembourg residential market. Record levels have been reached at the end of 2019 for Luxembourg residential real estate.
The Luxembourg residential market has been rising sharply especially since the beginning of 2010 (post financial crisis) with an annual average growth (price) of 5.7% over the period, mostly due to its rapidly growing economy and population
(explained by the significant immigration from European countries due to its dynamic labor market), coupled to a low interest rate environment. In Luxembourg City, the average apartment prices have risen from 4,400 EUR per sqm in 2010 to more than 9,000 EUR per sqm in 2019.
This increase in residential prices was quite homogenous across the different segments (older and new dwellings), but with a much stronger increase in urban areas than in rural areas (i.e. North and
West of the country). This suggests that land prices have affected heavily the price of new residential developments and consequently existing residential assets as well.
Between Q4 2018 and Q4 2019, Luxembourgish residential prices have increased by 11% in average. Prices have increased by 12.1% for existing apartments, by 12.4% for apartments under construction and by 9.1% for existing houses.
NetherlandsIn 2019, the GDP growth of the Netherlands was 1.7%, compared to 2.5% in 2018. The urbanisation rate keeps rising with people moving more and more to (big) cities. Amsterdam, being the capital and financial center of the Netherlands, is at the forefront of this trend. While the increase in the average transaction prices in Amsterdam (6.9%) has been slowing down, cities like Utrecht (9.7%), The Hague (9.2%) and Rotterdam (9.0%) have been catching up.
Furthermore, we have seen a decrease in the average mortgage interest rate from 2.4% in 2018 to 2.3% in 2019, further increasing the demand for dwellings and subsequently increasing the average transaction prices. While the current market conditions of increasing transaction prices still indicate a shortage of housing, the number of started dwellings is lower compared to last year. The decrease in started dwellings is mainly caused by additional
environmental regulations concerning nitrogen and other emissions, which caused numerous building projects to be postponed. In addition, 2019 saw rising construction costs and municipalities not clearing enough land for housing, which had a negative effect on the number of started dwellings.

4140
Property Index | 9th edition, July 2020Property Index | 9th edition, July 2020
Poland
NorwayThe Norwegian residential market displayed a prolonged period of moderate price development in 2019. This was largely driven by strong labour market and wage growth, balanced housing construction in combination with three rate hikes by the Central Bank and continuation of the mortgage regulations introduced in January 2017.
During the whole of 2019, the number of dwellings transferred as free market sales were 89,632, amounting to approximately 356 bn. NOK. This
represents a year-on-year increase of 2,057 properties (2.2%) and circa 24 bn. NOK (7.4%). Average transaction prices increased by 1.9% and 3.5% for new- and existing dwellings, respectively. However, there are clear regional differences. While the level of construction nationally is well balanced with household growth, Oslo has a long-term challenge with regulating enough areas for development to meet housing demand.
The Government introduced a debt register and new credit regulations for consumer loans in 2019, which is expected to dampen purchasing power to some extent. This in combination with the aforementioned extension of mortgage regulations is likely to limit the upside of housing prices.
The year 2019 turned out to be another record-breaking year on the residential market in Poland, despite rising land prices, limited availability of development plots, prolonged administration procedures and rising construction costs.
The number of newly delivered apartments exceeded 200,000 for the first time in history and was nearly 12% higher than in 2018. At the same time number of commenced dwellings was 6.9% higher year-on-year and the number of issued building permits increased by approximately 4.4% when compared with 2018.
Within recent years we have observed continuous increase of prices, which in selected cities reached a two-digit value and in all major cities, prices increased circa by 9.7% in case of primary market and 10.1% in case of older dwellings.
Despite the price increase, the demand remained strong. In 2019 a total of 65,400 new apartments were sold in the six largest markets. Individuals buying flats for themselves as well as investors purchasing apartments for long or short-term lease drove the demand. This reflected a positive situation in the labour market, growth of wages and savings as well as the remarkably low interest rates existing on the market for a long time (meaning cheap mortgages and unprofitable bank deposits).
At the same time, rents for flats remained relatively stable, usually fluctuating between +/-3% when compared with the corresponding period of the previous year.
Serbia
PortugalSimilarly to the previous year, the Portuguese residential segment continued to be a hotspot market of the country’s economy. Although the selling prices were still at their peak, there was a slight deceleration in the price increase throughout 2019 fueled by a rise in the supply and a wider range of options for buyers.
Lisbon continues to be the most dynamic region in Portugal comprising 22% of the total 14,366 completed dwellings for family housing in Portugal. Additionally, according to INE, in Lisbon City Center
the median value of dwelling sales increased by 13% to 3,179 EUR per sqm during 2019, 10 p.p. less than the increase of the previous year. Porto registered a much lower value of 1,771 EUR per sqm, increasing 19% since the preceding period, 5 p.p. less than the increase in 2018.
Regarding the demand for the segment, the low mortgage rates led to an increased volume of credit granted and consequently a rise in the number of Portuguese buyers. Nevertheless, foreigners still represented more than
50% of the demand for the country’s residential market.
This year’s new development projects were typically larger and built in peripheral zones and greenfield plots. On a less positive note, construction costs remain high and lengthy licensing processes continue to complicate new projects’ developments.
The value of the real estate market in Serbia records a constant growth, which started in 2016.
According to the State Geodetic Survey Office (RGZ), in 2019, total value of the real estate market in Serbia was 4.2 bn. EUR with approx. 104,919 properties sold. Total value of real estate sold in 2019 was 12% higher than in the same period in 2018. Serbia’s capital Belgrade holds a convincing first place in terms of growth with 2.2 bn. EUR spent followed in second place by Novi Sad with close to 470 mil. EUR, then Niš (111 mil. EUR) and Subotica (78 mil. EUR).
The most sought-after on Serbia’s' real estate market are by far apartments with 35% share on the market, whereby their sales value reached 1.9 bn. EUR in 2019 or 47% of total market value. Residential real estate prices are constantly rising, in both old and new properties.
Prices for new residential developments increased significantly in the last three years. This is predominantly fueled by high demand and low supply of new dwellings, which resulted in increase of sale of new apartments (11% in 2018 and 15% in first half of 2019 as per RGZ’s statistics). In terms of financing, cash buyers (69%) prevail over mortgage buyers (31%) in the purchase of new apartments.
In the period January–September 2019 the Belgrade City authorities have issued building permits for development of further 600 000 sqm of residential properties which will be delivered to the market over the next 2–3 years.
4342
Property Index | 9th edition, July 2020
Spain
SlovakiaThe Slovak residential market witnessed strong demand and the insufficient offer of new development projects and apartments for sale. Demand was supported mostly by low interest rates on mortgages, which as a result led to rapidly rising prices in 2019. Prices increased evenly throughout the year in all major cities.
The demand and prices on the residential market are strongly stimulated by these factors:
• continued lack of new apartments supplied to the market,
• culmination of the impact of the regulatory measures of the National Bank of Slovakia,
• low interest rates on new mortgages
The imbalance between supply and demand in the market may narrow in the near future, especially in the capital of Slovakia due to interesting number of new planned project or projects already under construction and due to regulatory measures applied by the central bank. This has potential to alleviate increasing pressure on prices.
Despite the slowdown trend of the global economy in 2019, Spain remained as one of the leading economies. GDP, unemployment and the demographic pattern showed figures, which were representative of a mature market. In 2019, Spanish GDP growth was 2%, 0.8 p.p. above the Eurozone. However, Spanish GDP per capita remained below the EU-28 as constant level. With regard to the population, since 2016 there has been a positive trend (469,000 new residents, although mostly due to foreigners). Both youth unemployment and salary stagnation are still main challenges of the Spanish economy that could considerably affect to the residential market.
For the first time since 2013, the housing transactions have decreased. New housing transactions have fallen slightly, whilst second housing transactions have decreased by 2.5%. Despite there is an obvious impact coming from the new Spanish mortgage law (approved in July 2019), the current RE cycle is showing signs of stabilization. Regarding sale prices, after years of high increases, HPA growth is pointing out toward sustained levels. In 2019, open market sale price has increased, on average, by 3.4%. The gap between new and second hand housing sale prices had increased even more compared to previous years, which affects the new housing demand.
Housing production has increased by 5.6% in the last year, with around 3,500 new active developments and 168,000 housing units. The average sale price of the sample has continued to increase to 2,860 EUR per sqm in exchange for building smaller houses. These high sale prices had affected the demand, so HPA growth seems to converge now to sustained levels.
Furthermore, the new residential market context has generated growing interest in the Private Rented Sector.
United KingdomDemand in the UK property market was relatively subdued over the course of 2019, with a spike at the end of the year as residential property strengthened in response to the political certainty provided by December’s general election result.
October 2019 saw the 20th month of decreases for London property prices since 2017, down 1.6% year-on-year
and with some of the biggest drops in London’s most expensive neighborhoods. However, outside London, 2019 was a year of some growth for the regions.
There still remains a gap between instructions and enquiries, suggesting that supply is falling faster than demand. This has helped maintain prices at their current level, despite
the low levels of activity. The Royal Institution of Chartered Surveyors (RICS) expected an increase in prices and rents as a consequence of the imbalance between rising demand and falling supply. Before the Coronavirus pandemic, their projections were around 2% rental growth over 2020, anticipated to accelerate to average closer to 3% per annum over the next five years.
Property Index | 9th edition, July 2020Property Index | 9th edition, July 2020

Brochure / report title goes here | Section title goes here
44 45
ContactsAustriaGebriele Etzl+43 1 513 09 [email protected]
BelgiumFrédéric Sohet+32 2 639 49 [email protected]
Bosnia and HerzegovinaSabina Softić+387 33 277 [email protected]
BulgariaReneta Petkova+359 2 80 23 [email protected]
CroatiaMario Tešanović+385 1 2351 [email protected]
Czech RepublicMiroslav Linhart+420 737 235 [email protected]
DenmarkTinus Bang Christensen+45 30 93 44 [email protected]
FranceLaure Silvestre-Siaz+33 155 612 [email protected]
GermanyMichael Müller+49 89 [email protected]
HungaryGábor Kohári+36 1 428 [email protected]
IrelandVincent Sorohan+353 1 [email protected]
IsraelDoron [email protected]
ItalyElena Vistarini+39 028 332 512 [email protected]
LatviaValters Tucs+37 167 074 [email protected]
LuxembourgLize Griffiths+352 621 505 [email protected]
NetherlandsJurriën Veldhuizen+31 882 881 [email protected]
NorwayThorvald Nyquist+47 957 53 [email protected]
PolandMaciej Krasoń+48 225 110 [email protected]
PortugalJorge Marrão Souza+351 963 902 [email protected]
SerbiaDejan Mrakovic+381 11 [email protected]
SlovakiaJozef Suchý+421 918 642 [email protected]
SpainJavier Parada+34 915 145 [email protected]
United KingdomChris Baldwin+44 (0)20 7303 [email protected]
Property Index | 9th edition, July 2020 Property Index | 9th edition, July 2020

Property Index | 9th edition, July 2020
47
Property Index | 9th edition, July 2020
46
David MarekDirectorFinancial Advisory+420 606 656 [email protected]
Petr HánaSenior ManagerReal Estate Advisory+420 731 638 [email protected]
Miroslav LinhartPartnerReal Estate Advisory+420 737 235 [email protected]
Igor ZsebikSenior AnalystReal Estate Advisory+420 730 587 [email protected]
Authors
Economic development in Europe
Residential Market

Deloitte refers to one or more of Deloitte Touche Tohmatsu Limited, a UK private company limited by guarantee (“DTTL”), its network of member firms, and their related entities. DTTL and each of its member firms are legally separate and independent entities. DTTL (also referred to as “Deloitte Global”) does not provide services to clients. Please see www.deloitte.com/cz/about for a more detailed description of DTTL and its member firms.
Deloitte provides audit, tax, consulting, financial advisory and legal services to public and private clients spanning multiple industries. With a globally connected network of member firms in more than 150 countries and territories, Deloitte brings world-class capabilities and high-quality service to clients, delivering the insights they need to address their most complex business challenges. Deloitte's more than 225,000 professionals are committed to becoming the standard of excellence.
Deloitte Central Europe is a regional organization of entities organized under the umbrella of Deloitte Central Europe Holdings Limited, the member firm in Central Europe of Deloitte Touche Tohmatsu Limited. Services are provided by the subsidiaries and affiliates of Deloitte Central Europe Holdings Limited, which are separate and independent legal entities. The subsidiaries and affiliates of Deloitte Central Europe Holdings Limited are among the region’s leading professional services firms, providing services through more than 5,000 people in 41 offices in 17 countries.
© 2020 For information, contact Deloitte Czech Republic