promoting productivity and equality: a twin … · and highlights outstanding questions on themes...
TRANSCRIPT

OECD Economic Outlook, Volume 2016 Issue 1
© OECD 2016
59
Chapter 2
PROMOTING PRODUCTIVITYAND EQUALITY:
A TWIN CHALLENGE
2. PROMOTING PRODUCTIVITY AND EQUALITY: A TWIN CHALLENGE
OECD ECONOMIC OUTLOOK, VOLUME 2016 ISSUE 1 © OECD 2016 – PRELIMINARY VERSION60
Summary● Economies become more prosperous when output per worker rises. Since the early
2000s, however, productivity growth has declined in many advanced countries. The
slowdown in productivity has been particularly pronounced since the global financial
crisis.
● Income inequality has been on an upward trend over the past two to three decades,
albeit at a slower pace during the 2000s than the 1990s. The more limited increase in
inequality before taxes and transfers in the 2000s has not, contrary to the past, been
offset with additional redistribution through taxes and transfers.
● The combined effect of the productivity slowdown and the rise in inequality has been a
reduction in the income growth of many workers and their families. In most countries,
incomes have continued to rise. But growth rates have been much weaker than in the
past, and they may have been lower than what people expected.
● Macroeconomic policy and structural reforms are necessary to promote productivity and
curb the rise in inequality. Monetary and fiscal policies that strengthen aggregate
demand, in particular through stronger investment, would increase productivity and
household income. By boosting job creation and employment, they would also work
towards undoing the rise in inequality that is due to the downturn since the global
financial crisis.
● The composition of public expenditure and taxes matters for productivity and
inequality. Shifting spending towards education and public investment is likely to raise
productivity. Improvements in the effectiveness of early childhood and primary
education would be particularly beneficial for disadvantaged groups. Reductions in
corporate income taxes and fiscal incentives for innovation tend to lift productivity.
● Reforms that ease regulatory barriers to competition in product markets raise
productivity and jobs. They tend to increase wage disparity among workers but, thanks
to higher job creation, have no strong influence on overall income inequality. When
packaged with an increase in the effectiveness of active labour market programmes,
such policies can promote both productivity and equality. The effects of job protection
regulations on productivity and inequality are empirically less well established.
● Finance is important to fund investment and innovation. Write-downs of non-
performing loans and faster bank recapitalisations help households deleverage and
facilitate the provision of new credit. Phasing out too-big-to-fail guarantees and
restricting compensation practices that reward short-term success bear the promise of
promoting both productivity and equality.
2. PROMOTING PRODUCTIVITY AND EQUALITY: A TWIN CHALLENGE
OECD ECONOMIC OUTLOOK, VOLUME 2016 ISSUE 1 © OECD 2016 – PRELIMINARY VERSION 61
IntroductionEconomies become more prosperous when output per worker rises. Since the early
2000s, however, productivity growth has declined in advanced countries. This slowdown in
productivity has taken place during a period in which income inequality has increased in
many economies. To put the most recent years in historical context: never in the past 30
years has productivity growth been lower than since the global financial crisis, and never
has income inequality been higher than it is today.
The productivity slowdown and the rise in inequality have impacted the well-being of
many workers and their families. Low- and middle-income households have had to cope
with slow-growing, and in some cases stagnant or falling, real incomes. These trends are
threatening progress in living standards, fiscal sustainability and social cohesion.
Macroeconomic policy measures and structural reforms are necessary to promote
productivity and curb the rise in inequality.
This chapter explores the twin challenge of slowing productivity and rising inequality.
The first part documents, and explains, the trends in productivity growth and income
inequality. The second part outlines policies that can create synergies between higher
productivity and lower inequality. The chapter summarises some of the research findings
and highlights outstanding questions on themes that are explored in greater depth in the
OECD report on the productivity-inequality nexus (OECD, 2016a).
The twin challenge: Slowing productivity and rising inequality
The productivity slowdown
Productivity growth in advanced countries has been much weaker since 2000 than in
the 1990s. For several economies, the productivity slowdown goes back to the early 2000s.
But since the global financial crisis the decline in productivity growth has become much
more pronounced and has affected nearly every country in the OECD. Slowing productivity,
not declining employment, has been the principal factor behind slowing GDP per capita.
Discussions about productivity growth have therefore taken centre-stage in policy circles,
reflected for example in the creation of productivity commissions in many countries.
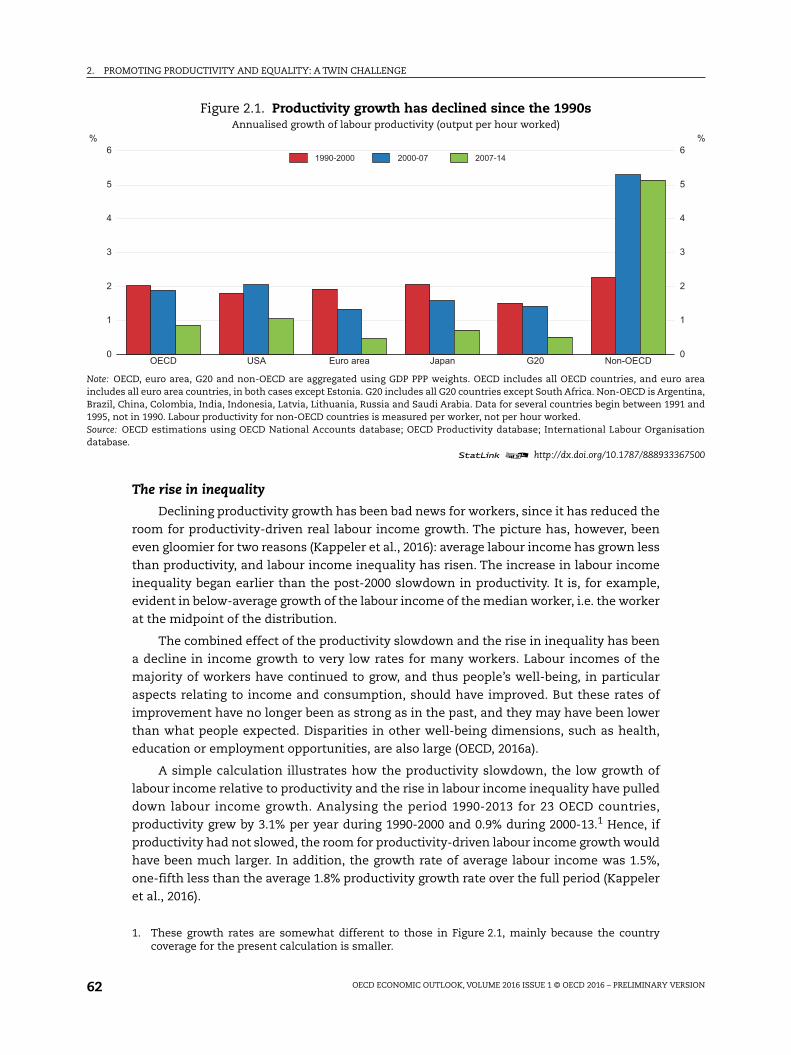
Hourly labour productivity growth in OECD countries averaged 2.0% during 1990-2000,
1.9% during 2000-07 and 0.9% during 2007-14 (Figure 2.1). From the 1990s to 2007, OECD
economies experienced different productivity trends, with productivity slowing in 19
countries and accelerating in 14. The United States is among the countries where
productivity accelerated in the early 2000s, while productivity slowed in the euro area and
Japan. Most worrying are the developments since the global financial crisis, when
productivity has grown at less than half the rate in the 1990s.
The productivity slowdown in advanced countries is apparent whether productivity is
measured as output per worker or per hour worked. It is also apparent when productivity
growth is corrected for the business cycle, even if such adjustments are difficult given the
protracted slow recovery. Some of the post-crisis decline is thus likely to remain when
economies will be back at full employment. In a longer historical perspective, the low
growth rates of the 2000s have been even more unusual, as growth until the 1970s was very
strong (OECD, 2015a). More recently, productivity has also slowed in some emerging market
economies, including China and Russia, although on average less markedly than in
advanced countries.
2. PROMOTING PRODUCTIVITY AND EQUALITY: A TWIN CHALLENGE
OECD ECONOMIC OUTLOOK, VOLUME 2016 ISSUE 1 © OECD 2016 – PRELIMINARY VERSION62
The rise in inequality
Declining productivity growth has been bad news for workers, since it has reduced the
room for productivity-driven real labour income growth. The picture has, however, been
even gloomier for two reasons (Kappeler et al., 2016): average labour income has grown less
than productivity, and labour income inequality has risen. The increase in labour income
inequality began earlier than the post-2000 slowdown in productivity. It is, for example,
evident in below-average growth of the labour income of the median worker, i.e. the worker
at the midpoint of the distribution.
The combined effect of the productivity slowdown and the rise in inequality has been
a decline in income growth to very low rates for many workers. Labour incomes of the
majority of workers have continued to grow, and thus people’s well-being, in particular
aspects relating to income and consumption, should have improved. But these rates of
improvement have no longer been as strong as in the past, and they may have been lower
than what people expected. Disparities in other well-being dimensions, such as health,
education or employment opportunities, are also large (OECD, 2016a).
A simple calculation illustrates how the productivity slowdown, the low growth of
labour income relative to productivity and the rise in labour income inequality have pulled
down labour income growth. Analysing the period 1990-2013 for 23 OECD countries,
productivity grew by 3.1% per year during 1990-2000 and 0.9% during 2000-13.1 Hence, if
productivity had not slowed, the room for productivity-driven labour income growth would
have been much larger. In addition, the growth rate of average labour income was 1.5%,
one-fifth less than the average 1.8% productivity growth rate over the full period (Kappeler
et al., 2016).
Figure 2.1. Productivity growth has declined since the 1990sAnnualised growth of labour productivity (output per hour worked)
Note: OECD, euro area, G20 and non-OECD are aggregated using GDP PPP weights. OECD includes all OECD countries, and euro areaincludes all euro area countries, in both cases except Estonia. G20 includes all G20 countries except South Africa. Non-OECD is Argentina,Brazil, China, Colombia, India, Indonesia, Latvia, Lithuania, Russia and Saudi Arabia. Data for several countries begin between 1991 and1995, not in 1990. Labour productivity for non-OECD countries is measured per worker, not per hour worked.Source: OECD estimations using OECD National Accounts database; OECD Productivity database; International Labour Organisationdatabase.
1 2 http://dx.doi.org/10.1787/888933367500
OECD USA Euro area Japan G20 Non-OECD0
1
2
3
4
5
6 %
0
1
2
3
4
5
6 %
1990-2000 2000-07 2007-14
1. These growth rates are somewhat different to those in Figure 2.1, mainly because the countrycoverage for the present calculation is smaller.
2. PROMOTING PRODUCTIVITY AND EQUALITY: A TWIN CHALLENGE
OECD ECONOMIC OUTLOOK, VOLUME 2016 ISSUE 1 © OECD 2016 – PRELIMINARY VERSION 63
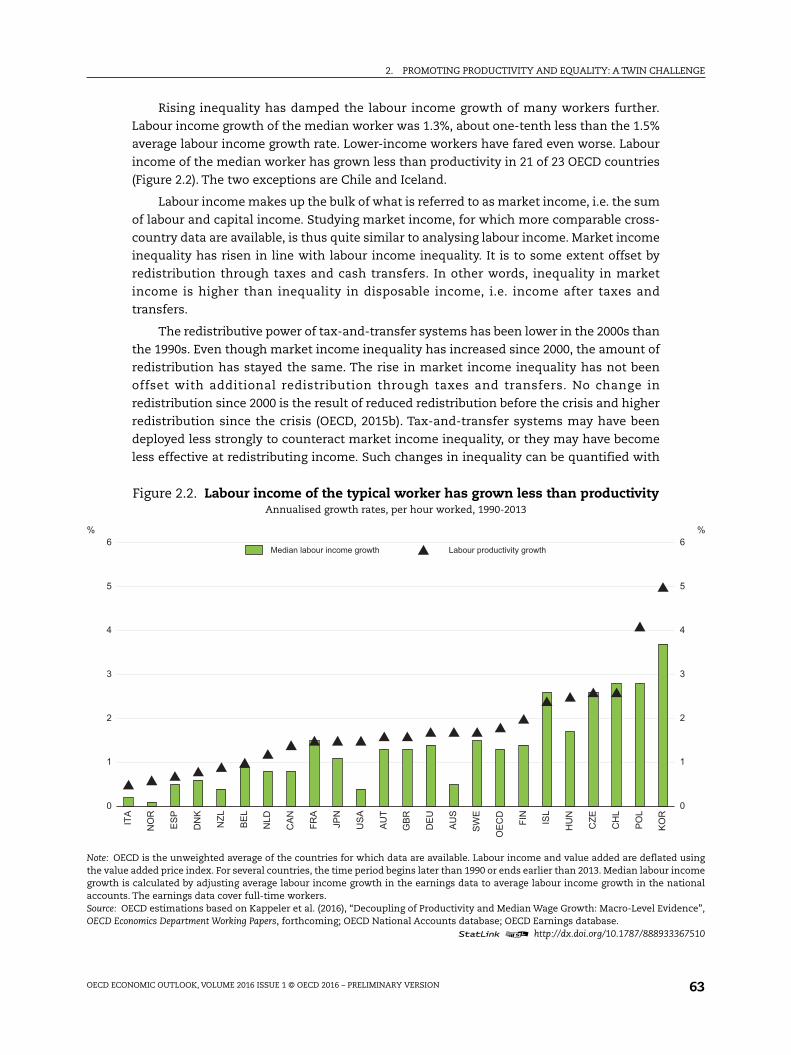
Rising inequality has damped the labour income growth of many workers further.
Labour income growth of the median worker was 1.3%, about one-tenth less than the 1.5%
average labour income growth rate. Lower-income workers have fared even worse. Labour
income of the median worker has grown less than productivity in 21 of 23 OECD countries
(Figure 2.2). The two exceptions are Chile and Iceland.
Labour income makes up the bulk of what is referred to as market income, i.e. the sum
of labour and capital income. Studying market income, for which more comparable cross-
country data are available, is thus quite similar to analysing labour income. Market income
inequality has risen in line with labour income inequality. It is to some extent offset by
redistribution through taxes and cash transfers. In other words, inequality in market
income is higher than inequality in disposable income, i.e. income after taxes and
transfers.
The redistributive power of tax-and-transfer systems has been lower in the 2000s than
the 1990s. Even though market income inequality has increased since 2000, the amount of
redistribution has stayed the same. The rise in market income inequality has not been
offset with additional redistribution through taxes and transfers. No change in
redistribution since 2000 is the result of reduced redistribution before the crisis and higher
redistribution since the crisis (OECD, 2015b). Tax-and-transfer systems may have been
deployed less strongly to counteract market income inequality, or they may have become
less effective at redistributing income. Such changes in inequality can be quantified with
Figure 2.2. Labour income of the typical worker has grown less than productivityAnnualised growth rates, per hour worked, 1990-2013
Note: OECD is the unweighted average of the countries for which data are available. Labour income and value added are deflated usingthe value added price index. For several countries, the time period begins later than 1990 or ends earlier than 2013. Median labour incomegrowth is calculated by adjusting average labour income growth in the earnings data to average labour income growth in the nationalaccounts. The earnings data cover full-time workers.Source: OECD estimations based on Kappeler et al. (2016), “Decoupling of Productivity and Median Wage Growth: Macro-Level Evidence”,OECD Economics Department Working Papers, forthcoming; OECD National Accounts database; OECD Earnings database.
1 2 http://dx.doi.org/10.1787/888933367510
0
1
2
3
4
5
6%
0
1
2
3
4
5
6%
ITA
NO
R
ES
P
DN
K
NZL
BE
L
NLD
CA
N
FRA
JPN
US
A
AU
T
GB
R
DE
U
AU
S
SW
E
OE
CD
FIN
ISL
HU
N
CZE
CH
L
PO
L
KO
R
Median labour income growth Labour productivity growth
2. PROMOTING PRODUCTIVITY AND EQUALITY: A TWIN CHALLENGE
OECD ECONOMIC OUTLOOK, VOLUME 2016 ISSUE 1 © OECD 2016 – PRELIMINARY VERSION64
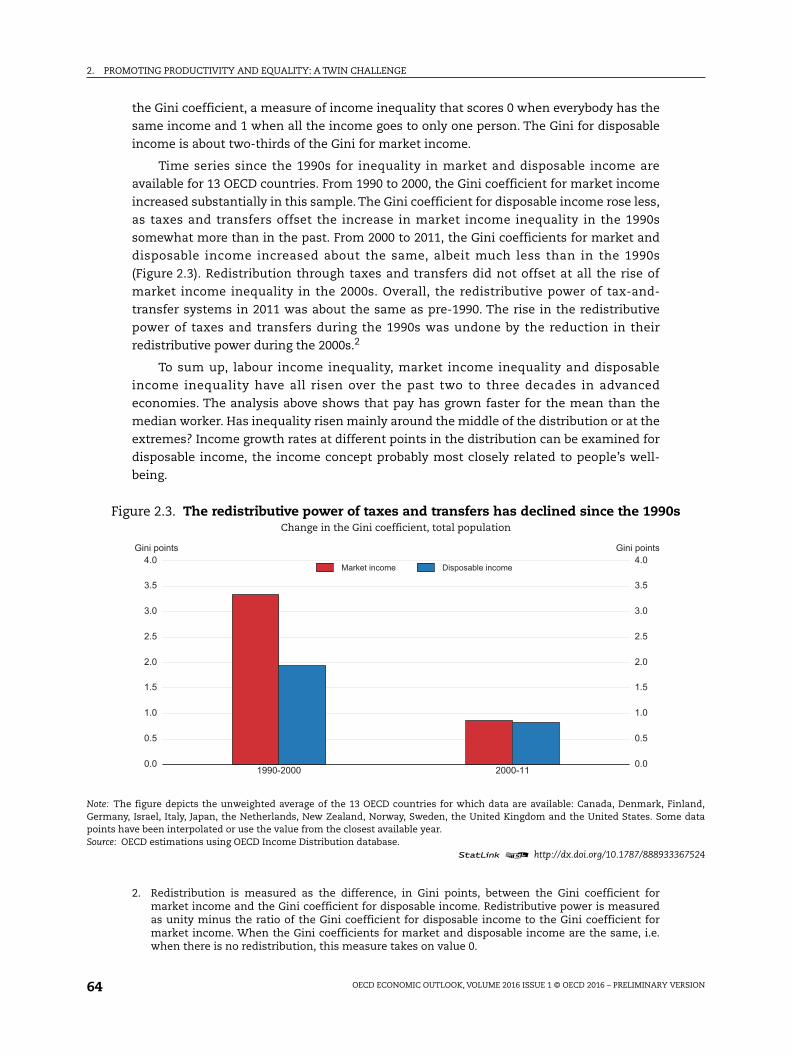
the Gini coefficient, a measure of income inequality that scores 0 when everybody has the
same income and 1 when all the income goes to only one person. The Gini for disposable
income is about two-thirds of the Gini for market income.
Time series since the 1990s for inequality in market and disposable income are
available for 13 OECD countries. From 1990 to 2000, the Gini coefficient for market income
increased substantially in this sample. The Gini coefficient for disposable income rose less,
as taxes and transfers offset the increase in market income inequality in the 1990s
somewhat more than in the past. From 2000 to 2011, the Gini coefficients for market and
disposable income increased about the same, albeit much less than in the 1990s
(Figure 2.3). Redistribution through taxes and transfers did not offset at all the rise of
market income inequality in the 2000s. Overall, the redistributive power of tax-and-
transfer systems in 2011 was about the same as pre-1990. The rise in the redistributive
power of taxes and transfers during the 1990s was undone by the reduction in their
redistributive power during the 2000s.2
To sum up, labour income inequality, market income inequality and disposable
income inequality have all risen over the past two to three decades in advanced
economies. The analysis above shows that pay has grown faster for the mean than the
median worker. Has inequality risen mainly around the middle of the distribution or at the
extremes? Income growth rates at different points in the distribution can be examined for
disposable income, the income concept probably most closely related to people’s well-
being.
2. Redistribution is measured as the difference, in Gini points, between the Gini coefficient formarket income and the Gini coefficient for disposable income. Redistributive power is measuredas unity minus the ratio of the Gini coefficient for disposable income to the Gini coefficient formarket income. When the Gini coefficients for market and disposable income are the same, i.e.when there is no redistribution, this measure takes on value 0.
Figure 2.3. The redistributive power of taxes and transfers has declined since the 1990sChange in the Gini coefficient, total population
Note: The figure depicts the unweighted average of the 13 OECD countries for which data are available: Canada, Denmark, Finland,Germany, Israel, Italy, Japan, the Netherlands, New Zealand, Norway, Sweden, the United Kingdom and the United States. Some datapoints have been interpolated or use the value from the closest available year.Source: OECD estimations using OECD Income Distribution database.
1 2 http://dx.doi.org/10.1787/888933367524
1990-2000 2000-110.0
0.5
1.0
1.5
2.0
2.5
3.0
3.5
4.0 Gini points
0.0
0.5
1.0
1.5
2.0
2.5
3.0
3.5
4.0 Gini points
Market income Disposable income
2. PROMOTING PRODUCTIVITY AND EQUALITY: A TWIN CHALLENGE
OECD ECONOMIC OUTLOOK, VOLUME 2016 ISSUE 1 © OECD 2016 – PRELIMINARY VERSION 65
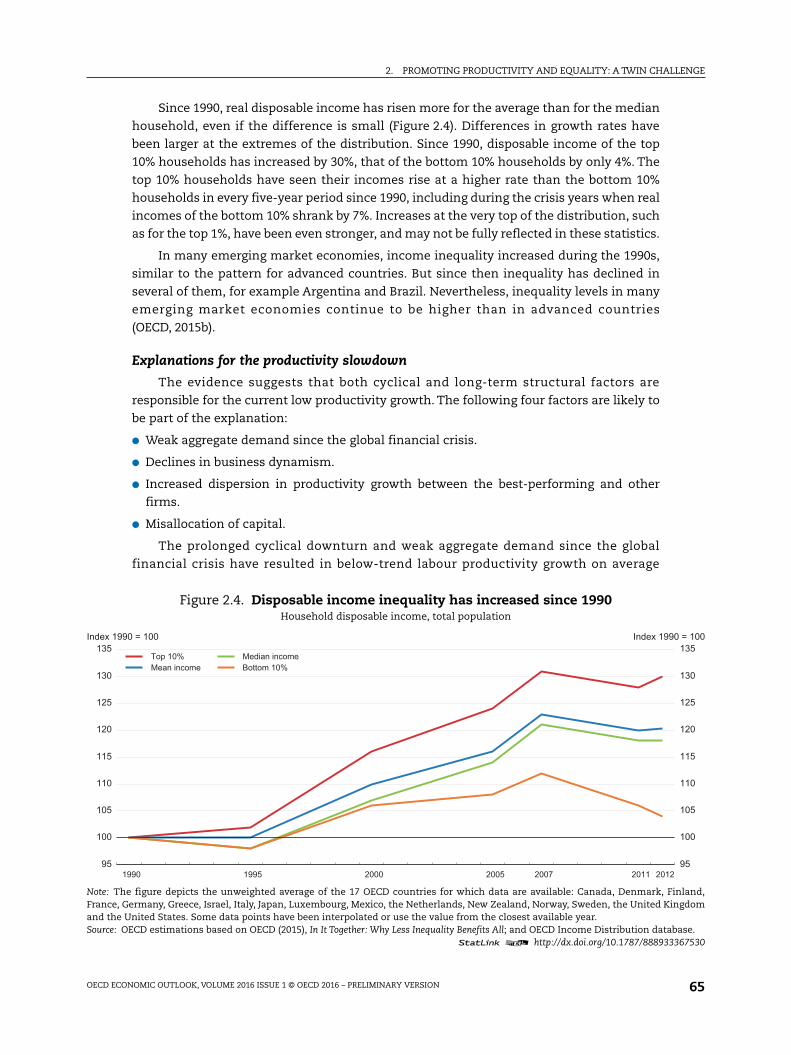
Since 1990, real disposable income has risen more for the average than for the median
household, even if the difference is small (Figure 2.4). Differences in growth rates have
been larger at the extremes of the distribution. Since 1990, disposable income of the top
10% households has increased by 30%, that of the bottom 10% households by only 4%. The
top 10% households have seen their incomes rise at a higher rate than the bottom 10%
households in every five-year period since 1990, including during the crisis years when real
incomes of the bottom 10% shrank by 7%. Increases at the very top of the distribution, such
as for the top 1%, have been even stronger, and may not be fully reflected in these statistics.
In many emerging market economies, income inequality increased during the 1990s,
similar to the pattern for advanced countries. But since then inequality has declined in
several of them, for example Argentina and Brazil. Nevertheless, inequality levels in many
emerging market economies continue to be higher than in advanced countries
(OECD, 2015b).
Explanations for the productivity slowdown
The evidence suggests that both cyclical and long-term structural factors are
responsible for the current low productivity growth. The following four factors are likely to
be part of the explanation:
● Weak aggregate demand since the global financial crisis.
● Declines in business dynamism.
● Increased dispersion in productivity growth between the best-performing and other
firms.
● Misallocation of capital.
The prolonged cyclical downturn and weak aggregate demand since the global
financial crisis have resulted in below-trend labour productivity growth on average
Figure 2.4. Disposable income inequality has increased since 1990Household disposable income, total population
Note: The figure depicts the unweighted average of the 17 OECD countries for which data are available: Canada, Denmark, Finland,France, Germany, Greece, Israel, Italy, Japan, Luxembourg, Mexico, the Netherlands, New Zealand, Norway, Sweden, the United Kingdomand the United States. Some data points have been interpolated or use the value from the closest available year.Source: OECD estimations based on OECD (2015), In It Together: Why Less Inequality Benefits All; and OECD Income Distribution database.
1 2 http://dx.doi.org/10.1787/888933367530
95
100
105
110
115
120
125
130
135Index 1990 = 100
95
100
105
110
115
120
125
130
135Index 1990 = 100
1990 1995 2000 2005 2007 2011 2012
Top 10%Mean income
Median incomeBottom 10%
2. PROMOTING PRODUCTIVITY AND EQUALITY: A TWIN CHALLENGE
OECD ECONOMIC OUTLOOK, VOLUME 2016 ISSUE 1 © OECD 2016 – PRELIMINARY VERSION66
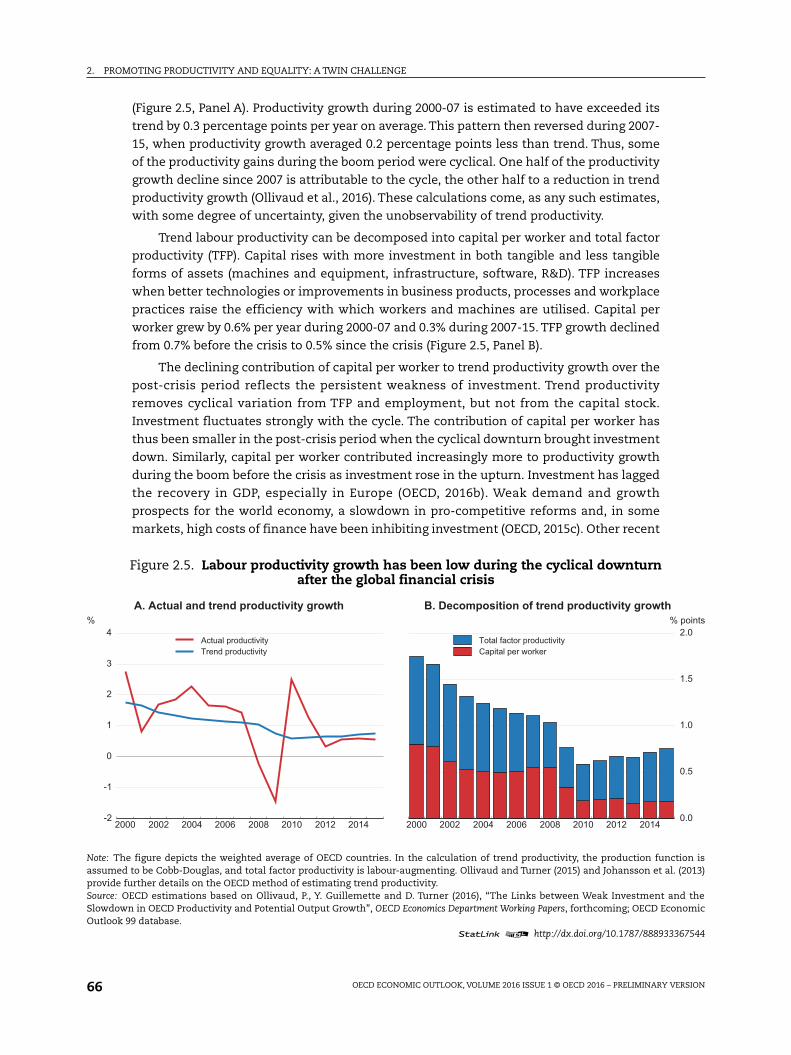
(Figure 2.5, Panel A). Productivity growth during 2000-07 is estimated to have exceeded its
trend by 0.3 percentage points per year on average. This pattern then reversed during 2007-
15, when productivity growth averaged 0.2 percentage points less than trend. Thus, some
of the productivity gains during the boom period were cyclical. One half of the productivity
growth decline since 2007 is attributable to the cycle, the other half to a reduction in trend
productivity growth (Ollivaud et al., 2016). These calculations come, as any such estimates,
with some degree of uncertainty, given the unobservability of trend productivity.
Trend labour productivity can be decomposed into capital per worker and total factor
productivity (TFP). Capital rises with more investment in both tangible and less tangible
forms of assets (machines and equipment, infrastructure, software, R&D). TFP increases
when better technologies or improvements in business products, processes and workplace
practices raise the efficiency with which workers and machines are utilised. Capital per
worker grew by 0.6% per year during 2000-07 and 0.3% during 2007-15. TFP growth declined
from 0.7% before the crisis to 0.5% since the crisis (Figure 2.5, Panel B).
The declining contribution of capital per worker to trend productivity growth over the
post-crisis period reflects the persistent weakness of investment. Trend productivity
removes cyclical variation from TFP and employment, but not from the capital stock.
Investment fluctuates strongly with the cycle. The contribution of capital per worker has
thus been smaller in the post-crisis period when the cyclical downturn brought investment
down. Similarly, capital per worker contributed increasingly more to productivity growth
during the boom before the crisis as investment rose in the upturn. Investment has lagged
the recovery in GDP, especially in Europe (OECD, 2016b). Weak demand and growth
prospects for the world economy, a slowdown in pro-competitive reforms and, in some
markets, high costs of finance have been inhibiting investment (OECD, 2015c). Other recent
Figure 2.5. Labour productivity growth has been low during the cyclical downturnafter the global financial crisis
Note: The figure depicts the weighted average of OECD countries. In the calculation of trend productivity, the production function isassumed to be Cobb-Douglas, and total factor productivity is labour-augmenting. Ollivaud and Turner (2015) and Johansson et al. (2013)provide further details on the OECD method of estimating trend productivity.Source: OECD estimations based on Ollivaud, P., Y. Guillemette and D. Turner (2016), “The Links between Weak Investment and theSlowdown in OECD Productivity and Potential Output Growth”, OECD Economics Department Working Papers, forthcoming; OECD EconomicOutlook 99 database.
1 2 http://dx.doi.org/10.1787/888933367544
2000 2002 2004 2006 2008 2010 2012 2014-2
-1
0
1
2
3
4%
Actual productivityTrend productivity
A. Actual and trend productivity growth
2000 2002 2004 2006 2008 2010 2012 20140.0
0.5
1.0
1.5
2.0% points
Capital per workerTotal factor productivity
B. Decomposition of trend productivity growth
2. PROMOTING PRODUCTIVITY AND EQUALITY: A TWIN CHALLENGE
OECD ECONOMIC OUTLOOK, VOLUME 2016 ISSUE 1 © OECD 2016 – PRELIMINARY VERSION 67
analysis also suggests that the depletion of the capital stock in the United States has played
a key role in propagating the shock of the financial crisis (Hall, 2016).
In addition to weak aggregate demand, long-term structural factors have weighed on
productivity growth. Business dynamism has declined, as is evident from the fall in
business start-up rates and the slowdown in investment in knowledge-based capital
(OECD, 2015a). Knowledge-based capital can, for example, take the form of R&D, firm-
specific skills, organisational know-how, databases, design or intellectual property. In
Europe, productivity growth has been weaker in industries that have recorded larger
declines in the share of young firms (Andrews et al., 2016).
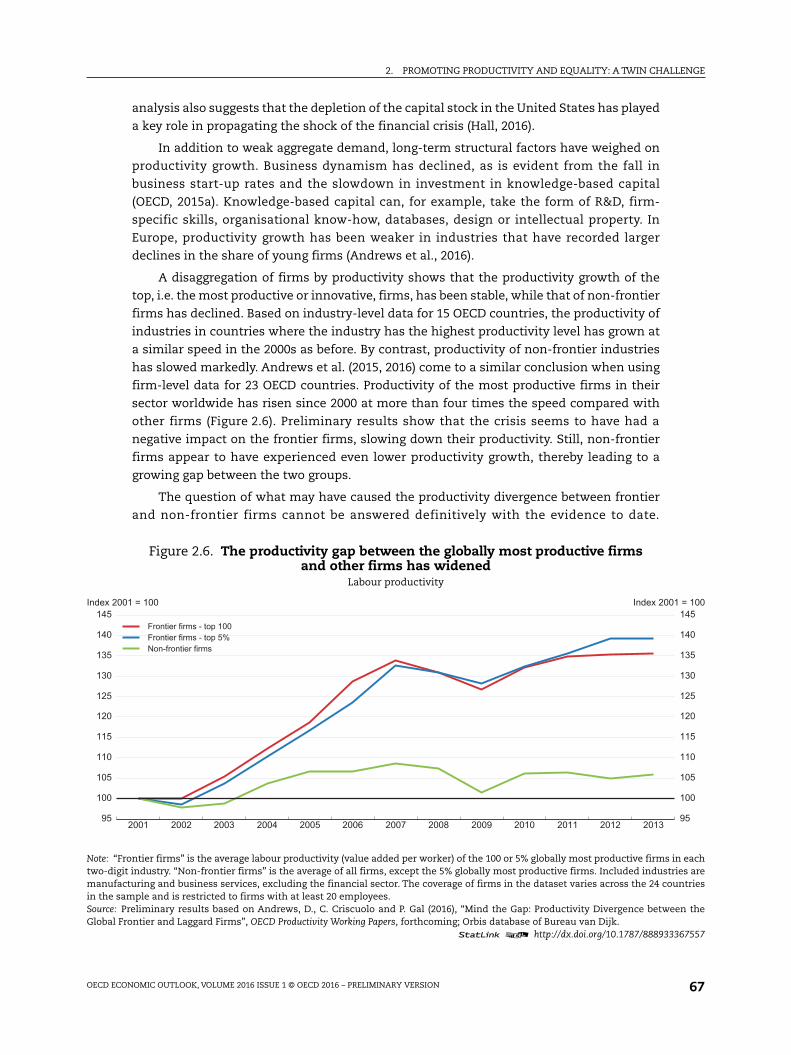
A disaggregation of firms by productivity shows that the productivity growth of the
top, i.e. the most productive or innovative, firms, has been stable, while that of non-frontier
firms has declined. Based on industry-level data for 15 OECD countries, the productivity of
industries in countries where the industry has the highest productivity level has grown at
a similar speed in the 2000s as before. By contrast, productivity of non-frontier industries
has slowed markedly. Andrews et al. (2015, 2016) come to a similar conclusion when using
firm-level data for 23 OECD countries. Productivity of the most productive firms in their
sector worldwide has risen since 2000 at more than four times the speed compared with
other firms (Figure 2.6). Preliminary results show that the crisis seems to have had a
negative impact on the frontier firms, slowing down their productivity. Still, non-frontier
firms appear to have experienced even lower productivity growth, thereby leading to a
growing gap between the two groups.
The question of what may have caused the productivity divergence between frontier
and non-frontier firms cannot be answered definitively with the evidence to date.
Figure 2.6. The productivity gap between the globally most productive firmsand other firms has widened
Labour productivity
Note: “Frontier firms” is the average labour productivity (value added per worker) of the 100 or 5% globally most productive firms in eachtwo-digit industry. “Non-frontier firms” is the average of all firms, except the 5% globally most productive firms. Included industries aremanufacturing and business services, excluding the financial sector. The coverage of firms in the dataset varies across the 24 countriesin the sample and is restricted to firms with at least 20 employees.Source: Preliminary results based on Andrews, D., C. Criscuolo and P. Gal (2016), “Mind the Gap: Productivity Divergence between theGlobal Frontier and Laggard Firms”, OECD Productivity Working Papers, forthcoming; Orbis database of Bureau van Dijk.
1 2 http://dx.doi.org/10.1787/888933367557
2001 2002 2003 2004 2005 2006 2007 2008 2009 2010 2011 2012 201395
100
105
110
115
120
125
130
135
140
145Index 2001 = 100
95
100
105
110
115
120
125
130
135
140
145Index 2001 = 100
Frontier firms - top 100Frontier firms - top 5%Non-frontier firms
2. PROMOTING PRODUCTIVITY AND EQUALITY: A TWIN CHALLENGE
OECD ECONOMIC OUTLOOK, VOLUME 2016 ISSUE 1 © OECD 2016 – PRELIMINARY VERSION68
Declining growth rates of firms away from the global productivity frontier may be
attributable to several, possibly complementary, factors (OECD, 2016a): Diffusion of
technology and knowledge from frontier firms to others may have declined; poorly-
performing firms may remain longer in the market, rather than exit, thereby trapping
resources in unproductive activities; high-skilled workers may sort into the same firms to
a greater extent than in the past; and a rise in the concentration of market power and rent-
seeking by frontier firms may have left non-frontier firms behind.
Evidence on the third possible structural factor for the productivity slowdown,
misallocation of capital, is comparatively less solid to date and warrants further research,
including through more cross-country evidence. Several studies suggest that misallocation
of capital has been particularly pertinent for the euro area. Following the introduction of
the euro, countries in the periphery experienced large capital inflows and low productivity
growth (Gopinath et al., 2015). Detailed analyses of Belgium, France, Italy, Portugal and
Spain indicate that capital has been allocated to low-productivity firms (Calligaris, 2015;
Dias et al., 2015; Gamberoni et al., 2016; García-Santana et al., 2016).
This misallocation of capital may have resulted in lower productivity growth also after
the crisis. The slowdown of the capital stock since the crisis has been sharpest in OECD
countries, which had the lowest interest rates before the crisis and may have over-
accumulated capital (Ollivaud et al., 2016). Further, in some countries, the industries that
are the main sources of productivity growth are no longer the same, suggesting
misallocation across industries before and after the crisis. In the United Kingdom, for
example, the contribution of financial services to productivity growth was strong and
positive before the crisis, likely reflecting excessive leverage, but it has been negative since
the crisis (Kierzenkowski et al., 2016).
Explanations for the rise in inequality
Several reasons underpin the upward trend in labour income inequality, and
consequently market and disposable income inequality. Factors that are likely to be part of
the explanation include:
● High unemployment since the global financial crisis.
● Skill-biased technological change.
● Decreased worker bargaining power.
● Globalisation and increased international connectedness.
● Productivity divergence across firms.
● Rising income shares at the top of the distribution.
Income inequality continued to increase during the global financial crisis and
subsequent period of fiscal consolidation. The fall in employment, not relative wage
developments, was the main factor behind the rise in inequality of both market and
disposable income. In fact, income poverty also increased after the crisis (OECD, 2015b).
Disposable income inequality rose less than market income inequality, as more
redistribution, in part due to automatic stabilisers, offset some of the income losses of
households at the lower end of the distribution. The increase in redistribution during the
crisis reversed the decline observed earlier in the decade so that the overall amount in 2011
was about the same as in 2000. As a result, inequality in market and disposable incomes
increased in very similar proportions between 2000 and 2011 (as shown in Figure 2.3).
2. PROMOTING PRODUCTIVITY AND EQUALITY: A TWIN CHALLENGE
OECD ECONOMIC OUTLOOK, VOLUME 2016 ISSUE 1 © OECD 2016 – PRELIMINARY VERSION 69
Several factors have contributed to the long-term rise in inequality. Inequality in the
distribution of labour income has accounted for most of the increase in income inequality.
To a certain extent, the increase in labour income inequality is likely related to
technological progress, which may itself have been driven by investment in R&D and
innovation. Technical advancements may have benefited high-skilled workers more; for
instance, earnings gains have been particularly large for people with much-demanded
skills to deal with new information and communication technologies. In addition, a
growing share of non-standard labour contracts and a lower coverage of collective
bargaining in some countries may have further curbed the wage growth of low- and
medium-skilled workers (OECD, 2011). These trends might have been compounded by
globalisation and increased interconnectedness, for example through the integration of
China in international trade flows (Autor et al., 2013, 2014).
At least in some countries, the rise of labour income inequality has been primarily due
to a rise in wage differences between firms, not within firms. This has been shown to be
the case in Germany (Card et al., 2013), Sweden (Håkanson et al., 2015) and the United
States (Song et al., 2015). According to this research, inequality has risen because some
firms now pay all their employees much more than other firms, not because top managers
have increasingly been paid more than support staff. The results in these studies indicate
that some of the wage divergence between firms may be related to so-called assortative
matching, whereby high-wage workers and high-wage firms increasingly “match” with
each other.
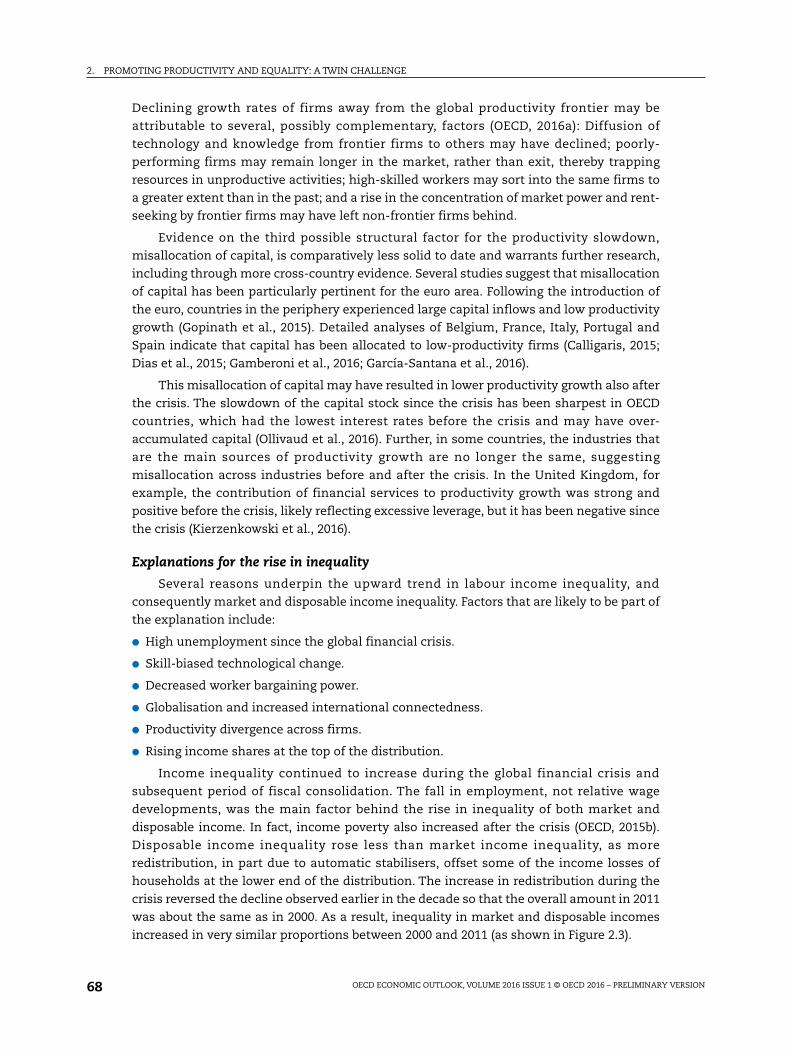
This phenomenon is in line with Figure 2.6 on productivity divergence between firms,
which would imply rising dispersion of labour incomes across firms. When advanced
countries are compared with one another, dispersion of firm productivity is highly
positively correlated with dispersion of labour income across firms (Figure 2.7).3 This
finding is not predicated on the economic conditions since the global financial crisis, as
conclusions are the same with pre- and post-crisis data. Further, alternative firm-level data
sources, such as the OECD MultiProd database (OECD, 2016a), yield similar results. Hence,
a conjecture (consistent with the evidence to date, although without conclusive proof of
causality) is that the productivity divergence across firms has resulted in an increase in
labour income inequality.
Income at the very top of the income distribution has grown far more rapidly than for
the rest of the population (Alvaredo et al., 2013; Förster et al., 2014), notwithstanding the
observation that household surveys, including those used by the OECD, have the drawback
of under-coverage of the top 1% incomes (Ruiz and Woloszko, 2016). Rising inequality in
wealth, which is already more concentrated than labour income, has increased capital
incomes and hence total incomes at the top. Other factors that may have contributed to the
strong rise of top incomes are reductions in top marginal income tax rates and stronger
protection of rents. In the United States, for example, corporate profits in the technology
and financial industries are close to record highs and many industries have become more
concentrated. This growing market power may have benefited employees in high-wage
firms the most. Further analysis of the sources of top income inequality is an important
area of future research.
3. Regressing the P90/P50 ratio in the firm distribution of average labour income on the P90/P50 ratioin the firm distribution of labour productivity yields a coefficient estimate of 0.61 and a p-value ofless than 0.0001. The R-squared is 0.64, and the number of observations is 21.
2. PROMOTING PRODUCTIVITY AND EQUALITY: A TWIN CHALLENGE
OECD ECONOMIC OUTLOOK, VOLUME 2016 ISSUE 1 © OECD 2016 – PRELIMINARY VERSION70
Policies to promote productivity and equalityThe declining growth of productivity and earnings, especially of people on low
incomes, fuels concerns about socio-economic developments in advanced economies.
Many policy choices – on monetary policy, fiscal policy and structural policies – affect both
productivity and inequality. They could therefore act as levers to tackle the productivity
slowdown and the rise in inequality together, or may sometimes involve trade-offs. This
part discusses measures in four areas: policies to support aggregate demand; public
spending and tax policies; competition and innovation policies; and financial market
policies.
Policies to support aggregate demand
The productivity slowdown has become much more pronounced since the global
financial crisis, in part due to weak aggregate demand. Policies that strengthen aggregate
demand, in particular through stronger investment, may therefore increase productivity,
Figure 2.7. Labour income inequality and productivity dispersion across firmsare positively correlated
2013
Note: OECD is the unweighted average of the countries for which data are available. The coverage of firms in thedataset varies across countries and is restricted to firms with at least 20 employees. The P90/P50 ratio is labourincome or labour productivity of the firm at the 90th percentile divided by the corresponding value of the firm at themedian. Labour income is total compensation including taxes and the employer’s and employee’s social securitycontributions. The data point for Japan refers to 2008, the most recent year for which data are available.Source: OECD estimations based on Saia and Schwellnus (2016), “Decoupling of Productivity and MedianWage Growth: Micro-Level Evidence”, OECD Economics Department Working Papers, forthcoming; Orbis database ofBureau van Dijk.
1 2 http://dx.doi.org/10.1787/888933367560
0.2 0.3 0.4 0.5 0.6 0.7 0.8 0.9 1.0 1.10.1
0.2
0.3
0.4
0.5
0.6
0.7
0.8P90/P50 ratio in the firm distribution of average labour income
0.1
0.2
0.3
0.4
0.5
0.6
0.7
0.8
AUT
BELDEU
DNK
ESP
FIN
FRA
GBR
GRC
HUN
IRL
ITA
JPN
KOR
LUX
NLD
POL
PRT
SWESVN
TUR
OECD
P90/P50 ratio in the firm distribution of labour productivity
2. PROMOTING PRODUCTIVITY AND EQUALITY: A TWIN CHALLENGE
OECD ECONOMIC OUTLOOK, VOLUME 2016 ISSUE 1 © OECD 2016 – PRELIMINARY VERSION 71
employment and household income. Monetary and fiscal policies support demand most
directly. Structural reforms improve economic growth prospects in the long term and, with
appropriate choices, can also support aggregate demand in the short term.
Monetary, fiscal and structural policies must be deployed in a consistent and
synergistic manner. None of the three levers can work alone. Experience to date suggests
that the strong reliance on monetary policy has been insufficient to deliver satisfactory
growth. With monetary policy close to its limits, fiscal policy is important to generate
demand, and structural reforms can facilitate the necessary reallocation of resources.
Monetary and fiscal policy options to support demand vary across economies
(Chapters 1 and 3). In several economies, the macro policy mix, which needs to remain
accommodative, would benefit from the enhanced use of fiscal policies, given growing
concerns about the potential distortions caused by non-conventional monetary policy
actions and diminishing returns of further easing. The very low interest rates for
government borrowing have in effect increased fiscal space, providing many countries with
room for expansion. Collective fiscal action, that lets countries mutually benefit from the
positive spillovers of fiscal actions in other countries, would raise the pay-off for individual
countries from undertaking fiscal expansion and is consistent with fiscal sustainability.
The effects of such aggregate demand policies on income inequality have a cyclical
and structural dimension. The current situation of inadequate aggregate demand, where
many economies operate at less than potential output, is synonymous with low
employment rates. Low employment rates are an important source of poverty and income
disparities, because they generate no labour income for an unusually large number of
workers. As emphasised above, the decline in employment over the cyclical downturn
since the global financial crisis has increased poverty and income inequality.4
Macroeconomic expansion to further stimulate aggregate demand would be suited to
reduce this cyclical effect of a temporary rise in poverty and income inequality. Demand
management in today’s economic environment can have the additional benefit of
countering increases in income inequality even over the longer term. Continued economic
weakness may damage the employability of workers who have been out of work for too
long. Long-term unemployment erodes the skills of workers and their earnings prospects
and could thus result in permanently higher inequality.
A very powerful fiscal tool to raise demand, productivity and income would be to
increase public investment. Public investment has fallen as a share of GDP compared with
pre-crisis levels at the aggregate OECD level (Ollivaud et al., 2016). Multiplier estimates are
usually larger for investment than other spending components (Auerbach and
Gorodnichenko, 2012; Ilzetzki et al., 2013). Infrastructure is often perceived to be deficient,
and many governments are now able to borrow at very low interest rates for long
maturities. Public investment can be particularly effective when it catalyses private
investment (OECD, 2015c). More investment would have the twin benefit of not only
expanding demand today, but also supply tomorrow, by adding to the capital stock.
Evidence in the next section on the structural composition of public spending suggests
higher levels of public investment should be maintained, even when monetary policy
eventually gains more traction again and the global economy gets back to potential. Insofar
4. Effects from the very expansionary stance of monetary policy on income inequality via financialchannels are likely to have been small (O’Farrell et al., 2016).
2. PROMOTING PRODUCTIVITY AND EQUALITY: A TWIN CHALLENGE
OECD ECONOMIC OUTLOOK, VOLUME 2016 ISSUE 1 © OECD 2016 – PRELIMINARY VERSION72
as reductions in public expenditure are needed in the long term to preserve fiscal
sustainability, they should be sought in areas other than investment.
Public spending and tax policies
Governments in advanced countries collect on average about 40% of GDP in taxes and
spend a similar amount on public goods, services and transfers. Size, composition and
design of spending and taxes may influence productivity growth and the distribution of
income. As the first part of this chapter showed, the redistributive power of taxes and cash
transfers, an important component of public spending, has been less in the 2000s than the
1990s. This section studies the long-term effects of government effectiveness and size, the
composition of public spending and specific taxes on productivity and inequality.
Government effectiveness and size
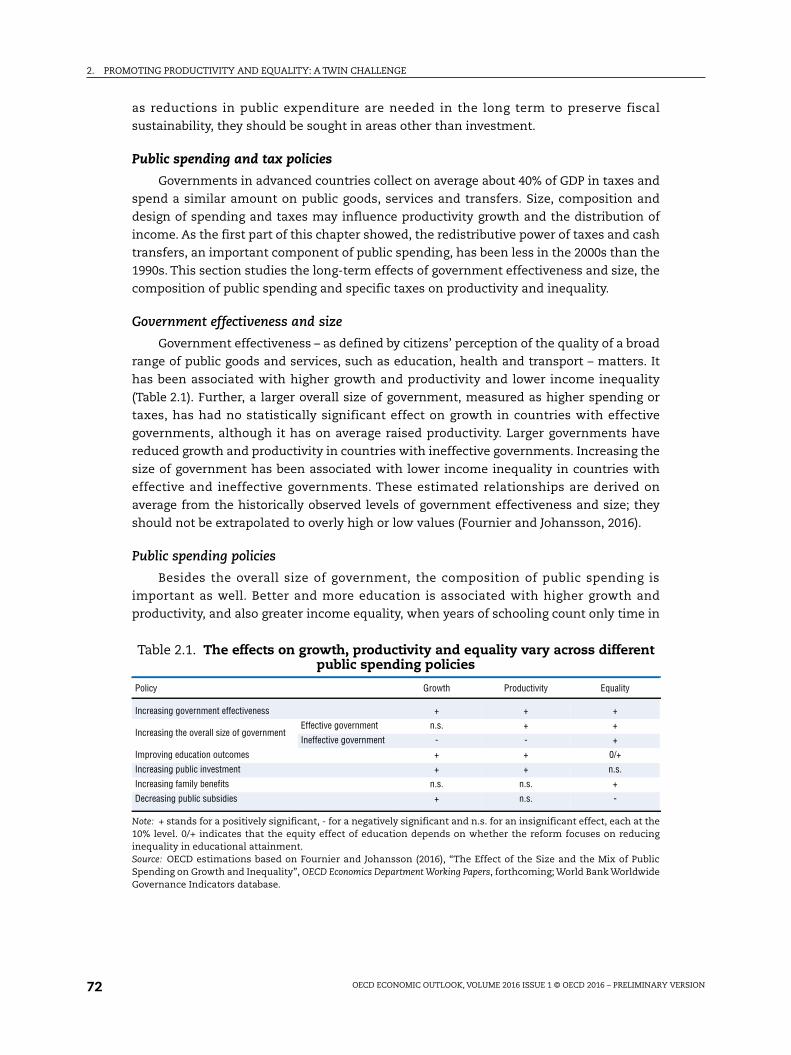
Government effectiveness – as defined by citizens’ perception of the quality of a broad
range of public goods and services, such as education, health and transport – matters. It
has been associated with higher growth and productivity and lower income inequality
(Table 2.1). Further, a larger overall size of government, measured as higher spending or
taxes, has had no statistically significant effect on growth in countries with effective
governments, although it has on average raised productivity. Larger governments have
reduced growth and productivity in countries with ineffective governments. Increasing the
size of government has been associated with lower income inequality in countries with
effective and ineffective governments. These estimated relationships are derived on
average from the historically observed levels of government effectiveness and size; they
should not be extrapolated to overly high or low values (Fournier and Johansson, 2016).
Public spending policies
Besides the overall size of government, the composition of public spending is
important as well. Better and more education is associated with higher growth and
productivity, and also greater income equality, when years of schooling count only time in
Table 2.1. The effects on growth, productivity and equality vary across differentpublic spending policies
Policy Growth Productivity Equality
Increasing government effectiveness + + +
Increasing the overall size of governmentEffective government n.s. + +
Ineffective government - - +
Improving education outcomes + + 0/+
Increasing public investment + + n.s.
Increasing family benefits n.s. n.s. +
Decreasing public subsidies + n.s. -
Note: + stands for a positively significant, - for a negatively significant and n.s. for an insignificant effect, each at the10% level. 0/+ indicates that the equity effect of education depends on whether the reform focuses on reducinginequality in educational attainment.Source: OECD estimations based on Fournier and Johansson (2016), “The Effect of the Size and the Mix of PublicSpending on Growth and Inequality”, OECD Economics Department Working Papers, forthcoming; World Bank WorldwideGovernance Indicators database.
2. PROMOTING PRODUCTIVITY AND EQUALITY: A TWIN CHALLENGE
OECD ECONOMIC OUTLOOK, VOLUME 2016 ISSUE 1 © OECD 2016 – PRELIMINARY VERSION 73
primary and secondary education, not tertiary education.5 This is in line with evidence
that investing in early childhood education yields high returns since it enhances equality
of opportunity and skill acquisition throughout life (Wößmann, 2008; Cuhna et al., 2010;
Heckman, 2011; Cingano, 2014; OECD, 2015b). The empirical links of better and more
education with higher growth, productivity and equality suggest long-term benefits from a
greater share of education in public spending.
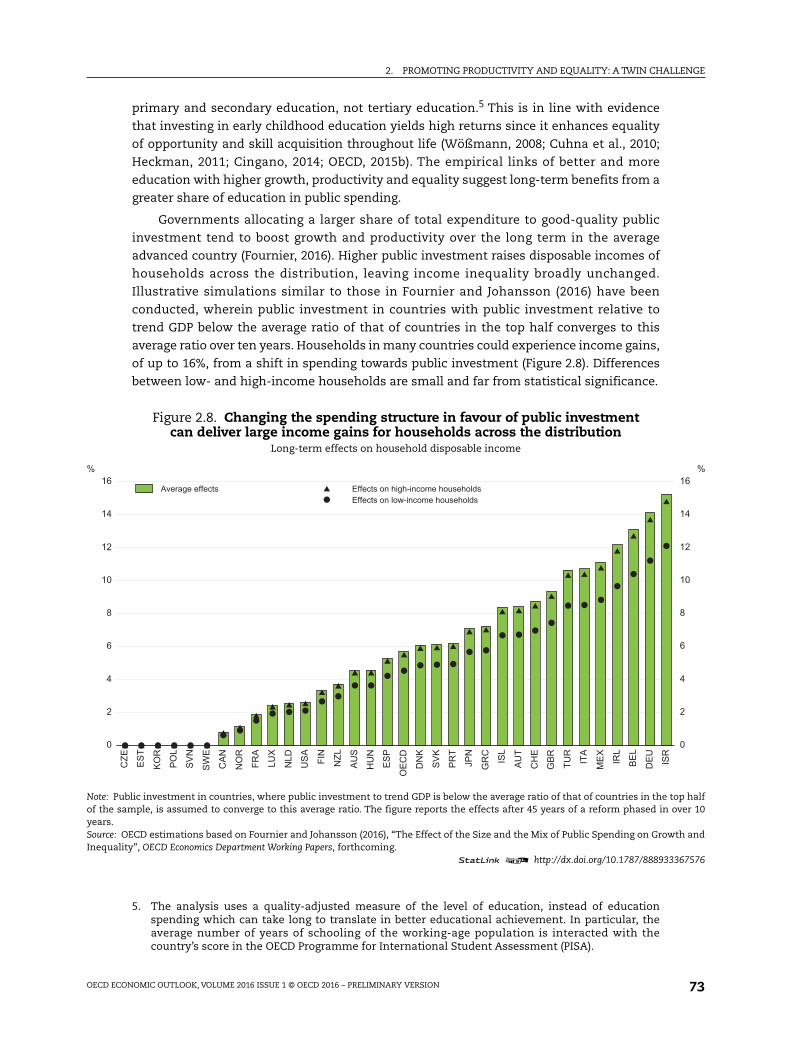
Governments allocating a larger share of total expenditure to good-quality public
investment tend to boost growth and productivity over the long term in the average
advanced country (Fournier, 2016). Higher public investment raises disposable incomes of
households across the distribution, leaving income inequality broadly unchanged.
Illustrative simulations similar to those in Fournier and Johansson (2016) have been
conducted, wherein public investment in countries with public investment relative to
trend GDP below the average ratio of that of countries in the top half converges to this
average ratio over ten years. Households in many countries could experience income gains,
of up to 16%, from a shift in spending towards public investment (Figure 2.8). Differences
between low- and high-income households are small and far from statistical significance.
5. The analysis uses a quality-adjusted measure of the level of education, instead of educationspending which can take long to translate in better educational achievement. In particular, theaverage number of years of schooling of the working-age population is interacted with thecountry’s score in the OECD Programme for International Student Assessment (PISA).
Figure 2.8. Changing the spending structure in favour of public investmentcan deliver large income gains for households across the distribution
Long-term effects on household disposable income
Note: Public investment in countries, where public investment to trend GDP is below the average ratio of that of countries in the top halfof the sample, is assumed to converge to this average ratio. The figure reports the effects after 45 years of a reform phased in over 10years.Source: OECD estimations based on Fournier and Johansson (2016), “The Effect of the Size and the Mix of Public Spending on Growth andInequality”, OECD Economics Department Working Papers, forthcoming.
1 2 http://dx.doi.org/10.1787/888933367576
0
2
4
6
8
10
12
14
16%
0
2
4
6
8
10
12
14
16%
CZE ES
T
KO
R
PO
L
SV
N
SW
E
CA
N
NO
R
FRA
LUX
NLD
US
A
FIN
NZL
AU
S
HU
N
ES
P
OE
CD
DN
K
SV
K
PR
T
JPN
GR
C
ISL
AU
T
CH
E
GB
R
TUR
ITA
ME
X
IRL
BE
L
DE
U
ISR
Average effectsEffects on low-income householdsEffects on high-income households
2. PROMOTING PRODUCTIVITY AND EQUALITY: A TWIN CHALLENGE
OECD ECONOMIC OUTLOOK, VOLUME 2016 ISSUE 1 © OECD 2016 – PRELIMINARY VERSION74
Education and public investment are the two areas of public expenditure that are
estimated to be associated with higher long-term productivity. They should thus receive
priority in government budgetary plans. Two other spending items, social spending on
family and child care and public subsidies, appear to reduce income inequality. Family
benefits tend to target lower-income households, and more child care may facilitate access
to the labour market especially for lower-income households with children. Some
subsidies may be used to redistribute, lowering income inequality. Subsidies are, however,
negatively related with economic growth, although their association with productivity is
insignificant. No statistically significant effects have been identified for other areas of
public spending, for example health.
Tax policies
Evidence is also available about the consequences of specific taxes, in particular
corporate income taxes, on productivity and inequality (Johansson et al., 2008; Cournède et
al., 2014). Reducing statutory corporate income tax rates tends to raise productivity
(Schwellnus and Arnold, 2008; Vartia, 2008). High corporate income taxes may reduce
incentives to invest in innovative activities by lowering their after-tax returns. Further,
corporate income taxes favour debt over equity when only interest payments, and not the
notional costs of equity finance, are tax deductible, as is the practice in most advanced
countries. This may discriminate against industries, such as knowledge-based industries,
that rely more on equity. The effect of lower corporate income taxes on inequality is less
clear, which can limit their attractiveness, despite the likely productivity gains. Inequality
may rise, because of the concentration of holdings of corporate shares. But lower corporate
income taxes may also increase employment, which could reduce inequality.
Other tax instruments that are related to incentives for innovation include top
personal income tax rates and R&D tax credits. Higher top personal income tax rates have
been associated with lower long-run productivity (Vartia, 2008), possibly because they
reduce the post-tax returns for successful entrepreneurs. R&D tax credits boost R&D
spending (Westmore, 2014), which may, as some evidence indicates (Égert, 2016), increase
productivity. As the next section shows, such fiscal incentives for R&D tend to be broadly
neutral with respect to income inequality. Some countries have introduced preferential
taxes on intellectual activities (“IP boxes”) to encourage investment in knowledge-based
capital. However, concerns have been raised about their efficacy in encouraging new
innovation and the degree to which they encourage profit shifting (OECD, 2015d; IMF, 2016).
Competition and innovation policies
In the aftermath of the global financial crisis, many advanced countries have
undertaken structural reforms, such as reforms in product and labour markets. These
structural reforms have improved resource allocation and the prospects for economic
growth. Their benefits may be due to higher productivity, higher employment or both, and
they might, or might not, be evenly spread across income groups. This section highlights
reforms that are likely to promote productivity and examines their effects on income
inequality.
Reforms of product markets
Product market reforms raise productivity. Evidence on this beneficial effect of
product market reforms comes from several cross-country sources: the macro-level
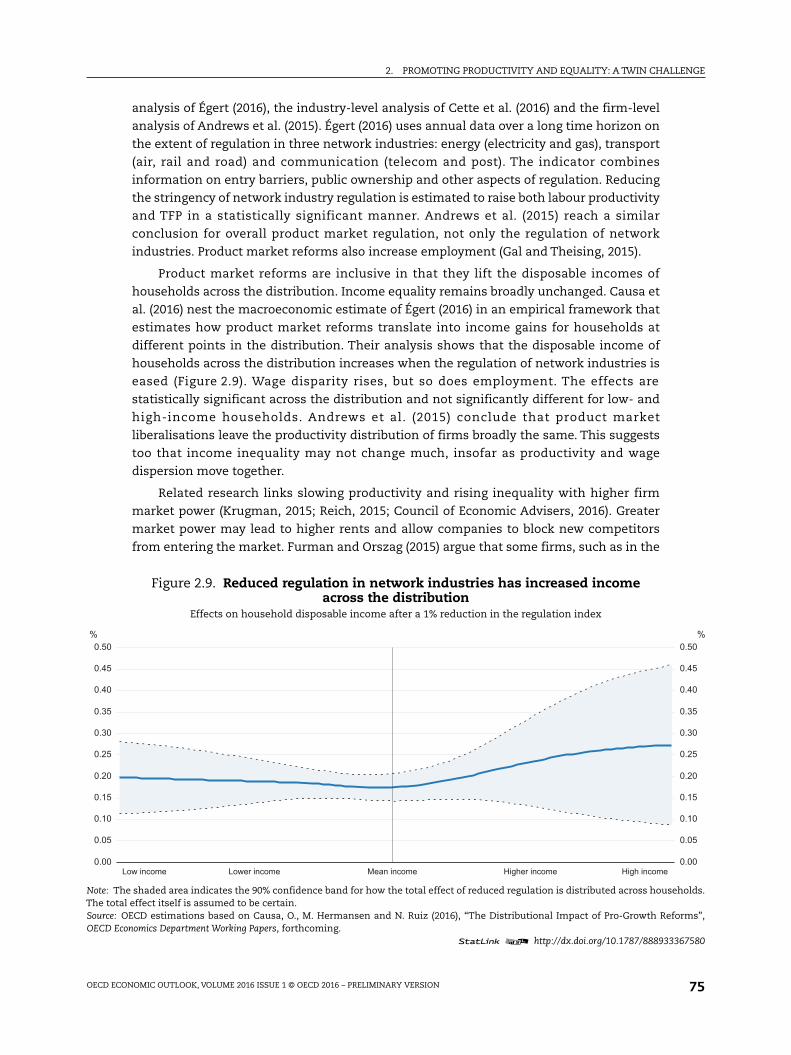
2. PROMOTING PRODUCTIVITY AND EQUALITY: A TWIN CHALLENGE
OECD ECONOMIC OUTLOOK, VOLUME 2016 ISSUE 1 © OECD 2016 – PRELIMINARY VERSION 75
analysis of Égert (2016), the industry-level analysis of Cette et al. (2016) and the firm-level
analysis of Andrews et al. (2015). Égert (2016) uses annual data over a long time horizon on
the extent of regulation in three network industries: energy (electricity and gas), transport
(air, rail and road) and communication (telecom and post). The indicator combines
information on entry barriers, public ownership and other aspects of regulation. Reducing
the stringency of network industry regulation is estimated to raise both labour productivity
and TFP in a statistically significant manner. Andrews et al. (2015) reach a similar
conclusion for overall product market regulation, not only the regulation of network
industries. Product market reforms also increase employment (Gal and Theising, 2015).
Product market reforms are inclusive in that they lift the disposable incomes of
households across the distribution. Income equality remains broadly unchanged. Causa et
al. (2016) nest the macroeconomic estimate of Égert (2016) in an empirical framework that
estimates how product market reforms translate into income gains for households at
different points in the distribution. Their analysis shows that the disposable income of
households across the distribution increases when the regulation of network industries is
eased (Figure 2.9). Wage disparity rises, but so does employment. The effects are
statistically significant across the distribution and not significantly different for low- and
high-income households. Andrews et al. (2015) conclude that product market
liberalisations leave the productivity distribution of firms broadly the same. This suggests
too that income inequality may not change much, insofar as productivity and wage
dispersion move together.
Related research links slowing productivity and rising inequality with higher firm
market power (Krugman, 2015; Reich, 2015; Council of Economic Advisers, 2016). Greater
market power may lead to higher rents and allow companies to block new competitors
from entering the market. Furman and Orszag (2015) argue that some firms, such as in the
Figure 2.9. Reduced regulation in network industries has increased incomeacross the distribution
Effects on household disposable income after a 1% reduction in the regulation index
Note: The shaded area indicates the 90% confidence band for how the total effect of reduced regulation is distributed across households.The total effect itself is assumed to be certain.Source: OECD estimations based on Causa, O., M. Hermansen and N. Ruiz (2016), “The Distributional Impact of Pro-Growth Reforms”,OECD Economics Department Working Papers, forthcoming.
1 2 http://dx.doi.org/10.1787/888933367580
0.00
0.05
0.10
0.15
0.20
0.25
0.30
0.35
0.40
0.45
0.50 %
0.00
0.05
0.10
0.15
0.20
0.25
0.30
0.35
0.40
0.45
0.50 %
Low income Lower income Mean income Higher income High income
2. PROMOTING PRODUCTIVITY AND EQUALITY: A TWIN CHALLENGE
OECD ECONOMIC OUTLOOK, VOLUME 2016 ISSUE 1 © OECD 2016 – PRELIMINARY VERSION76
technology sector or finance, benefit from consistently high supernormal profits and share
these with workers through wage premiums. To a certain extent, such winner-takes-all
phenomena can be efficient due to the way technologically-advanced services benefit from
a large user base. In other cases, however, anti-competitive actions by firms (such as
mergers and acquisitions) may have exacerbated market power. Robust enforcement of the
competition regime, combined with a reduction in regulatory barriers to entry and exit, can
thus improve efficiency and equality. Competition regimes may also have to be reviewed
and adapted to new technologies. Furthermore, in areas, such as intellectual property
rights protection, copyright systems or R&D support, well-intentioned policies designed to
boost innovation efforts may inadvertently give an edge to incumbents at the expense of
innovative start-ups (Bravo-Biosca et al., 2014).
Innovation policies
The effects of policies specifically aimed at boosting innovation, for which few direct
indicators are available, are more difficult to determine. Égert (2016) and Causa et al. (2016)
approximate innovation with private and public R&D expenditure (per cent of GDP) and the
number of patent applications (per capita). These measures may be interpreted as
capturing the effects of policies that increase incentives for R&D spending and patent
applications. When R&D spending or patent applications increase, labour productivity and
TFP rise in a statistically significant manner. In line with these results, stronger patent
rights protection has been found to raise productivity (Bouis et al., 2011).
Empirical evidence suggests that, like product market reforms, higher R&D spending
is inclusive in that it is associated with higher disposable income for households across the
distribution. Income gains from innovation activities reflected in the number of patent
applications are more unequally distributed, as the income of households in the lower half
of the distribution does not increase. This finding may be due to technological
advancements primarily benefiting high-skilled workers. However, the magnitude of the
differences in the effects on households is small, so that policy changes also in this area are
unlikely to lead to a notable rise in income inequality. Related studies that not only focus
on inequality of income but also of opportunity indicate that innovativeness is positively
correlated with social mobility. As innovativeness in an economy rises, children become
more likely to be either higher up or lower down in the income distribution than their
parents (Aghion et al., 2015, 2016).
Innovation policies that reduce productivity dispersion across firms may diminish
labour income inequality. Results from firm-level micro data suggest that more R&D
collaboration between universities and firms reduces the productivity gap between the less
productive and most productive firms (Andrews et al., 2015). This may be because R&D
collaboration with universities facilitates technological diffusion by providing smaller
firms with access to sources of knowledge, such as advanced machinery or skilled
scientists. Thus, initiatives to encourage R&D collaboration between universities and firms
bear the promise of both raising productivity and equality.
Policies to reduce skill mismatch
Skill mismatch is high in many advanced economies (OECD, 2016a). A better matching
of jobs and skills is likely to improve the allocation of labour across firms. Adalet McGowan
and Andrews (2015) find that skill mismatch is associated with more stringent framework
policies (product market regulation, cost of closing a business) and mobility-restricting
2. PROMOTING PRODUCTIVITY AND EQUALITY: A TWIN CHALLENGE
OECD ECONOMIC OUTLOOK, VOLUME 2016 ISSUE 1 © OECD 2016 – PRELIMINARY VERSION 77
housing policies (transaction costs, rent control, responsiveness of housing supply).
Reforms in these areas can facilitate the reallocation of workers who are over-skilled for
their jobs to new jobs that better match their skills. This reallocation lifts workers’
productivity at the new firm and leads to higher wages. It is unlikely to make other workers
worse off. The influence of such worker reallocation on income inequality depends on the
location of over-skilled workers in the income distribution. Some evidence indicates that
over-skilling may be particularly common in some high-income industries, such as finance
and information and communication (Cazenave-Lacroutz, 2014).
Reforms of labour market regulations
Employment protection legislation may adversely impact productivity by restricting
workers from moving into emerging, high-productivity firms or industries and
discouraging entrepreneurs from undertaking high-growth but risky ventures. Studies
using both firm- and industry-level data provide evidence in support of this (Bassanini et
al., 2009; Andrews et al., 2015). Recent research using aggregate cross-country time-series
data finds mixed results for the productivity effect of employment protection regulations
(Égert, 2016). Easing of employment protection is likely to benefit efficient firms, which at
least initially could widen productivity differentials between firms and wage differentials
between workers (Andrews et al., 2015). Such a reform might, however, increase inequality
(OECD, 2011), possibly by further depressing the income of lower-income households
(Causa et al., 2016). On the other hand, easing of dismissal costs tends to reduce labour
market duality by aligning the stringency of employment protection between standard and
non-standard work (Boeri, 2011). While effects of duality are difficult to identify in cross-
country data, studies focusing on specific countries tend to show that reducing duality can
improve productivity and lower inequality, by allowing more workers to get a foothold in
stable jobs and increasing their commitment.
Coherence between policies
Coherence between policies is important for ensuring that they work together to
enhance the overall well-being of citizens. Labour market policies, for example, can
interact with other policies, such as product market policies, and influence the
productivity benefits from reforming product markets. Product market reforms often
enhance economic flexibility. Labour market policies can facilitate the reallocation of
workers, which would help reap the benefits from more flexible product markets.
Product market reforms imply a higher likelihood of losing a job and of finding a job
for people who are unemployed or out of the labour force. Which income groups are
affected by the increased labour market churn that comes with product market reforms?
Low-income workers have a higher probability than other income groups of leaving
employment (Cournède et al., 2016a; Garda, 2016). They are also the income group for
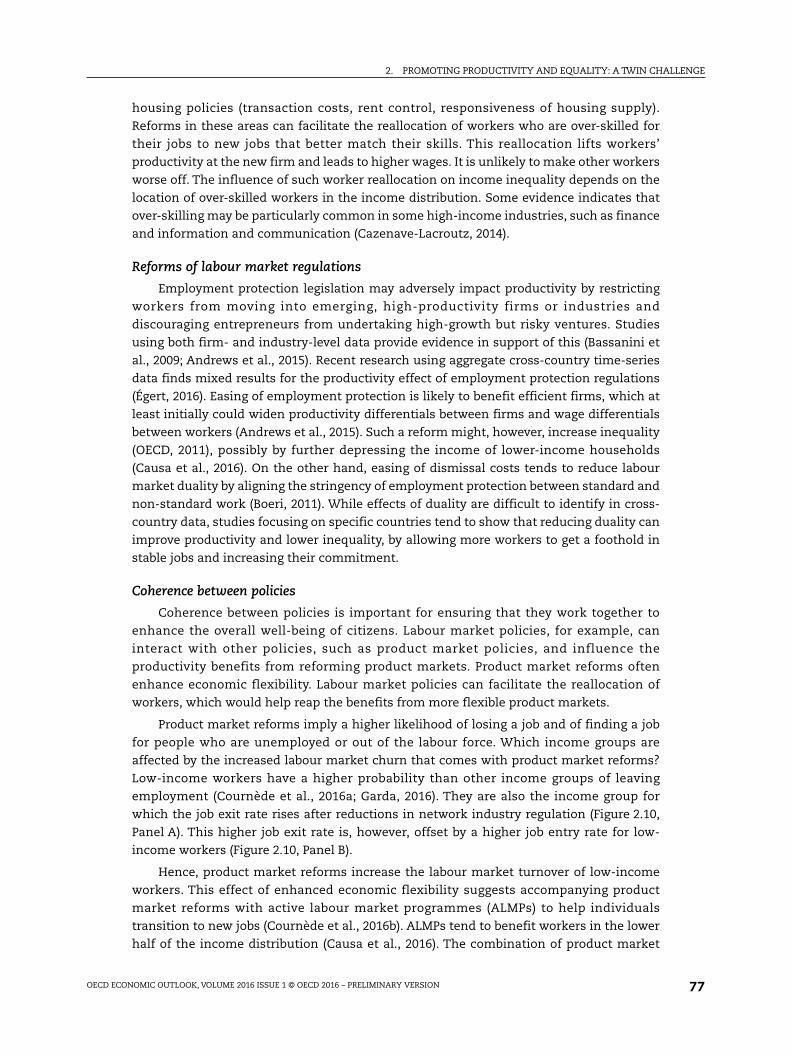
which the job exit rate rises after reductions in network industry regulation (Figure 2.10,
Panel A). This higher job exit rate is, however, offset by a higher job entry rate for low-
income workers (Figure 2.10, Panel B).
Hence, product market reforms increase the labour market turnover of low-income
workers. This effect of enhanced economic flexibility suggests accompanying product
market reforms with active labour market programmes (ALMPs) to help individuals
transition to new jobs (Cournède et al., 2016b). ALMPs tend to benefit workers in the lower
half of the income distribution (Causa et al., 2016). The combination of product market
2. PROMOTING PRODUCTIVITY AND EQUALITY: A TWIN CHALLENGE
OECD ECONOMIC OUTLOOK, VOLUME 2016 ISSUE 1 © OECD 2016 – PRELIMINARY VERSION78
reforms and effective ALMPs can therefore raise productivity and household income, while
lowering income inequality. Complementary evidence on mass lay-offs underlines that
ALMPs also improve re-employment prospects of displaced workers (Andrews and Saia,
2016).
Other policy interactions are likely to be important for productivity. For instance,
implementing regulatory reforms in product and labour markets jointly may be better than
a “one-sided” reform (Égert, 2016). The effectiveness of policies is also likely to depend on
the economic environment in the country. An example is higher R&D spending, where
favourable effects on productivity increase with a stronger rule of law, market settings
more conducive to business start-ups and growth and lower barriers to trade. Estimating
empirically the inequality effects of such policy complementarities is an important area for
future research.
Financial market policies
Finance is important for funding investment and innovation. But finance is also likely
to have contributed to the initial shortfall in aggregate demand and the current weakness
in investment. Excessive leverage has been stifling household consumption, and credit
supply constraints may have exacerbated the investment slowdown. Write-downs of non-
performing loans and faster bank recapitalisations would help households deleverage and
facilitate the provision of new credit, which is particularly important for the euro area. For
some European countries, inefficient insolvency regimes have been identified as a barrier
to addressing the rise in non-performing loans (Bergthaler et al., 2015). In the United States,
high household debt levels were an important source of the contraction in consumption
(Mian and Sufi, 2014).
Figure 2.10. Reduced regulation in network industries has increased labour market transitionsfor low-income groups
Changes in average transition rates after a typical reform in network regulation
Note: Black segments indicate 90% confidence intervals. Quartiles are calculated over the previous year’s average monthly labour incomein months during which the individual worked. The effects are estimated with micro data for 26 OECD countries over 1994-2012.Source: OECD estimations based on Cournède B., O. Denk and P. Garda (2016), “Effects of Flexibility-Enhancing Reforms on EmploymentTransitions”, OECD Economics Department Working Papers, forthcoming.
1 2 http://dx.doi.org/10.1787/888933367595
Bottom 25% 3rd quartile2nd quartile Top 25%
0
5
10
15
20
25
30
35
40%
-
--
-
-
--
-
OECD averageImpact of a typical reform
A. Becoming jobless
Bottom 25% 3rd quartile2nd quartile Top 25%
0
10
20
30
40
50
60
70
80%
-
- - -
-
- - -
B. Becoming employed
2. PROMOTING PRODUCTIVITY AND EQUALITY: A TWIN CHALLENGE
OECD ECONOMIC OUTLOOK, VOLUME 2016 ISSUE 1 © OECD 2016 – PRELIMINARY VERSION 79
One finance-related factor which is likely to hold back long-term productivity growth
is that many banks and similar financial institutions benefit from too-big-to-fail (TBTF)
guarantees by governments and central banks, despite new regulatory measures in Basel
III. TBTF reflects the perception by the holders of bank debt and, to some extent, bank
equity that their investments are protected. One way such TBTF guarantees may have
found their way into the real economy is the rapid pre-crisis rise of bank credit.
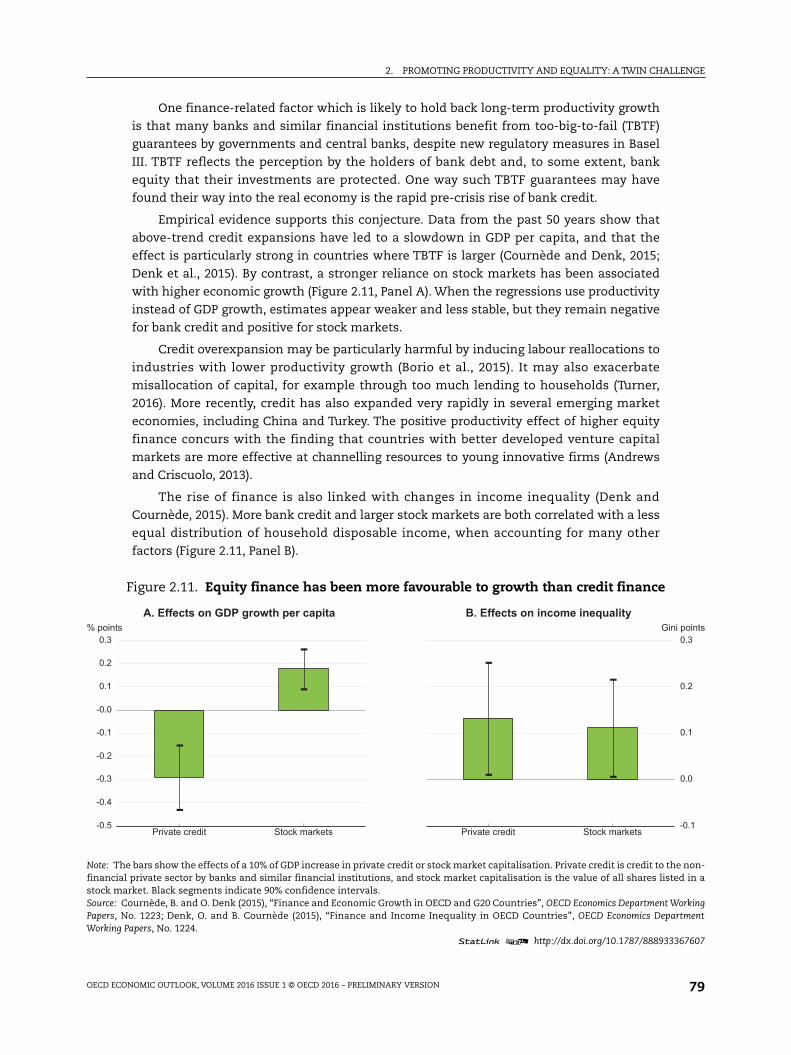
Empirical evidence supports this conjecture. Data from the past 50 years show that
above-trend credit expansions have led to a slowdown in GDP per capita, and that the
effect is particularly strong in countries where TBTF is larger (Cournède and Denk, 2015;
Denk et al., 2015). By contrast, a stronger reliance on stock markets has been associated
with higher economic growth (Figure 2.11, Panel A). When the regressions use productivity
instead of GDP growth, estimates appear weaker and less stable, but they remain negative
for bank credit and positive for stock markets.
Credit overexpansion may be particularly harmful by inducing labour reallocations to
industries with lower productivity growth (Borio et al., 2015). It may also exacerbate
misallocation of capital, for example through too much lending to households (Turner,
2016). More recently, credit has also expanded very rapidly in several emerging market
economies, including China and Turkey. The positive productivity effect of higher equity
finance concurs with the finding that countries with better developed venture capital
markets are more effective at channelling resources to young innovative firms (Andrews
and Criscuolo, 2013).
The rise of finance is also linked with changes in income inequality (Denk and
Cournède, 2015). More bank credit and larger stock markets are both correlated with a less
equal distribution of household disposable income, when accounting for many other
factors (Figure 2.11, Panel B).
Figure 2.11. Equity finance has been more favourable to growth than credit finance
Note: The bars show the effects of a 10% of GDP increase in private credit or stock market capitalisation. Private credit is credit to the non-financial private sector by banks and similar financial institutions, and stock market capitalisation is the value of all shares listed in astock market. Black segments indicate 90% confidence intervals.Source: Cournède, B. and O. Denk (2015), “Finance and Economic Growth in OECD and G20 Countries”, OECD Economics Department WorkingPapers, No. 1223; Denk, O. and B. Cournède (2015), “Finance and Income Inequality in OECD Countries”, OECD Economics DepartmentWorking Papers, No. 1224.
1 2 http://dx.doi.org/10.1787/888933367607
Private credit Stock markets-0.5
-0.4
-0.3
-0.2
-0.1
-0.0
0.1
0.2
0.3% points
-
-
-
-A. Effects on GDP growth per capita
Private credit Stock markets-0.1
0.0
0.1
0.2
0.3Gini points
- -
--
B. Effects on income inequality
2. PROMOTING PRODUCTIVITY AND EQUALITY: A TWIN CHALLENGE
OECD ECONOMIC OUTLOOK, VOLUME 2016 ISSUE 1 © OECD 2016 – PRELIMINARY VERSION80
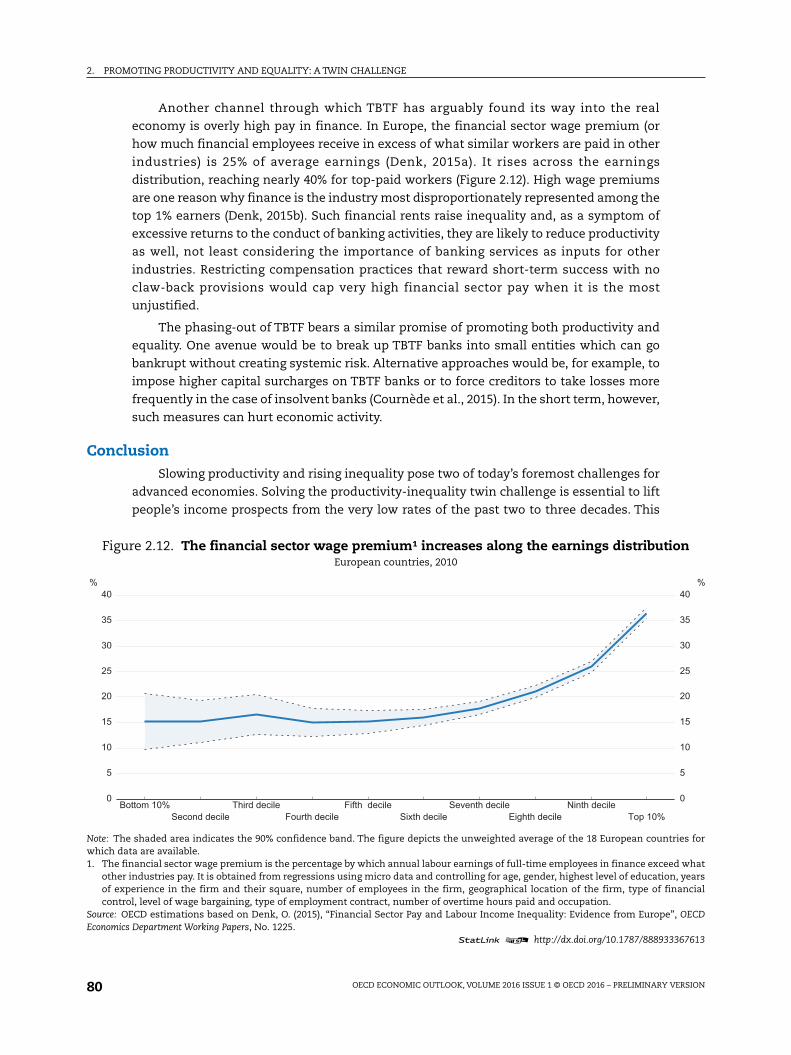
Another channel through which TBTF has arguably found its way into the real
economy is overly high pay in finance. In Europe, the financial sector wage premium (or
how much financial employees receive in excess of what similar workers are paid in other
industries) is 25% of average earnings (Denk, 2015a). It rises across the earnings
distribution, reaching nearly 40% for top-paid workers (Figure 2.12). High wage premiums
are one reason why finance is the industry most disproportionately represented among the
top 1% earners (Denk, 2015b). Such financial rents raise inequality and, as a symptom of
excessive returns to the conduct of banking activities, they are likely to reduce productivity
as well, not least considering the importance of banking services as inputs for other
industries. Restricting compensation practices that reward short-term success with no
claw-back provisions would cap very high financial sector pay when it is the most
unjustified.
The phasing-out of TBTF bears a similar promise of promoting both productivity and
equality. One avenue would be to break up TBTF banks into small entities which can go
bankrupt without creating systemic risk. Alternative approaches would be, for example, to
impose higher capital surcharges on TBTF banks or to force creditors to take losses more
frequently in the case of insolvent banks (Cournède et al., 2015). In the short term, however,
such measures can hurt economic activity.
ConclusionSlowing productivity and rising inequality pose two of today’s foremost challenges for
advanced economies. Solving the productivity-inequality twin challenge is essential to lift
people’s income prospects from the very low rates of the past two to three decades. This
Figure 2.12. The financial sector wage premium¹ increases along the earnings distributionEuropean countries, 2010
Note: The shaded area indicates the 90% confidence band. The figure depicts the unweighted average of the 18 European countries forwhich data are available.1. The financial sector wage premium is the percentage by which annual labour earnings of full-time employees in finance exceed what
other industries pay. It is obtained from regressions using micro data and controlling for age, gender, highest level of education, yearsof experience in the firm and their square, number of employees in the firm, geographical location of the firm, type of financialcontrol, level of wage bargaining, type of employment contract, number of overtime hours paid and occupation.
Source: OECD estimations based on Denk, O. (2015), “Financial Sector Pay and Labour Income Inequality: Evidence from Europe”, OECDEconomics Department Working Papers, No. 1225.
1 2 http://dx.doi.org/10.1787/888933367613
Bottom 10% Third decile Fifth decile Seventh decile Ninth decileSecond decile Fourth decile Sixth decile Eighth decile Top 10%
0
5
10
15
20
25
30
35
40 %
0
5
10
15
20
25
30
35
40 %
2. PROMOTING PRODUCTIVITY AND EQUALITY: A TWIN CHALLENGE
OECD ECONOMIC OUTLOOK, VOLUME 2016 ISSUE 1 © OECD 2016 – PRELIMINARY VERSION 81
requires coherent and comprehensive policy packages combining demand and structural
policies. The chapter has outlined the key general lessons for the design of such policy
packages. Reforms also need to take into account country-specific aspects of the
institutional framework and policy settings currently in place. Even as each package
deploys monetary and fiscal policy, and levers from each of the suite of structural policies
(public spending and taxes, competition and innovation, financial system structure and
performance), there is no one-size fits all.
The primary focus of the chapter has been on advanced economies, for which the
productivity slowdown has been most severe and the evidence base is the strongest.
However, productivity growth has declined and income inequality is high in some
emerging market economies, too. Gaps in productivity and income are large between
advanced and emerging market economies. Many structural reform priorities are similar to
those for advanced countries (OECD, 2016b). One distinguishing feature of emerging
market economies are high rates of informality. These often trap low-skilled workers in
informal, low-productivity firms and can thus contribute to low productivity and high
inequality (Hsieh, 2015). In such cases, reforms that combine education, regulation,
taxation and the rule of law can help (Dougherty and Escobar, 2013).
Bibliography
Adalet McGowan, M. and D. Andrews (2015), “Labour Market Mismatch and Labour Productivity:Evidence from PIAAC Data”, OECD Economics Department Working Papers, No. 1209, OECD Publishing,Paris.
Aghion, P., U. Akcigit, A. Hyytinen and O. Toivanen (2016), “Living the ‘American Dream’ in Finland: TheSocial Mobility of Innovators”, Presentation at the Annual Meeting of the American EconomicAssociation, San Francisco.
Aghion, P., U. Akcigit, A. Bergeaud, R. Blundell and D. Hémous (2015), “Innovation and Top IncomeInequality”, NBER Working Papers, No. 21247.
Alvaredo, F., A. B. Atkinson, T. Piketty and E. Saez (2013), “The Top 1 Percent in International andHistorical Perspective”, Journal of Economic Perspectives, 27(3), pp. 3-20.
Andrews, D. and C. Criscuolo (2013), “Knowledge-Based Capital, Innovation and Resource Allocation”,OECD Economic Policy Papers, No. 4, OECD Publishing, Paris.
Andrews, D. and A. Saia (2016), “Coping with Creative Destruction: Reducing the Costs of Firm Exit”,OECD Economics Department Working Papers, forthcoming, OECD Publishing, Paris.
Andrews, D., E. Bartelsman and C. Criscuolo (2016), “Firm Dynamics and Productivity Growth inEurope”, mimeo, OECD.
Andrews, D., C. Criscuolo and P. Gal (2016), “Mind the Gap: Productivity Divergence between the GlobalFrontier and Laggard Firms”, OECD Productivity Working Papers, forthcoming, OECD Publishing, Paris.
Andrews, D., C. Criscuolo and P. Gal (2015), “Frontier Firms, Technology Diffusion and Public Policy:Micro Evidence from OECD Countries”, OECD Productivity Working Papers, No. 2, OECD Publishing,Paris.
Auerbach, A. J. and Y. Gorodnichenko (2012), “Fiscal Multipliers in Recession and Expansion”, in: A.Alesina and F. Giavazzi (eds.), Fiscal Policy after the Financial Crisis, University of Chicago Press.
Autor, D. H., D. Dorn, G. H. Hanson and J. Song (2014), “Trade Adjustment: Worker-Level Evidence”,Quarterly Journal of Economics, 129(4), pp. 1799-1860.
Autor, D. H., D. Dorn and G. H. Hanson (2013), “The China Syndrome: Local Labor Market Effects ofImport Competition in the United States”, American Economic Review, 103(6), pp. 2121-2168.
Bassanini, A., L. Nunziata and D. Venn (2009), “Job Protection Legislation and Productivity Growth inOECD Countries”, Economic Policy, 24(58), pp. 349-402.
2. PROMOTING PRODUCTIVITY AND EQUALITY: A TWIN CHALLENGE
OECD ECONOMIC OUTLOOK, VOLUME 2016 ISSUE 1 © OECD 2016 – PRELIMINARY VERSION82
Bergthaler, W., K. Kang, Y. Liu and D. Monaghan (2015), “Tackling Small and Medium-Sized EnterpriseProblem Loans in Europe”, IMF Staff Discussion Notes, No. 4.
Boeri, T. (2011), “Institutional Reforms and Dualism in European Labor Markets”, in: D. Card and O.Ashenfelter (eds.), Handbook of Labor Economics, Vol. 4B, North Holland.
Borio, C., E. Kharroubi, C. Upper and F. Zampolli (2015), “Labour Reallocation and ProductivityDynamics: Financial Causes, Real Consequences”, BIS Working Papers, No. 534.
Bouis, R., R. Duval and F. Murtin (2011), “The Policy and Institutional Drivers of Economic Growthacross OECD and Non-OECD Economies: New Evidence from Growth Regressions”, OECD EconomicsDepartment Working Papers, No. 843, OECD Publishing, Paris.
Bravo-Biosca, A., C. Criscuolo and C. Menon (2014), “What Drives the Dynamics of Business Growth?”,Nesta Working Papers, No. 14-03.
Calligaris, S. (2015), “Misallocation and Total Factor Productivity in Italy: Evidence from Firm-LevelData”, LABOUR, 29(4), pp. 367-393.
Card, D., J. Heining and P. Kline (2013), “Workplace Heterogeneity and the Rise of West German WageInequality”, Quarterly Journal of Economics, 128(3), pp. 967-1015.
Causa, O., M. Hermansen and N. Ruiz (2016), “The Distributional Impact of Pro-Growth Reforms”, OECDEconomics Department Working Papers, forthcoming, OECD Publishing, Paris.
Cazenave-Lacroutz, A. (2014), “How Might the Financial Sector Increase Income Inequality: A Focus onthe Distribution of Credits to Households”, Research Internship Report, OECD and EcolePolytechnique.
Cette, G., J. Lopez and J. Mairesse (2016), “Market Regulations, Prices, and Productivity”, AmericanEconomic Review, 106(5), pp. 104-108.
Cingano, F. (2014), “Trends in Income Inequality and its Impact on Economic Growth”, OECD Social,Employment and Migration Working Papers, No. 163, OECD Publishing, Paris.
Council of Economic Advisers (2016), 2016 Economic Report of the President, US Government PrintingOffice, Washington DC.
Cournède, B. and O. Denk (2015), “Finance and Economic Growth in OECD and G20 Countries”, OECDEconomics Department Working Papers, No. 1223, OECD Publishing, Paris.
Cournède, B., O. Denk and P. Garda (2016a), “Effects of Flexibility-Enhancing Reforms on EmploymentTransitions”, OECD Economics Department Working Papers, forthcoming, OECD Publishing, Paris.
Cournède, B., O. Denk, P. Garda and P. Hoeller (2016b), “Enhancing Economic Flexibility: What Is in It forWorkers?”, OECD Economic Policy Papers, forthcoming, OECD Publishing, Paris.
Cournède, B., O. Denk and P. Hoeller (2015), “Finance and Inclusive Growth”, OECD Economic PolicyPapers, No. 14, OECD Publishing, Paris.
Cournède, B., A. Goujard and Á. Pina (2014), “Reconciling Fiscal Consolidation with Growth andEquity”, OECD Journal: Economic Studies, Vol. 2013, OECD Publishing, Paris.
Cuhna, F., J. J. Heckman and S. M. Schennach (2010), “Estimating the Technology of Cognitive andNoncognitive Skill Formation”, Econometrica, 78(3), pp. 883-931.
Denk, O. (2015a), “Financial Sector Pay and Labour Income Inequality: Evidence from Europe”, OECDEconomics Department Working Papers, No. 1225, OECD Publishing, Paris.
Denk, O. (2015b), “Who Are the Top 1% Earners in Europe?”, OECD Economics Department Working Papers,No. 1274, OECD Publishing, Paris.
Denk, O. and B. Cournède (2015), “Finance and Income Inequality in OECD Countries”, OECD EconomicsDepartment Working Papers, No. 1224, OECD Publishing, Paris.
Denk, O., S. Schich and B. Cournède (2015), “Why Implicit Bank Debt Guarantees Matter: SomeEmpirical Evidence”, OECD Journal: Financial Market Trends, Vol. 107, OECD Publishing, Paris.
Dias, D. A., C. Robalo Marques and C. Richmond (2015), “Misallocation and Productivity in the Lead upto the Eurozone Crisis”, International Finance Discussion Papers, No. 1146, Board of Governors of theFederal System.
Dougherty, S. M. and O. Escobar (2013), “The Determinants of Informality in Mexico’s States”, OECDEconomics Department Working Papers, No. 1043, OECD Publishing, Paris.
2. PROMOTING PRODUCTIVITY AND EQUALITY: A TWIN CHALLENGE
OECD ECONOMIC OUTLOOK, VOLUME 2016 ISSUE 1 © OECD 2016 – PRELIMINARY VERSION 83
Égert, B. (2016), “Regulation, Institutions, and Productivity: New Macroeconomic Evidence from OECDCountries”, American Economic Review, 106(5), pp. 109-113.
Förster, M., A. Llena-Nozal and V. Nafilyan (2014), “Trends in Top Incomes and their Taxation in OECDCountries”, OECD Social, Employment and Migration Working Papers, No. 159, OECD Publishing, Paris.
Fournier, J.-M. (2016), “The Positive Effect of Public Investment on Potential Growth”, OECD EconomicsDepartment Working Papers, forthcoming, OECD Publishing, Paris.
Fournier, J.-M. and Å. Johansson (2016), “The Effect of the Size and the Mix of Public Spending onGrowth and Inequality”, OECD Economics Department Working Papers, forthcoming, OECD Publishing,Paris.
Furman, J. and P. Orszag (2015), “A Firm-Level Perspective on the Role of Rents in the Rise inInequality”, Presentation at “A Just Society” Centennial Event in Honour of Joseph Stiglitz,Columbia University.
Gal, P. and A. Theising (2015), “The Macroeconomic Impact of Structural Policies on Labour MarketOutcomes in OECD Countries: A Re-Assessment”, OECD Economics Department Working Papers, No.1271, OECD Publishing, Paris.
Gamberoni, E., C. Giordano and P. Lopez-Garcia (2016), “Capital and Labour (Mis)Allocation in the Euro-Area: Stylised Facts and Possible Determinants”, ECB Working Paper Series, forthcoming.
García-Santana, M., E. Moral-Benito, J. Pijoan-Mas and R. Ramos (2016), “Growing like Spain: 1995-2007”, CEPR Discussion Papers, No. 11144.
Garda, P. (2016), “The Ins and Outs of Employment in 25 OECD Countries”, OECD Economics DepartmentWorking Papers, forthcoming, OECD Publishing, Paris.
Gopinath, G., Ş. Kalemli-Özcan, L. Karabarbounis and C. Villegas-Sanchez (2015), “Capital Allocationand Productivity in South Europe”, NBER Working Papers, No. 21453.
Håkanson, C., E. Lindqvist and J. Vlachos (2015), “Firms and Skills: The Evolution of Worker Sorting”,IFAU Working Papers, No. 2015:9, Uppsala.
Hall, R. E. (2016), “Macroeconomics of Persistent Slumps”, in: J. Taylor and H. Uhlig (eds.), Handbook ofMacroeconomics, Vol. 2, forthcoming, North Holland.
Heckman, J. J. (2011), “The Economics of Inequality: The Value of Early Childhood Education”, AmericanEducator, 35(1), pp. 31-47.
Hsieh, C.-T. (2015), “Policies for Productivity Growth”, OECD Productivity Working Papers, No. 3, OECDPublishing, Paris.
Ilzetzki, E., E. G. Mendoza and C. A. Végh (2013), “How Big (Small?) Are Fiscal Multipliers?”, Journal ofMonetary Economics, 60(2), pp. 239-254.
IMF (2016), Fiscal Monitor: Acting Now, Acting Together, Washington DC, April.
Johansson, Å., Y. Guillemette, F. Murtin, D. Turner, G. Nicoletti, C. de la Maisonneuve, P. Bagnoli, G.Bousquet and F. Spinelli (2013), “Long-Term Growth Scenarios”, OECD Economics Department WorkingPapers, No. 1000, OECD Publishing, Paris.
Johansson, Å., C. Heady, J. Arnold, B. Brys and L. Vartia (2008), “Taxation and Economic Growth”, OECDEconomics Department Working Papers, No. 620, OECD Publishing, Paris.
Kappeler, A., P.-A. Pionnier and C. Schwellnus (2016), “Decoupling of Productivity and Median WageGrowth: Macro-Level Evidence”, OECD Economics Department Working Papers, forthcoming, OECDPublishing, Paris.
Kierzenkowski, R., G. Machlica and G. Fulop (2016), “The UK Productivity Puzzle through theMagnifying Glass: A Sectoral Perspective”, OECD Economics Department Working Papers, forthcoming,OECD Publishing, Paris.
Krugman, P. (2015), “Challenging the Oligarchy”, The New York Review of Books, 17 December 2015.
Mian, A. and A. Sufi (2014), House of Debt: How They (and You) Caused the Great Recession, and How We CanPrevent It from Happening Again, University of Chicago Press.
OECD (2016a), The Productivity-Inclusiveness Nexus, OECD Publishing, Paris.
OECD (2016b), Economic Policy Reforms 2016: Going for Growth Interim Report, OECD Publishing, Paris.
OECD (2015a), The Future of Productivity, OECD Publishing, Paris.
2. PROMOTING PRODUCTIVITY AND EQUALITY: A TWIN CHALLENGE
OECD ECONOMIC OUTLOOK, VOLUME 2016 ISSUE 1 © OECD 2016 – PRELIMINARY VERSION84
OECD (2015b), In It Together: Why Less Inequality Benefits All, OECD Publishing, Paris.
OECD (2015c), OECD Economic Outlook – Volume 2015 Issue 1, OECD Publishing, Paris.
OECD (2015d), Measuring and Monitoring BEPS, Action 11 – 2015 Final Report, OECD/G20 Base Erosion andProfit Shifting Project, OECD Publishing, Paris.
OECD (2011), Divided We Stand: Why Inequality Keeps Rising, OECD Publishing, Paris.
O’Farrell, R., Ł. Rawdanowicz and K.-I. Inaba (2016), “Monetary Policy and Inequality”, OECD EconomicsDepartment Working Papers, No. 1281, OECD Publishing, Paris.
Ollivaud, P., Y. Guillemette and D. Turner (2016), “The Links between Weak Investment and theSlowdown in OECD Productivity and Potential Output Growth”, OECD Economics Department WorkingPapers, forthcoming, OECD Publishing, Paris.
Ollivaud, P. and D. Turner (2015), “The Effect of the Global Financial Crisis on OECD Potential Output”,OECD Journal: Economic Studies, Vol. 2014, OECD Publishing, Paris.
Reich, R. B. (2015), Saving Capitalism: For the Many, not the Few, Knopf.
Ruiz, N. and N. Woloszko (2016), “What Do Household Surveys Suggest about the Top 1% Incomes andInequality in OECD Countries?”, OECD Economics Department Working Papers, No. 1265, OECDPublishing, Paris.
Saia, A. and C. Schwellnus (2016), “Decoupling of Productivity and Median Wage Growth: Micro-LevelEvidence”, OECD Economics Department Working Papers, forthcoming, OECD Publishing, Paris.
Schwellnus, C. and J. Arnold (2008), “Do Corporate Taxes Reduce Productivity and Investment at theFirm Level? Cross-Country Evidence from the Amadeus Dataset”, OECD Economics DepartmentWorking Papers, No. 641, OECD Publishing, Paris.
Song, J., D. J. Price, F. Guvenen, N. Bloom and T. von Wachter (2015), “Firming up Inequality”, NBERWorking Papers, No. 21199.
Turner, A. (2016), Between Debt and the Devil: Money, Credit, and Fixing Global Finance, Princeton UniversityPress.
Vartia, L. (2008), “How Do Taxes Affect Investment and Productivity? An Industry-Level Analysis ofOECD Countries”, OECD Economics Department Working Papers, No. 656, OECD Publishing, Paris.
Westmore, B. (2014), “Policy Incentives for Private Innovation and Maximising the Returns”, OECDJournal: Economic Studies, Vol. 2013, OECD Publishing, Paris.
Wößmann, L. (2008), “Efficiency and Equity of European Education and Training Policies”, InternationalTax and Public Finance, 15(2), pp. 199-230.