promise and perils of an accelerated economy
TRANSCRIPT
May 2016
Promise and Perils of an Accelerated Economy Bay Area Economic Profile Ninth in a Series
About the Bay Area Council Economic InstituteSince 1990, the Bay Area Council Economic Institute has been the leading think tank focused on the economic and policy issues facing the San Francisco/Silicon Valley Bay Area, one of the most dynamic regions in the United States and the world’s leading center for technology and innovation. A valued forum for stakeholder engagement and a re-spected source of information and fact-based analysis, the Institute is a trusted partner and adviser to both business leaders and government officials. Through its economic and policy research and its many partnerships, the Institute addresses major factors impacting the competitiveness, economic development, and quality of life of the region and the state, including infrastructure, globalization, science and technology, and health policy. It is guided by a Board of Trustees drawn from influential leaders in the corporate, academic, non-profit, and government sectors. The Institute is housed at and supported by the Bay Area Council, a public policy organization that includes hundreds of the re-gion’s largest employers and is committed to keeping the Bay Area the world’s most competitive economy and best place to live. The Institute also supports and manages the Bay Area Science and Innovation Consortium (BASIC), a partnership of Northern California’s leading scientific research laboratories and thinkers.
About This Report
This report, the ninth in a series of Bay Area Economic Profile reports produced since 1997 by the Bay Area Council Economic Institute and McKinsey & Company, examines the region’s economy as it has emerged from the Great Recession to enter a new period of growth and innovation. As previous reports have done, it benchmarks the Bay Area’s performance against other knowledge-based economies to assess the region’s national and global competitiveness. It also examines the economic and policy challenges that continue to confront the region even in a period of extraordinary growth.
Acknowledgments
This Economic Profile report was prepared on a pro bono basis by McKinsey & Company in partnership with the Bay Area Council Economic Institute. It is the product of extensive analysis by the McKinsey team, research and management by the Economic Institute, and input from regional leaders.
Alex Maasry and Kausik Rajgopal led the effort for McKinsey with support from Zachary Kubetz and Andres Monge. Sean Randolph and Micah Weinberg led an Institute team that included Jeff Bellisario, Patrick Kallerman, and Camila Mena.
Photo Credits
Cover: “North View” by United States Geological Survey and Pacific Gas & Electric.
Section One: “Downtown Oakland skyline” by Paul A. Hernandez. This work is licensed under the Creative Commons Attribution 4.0 International License.
Section Two: “Silicon Valley from above” by Patrick Nouhailler. This work is licensed under the Creative Commons Attribution 4.0 International License. Grayscale adjustment made by the Bay Area Council Economic Institute.
Section Three: “San Francisco Shimmer” by Don McCullough. This work is licensed under the Creative Commons Attribution 4.0 International License. Grayscale adjustment made by the Bay Area Council Economic Institute.
Section Four: “Going home” by Greenbelt Alliance. This work is licensed under the Creative Commons Attribution 4.0 International License. Grayscale adjustment made by the Bay Area Council Economic Institute.
Contents
Executive Summary: An Economic Profile of the Bay Area ............... 2
Section One
The Bay Area is as Strong as Ever ..................................................... 5
Help Wanted ........................................................................................ 9
Unwavering Innovation ..................................................................... 11
Venture Capital Fuels Startup Growth .............................................. 13
Section Two
Sector Diversity as a Difference Maker ........................................... 19
Sector Strength .................................................................................. 19
Industry Disruption ............................................................................ 21
Section Three
Productivity and Affordability ........................................................ 23
Productivity Adjusted Costs .............................................................. 24
Worsening Affordability ..................................................................... 25
Section Four
Perennial Problems Persist .............................................................. 28
K-12 Challenges ................................................................................. 28
Higher Education Challenges ............................................................ 30
Strained Physical Infrastructure ......................................................... 33
Success in Spite of Regulatory Complexity ....................................... 34
Investing to Sustain Success .............................................................. 36
2
Executive SummaryIt has been over eight years since the onset of the Great Recession, and we are in the midst of one of the longest periods of consecutive jobs and output expansion in the history of the Bay Area. Since the middle of 2009, the region has posted consistent, strong growth in every quarter.
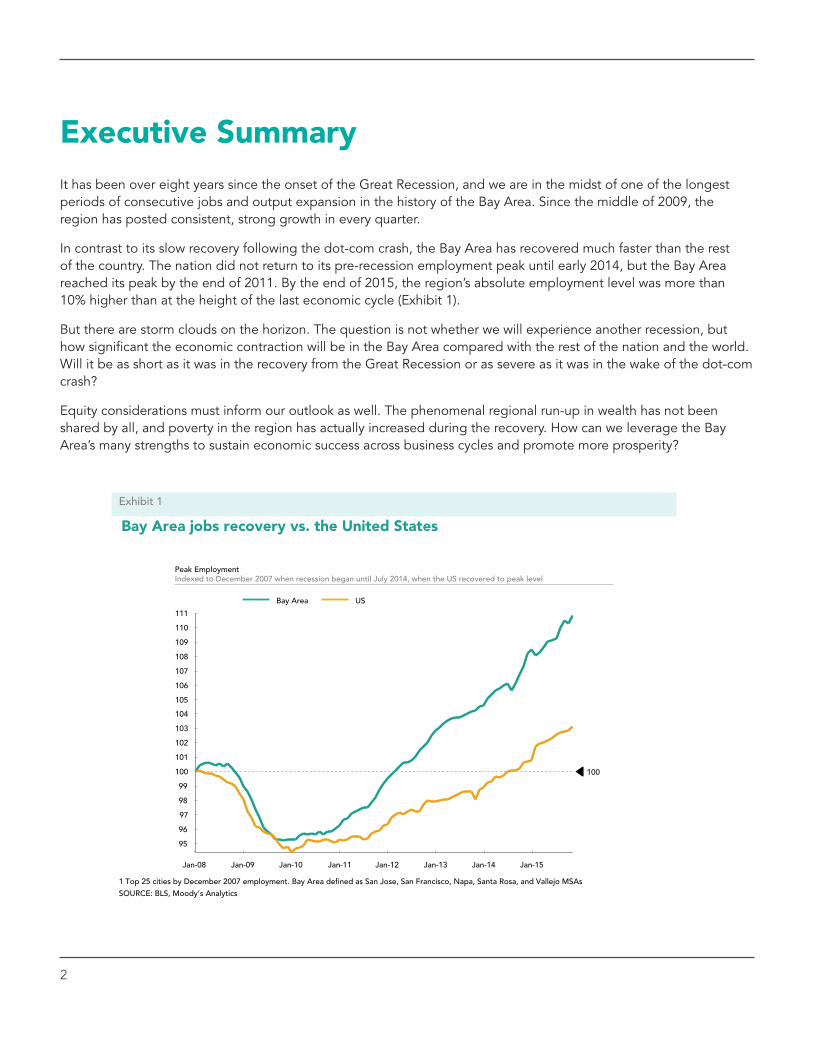
In contrast to its slow recovery following the dot-com crash, the Bay Area has recovered much faster than the rest of the country. The nation did not return to its pre-recession employment peak until early 2014, but the Bay Area reached its peak by the end of 2011. By the end of 2015, the region’s absolute employment level was more than 10% higher than at the height of the last economic cycle (Exhibit 1).
But there are storm clouds on the horizon. The question is not whether we will experience another recession, but how significant the economic contraction will be in the Bay Area compared with the rest of the nation and the world. Will it be as short as it was in the recovery from the Great Recession or as severe as it was in the wake of the dot-com crash?
Equity considerations must inform our outlook as well. The phenomenal regional run-up in wealth has not been shared by all, and poverty in the region has actually increased during the recovery. How can we leverage the Bay Area’s many strengths to sustain economic success across business cycles and promote more prosperity?
Bay Area jobs recovery vs. the United States
SOURCE: BLS, Moody’s Analytics
109
111
110
105
98
102
Jan-10 Jan-08
95
103
97
Jan-09
101
108
104
106
99
96
Jan-14
100
Jan-12
107
Jan-11 Jan-13 Jan-15
100
Peak Employment Indexed to December 2007 when recession began until July 2014, when the US recovered to peak level
Bay Area US
1 Top 25 cities by December 2007 employment. Bay Area de ned as San Jose, San Francisco, Napa, Santa Rosa, and Vallejo MSAs
Exhibit 1
3
Bay Area Economic Profile
The Bay Area is diversi ed across top performing companies compared to peers
SOURCE: Fortune, Capital IQ, McKinsey analysis
Fortune 500 Companies by Industry Sector
Houston
New York
Bay Area
Energy & Utilities Financials Information Technology/Telecommunications Health Consumer
Discretionary/Media
Exhibit 2
Others
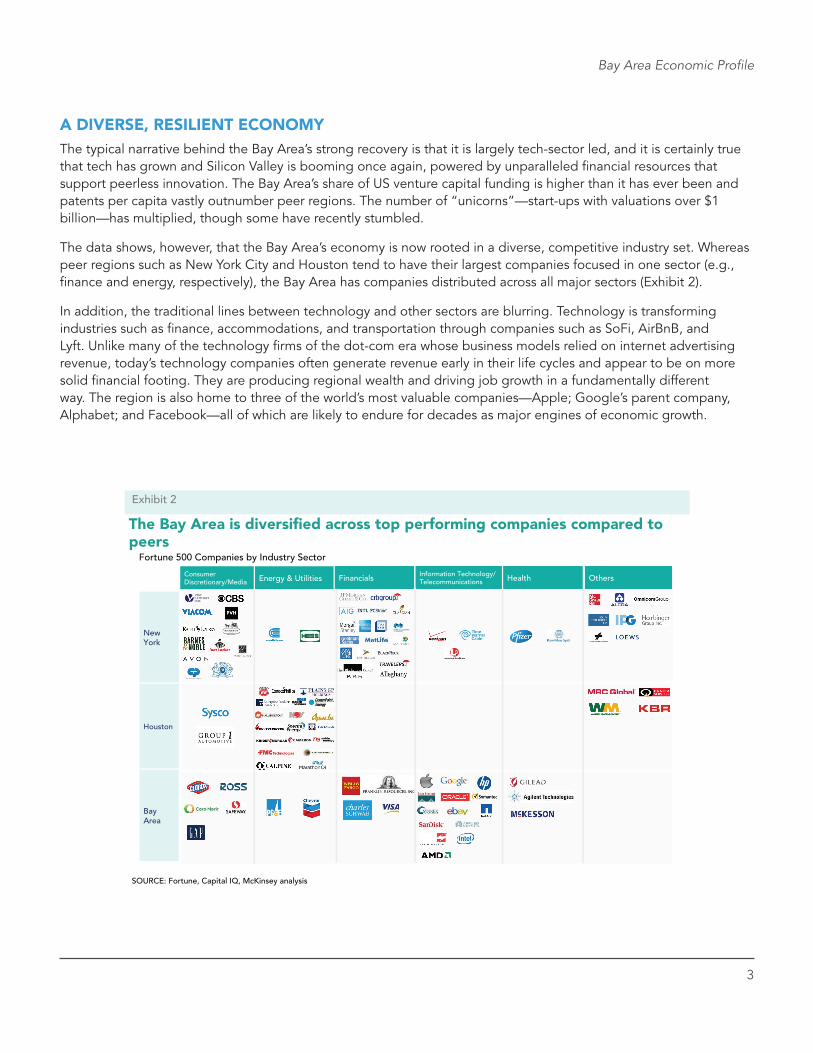
A DIVERSE, RESILIENT ECONOMYThe typical narrative behind the Bay Area’s strong recovery is that it is largely tech-sector led, and it is certainly true that tech has grown and Silicon Valley is booming once again, powered by unparalleled financial resources that support peerless innovation. The Bay Area’s share of US venture capital funding is higher than it has ever been and patents per capita vastly outnumber peer regions. The number of “unicorns”—start-ups with valuations over $1 billion—has multiplied, though some have recently stumbled.
The data shows, however, that the Bay Area’s economy is now rooted in a diverse, competitive industry set. Whereas peer regions such as New York City and Houston tend to have their largest companies focused in one sector (e.g., finance and energy, respectively), the Bay Area has companies distributed across all major sectors (Exhibit 2).
In addition, the traditional lines between technology and other sectors are blurring. Technology is transforming industries such as finance, accommodations, and transportation through companies such as SoFi, AirBnB, and Lyft. Unlike many of the technology firms of the dot-com era whose business models relied on internet advertising revenue, today’s technology companies often generate revenue early in their life cycles and appear to be on more solid financial footing. They are producing regional wealth and driving job growth in a fundamentally different way. The region is also home to three of the world’s most valuable companies—Apple; Google’s parent company, Alphabet; and Facebook—all of which are likely to endure for decades as major engines of economic growth.
4
Promise and Perils of an Accelerated Economy
The Bay Area average wage has lagged productivity growth over the past 15 years
Exhibit 3
1980 1985 1990 1995 2000 2005 2010 2015
110
180
140
120
160
190
130
170
250
210 220 230 240
150
100
200
Relationship between income and productivity, Index
Bay Area Productivity1
Bay Area Avg. Wage
SOURCE: Moody's Analytics, BEA, BLS 1 Bay Area de�ned as San Jose, San Francisco, Napa, Santa Rosa, and Vallejo MSAs
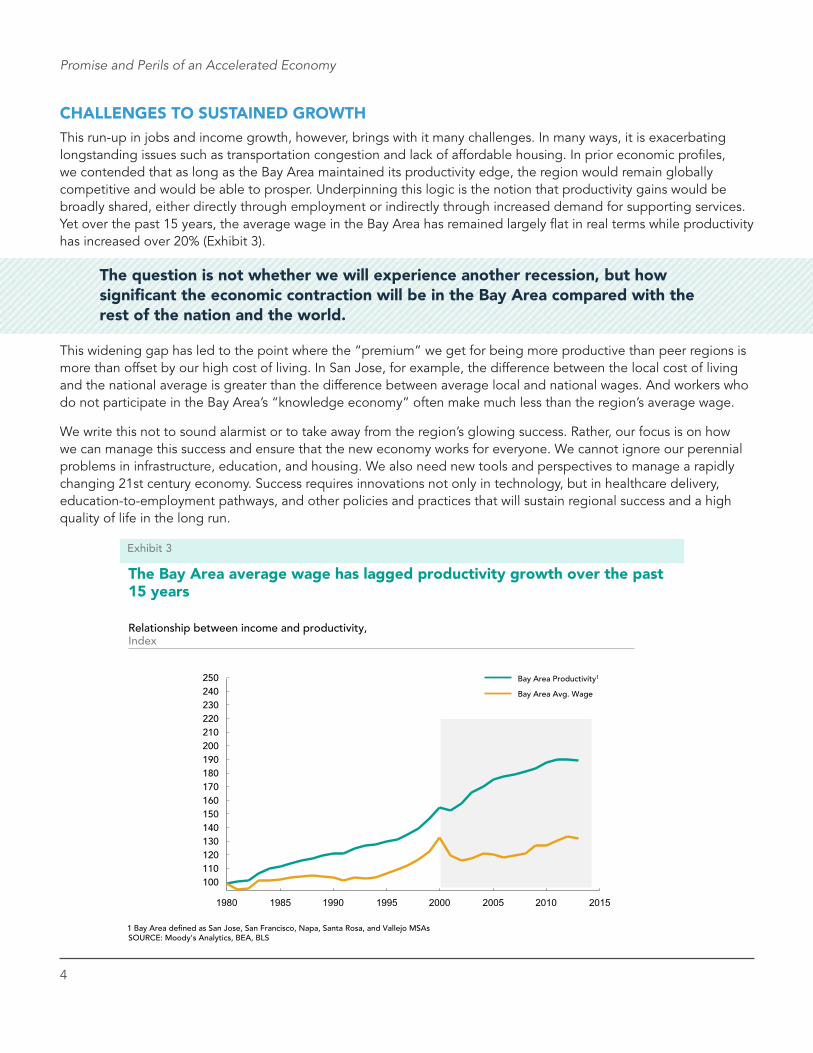
CHALLENGES TO SUSTAINED GROWTHThis run-up in jobs and income growth, however, brings with it many challenges. In many ways, it is exacerbating longstanding issues such as transportation congestion and lack of affordable housing. In prior economic profiles, we contended that as long as the Bay Area maintained its productivity edge, the region would remain globally competitive and would be able to prosper. Underpinning this logic is the notion that productivity gains would be broadly shared, either directly through employment or indirectly through increased demand for supporting services. Yet over the past 15 years, the average wage in the Bay Area has remained largely flat in real terms while productivity has increased over 20% (Exhibit 3).
This widening gap has led to the point where the “premium” we get for being more productive than peer regions is more than offset by our high cost of living. In San Jose, for example, the difference between the local cost of living and the national average is greater than the difference between average local and national wages. And workers who do not participate in the Bay Area’s “knowledge economy” often make much less than the region’s average wage.
We write this not to sound alarmist or to take away from the region’s glowing success. Rather, our focus is on how we can manage this success and ensure that the new economy works for everyone. We cannot ignore our perennial problems in infrastructure, education, and housing. We also need new tools and perspectives to manage a rapidly changing 21st century economy. Success requires innovations not only in technology, but in healthcare delivery, education-to-employment pathways, and other policies and practices that will sustain regional success and a high quality of life in the long run.
The question is not whether we will experience another recession, but how significant the economic contraction will be in the Bay Area compared with the rest of the nation and the world.
Report Title
5
SOURCE: Global Insight, Bureau of Economic Analysis, Moody’s, McKinsey analysis
5325455695715777027467988818881,2901,3831,4101,4421,5821,8622,0552,1452,4102,8342,990
3,8794,606
Canada Australia
Turkey
India
Saudi Arabia
Mexico
Netherlands Indonesia
Spain South Korea
Russia
Switzerland
Belgium
Bay Area1 Sweden
Argentina Nigeria
United States
United Kingdom France
Germany Japan
Italy
10,356
Brazil
China 17,348
2014 Nominal GDP $ Billion
1 Bay Area defined as San Jose, San Francisco, Napa, Santa Rosa, and Vallejo MSAs
Real GDP CAGR 2010-2014, %
0 3.6
1.9
1.5 6.4 0.5 1.3 1.6 0.6 1.8 -0.9 5.3
1.8 2.2
-0.8 2.3 4.5 0.2
3.1
4.2 2.5
#21
Rank in 2010 Rank
The Bay Area is the 21st largest economy in the world
Exhibit 4
24 17
20
11
1 2 3 4 6 5 7 8 9
10 13 15 12 14 18 16
19 23 29 30 22
2.4
1.3
0.7
1.3
1The Bay Area is as Strong as Ever As the United States completes its seventh year since the Great Recession, the Bay Area continues to be as strong as ever. A quick recovery, resilient economic diversity, and a burgeoning innovation and technology sector have made the Bay Area perhaps the most dynamic growth economy in the developed world.
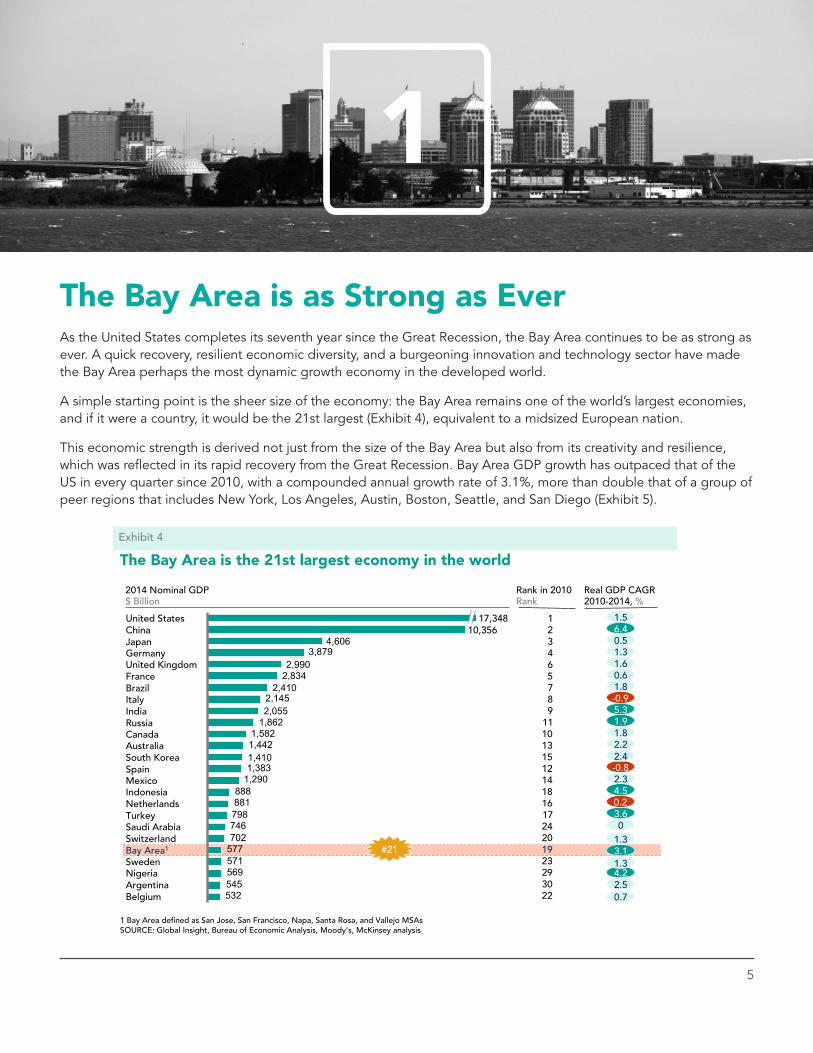
A simple starting point is the sheer size of the economy: the Bay Area remains one of the world’s largest economies, and if it were a country, it would be the 21st largest (Exhibit 4), equivalent to a midsized European nation.
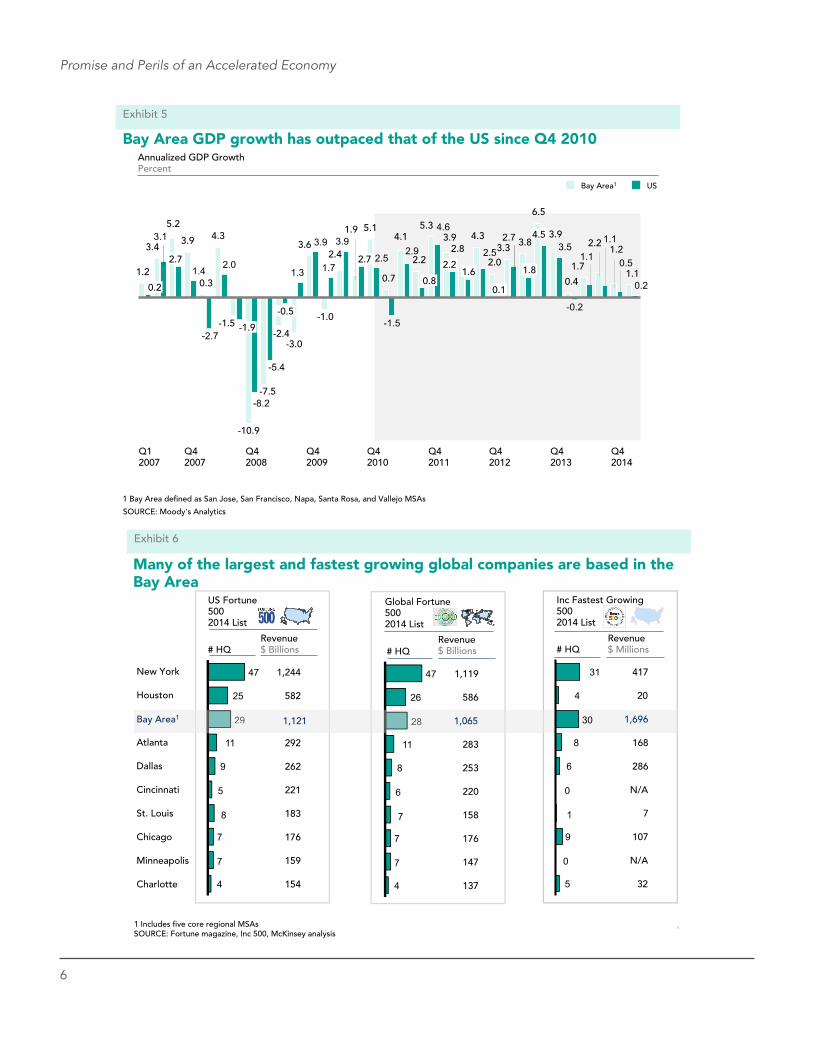
This economic strength is derived not just from the size of the Bay Area but also from its creativity and resilience, which was reflected in its rapid recovery from the Great Recession. Bay Area GDP growth has outpaced that of the US in every quarter since 2010, with a compounded annual growth rate of 3.1%, more than double that of a group of peer regions that includes New York, Los Angeles, Austin, Boston, Seattle, and San Diego (Exhibit 5).
6
Promise and Perils of an Accelerated Economy
Bay Area GDP growth has outpaced that of the US since Q4 2010
1.1
1.22.2
1.7
0.4
3.9
6.5
3.83.32.0
4.32.8
3.95.3
2.2
4.1
0.7
5.11.9
2.4
-1.0
3.6
-3.0-2.4
-7.5
-10.9
-1.5
4.3
0.3
3.9
5.2
3.4
1.20.2
3.52.7
4.6
2.9
-1.5
2.5
3.9
1.7
3.9
1.3
-5.4
-8.2
2.0
-2.7
1.4
3.1
0.5
1.1
1.1
-0.2
2.5
Q4 2011
2.2
0.2
Q1 2007
-0.5
Q4 2008
Q4 2012
0.1 0.8
Q4 2007
-1.9
2.7 1.6
Q4 2009
Q4 2014
2.7
Q4 2010
1.8
Q4 2013
4.5
US Bay Area1
Annualized GDP Growth Percent
SOURCE: Moody's Analytics
1 Bay Area de�ned as San Jose, San Francisco, Napa, Santa Rosa, and Vallejo MSAs
Exhibit 5
47
25
29
11
9
5
8
7
7
4
US Fortune 500 2014 List
1,244
262
582
292
221
183
176
159
154
# HQ Revenue $ Billions
1,119
253
586
283
220
158
176
147
137
Global Fortune 500 2014 List
# HQ Revenue $ Billions
47
26
28
11
8
6
7
7
7
4
29 28
Many of the largest and fastest growing global companies are based in the Bay Area
1 Includes �ve core regional MSAs SOURCE: Fortune magazine, Inc 500, McKinsey analysis
l
Exhibit 6
417
286
20
168
1,696
N/A
7
107
N/A
32
# HQ Revenue $ Millions
Inc Fastest Growing 500 2014 List
31
4
30
8
6
0
1
9
0
5
New York
Bay Area1
Houston
Dallas
Atlanta
Minneapolis
Chicago
St. Louis
Charlotte
Cincinnati
1,121 1,065
7
Bay Area Economic Profile
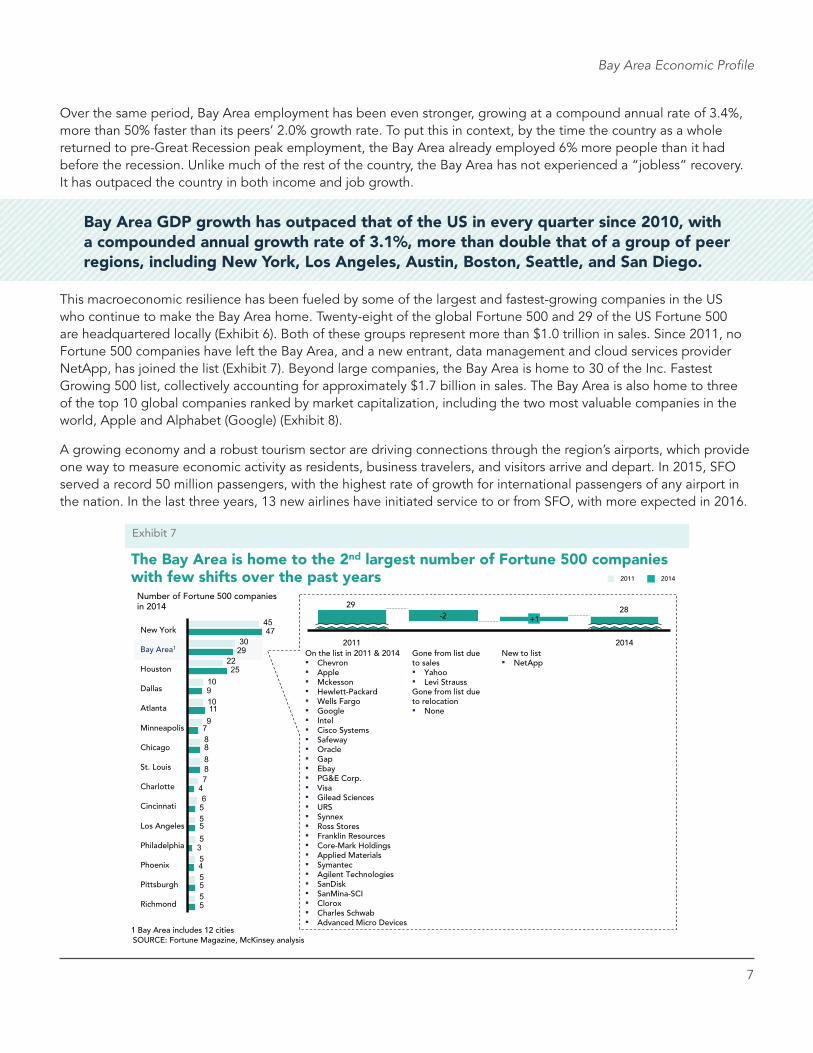
The Bay Area is home to the 2nd largest number of Fortune 500 companies with few shifts over the past years
SOURCE: Fortune Magazine, McKinsey analysis 1 Bay Area includes 12 cities
Exhibit 7
Number of Fortune 500 companies in 2014
10
10
5
5
5
29
25
8
5
55
5
6
7
8
8
9
22
45
30
5
4
3
5
4
8
7
11
9
47New York
Richmond
Pittsburgh
Phoenix
Philadelphia
Los Angeles
Cincinnati
Charlotte
St. Louis
Chicago
Minneapolis
Atlanta
Dallas
Houston
Bay Area1 Gone from list due to sales
Yahoo Levi Strauss
Gone from list due to relocation
None
New to list NetApp
28
2014
+1 -2
2011
29
2011 2014
On the list in 2011 & 2014 Chevron Apple Mckesson Hewlett-Packard Wells Fargo Google Intel Cisco Systems Safeway Oracle Gap Ebay PG&E Corp. Visa Gilead Sciences URS Synnex Ross Stores Franklin Resources Core-Mark Holdings Applied Materials Symantec Agilent Technologies SanDisk SanMina-SCI Clorox Charles Schwab Advanced Micro Devices
Over the same period, Bay Area employment has been even stronger, growing at a compound annual rate of 3.4%, more than 50% faster than its peers’ 2.0% growth rate. To put this in context, by the time the country as a whole returned to pre-Great Recession peak employment, the Bay Area already employed 6% more people than it had before the recession. Unlike much of the rest of the country, the Bay Area has not experienced a “jobless” recovery. It has outpaced the country in both income and job growth.
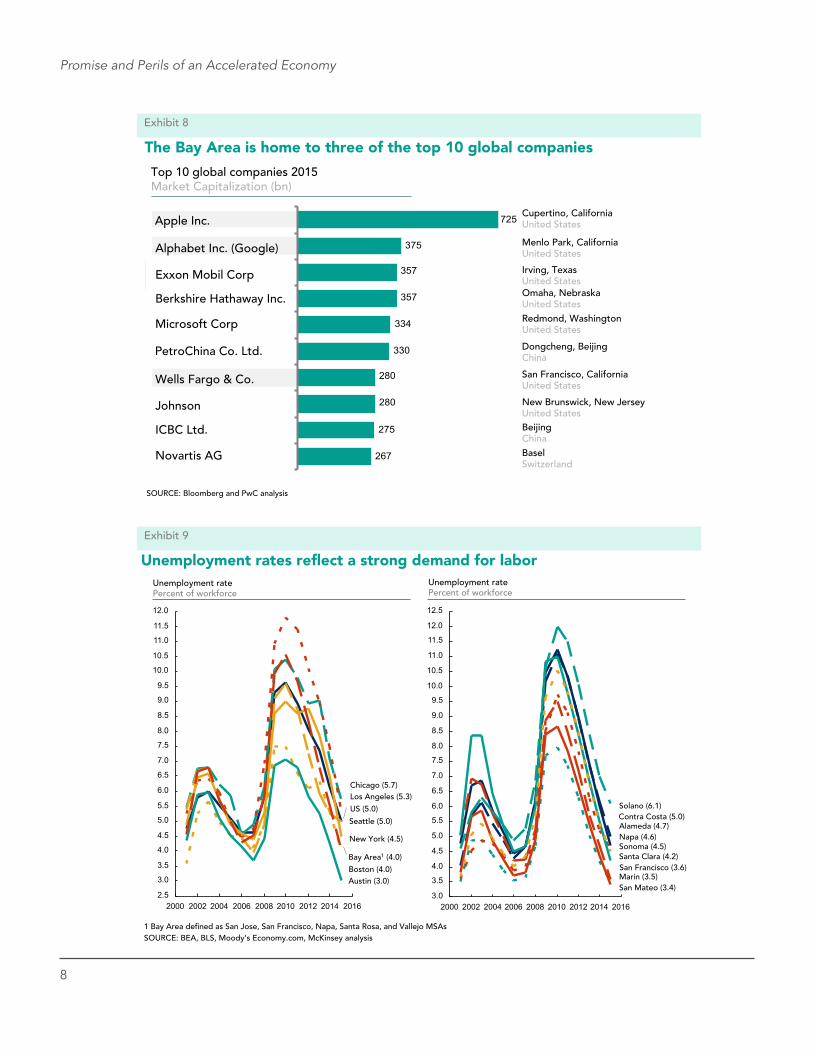
This macroeconomic resilience has been fueled by some of the largest and fastest-growing companies in the US who continue to make the Bay Area home. Twenty-eight of the global Fortune 500 and 29 of the US Fortune 500 are headquartered locally (Exhibit 6). Both of these groups represent more than $1.0 trillion in sales. Since 2011, no Fortune 500 companies have left the Bay Area, and a new entrant, data management and cloud services provider NetApp, has joined the list (Exhibit 7). Beyond large companies, the Bay Area is home to 30 of the Inc. Fastest Growing 500 list, collectively accounting for approximately $1.7 billion in sales. The Bay Area is also home to three of the top 10 global companies ranked by market capitalization, including the two most valuable companies in the world, Apple and Alphabet (Google) (Exhibit 8).
A growing economy and a robust tourism sector are driving connections through the region’s airports, which provide one way to measure economic activity as residents, business travelers, and visitors arrive and depart. In 2015, SFO served a record 50 million passengers, with the highest rate of growth for international passengers of any airport in the nation. In the last three years, 13 new airlines have initiated service to or from SFO, with more expected in 2016.
Bay Area GDP growth has outpaced that of the US in every quarter since 2010, with a compounded annual growth rate of 3.1%, more than double that of a group of peer regions, including New York, Los Angeles, Austin, Boston, Seattle, and San Diego.
8
Promise and Perils of an Accelerated Economy
The Bay Area is home to three of the top 10 global companies
Top 10 global companies 2015 Market Capitalization (bn)
Exxon Mobil Corp
Apple Inc.
PetroChina Co. Ltd.
Berkshire Hathaway Inc.
Novartis AG
ICBC Ltd.
Johnson
SOURCE: Bloomberg and PwC analysis
Exhibit 8
Alphabet Inc. (Google)
Microsoft Corp
Cupertino, California United States
Menlo Park, California United States
Irving, Texas United States Omaha, Nebraska United States
Dongcheng, Beijing China
San Francisco, California United States
New Brunswick, New Jersey United States
Redmond, Washington United States
Beijing China Basel Switzerland
Wells Fargo & Co.
375
267
275
280
280
330
334
357
357
725
Unemployment rates re�ect a strong demand for labor
SOURCE: BEA, BLS, Moody’s Economy.com, McKinsey analysis
Unemployment rate Percent of workforce
2.5
3.0
3.5
4.0
4.5
5.0
5.5
6.0
6.5
7.0
7.5
8.0
8.5
9.0
9.5
10.0
10.5
11.0
11.5
12.0
2000 2002 2004 2006 2008 2010 2012 2014 2016
Bay Area1 (4.0)
Austin (3.0) Boston (4.0)
Seattle (5.0)
New York (4.5)
Los Angeles (5.3) Chicago (5.7)
US (5.0)
3.0
3.5
4.0
4.5
5.0
5.5
6.0
6.5
7.0
7.5
8.0
8.5
9.0
9.5
10.0
10.5
11.0
11.5
12.0
12.5
2000 2002 2004 2006 2008 2010 2012 2014 2016
Sonoma (4.5)
Solano (6.1)
Santa Clara (4.2)
Napa (4.6)
San Francisco (3.6)
San Mateo (3.4) Marin (3.5)
Contra Costa (5.0) Alameda (4.7)
Unemployment rate Percent of workforce
1 Bay Area de�ned as San Jose, San Francisco, Napa, Santa Rosa, and Vallejo MSAs
Exhibit 9
9
Bay Area Economic Profile
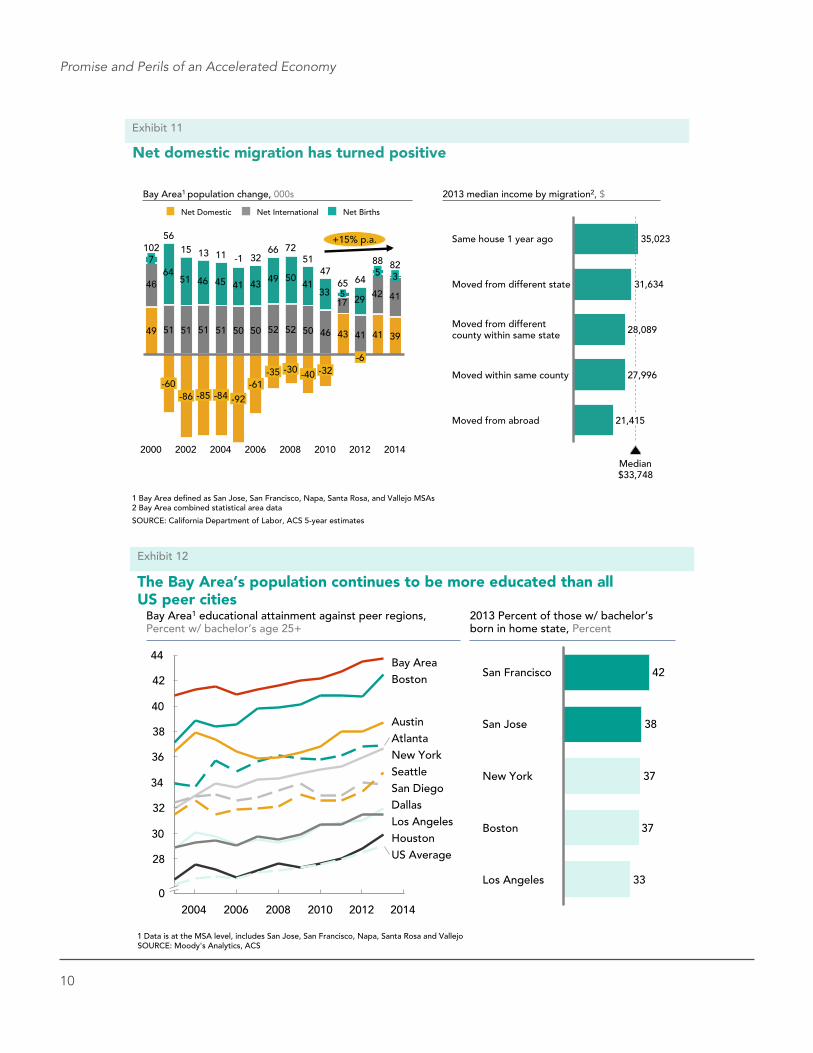
Strong demand for labor has translated into improving regional demographics and an improved supply of labor. Since 2010, the Bay Area population has grown at a 15% compound annual rate (Exhibit 11). Whereas domestic migration has in the past been a drag on overall population growth, for the first time since 2000 more people are moving to the Bay Area from other states than are leaving. This is attributable to the broader availability of jobs and the draw of the region’s technology-driven economy. Skilled workers from around the country and around the world continue to flock to the region.
Beyond the demand and supply of labor, the quality of labor in the Bay Area continues to trump that of peer regions. For example, educational attainment levels in the Bay Area, measured as the share of the population aged 25 and older with a bachelor’s degree, are higher than in all other peer regions (Exhibit 12). According to US Census data, the percentage of those born in their home state with a bachelor’s degree is also higher in San Francisco and San Jose than in New York, Boston, or Los Angeles, meaning that the Bay Area continues to produce a significant portion of its talent from within.
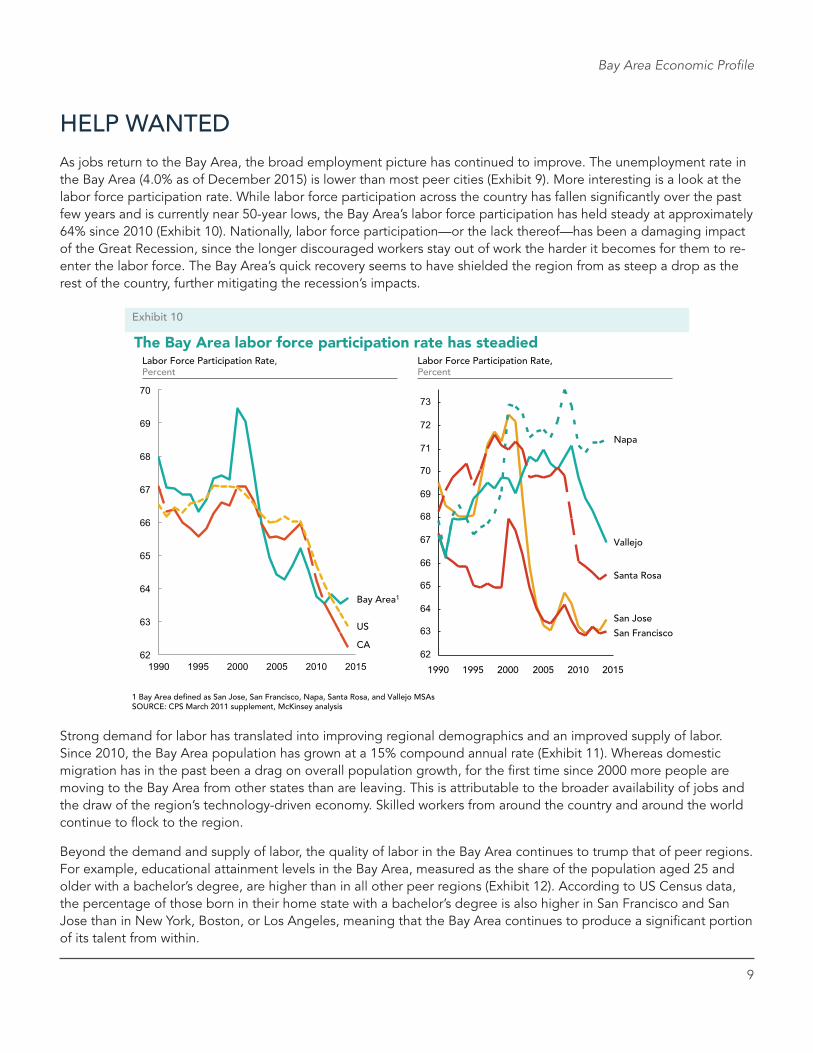
The Bay Area labor force participation rate has steadied
62
63
64
65
66
67
68
69
70
1990 1995 2000 2005 2010 2015
Bay Area1
CA
US
1 Bay Area de ned as San Jose, San Francisco, Napa, Santa Rosa, and Vallejo MSAs SOURCE: CPS March 2011 supplement, McKinsey analysis
Labor Force Participation Rate, Percent
62
63
64
65
66
67
68
69
70
71
72
73
1995 2005 1990 2015 2000 2010
Santa Rosa
Vallejo
Napa
San Francisco
San Jose
Labor Force Participation Rate, Percent
Exhibit 10
HELP WANTEDAs jobs return to the Bay Area, the broad employment picture has continued to improve. The unemployment rate in the Bay Area (4.0% as of December 2015) is lower than most peer cities (Exhibit 9). More interesting is a look at the labor force participation rate. While labor force participation across the country has fallen significantly over the past few years and is currently near 50-year lows, the Bay Area’s labor force participation has held steady at approximately 64% since 2010 (Exhibit 10). Nationally, labor force participation—or the lack thereof—has been a damaging impact of the Great Recession, since the longer discouraged workers stay out of work the harder it becomes for them to re-enter the labor force. The Bay Area’s quick recovery seems to have shielded the region from as steep a drop as the rest of the country, further mitigating the recession’s impacts.
10
Promise and Perils of an Accelerated Economy
Net domestic migration has turned positive
6451 46 45 41 43 49 50
4133
29
46
1742 41
+15% p.a.
2014
82
39
3
88
41
5
2012
64
41
-6
65
43
5
2010
47
46
-32
51
50
-40
2008
72
52
-30
66
52
-35
2006
32
50
-61
-1
50
-92
2004
11
51
-84
13
51
-85
2002
15
51
-86
56
51
-60
2000
102
49
7
Net Births Net Domestic Net International
Bay Area1 population change, 000s
Exhibit 11
1 Bay Area de ned as San Jose, San Francisco, Napa, Santa Rosa, and Vallejo MSAs 2 Bay Area combined statistical area data
SOURCE: California Department of Labor, ACS 5-year estimates
2013 median income by migration2, $
21,415
Median $33,748
Moved from different state
Same house 1 year ago
Moved within same county
35,023
31,634
27,996
28,089 Moved from different county within same state
Moved from abroad
The Bay Area’s population continues to be more educated than all US peer cities
Bay Area1 educational attainment against peer regions, Percent w/ bachelor’s age 25+
40
30
32
34
42
28
36
38
44
0 2014 2012 2010 2008 2006 2004
US Average
Seattle San Diego
New York
Los Angeles Houston
Dallas
Boston
Austin Atlanta
Bay Area
1 Data is at the MSA level, includes San Jose, San Francisco, Napa, Santa Rosa and Vallejo SOURCE: Moody's Analytics, ACS
Exhibit 12
Los Angeles 33
Boston 37
New York 37
San Jose 38
San Francisco 42
2013 Percent of those w/ bachelor’s born in home state, Percent
11
Bay Area Economic Profile
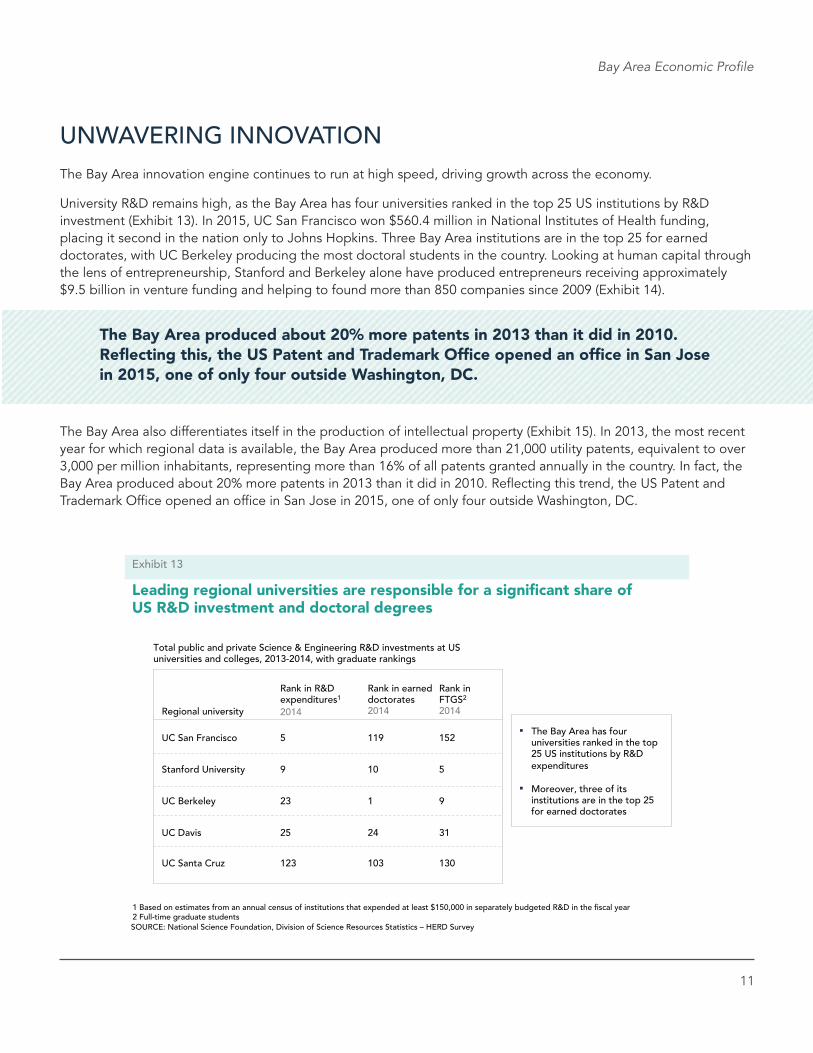
UNWAVERING INNOVATIONThe Bay Area innovation engine continues to run at high speed, driving growth across the economy.
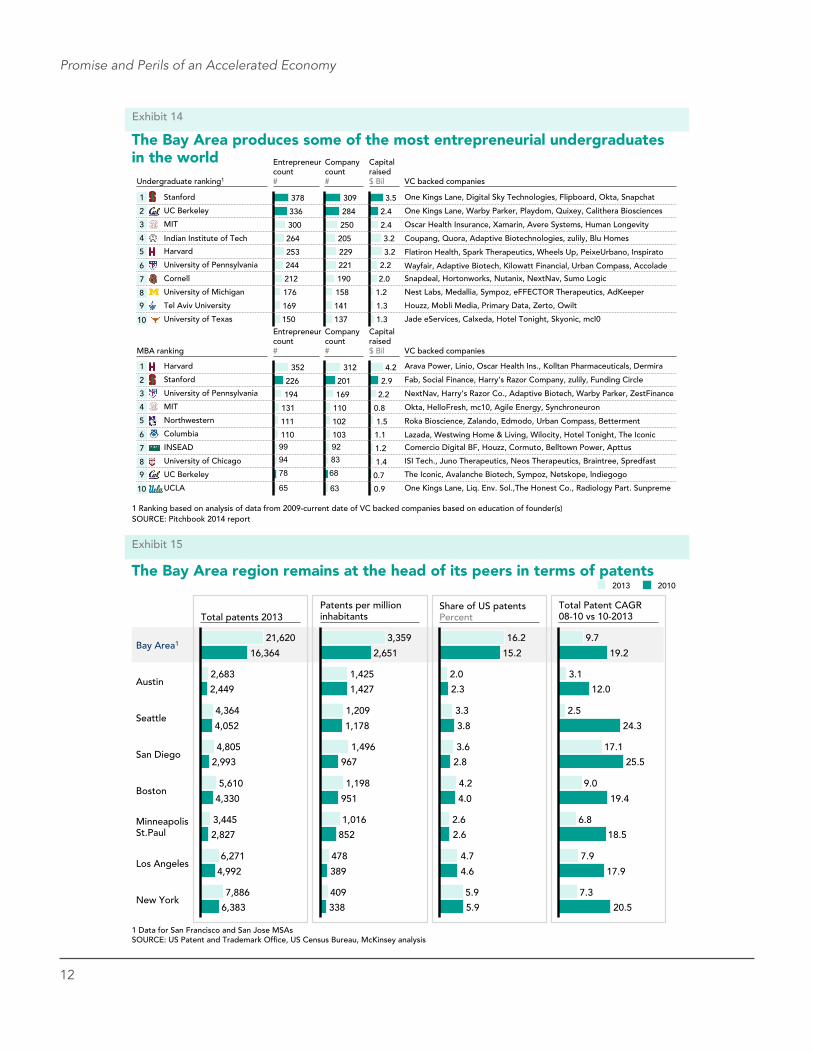
University R&D remains high, as the Bay Area has four universities ranked in the top 25 US institutions by R&D investment (Exhibit 13). In 2015, UC San Francisco won $560.4 million in National Institutes of Health funding, placing it second in the nation only to Johns Hopkins. Three Bay Area institutions are in the top 25 for earned doctorates, with UC Berkeley producing the most doctoral students in the country. Looking at human capital through the lens of entrepreneurship, Stanford and Berkeley alone have produced entrepreneurs receiving approximately $9.5 billion in venture funding and helping to found more than 850 companies since 2009 (Exhibit 14).
The Bay Area also differentiates itself in the production of intellectual property (Exhibit 15). In 2013, the most recent year for which regional data is available, the Bay Area produced more than 21,000 utility patents, equivalent to over 3,000 per million inhabitants, representing more than 16% of all patents granted annually in the country. In fact, the Bay Area produced about 20% more patents in 2013 than it did in 2010. Reflecting this trend, the US Patent and Trademark Office opened an office in San Jose in 2015, one of only four outside Washington, DC.
12
Leading regional universities are responsible for a signi cant share of US R&D investment and doctoral degrees
Regional university
Rank in R&D expenditures1
Rank in earned doctorates 2014
UC San Francisco
Stanford University
UC Berkeley
UC Davis
119
10
1
24
152
5
9
31
Rank in FTGS2
2014
The Bay Area has four universities ranked in the top 25 US institutions by R&D expenditures
Moreover, three of its institutions are in the top 25 for earned doctorates
2014
5
9
23
25
Total public and private Science & Engineering R&D investments at US universities and colleges, 2013-2014, with graduate rankings
SOURCE: National Science Foundation, Division of Science Resources Statistics – HERD Survey
UC Santa Cruz 103 130 123
1 Based on estimates from an annual census of institutions that expended at least $150,000 in separately budgeted R&D in the �scal year2 Full-time graduate students
Exhibit 13
The Bay Area produced about 20% more patents in 2013 than it did in 2010. Reflecting this, the US Patent and Trademark Office opened an office in San Jose in 2015, one of only four outside Washington, DC.
12
Promise and Perils of an Accelerated Economy
The Bay Area produces some of the most entrepreneurial undergraduates in the world
SOURCE: Pitchbook 2014 report
150
169
176
212
244
253
264
300
336
378
229
205
250
284
309
158
190
137
141
221
3.2
3.2
2.4
2.4
3.5
1.3
1.3
1.2
2.0
2.2
1
2
3
4
5
6
7
8
10
Stanford
UC Berkeley
MIT
Indian Institute of Tech
Harvard
University of Pennsylvania
Cornell
University of Michigan
Tel Aviv University
University of Texas
9
65
789499110
111
131
194
226
352
63
688392103
102
110
169
201
312 4.2
1.2
1.1
1.5
0.8
2.2
2.9
0.7
0.9
1.4
Entrepreneurcount #
Entrepreneurcount#
Company count #
Company count #
Capital raised $ Bil
Capital raised $ Bil MBA ranking
Undergraduate ranking1 VC backed companies
One Kings Lane, Digital Sky Technologies, Flipboard, Okta, Snapchat
One Kings Lane, Warby Parker, Playdom, Quixey, Calithera Biosciences
Oscar Health Insurance, Xamarin, Avere Systems, Human Longevity
Coupang, Quora, Adaptive Biotechnologies, zulily, Blu Homes
Flatiron Health, Spark Therapeutics, Wheels Up, PeixeUrbano, Inspirato
Wayfair, Adaptive Biotech, Kilowatt Financial, Urban Compass, Accolade
Snapdeal, Hortonworks, Nutanix, NextNav, Sumo Logic
Nest Labs, Medallia, Sympoz, eFFECTOR Therapeutics, AdKeeper
Houzz, Mobli Media, Primary Data, Zerto, Owilt
Jade eServices, Calxeda, Hotel Tonight, Skyonic, mcI0
VC backed companies
Arava Power, Linio, Oscar Health Ins., Kolltan Pharmaceuticals, Dermira
Fab, Social Finance, Harry’s Razor Company, zulily, Funding Circle
NextNav, Harry’s Razor Co., Adaptive Biotech, Warby Parker, ZestFinance
Okta, HelloFresh, mc10, Agile Energy, Synchroneuron
Roka Bioscience, Zalando, Edmodo, Urban Compass, Betterment
Lazada, Westwing Home & Living, Wilocity, Hotel Tonight, The Iconic
Comercio Digital BF, Houzz, Cormuto, Belltown Power, Apttus
ISI Tech., Juno Therapeutics, Neos Therapeutics, Braintree, Spredfast
The Iconic, Avalanche Biotech, Sympoz, Netskope, lndiegogo
One Kings Lane, Liq. Env. Sol.,The Honest Co., Radiology Part. Sunpreme
1
2
3
4
5
6
7
8
10
9
Harvard
Stanford
University of Pennsylvania
MIT
Northwestern
Columbia
INSEAD
University of Chicago
UC Berkeley
UCLA
1 Ranking based on analysis of data from 2009-current date of VC backed companies based on education of founder(s)
Exhibit 14
The Bay Area region remains at the head of its peers in terms of patents
SOURCE: US Patent and Trademark Of�ce, US Census Bureau, McKinsey analysis
Exhibit 15
1 Data for San Francisco and San Jose MSAs
New York 6,383
7,886
Los Angeles 4,992
6,271
Minneapolis St.Paul 2,827
3,445
Boston 4,330
5,610
San Diego 2,993
4,805
Seattle 4,052
4,364
Austin 2,449
2,683
Bay Area1 16,364
21,620
338
409
389
478
852
1,016
951
1,198
967
1,496
1,178
1,209
1,427
1,425
2,651
3,359
5.9
5.9
4.6
4.7
2.6
2.6
4.0
4.2
2.8
3.6
3.8
3.3
2.3
2.0
15.2
16.2
20.5
7.3
17.9
7.9
18.5
6.8
19.4
9.0
25.5
17.1
24.3
2.5
12.0
3.1
19.2
9.7
Total patents 2013 Patents per million inhabitants
Share of US patents Percent
Total Patent CAGR 08-10 vs 10-2013
2010 2013
13
Bay Area Economic Profile
SOURCE: PwC MoneyTree Report
Bay Area VC investment, $ Billion
Exhibit 16
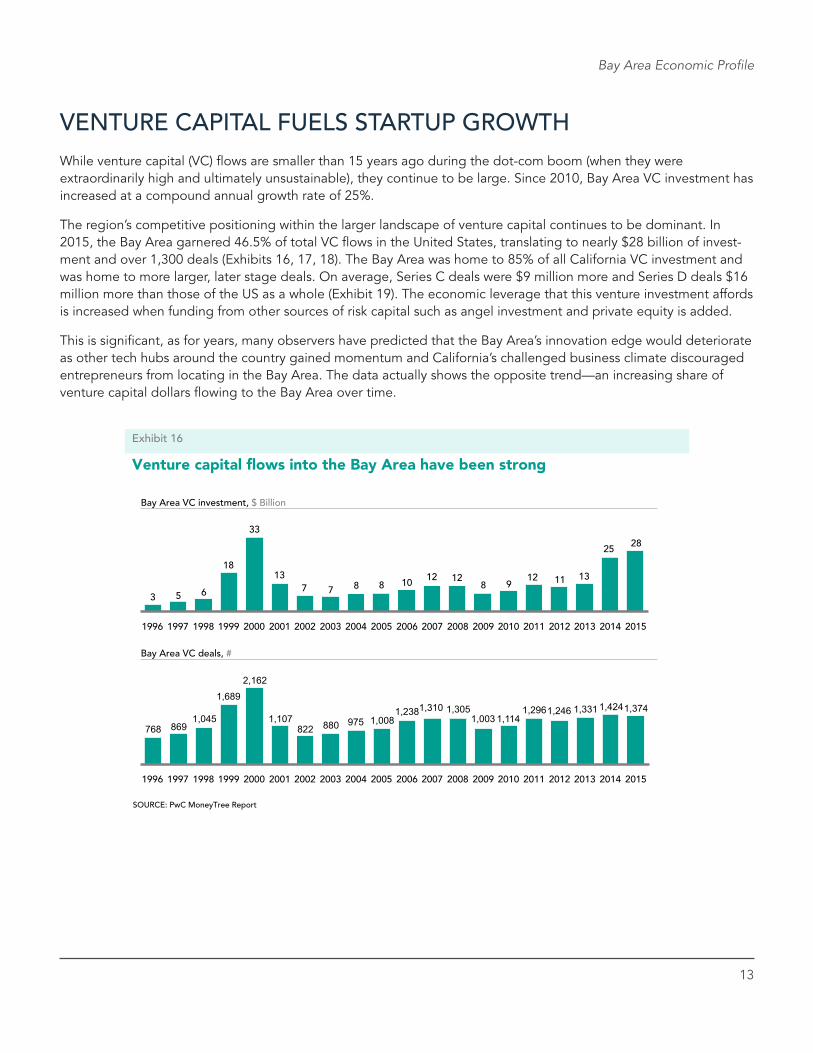
Venture capital ows into the Bay Area have been strong
Bay Area VC deals, #
2007 2011 2010 2008 2009 1996 1997 1998 2000 1999 2003 2006
13
3
2002 2005
33
5
2001 2004
8 10
2012 2013 2014 2015
7 7 8
18
6
12 12 8 9
12 11 13
25 28
768 8691,045
1,689
2,162
1,107822 880 975 1,008
1,2381,310 1,3051,003 1,114
1,2961,246 1,331 1,4241,374
2015 2013 2014 2012 2011 2010 2009 2008 2007 2006 2005 2004 2003 2002 2001 2000 1999 1998 1997 1996
VENTURE CAPITAL FUELS STARTUP GROWTHWhile venture capital (VC) flows are smaller than 15 years ago during the dot-com boom (when they were extraordinarily high and ultimately unsustainable), they continue to be large. Since 2010, Bay Area VC investment has increased at a compound annual growth rate of 25%.
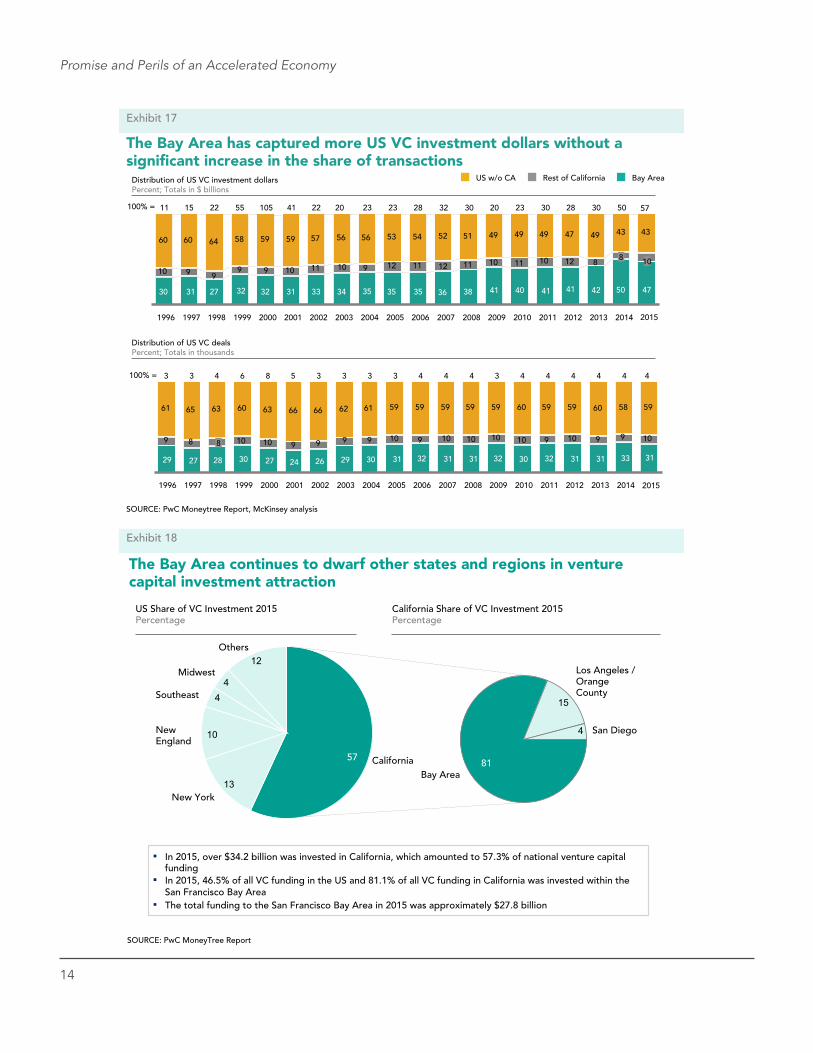
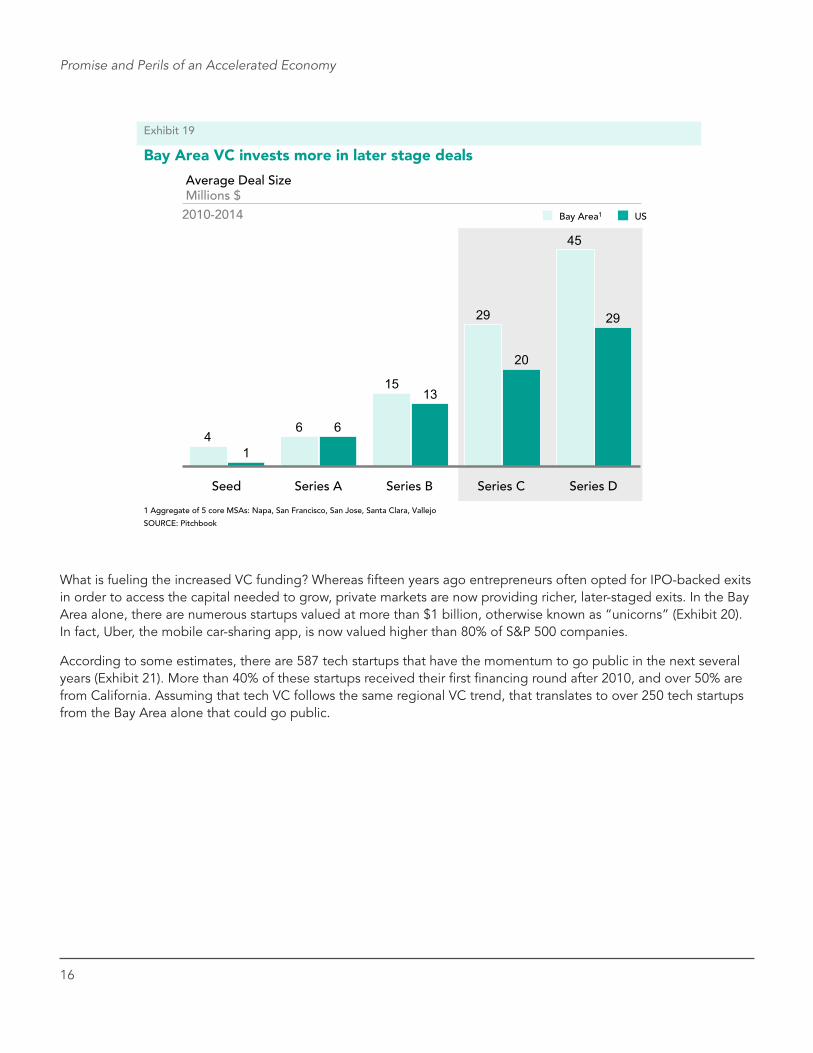
The region’s competitive positioning within the larger landscape of venture capital continues to be dominant. In 2015, the Bay Area garnered 46.5% of total VC flows in the United States, translating to nearly $28 billion of invest-ment and over 1,300 deals (Exhibits 16, 17, 18). The Bay Area was home to 85% of all California VC investment and was home to more larger, later stage deals. On average, Series C deals were $9 million more and Series D deals $16 million more than those of the US as a whole (Exhibit 19). The economic leverage that this venture investment affords is increased when funding from other sources of risk capital such as angel investment and private equity is added.
This is significant, as for years, many observers have predicted that the Bay Area’s innovation edge would deteriorate as other tech hubs around the country gained momentum and California’s challenged business climate discouraged entrepreneurs from locating in the Bay Area. The data actually shows the opposite trend—an increasing share of venture capital dollars flowing to the Bay Area over time.
14
Promise and Perils of an Accelerated Economy
60 60 64 58 59 59 57 56 56 53 54 52 51 49 49 49 47 49 43 43
10 9 99 9 10 11 10 9 12 11 12 11 10 11 10 12 8
The Bay Area has captured more US VC investment dollars without a signi cant increase in the share of transactions
SOURCE: PwC Moneytree Report, McKinsey analysis
Exhibit 17
Distribution of US VC deals
Percent; Totals in thousands
Distribution of US VC investment dollars Percent; Totals in $ billions
100% = 50
2014
50
2013
8
40
30
41 42
30
2009
20
41
2008
30
38
2007
32
36
2006
28
35
2005
23
35
2004
23
35
2003
20
41
2002
22
33
2001
41
31
2000
105
32
1999
55
32
1998
22
34
1997
15
31
1996
11
30 23
23
2010 2011 2012
28
27
Bay AreaUS w/o CA Rest of California
61 65 63 60 63 66 66 62 61 59 59 59 59 59 60 59 59 60 58 59
1099109101010109109999101089
3
1997
8
2001
8
100% =
2014
27
5 4 3
2010
33 28
2006
4
31
2002
4
31
3
32
4
2011
30
2007
4
32
2003
4
31
1998
3
31 30
2012
32
2008
4
31
1999 2004
4
30
6 3
29
2013
26
2009
4
24
2000 2005
3
27
1996
29
3
27
10
47
57
31
4
2015
2015
The Bay Area continues to dwarf other states and regions in venture capital investment attraction
SOURCE: PwC MoneyTree Report
12
44
10
13
Others
Midwest
Southeast
New England
New York
California 57
4
15
Bay Area
San Diego
Los Angeles / Orange County
81
US Share of VC Investment 2015 Percentage
California Share of VC Investment 2015 Percentage
Exhibit 18
In 2015, over $34.2 billion was invested in California, which amounted to 57.3% of national venture capital funding In 2015, 46.5% of all VC funding in the US and 81.1% of all VC funding in California was invested within the San Francisco Bay Area The total funding to the San Francisco Bay Area in 2015 was approximately $27.8 billion
Spotlight on:
The Rise of Corporate Venture Capital What is it?
• Corporate venture capital (CVC) involves the investment of corporate funds directly into external start-up companies. CVC is at its highest investment level in 10 years, representing $12.3 billion in overall 2014 investment, with participation in 15% of all venture capital deals.
Economic impact for the Bay Area
• Four of the top five CVC firms are based in the Bay Area, the largest being Google Ventures and Intel Capital. In 2014 alone, the Bay Area accounted for more than 200 deals totaling approximately $6 billion including deals with Uber, Cloudera, and Survey Monkey.
• Google and Intel have together invested in approximately 400 firms since 2011.
What are the different types of corporate VC activity?
• The next big thing (e.g., Google Ventures, Intel Capital): Independent arms designed to generate high financial returns through investments in companies that are in orthogonal or noncompeting sectors to the parent company. Investment in all stages of companies.
• Strategic initiatives (e.g., GE Ventures, Comcast Ventures): A coupled/decoupled corporate unit that accelerates initiatives and/or hedges against disruptive tech. Investment in later-stage companies.
• Incubator/accelerator/R&D (e.g., Amazon, Microsoft Accelerator): Incubator designed to advance specific R&D objectives, or get feedback on a product platform. Investment in events such as “hackathons” with prizes.
• Partnership with a VC fund (e.g., Felicis Ventures, Highland Capital Partners): Corporations investing in VC funds to as a way of having “first look” at upcoming companies. Range from $10 million to $100 million.
16
Promise and Perils of an Accelerated Economy
SOURCE: Pitchbook
US Bay Area1
Average Deal Size Millions $
Bay Area VC invests more in later stage deals
Exhibit 19
2010-2014
45
29
15
64
29
20
13
6
1
Series B Series A Series D Series C Seed
1 Aggregate of 5 core MSAs: Napa, San Francisco, San Jose, Santa Clara, Vallejo
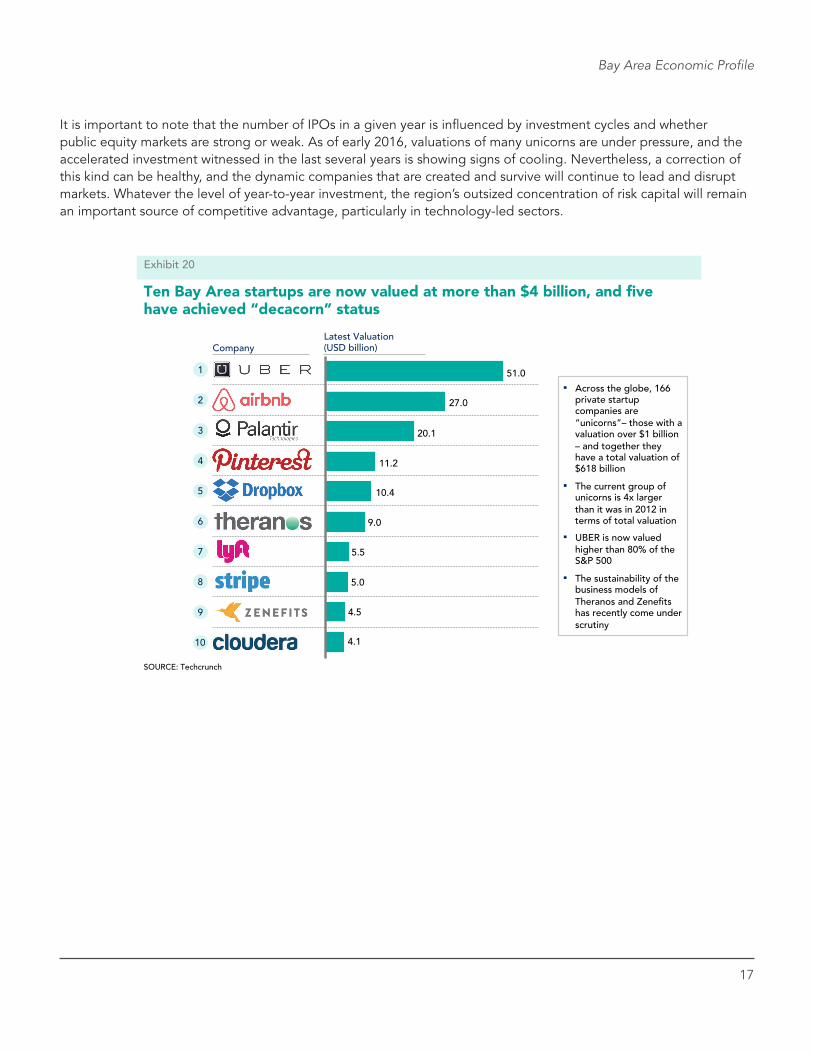
What is fueling the increased VC funding? Whereas fifteen years ago entrepreneurs often opted for IPO-backed exits in order to access the capital needed to grow, private markets are now providing richer, later-staged exits. In the Bay Area alone, there are numerous startups valued at more than $1 billion, otherwise known as “unicorns” (Exhibit 20). In fact, Uber, the mobile car-sharing app, is now valued higher than 80% of S&P 500 companies.
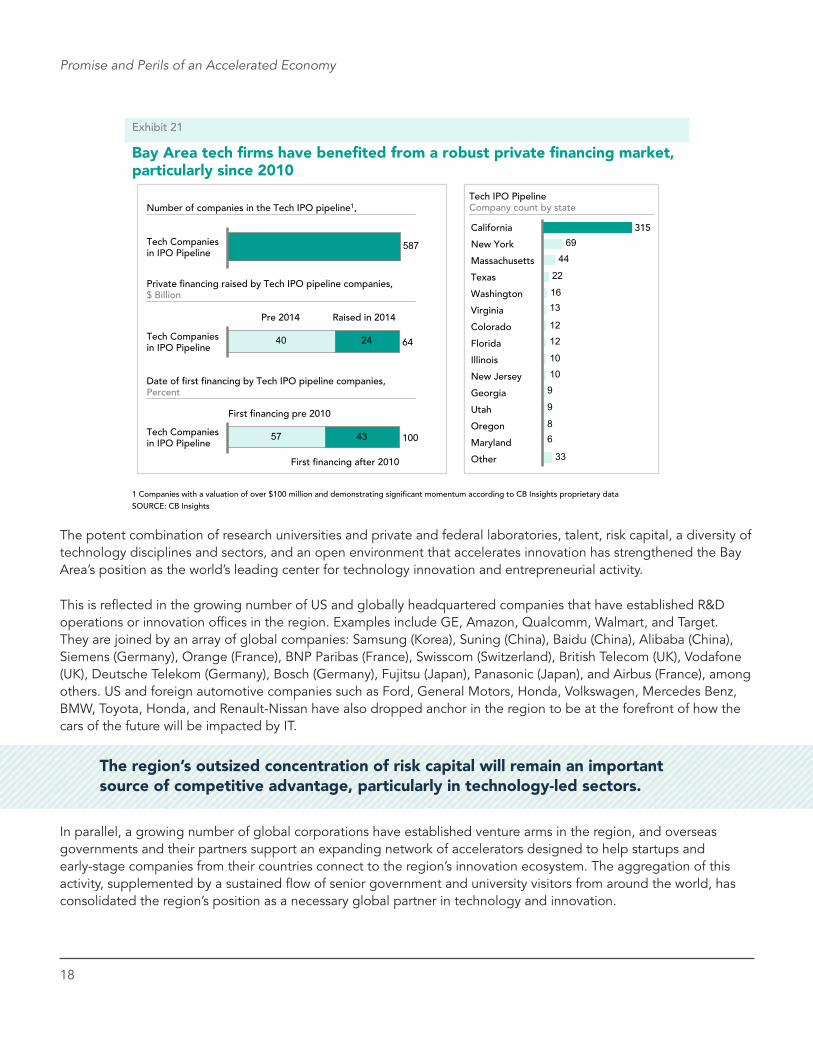
According to some estimates, there are 587 tech startups that have the momentum to go public in the next several years (Exhibit 21). More than 40% of these startups received their first financing round after 2010, and over 50% are from California. Assuming that tech VC follows the same regional VC trend, that translates to over 250 tech startups from the Bay Area alone that could go public.
17
Bay Area Economic Profile
SOURCE: Techcrunch
1
2
3
4
5
6
7
8
10
9
Company Latest Valuation (USD billion)
4.1
4.5
5.5
9.0
10.4
11.2
20.1
27.0
51.0
5.0
!! Across the globe, 166 private startup companies are “unicorns”– those with a valuation over $1 billion – and together they have a total valuation of $618 billion
!! The current group of unicorns is 4x larger than it was in 2012 in terms of total valuation
!! UBER is now valued higher than 80% of the S&P 500
!! The sustainability of the business models of Theranos and Zenefits has recently come under scrutiny
Ten Bay Area startups are now valued at more than $4 billion, and �ve have achieved “decacorn” status
Exhibit 20
It is important to note that the number of IPOs in a given year is influenced by investment cycles and whether public equity markets are strong or weak. As of early 2016, valuations of many unicorns are under pressure, and the accelerated investment witnessed in the last several years is showing signs of cooling. Nevertheless, a correction of this kind can be healthy, and the dynamic companies that are created and survive will continue to lead and disrupt markets. Whatever the level of year-to-year investment, the region’s outsized concentration of risk capital will remain an important source of competitive advantage, particularly in technology-led sectors.
18
Promise and Perils of an Accelerated Economy
Bay Area tech rms have bene ted from a robust private nancing market, particularly since 2010
33
68
9
9
10
10
12
12
1316
22
44
69California
New York
Massachusetts
Texas
Washington
Virginia
Colorado
Florida
Illinois
New Jersey
Georgia
Utah
Oregon
Maryland
Other
315
SOURCE: CB Insights
Tech IPO Pipeline Company count by state
587Tech Companies in IPO Pipeline
40 24
Pre 2014 Raised in 2014
Tech Companies in IPO Pipeline 64
Number of companies in the Tech IPO pipeline1,
Private nancing raised by Tech IPO pipeline companies, $ Billion
Date of rst nancing by Tech IPO pipeline companies, Percent
57 43
First nancing pre 2010
First nancing after 2010
Tech Companies in IPO Pipeline 100
Exhibit 21
1 Companies with a valuation of over $100 million and demonstrating signi�cant momentum according to CB Insights proprietary data
The potent combination of research universities and private and federal laboratories, talent, risk capital, a diversity of technology disciplines and sectors, and an open environment that accelerates innovation has strengthened the Bay Area’s position as the world’s leading center for technology innovation and entrepreneurial activity.
This is reflected in the growing number of US and globally headquartered companies that have established R&D operations or innovation offices in the region. Examples include GE, Amazon, Qualcomm, Walmart, and Target. They are joined by an array of global companies: Samsung (Korea), Suning (China), Baidu (China), Alibaba (China), Siemens (Germany), Orange (France), BNP Paribas (France), Swisscom (Switzerland), British Telecom (UK), Vodafone (UK), Deutsche Telekom (Germany), Bosch (Germany), Fujitsu (Japan), Panasonic (Japan), and Airbus (France), among others. US and foreign automotive companies such as Ford, General Motors, Honda, Volkswagen, Mercedes Benz, BMW, Toyota, Honda, and Renault-Nissan have also dropped anchor in the region to be at the forefront of how the cars of the future will be impacted by IT.
In parallel, a growing number of global corporations have established venture arms in the region, and overseas governments and their partners support an expanding network of accelerators designed to help startups and early-stage companies from their countries connect to the region’s innovation ecosystem. The aggregation of this activity, supplemented by a sustained flow of senior government and university visitors from around the world, has consolidated the region’s position as a necessary global partner in technology and innovation.
The region’s outsized concentration of risk capital will remain an important source of competitive advantage, particularly in technology-led sectors.
Report Title
19
2Sector Diversity as a Difference MakerWhy has Bay Area employment growth been so much stronger in this post-recession period than in the post-dot-com era? While the intrinsic qualities described in section one suggest that Bay Area fundamentals are strong, the region’s economy has evolved over time to bring it where it is today.
SECTOR STRENGTHOne factor that has driven strong regional employment growth has been a competitive and diverse sector portfolio. In the recovery following the Great Recession, the Bay Area has held a competitive advantage in multiple industries that have grown faster than the national average. While technology and professional services—the hallmarks of the region—have fueled nearly 40% of the region’s job growth, the remaining 60% is explained by other industries also outperforming the rest of the country. This represents a drastic turnaround from the post-dot-com recovery period, when Bay Area sectors—particularly tech—mostly performed worse than their national equivalents, and the region recovered much more slowly than the rest of the country.
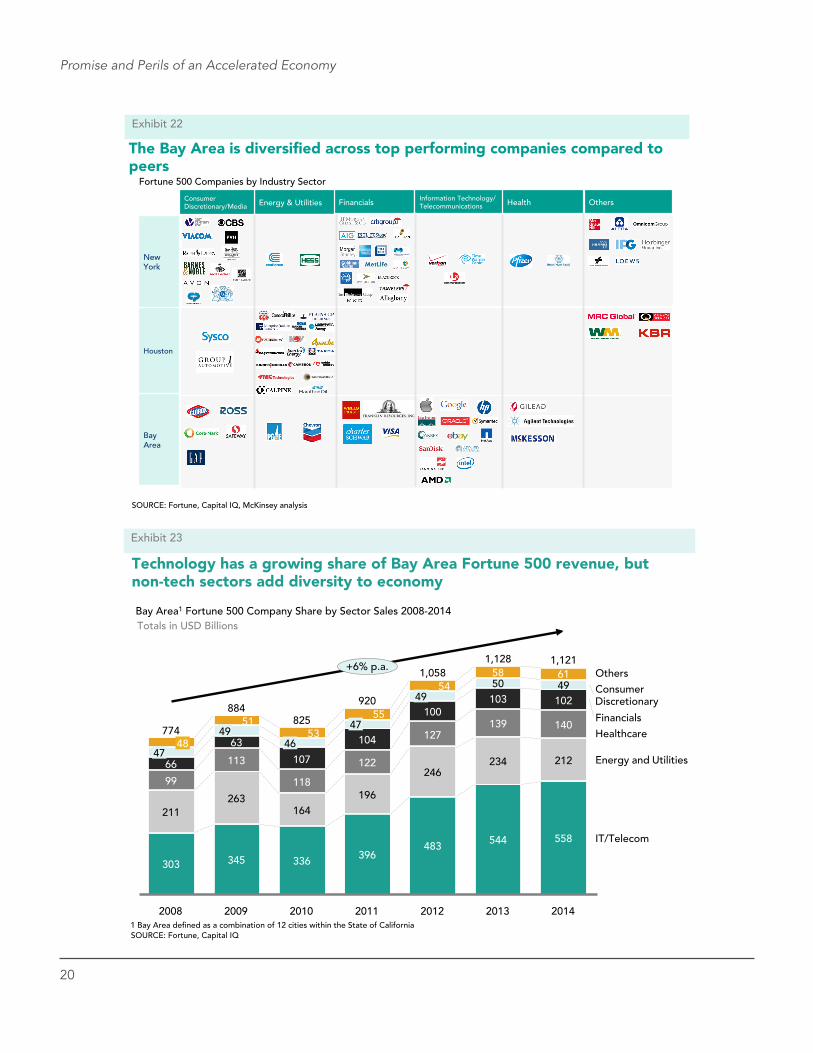
What does this diversity look like at a company level? Two other peer regions, New York City and Houston, attract similar numbers of Fortune 500 companies, but the Bay Area is the only metropolitan statistical area (MSA) that has a variety of companies from all major sector categories (e.g., Consumer Discretionary, Energy, Financials, Healthcare, and Information Technology) (Exhibit 22). New York is mostly a financial hub, whereas Houston is an energy hub.
This theme of diversity has also applied to Bay Area Fortune 500 company sales. Since 2008, sales from Bay Area Fortune 500 companies have increased at a compound annual growth rate of 6%, with virtually all sectors positively contributing to growth (Exhibit 23). That said, while all sectors have increased their sales, Information Technology and Telecommunications has the fastest compound annual growth rate of 11%. While technology has been a leader, non-tech sectors accounted for 50% of the region’s Fortune 500 revenue in 2014. This sector diversity provided the regional economy with a soft landing after the Great Recession, and the region has since rebounded due to strength in both tech and non-tech industries.
20
Promise and Perils of an Accelerated Economy
The Bay Area is diversi�ed across top performing companies compared to peers
SOURCE: Fortune, Capital IQ, McKinsey analysis
Fortune 500 Companies by Industry Sector
Houston
New York
Bay Area
Energy & Utilities Financials Information Technology/Telecommunications Health Consumer
Discretionary/Media
Exhibit 22
Others
Technology has a growing share of Bay Area Fortune 500 revenue, but non-tech sectors add diversity to economy
SOURCE: Fortune, Capital IQ
140
102 49 61
2013
1,128
544
234
139
103 50 58
2012
1,058
483
246
127
100 49
54
2011
920
396
196
122
104 47
55
2010
825
336
164
118
107 46
53
2009
884
345
263
113
63 49
51
2008
774
303
211
99
66 47
48
1,121
IT/Telecom
Energy and Utilities
Healthcare
Financials
Consumer Discretionary
Others
2014
558
212
+6% p.a.
Bay Area1 Fortune 500 Company Share by Sector Sales 2008-2014
1 Bay Area de ned as a combination of 12 cities within the State of California
Totals in USD Billions
Exhibit 23
21
Bay Area Economic Profile
Healthcare Cost Transparency
Internet of
Things
Digital Health
FinTech
Of ce/Patient Management
Real Time Health
Quanti ed Self
Big Data Health
Wearable Tech
Connected Home
Building blocks/platforms
Industrial Internet
Healthcare
In-store Retail Tech
Connected Car
Lending
Payments/Billing Tech
Personal Finance
Money Transfer
Digital Currency
Institutional tools
Equity crowdfunding
SOURCE: CB Insights
New industries
Supported by unique resources
The Bay Area is generating disruptive business models
Exhibit 24
VC rms Corporate VC rms Growth/Late stage rms Micro VC rms Angel groups Angel rms Accelerators/Venture Studios Tech Acquirers Crowdfunding
INDUSTRY DISRUPTIONWhile technology has consistently accounted for 40% or more of Bay Area Fortune 500 sales, the diversification underway within the technology industry is also significant. More than ever, Bay Area technology companies are competing for market share in previously non-core industries where sector stalwarts dominate.
For example, Google’s core operations revolve around its advertising, a business with which Google is extremely familiar and which has undergirded earnings for the past decade. However, as reflected in its recent reorganization as Alphabet, its portfolio of business unit initiatives also comprises several high-risk/high-return opportunities, embracing products such as wearable tech, submarine cables, driverless cars and biotechnology, evolving from a software-algorithm-driven service to a company increasingly engaged in the development of physical products.
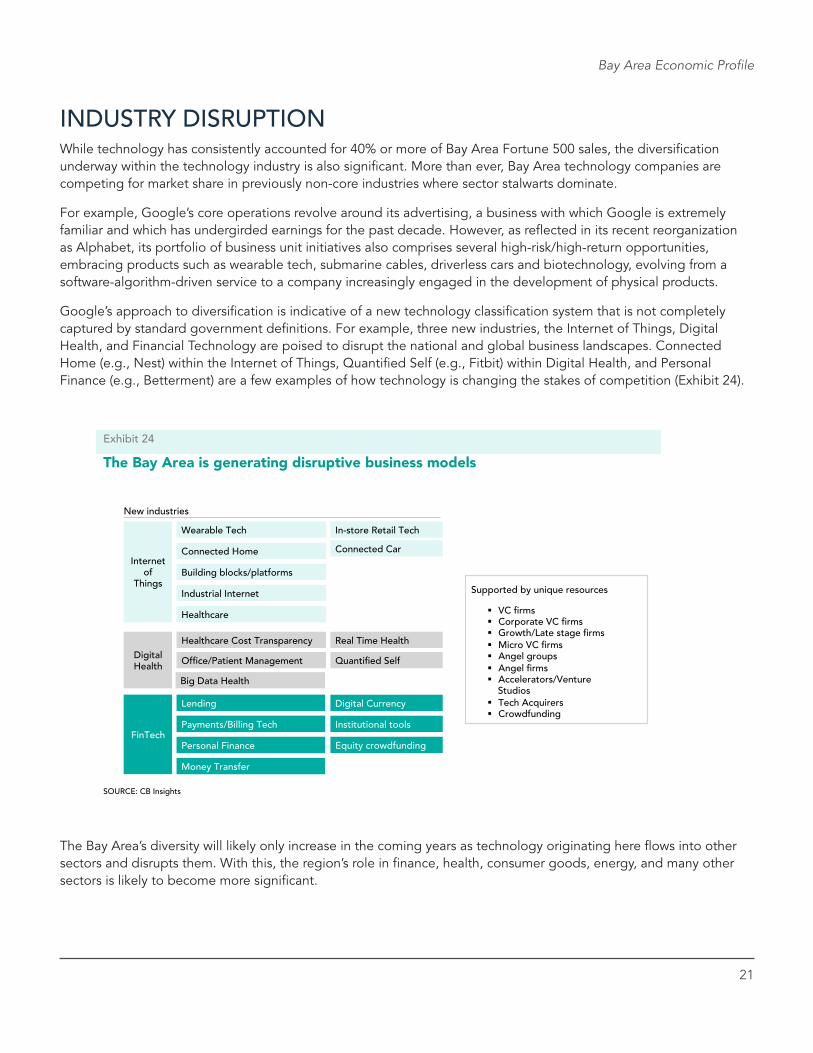
Google’s approach to diversification is indicative of a new technology classification system that is not completely captured by standard government definitions. For example, three new industries, the Internet of Things, Digital Health, and Financial Technology are poised to disrupt the national and global business landscapes. Connected Home (e.g., Nest) within the Internet of Things, Quantified Self (e.g., Fitbit) within Digital Health, and Personal Finance (e.g., Betterment) are a few examples of how technology is changing the stakes of competition (Exhibit 24).
The Bay Area’s diversity will likely only increase in the coming years as technology originating here flows into other sectors and disrupts them. With this, the region’s role in finance, health, consumer goods, energy, and many other sectors is likely to become more significant.
22
Spotlight on:
The Bay Area at the Nexus of the Internet of Things (IoT)
National trend:
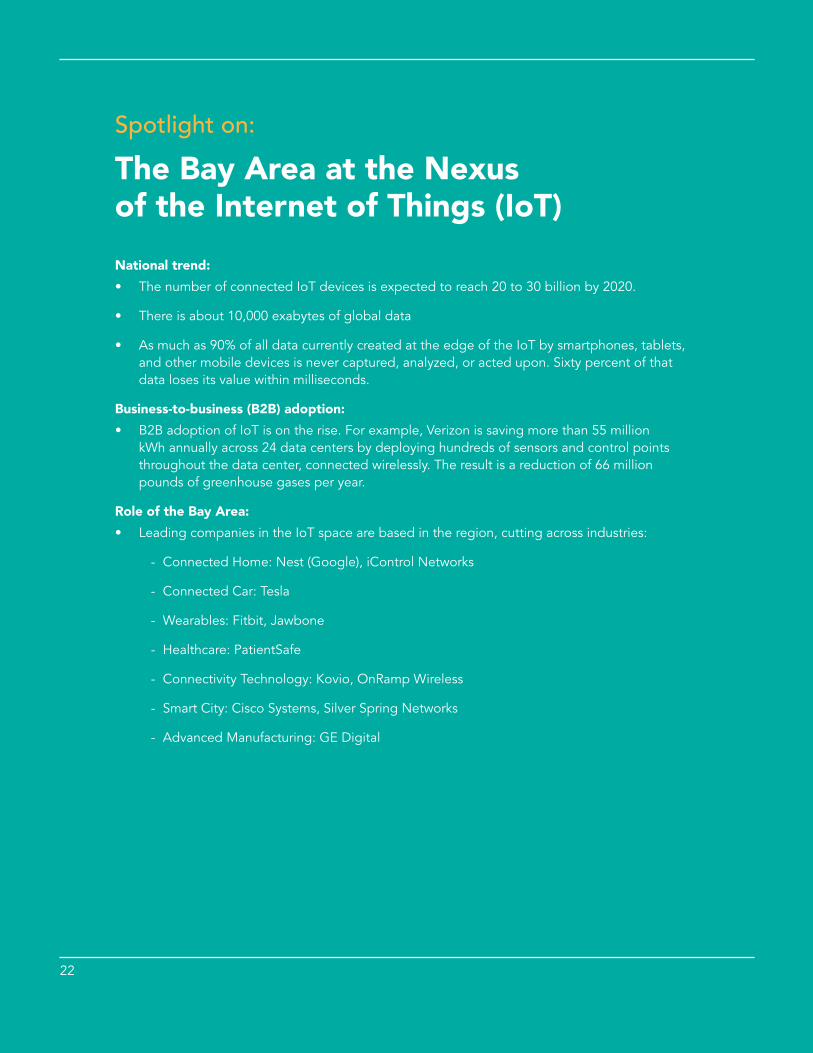
• The number of connected IoT devices is expected to reach 20 to 30 billion by 2020.
• There is about 10,000 exabytes of global data
• As much as 90% of all data currently created at the edge of the IoT by smartphones, tablets, and other mobile devices is never captured, analyzed, or acted upon. Sixty percent of that data loses its value within milliseconds.
Business-to-business (B2B) adoption:
• B2B adoption of IoT is on the rise. For example, Verizon is saving more than 55 million kWh annually across 24 data centers by deploying hundreds of sensors and control points throughout the data center, connected wirelessly. The result is a reduction of 66 million pounds of greenhouse gases per year.
Role of the Bay Area:
• Leading companies in the IoT space are based in the region, cutting across industries:
- Connected Home: Nest (Google), iControl Networks
- Connected Car: Tesla
- Wearables: Fitbit, Jawbone
- Healthcare: PatientSafe
- Connectivity Technology: Kovio, OnRamp Wireless
- Smart City: Cisco Systems, Silver Spring Networks
- Advanced Manufacturing: GE Digital
Report Title
23
SOURCE: BEA, Moody’s Economy.com, McKinsey analysis
1 Productivity is de ned as real GDP per employee in 2009 dollars 2 US average not to scale 3 Bay Area de ned as San Jose, San Francisco, Napa, Santa Rosa, and Vallejo MSAs
-1
0
1
2
3
4
105 110 115 120 125 130 135 140 145 150 155 160
Productivity growth1, 2005-10 CAGR, percent
Productivity, 2010 $1000s per employee
Austin
Los Angeles
San Diego New York
Bay Area US average2
Houston
Atlanta
Seattle Dallas
Boston
-1
0
1
2
3
4
105 110 115 120 125 130 135 140 145 150 155 160
Los Angeles
Productivity, 2014 $1000s per employee
Productivity growth1, 2010-14 CAGR, percent
Bay Area
United States Seattle
San Diego
New York
Atlanta
Austin
Dallas Boston
Houston
Exhibit 25
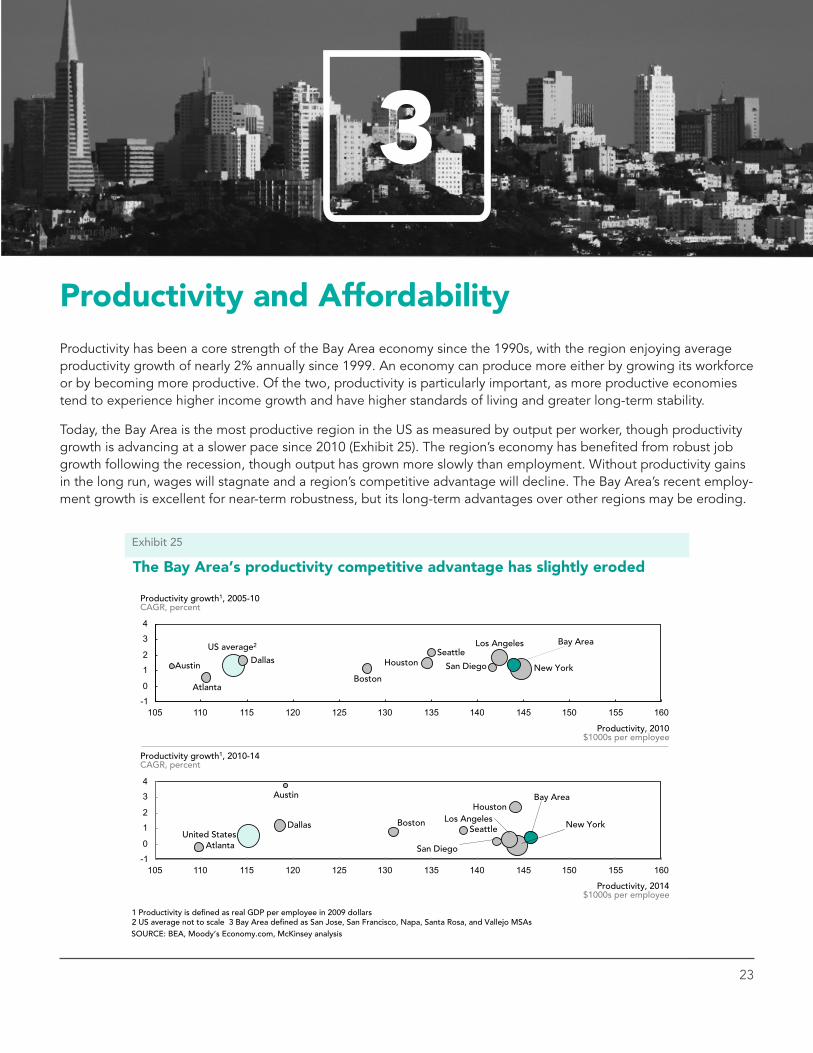
The Bay Area’s productivity competitive advantage has slightly eroded
3Productivity and AffordabilityProductivity has been a core strength of the Bay Area economy since the 1990s, with the region enjoying average productivity growth of nearly 2% annually since 1999. An economy can produce more either by growing its workforce or by becoming more productive. Of the two, productivity is particularly important, as more productive economies tend to experience higher income growth and have higher standards of living and greater long-term stability.
Today, the Bay Area is the most productive region in the US as measured by output per worker, though productivity growth is advancing at a slower pace since 2010 (Exhibit 25). The region’s economy has benefited from robust job growth following the recession, though output has grown more slowly than employment. Without productivity gains in the long run, wages will stagnate and a region’s competitive advantage will decline. The Bay Area’s recent employ-ment growth is excellent for near-term robustness, but its long-term advantages over other regions may be eroding.
24
Promise and Perils of an Accelerated Economy
100
110
120
130
140
1990 1995 2000 2005 2010 2015
SF/US CPI
SF/US output per worker
110
120
130
140
150
1990 1995 2000 2005 2010 2015
San Jose/US CPI
San Jose/US output per worker
San Francisco MSA productivity vs. cost of living Ratio of Bay Area variable to US variable
San Jose MSA productivity vs. cost of living Ratio of Bay Area variable to US variable
SOURCE: BEA, BLS, Moody's Analytics
The Bay Area’s productivity advantage is contracting and even negative in San Jose when adjusted for the regional premium in consumer prices
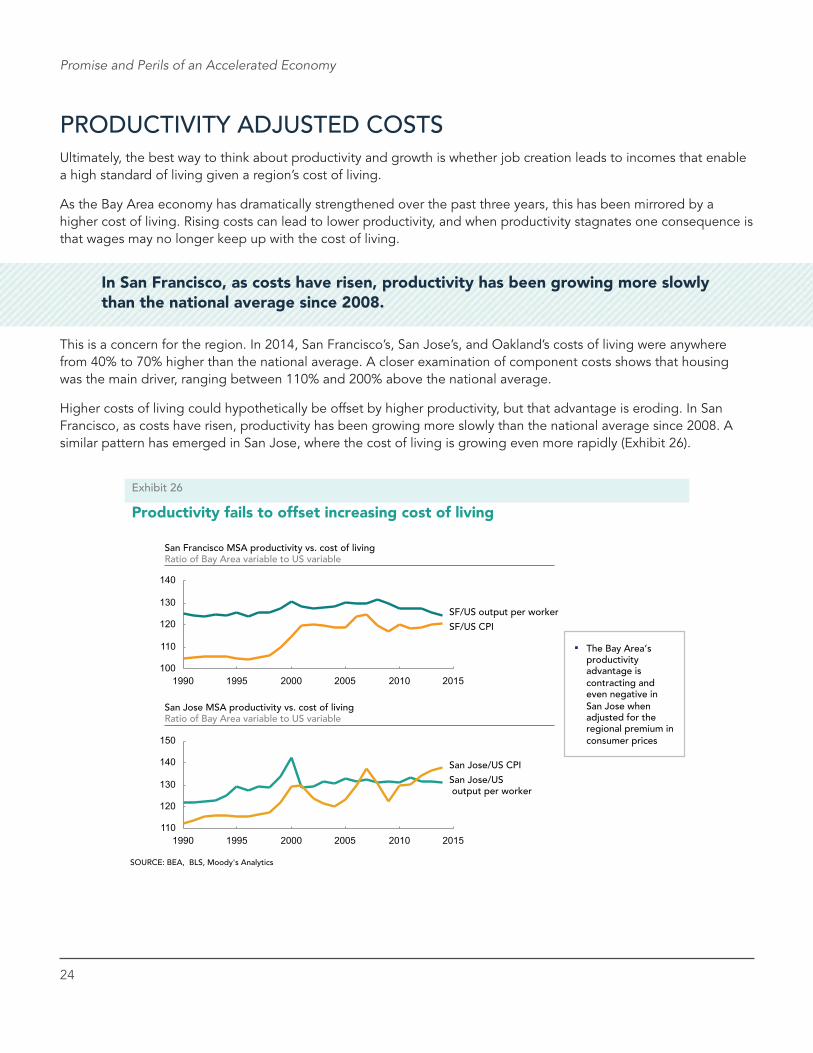
Productivity fails to offset increasing cost of living
Exhibit 26
PRODUCTIVITY ADJUSTED COSTSUltimately, the best way to think about productivity and growth is whether job creation leads to incomes that enable a high standard of living given a region’s cost of living.
As the Bay Area economy has dramatically strengthened over the past three years, this has been mirrored by a higher cost of living. Rising costs can lead to lower productivity, and when productivity stagnates one consequence is that wages may no longer keep up with the cost of living.
This is a concern for the region. In 2014, San Francisco’s, San Jose’s, and Oakland’s costs of living were anywhere from 40% to 70% higher than the national average. A closer examination of component costs shows that housing was the main driver, ranging between 110% and 200% above the national average.
Higher costs of living could hypothetically be offset by higher productivity, but that advantage is eroding. In San Francisco, as costs have risen, productivity has been growing more slowly than the national average since 2008. A similar pattern has emerged in San Jose, where the cost of living is growing even more rapidly (Exhibit 26).
In San Francisco, as costs have risen, productivity has been growing more slowly than the national average since 2008.
25
Bay Area Economic Profile
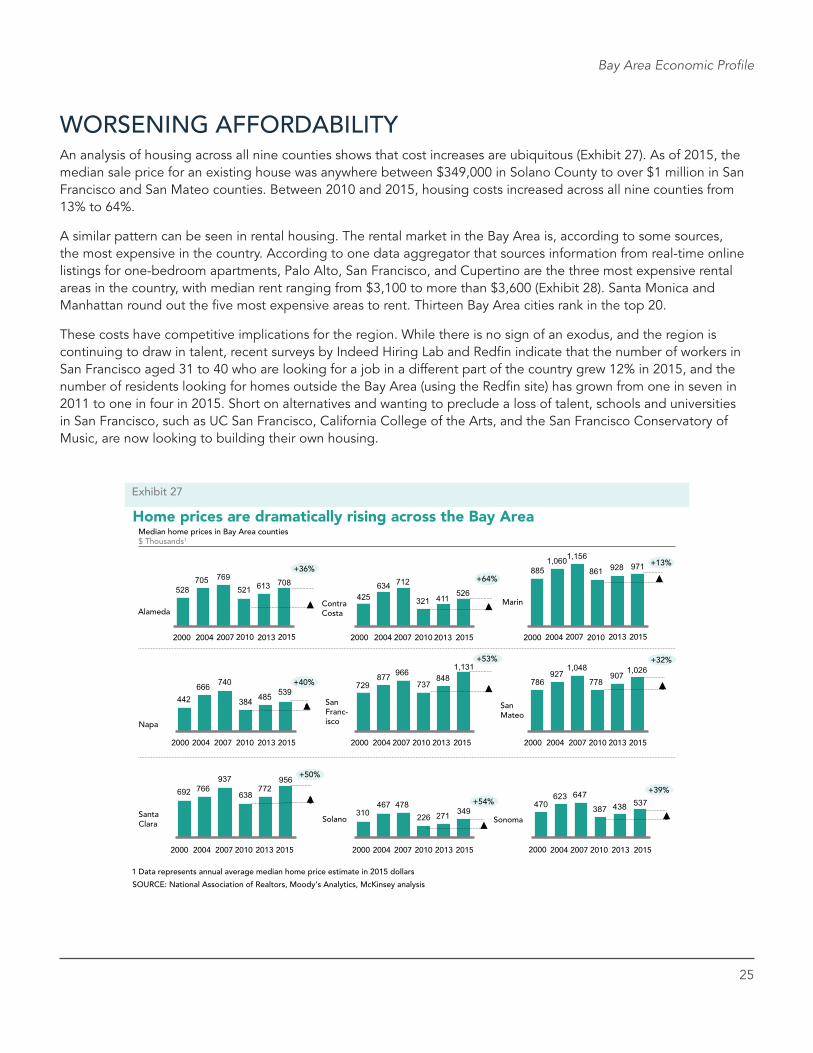
Home prices are dramatically rising across the Bay Area
1 Data represents annual average median home price estimate in 2015 dollars
SOURCE: National Association of Realtors, Moody’s Analytics, McKinsey analysis
708613521769705
528
+36%
Alameda
2013 2010 2007 2004 2000
539485384
740666442
+40%
Napa
2013 2010 2007 2004 2000
349271226478467
310+54%
Solano
2013 2010 2007 2004 2000
537438387
647623470
+39%
Sonoma
2013 2010 2007 2004 2000
526411321
712634425
+64%
Contra Costa
2013 2010 2007 2004 2000
971928861
1,1561,060885
+13%
Marin
2010 2007 2004 2000
1,026907
778
1,048927
786
+32%
San Mateo
2013 2010 2007 2004 2000
956772
638
937766692
+50%
Santa Clara
2013 2010 2007 2004 2000
1,131848
737966877
729
+53%
San Franc- isco
2013 2010 2007 2004 2000
Median home prices in Bay Area counties $ Thousands1
Exhibit 27
2015 2015 2013 2015
2015 2015 2015
2015 2015 2015
WORSENING AFFORDABILITY An analysis of housing across all nine counties shows that cost increases are ubiquitous (Exhibit 27). As of 2015, the median sale price for an existing house was anywhere between $349,000 in Solano County to over $1 million in San Francisco and San Mateo counties. Between 2010 and 2015, housing costs increased across all nine counties from 13% to 64%.
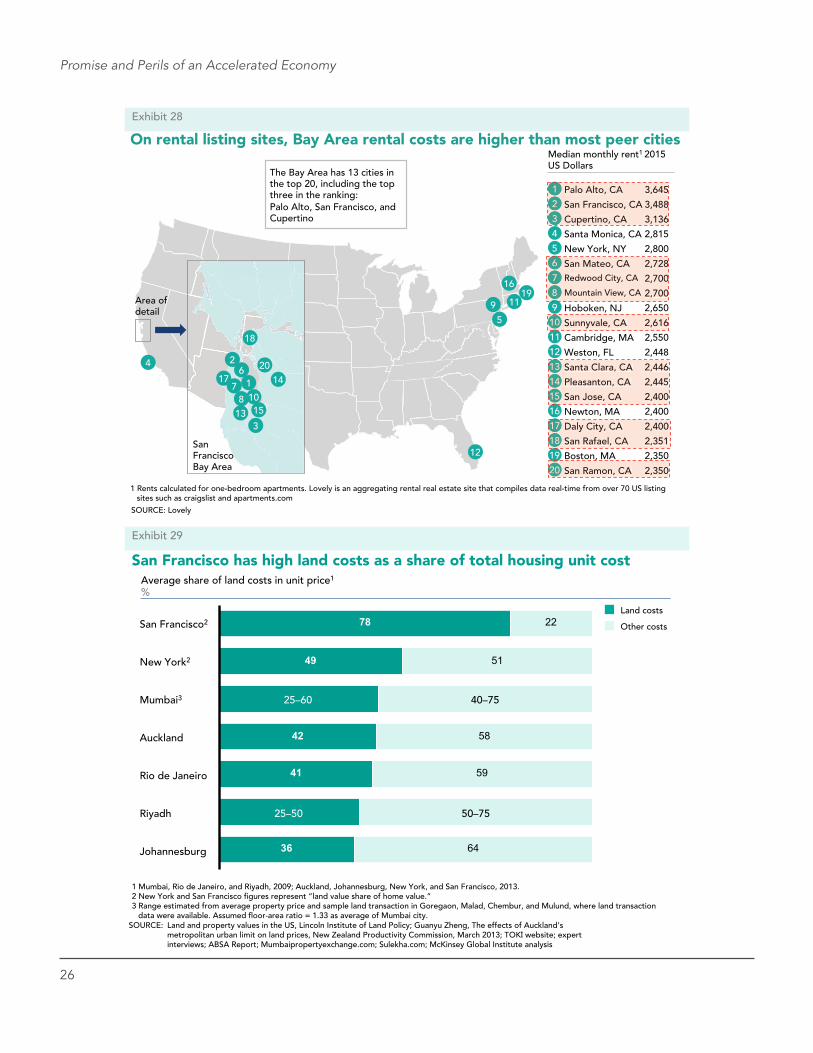
A similar pattern can be seen in rental housing. The rental market in the Bay Area is, according to some sources, the most expensive in the country. According to one data aggregator that sources information from real-time online listings for one-bedroom apartments, Palo Alto, San Francisco, and Cupertino are the three most expensive rental areas in the country, with median rent ranging from $3,100 to more than $3,600 (Exhibit 28). Santa Monica and Manhattan round out the five most expensive areas to rent. Thirteen Bay Area cities rank in the top 20.
These costs have competitive implications for the region. While there is no sign of an exodus, and the region is continuing to draw in talent, recent surveys by Indeed Hiring Lab and Redfin indicate that the number of workers in San Francisco aged 31 to 40 who are looking for a job in a different part of the country grew 12% in 2015, and the number of residents looking for homes outside the Bay Area (using the Redfin site) has grown from one in seven in 2011 to one in four in 2015. Short on alternatives and wanting to preclude a loss of talent, schools and universities in San Francisco, such as UC San Francisco, California College of the Arts, and the San Francisco Conservatory of Music, are now looking to building their own housing.
26
Promise and Perils of an Accelerated Economy
On rental listing sites, Bay Area rental costs are higher than most peer cities
SOURCE: Lovely
The Bay Area has 13 cities in the top 20, including the top three in the ranking: Palo Alto, San Francisco, and Cupertino
1
2
3
4
5
6
7
8
9
10
11
12
13
14
15
16
17
18
19
20
Palo Alto, CA
San Francisco, CA
Cupertino, CA
Santa Monica, CA
New York, NY
San Mateo, CA Redwood City, CA
Mountain View, CA
Hoboken, NJ
Sunnyvale, CA
Cambridge, MA
Weston, FL
Santa Clara, CA
Pleasanton, CA
San Jose, CA
Newton, MA
Daly City, CA
San Rafael, CA
Boston, MA
San Ramon, CA
3,645
3,488
3,136
2,815
2,800
2,728
2,700
2,700
2,650
2,616
2,550
2,448
2,446
2,445
2,400
2,400
2,400
2,351
2,350
2,350
4
16
11 19
5
9
12
Area of detail
10 Sunnyvale, CA 2,616
1
2
3
Palo Alto, CA
San Francisco, CA
Cupertino, CA
3,645
3,488
3,136
6
7
8
San Mateo, CARedwood City, CA
Mountain View, CA
2,728
2,700
2,700
13
14
15
Santa Clara, CA
Pleasanton, CA
San Jose, CA
2,446
2,445
2,400
Median monthly rent1 2015 US Dollars
1 Rents calculated for one-bedroom apartments. Lovely is an aggregating rental real estate site that compiles data real-time from over 70 US listing sites such as craigslist and apartments.com
Exhibit 28
17
18 Daly City, CA
San Rafael, CA
2,400
2,351
20 San Ramon, CA 2,350
18
2
17 7 1
13 3
10 15
6 20 14
8
San Francisco Bay Area
San Francisco has high land costs as a share of total housing unit cost
SOURCE: Land and property values in the US, Lincoln Institute of Land Policy; Guanyu Zheng, The effects of Auckland’s metropolitan urban limit on land prices, New Zealand Productivity Commission, March 2013; TOK website; expert interviews; ABSA Report; Mumbaipropertyexchange.com; Sulekha.com; McKinsey Global Institute analysis
1 Mumbai, Rio de Janeiro, and Riyadh, 2009; Auckland, Johannesburg, New York, and San Francisco, 2013. 2 New York and San Francisco gures represent “land value share of home value.” 3 Range estimated from average property price and sample land transaction in Goregaon, Malad, Chembur, and Mulund, where land transaction
data were available. Assumed oor-area ratio = 1.33 as average of Mumbai city.
Average share of land costs in unit price1
%
78
49
42
41
36
22
51
58
59
64Johannesburg
Riyadh 25–50 50–75
Rio de Janeiro
Auckland
Mumbai3 25–60 40–75
New York2
San Francisco2 Other costs
Land costs
Exhibit 29
27
Bay Area Economic Profile
San Francisco 2007-2014 Indexed to year 2007
San Jose 2007-2014 Indexed to year 2007
The pace of housing construction is increasing, but is insuf cient to meet demand
SOURCE: Moody’s Analytics
020
406080
100120 100 = Affordable
Based on Market Conditions
2014 13 12 11 10 09 08 2007
020406080
100120140
100 = Affordable Based on Market Conditions
09 11 10 2014 13 12 08 2007
Affordability1
Completions
1 Median area family income divided by minimum qualifying income for paying for a house. Minimum qualifying income is de ned as annual mortgage payment for a median priced home assuming no more than 25% of annual income goes to this payment. A value of 100 means that a family with the median income has exactly enough income to qualify for a typical mortgage on a median-priced single-family home. An index above 100 signi es that the family has surplus income. An index below 100 signi es a lack of affordability.
Exhibit 30
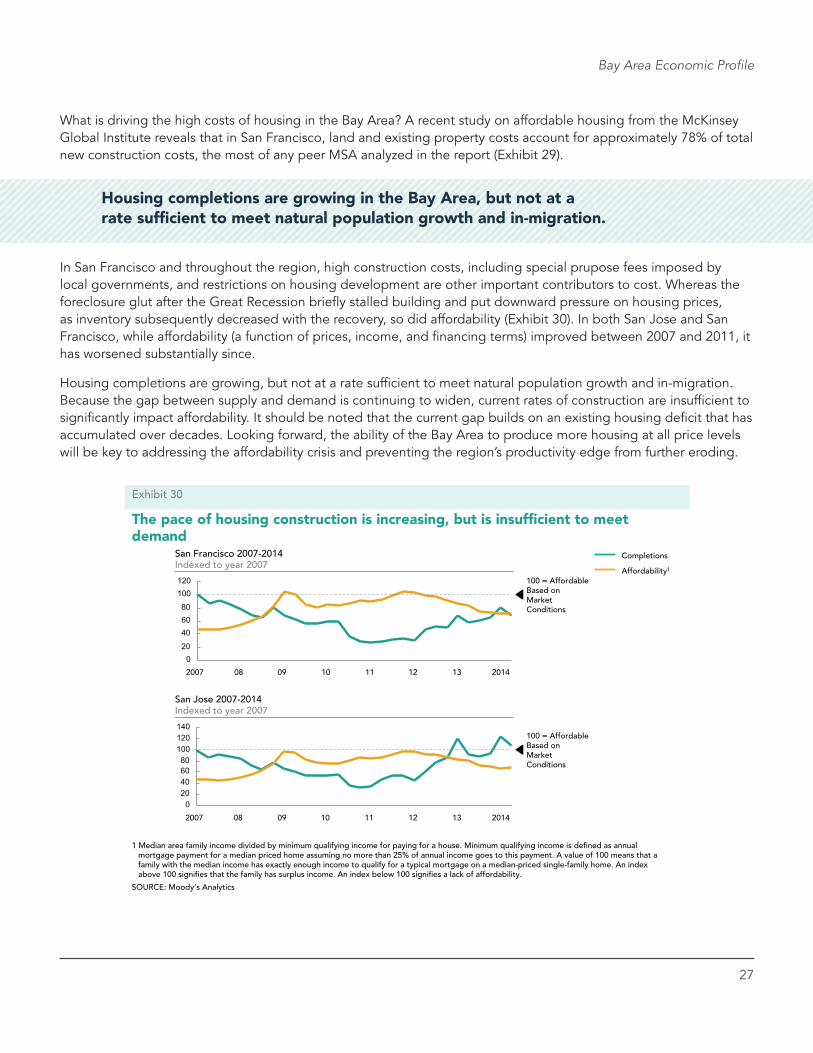
What is driving the high costs of housing in the Bay Area? A recent study on affordable housing from the McKinsey Global Institute reveals that in San Francisco, land and existing property costs account for approximately 78% of total new construction costs, the most of any peer MSA analyzed in the report (Exhibit 29).
In San Francisco and throughout the region, high construction costs, including special prupose fees imposed by local governments, and restrictions on housing development are other important contributors to cost. Whereas the foreclosure glut after the Great Recession briefly stalled building and put downward pressure on housing prices, as inventory subsequently decreased with the recovery, so did affordability (Exhibit 30). In both San Jose and San Francisco, while affordability (a function of prices, income, and financing terms) improved between 2007 and 2011, it has worsened substantially since.
Housing completions are growing, but not at a rate sufficient to meet natural population growth and in-migration. Because the gap between supply and demand is continuing to widen, current rates of construction are insufficient to significantly impact affordability. It should be noted that the current gap builds on an existing housing deficit that has accumulated over decades. Looking forward, the ability of the Bay Area to produce more housing at all price levels will be key to addressing the affordability crisis and preventing the region’s productivity edge from further eroding.
Housing completions are growing in the Bay Area, but not at a rate sufficient to meet natural population growth and in-migration.
Report Title
28
4
While most Bay Area county education metrics are in line or better than statewide averages, San Francisco’s dropout rate remains high
California Avg.
20
27
27
24
23
25
23
27
26
24
Sonoma
Solano
Santa Clara
San Mateo
San Francisco
Napa
Marin
Contra Costa
Alameda
SOURCE: California Department of Education, McKinsey analysis 1 The four-year derived dropout rate is an estimate of the percent of students who would drop out in a four-year period based on single year data
12
11
11
7
10
6
8
11
15
12
Dropout Rates1 2014 Grade 9 through grade 12 Percent
Dropout Rate Change versus 2010 Percentage Points
-6.5
-5.8
-1.0
-6.5
-2.6
-5.8
-2.9
-11.0
-3.8
-5.1
Classroom size, 2011-12 Student-teacher ratio classes <50 students
Exhibit 31
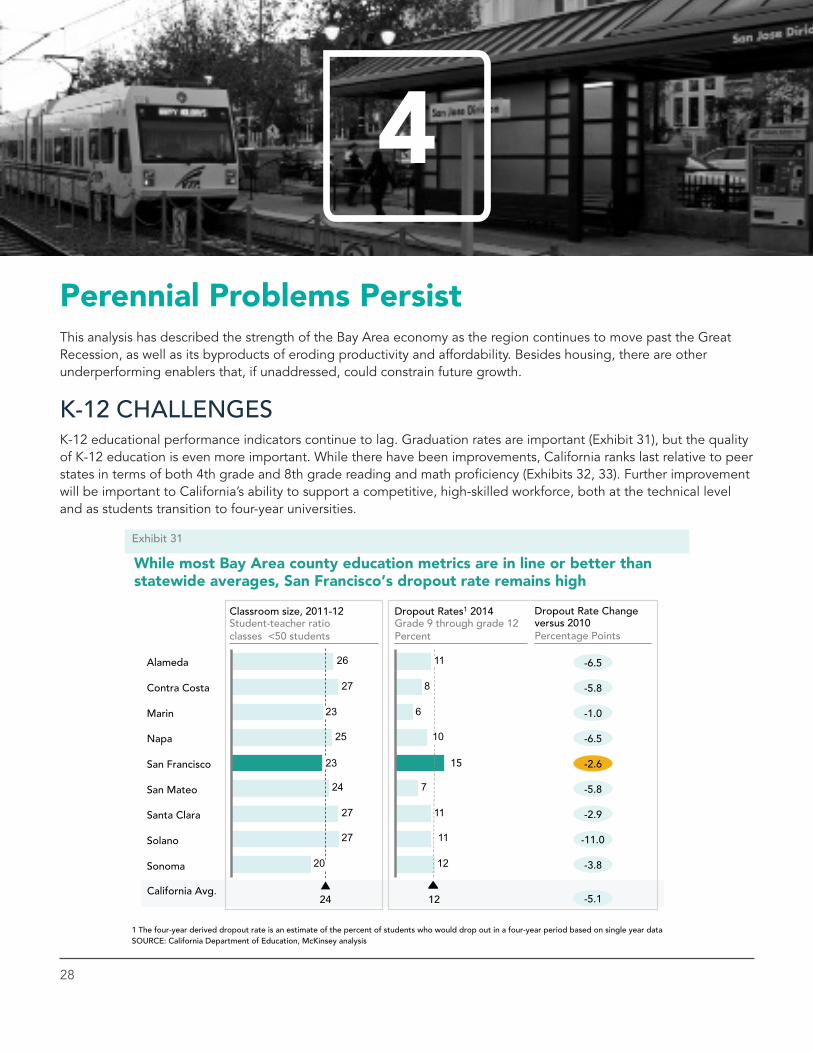
Perennial Problems PersistThis analysis has described the strength of the Bay Area economy as the region continues to move past the Great Recession, as well as its byproducts of eroding productivity and affordability. Besides housing, there are other underperforming enablers that, if unaddressed, could constrain future growth.
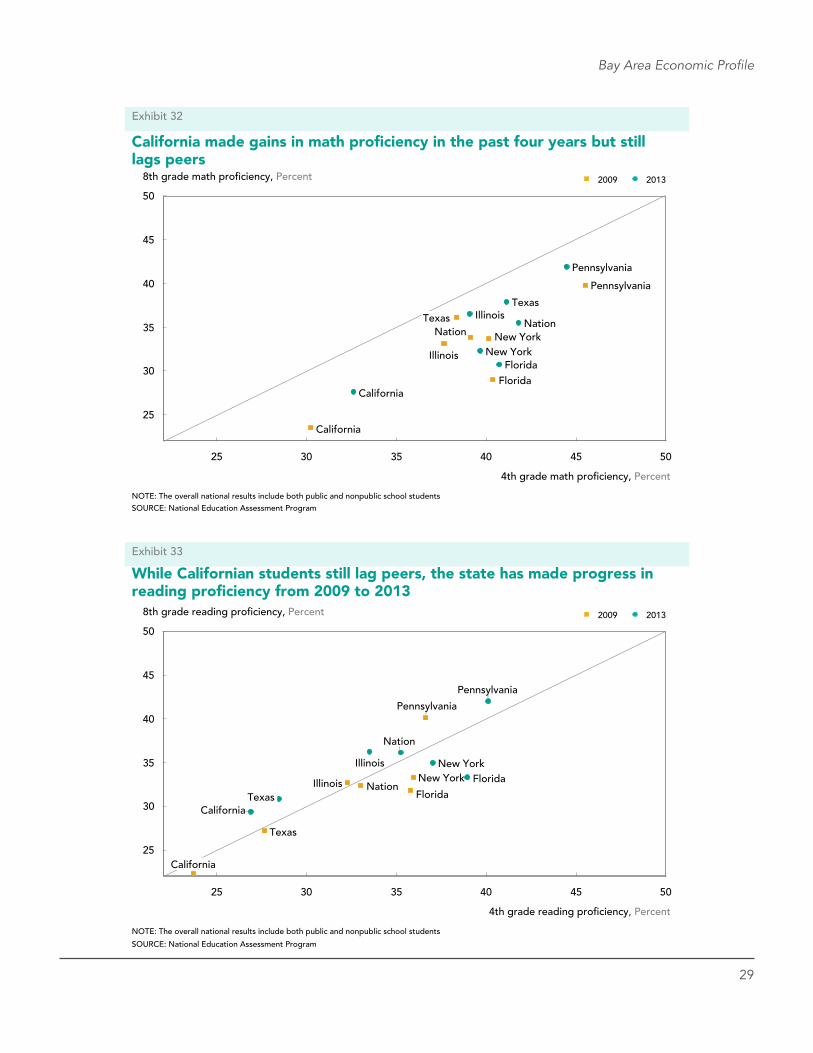
K-12 CHALLENGESK-12 educational performance indicators continue to lag. Graduation rates are important (Exhibit 31), but the quality of K-12 education is even more important. While there have been improvements, California ranks last relative to peer states in terms of both 4th grade and 8th grade reading and math proficiency (Exhibits 32, 33). Further improvement will be important to California’s ability to support a competitive, high-skilled workforce, both at the technical level and as students transition to four-year universities.
29
Bay Area Economic Profile
California made gains in math pro ciency in the past four years but still lags peers
30
25
50 45 40 35 30 25
35
50
45
40
New York
Illinois
Florida
California
Florida
Illinois
New York
Pennsylvania
Texas
Nation
4th grade math pro ciency, Percent
California
8th grade math pro ciency, Percent
Nation Texas
Pennsylvania
2013 2009
SOURCE: National Education Assessment Program NOTE: The overall national results include both public and nonpublic school students
Exhibit 32
45 35
50
45
25
35
30
40
30 25 40 50
4th grade reading pro ciency, Percent
8th grade reading pro ciency, Percent
Pennsylvania
Texas
Nation
New York Illinois Florida
California
Nation
Texas
Pennsylvania
New York Illinois Florida
California
While Californian students still lag peers, the state has made progress in reading pro ciency from 2009 to 2013
2009 2013
NOTE: The overall national results include both public and nonpublic school students
SOURCE: National Education Assessment Program
Exhibit 33
30
Promise and Perils of an Accelerated Economy
Exhibit 34
There has been a sharp rise in tuition for higher education nationally
1 Includes four-year public universities SOURCE: College Board
2,000
3,000
4,000
5,000
6,000
7,000
8,000
9,000
10,000
11,000
12,000
13,000
14,000
California (+115%)
Texas (+68%)
Pennsylvania (+55%)
Illinois (+93%)
Michigan (+84%)
Washington (+120%)
New York (+40%)
Florida (+107%)
2004-05 2005-06 2006-07 2007-08 2008-09 2009-10 2010-11 2011-12 2012-13 2013-14
Tuition1 by state, 2004-2014
2014 US Dollars
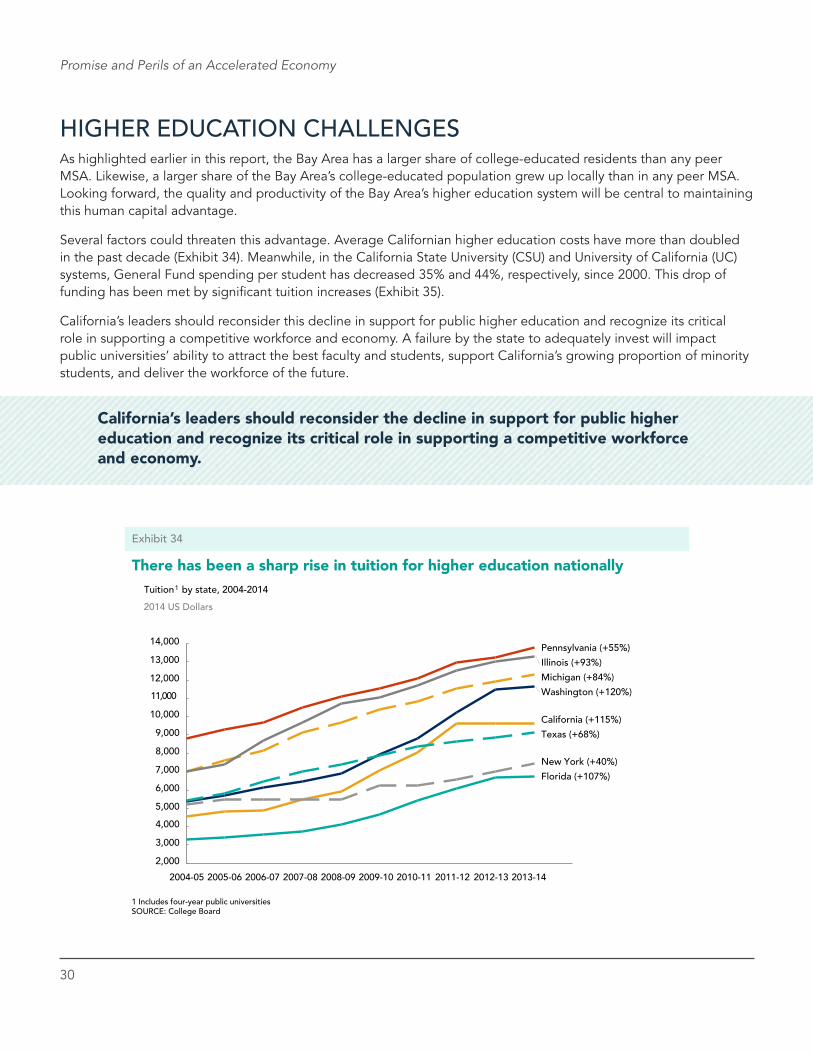
HIGHER EDUCATION CHALLENGESAs highlighted earlier in this report, the Bay Area has a larger share of college-educated residents than any peer MSA. Likewise, a larger share of the Bay Area’s college-educated population grew up locally than in any peer MSA. Looking forward, the quality and productivity of the Bay Area’s higher education system will be central to maintaining this human capital advantage.
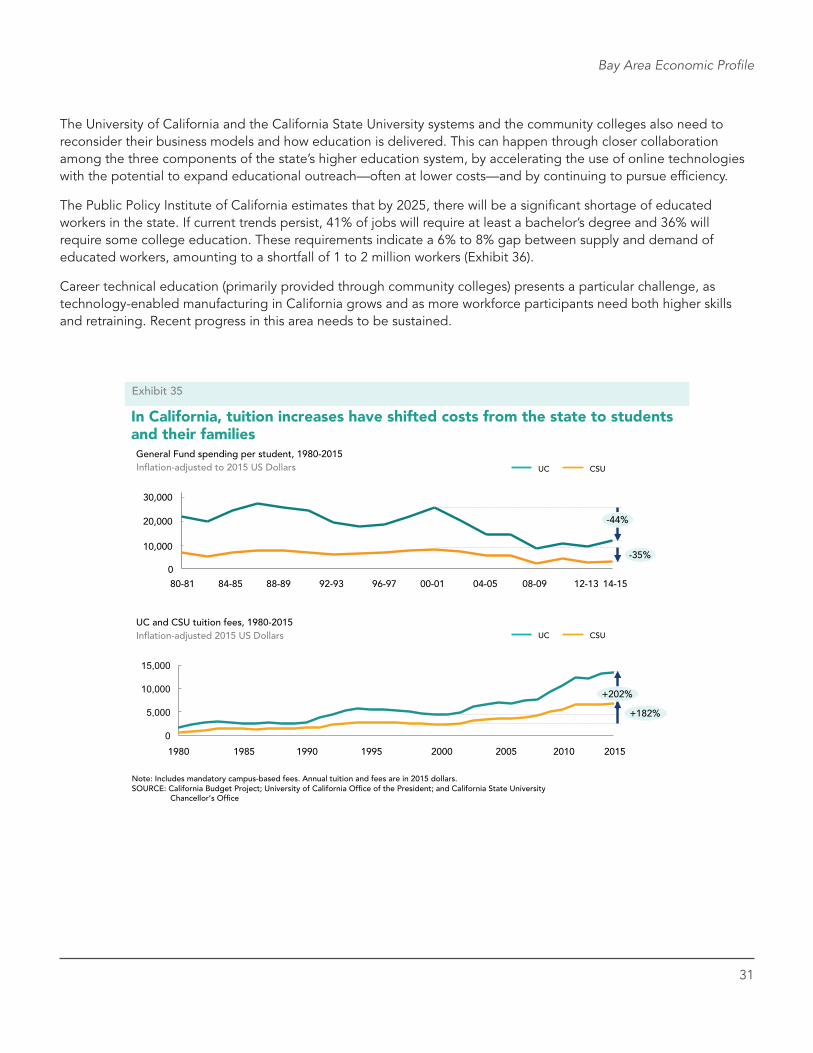
Several factors could threaten this advantage. Average Californian higher education costs have more than doubled in the past decade (Exhibit 34). Meanwhile, in the California State University (CSU) and University of California (UC) systems, General Fund spending per student has decreased 35% and 44%, respectively, since 2000. This drop of funding has been met by significant tuition increases (Exhibit 35).
California’s leaders should reconsider this decline in support for public higher education and recognize its critical role in supporting a competitive workforce and economy. A failure by the state to adequately invest will impact public universities’ ability to attract the best faculty and students, support California’s growing proportion of minority students, and deliver the workforce of the future.
California’s leaders should reconsider the decline in support for public higher education and recognize its critical role in supporting a competitive workforce and economy.
31
Bay Area Economic Profile
The University of California and the California State University systems and the community colleges also need to reconsider their business models and how education is delivered. This can happen through closer collaboration among the three components of the state’s higher education system, by accelerating the use of online technologies with the potential to expand educational outreach—often at lower costs—and by continuing to pursue efficiency.
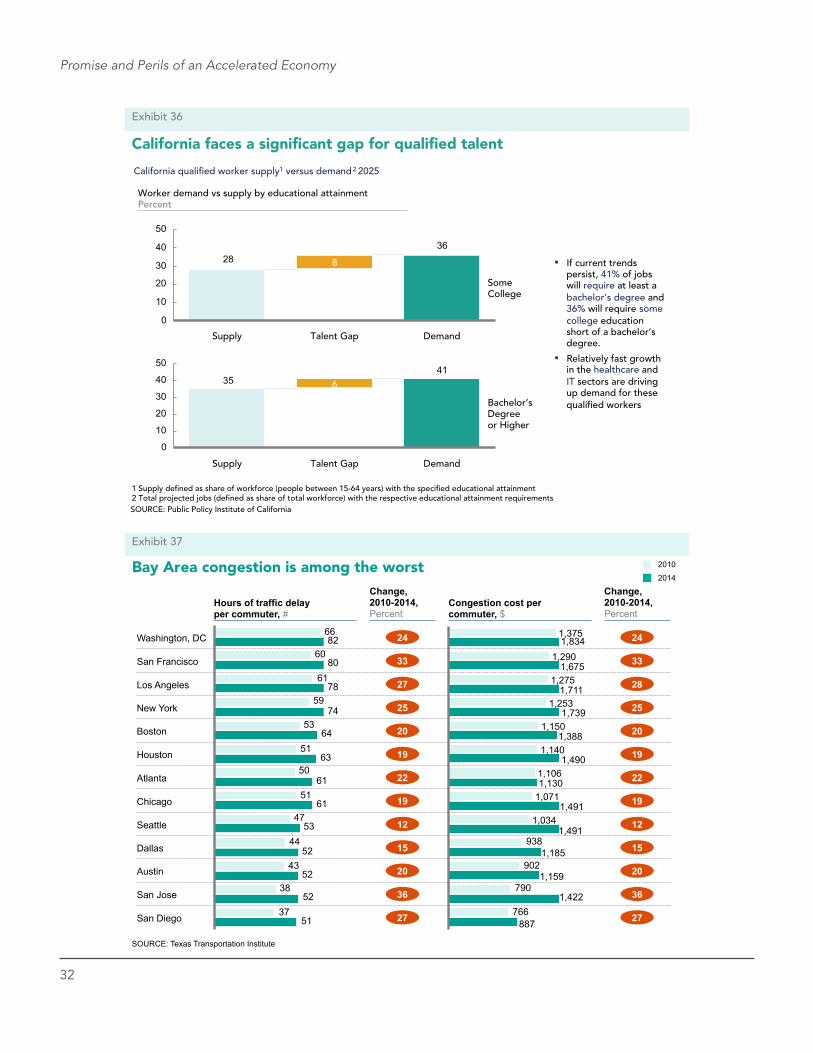
The Public Policy Institute of California estimates that by 2025, there will be a significant shortage of educated workers in the state. If current trends persist, 41% of jobs will require at least a bachelor’s degree and 36% will require some college education. These requirements indicate a 6% to 8% gap between supply and demand of educated workers, amounting to a shortfall of 1 to 2 million workers (Exhibit 36).
Career technical education (primarily provided through community colleges) presents a particular challenge, as technology-enabled manufacturing in California grows and as more workforce participants need both higher skills and retraining. Recent progress in this area needs to be sustained.
In California, tuition increases have shifted costs from the state to students and their families
SOURCE: California Budget Project; University of California Of ce of the President; and California State University Chancellor’s Of ce
30,000
20,000
10,000
0 12-13 08-09 04-05 00-01 96-97 92-93 88-89 84-85 80-81
-44%
-35%
CSU UC
General Fund spending per student, 1980-2015
UC and CSU tuition fees, 1980-2015
0
5,000
10,000
15,000
2015 2000 1980
+182%
+202%
UC CSU
Note: Includes mandatory campus-based fees. Annual tuition and fees are in 2015 dollars.
In ation-adjusted to 2015 US Dollars
In ation-adjusted 2015 US Dollars
Exhibit 35
1985 1990 1995 2005 2010
14-15
32
Promise and Perils of an Accelerated Economy
California faces a signi cant gap for quali ed talent
SOURCE: Public Policy Institute of California
3628
0
10
20
30
40
50
Some College
Demand Talent Gap
8
Supply
4135
0
10
20
30
40
50
Bachelor’s Degree or Higher
Demand Talent Gap
6
Supply
Worker demand vs supply by educational attainment Percent
If current trends persist, 41% of jobs will require at least a bachelor’s degree and 36% will require some college education short of a bachelor’s degree.
Relatively fast growth in the healthcare and IT sectors are driving up demand for these quali ed workers
California quali ed worker supply1 versus demand 2 2025
1 Supply de ned as share of workforce (people between 15-64 years) with the speci ed educational attainment 2 Total projected jobs (de�ned as share of total workforce) with the respective educational attainment requirements
Exhibit 36
Bay Area congestion is among the worst 2014
2010
24 24
27 28
33 33
25 25
20 20
19 19
19 19
22 22
15 15
12 12
20 20
36 36
27 27
66
60
53
51
51
47
44
38
61
52
37
43
50
59
61
51
52
52
53
61
63
64
74
78
80
82
Chicago
Atlanta
San Jose
Austin
San Diego
Houston
Boston
San Francisco
Washington, DC
Dallas
Seattle
New York
Los Angeles
766
790
902
938
1,491 1,071 1,130 1,106
1,490 1,140
1,388 1,150
1,739 1,253
1,711 1,275
1,675 1,290
1,375
1,491 1,034
Hours of traffic delay per commuter, #
Change, 2010-2014, Percent
Congestion cost per commuter, $
Change, 2010-2014, Percent
SOURCE: Texas Transportation Institute
Exhibit 37
1,834
1,185
1,159
1,422
887
33
Bay Area Economic Profile
BART is planning to repair its aging infrastructure and increase its capacity through investments in new train cars and an advanced train-control system. These investments will enable longer trains operating at greater frequency. To pay for further system improvements, BART is likely to bring a $3.5 billion ballot measure to voters in November 2016.
Though necessary, even this investment is insufficient to meet growing demand in the long term. At peak times the Transbay Tube carries 28,000 passengers per hour, double the number crossing the Bay Bridge. As the tube and the bridge both are currently at capacity in peak commute hours, planning must begin for a second transbay transit crossing. A second crossing will increase the system’s capacity as the region’s population and job base grow, and provide important redundancy for maintenance and to manage emergencies. Building it should not take 25 to 30 years, which is the norm for large public projects of this type, but should be advanced as a regional priority now.
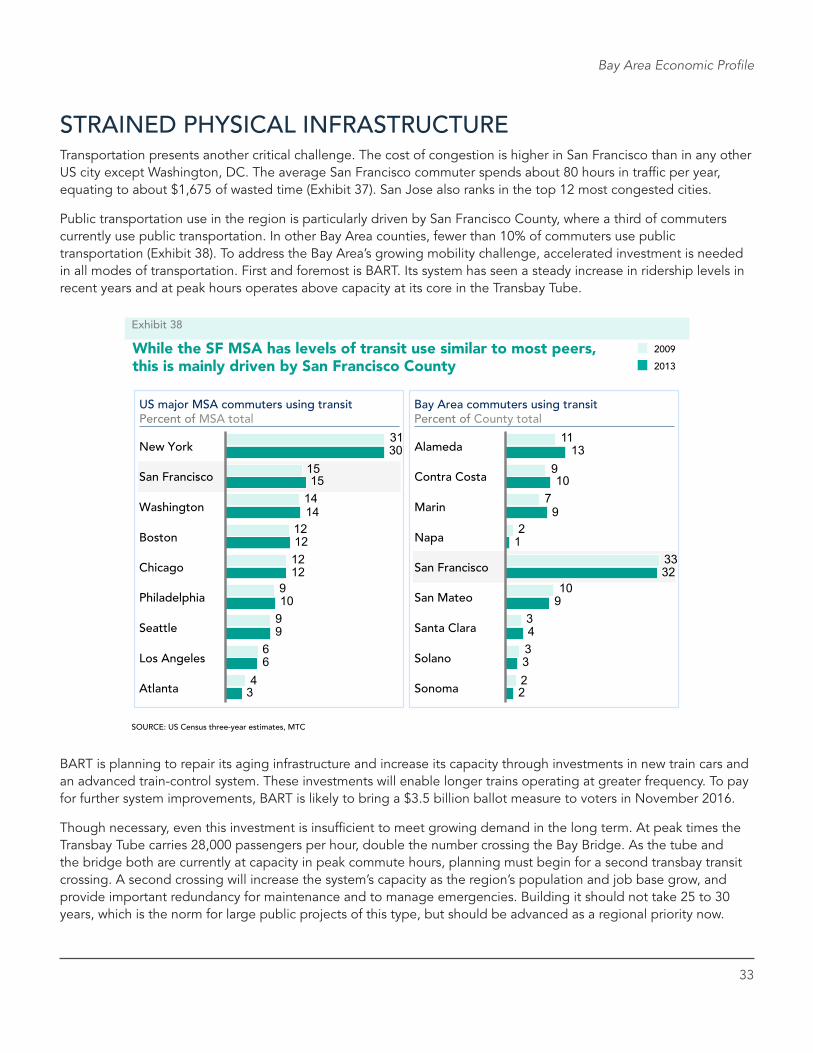
While the SF MSA has levels of transit use similar to most peers, this is mainly driven by San Francisco County
US major MSA commuters using transit Percent of MSA total
Bay Area commuters using transit Percent of County total
15
4
6
9
9
12
12
14
31
3
6
9
10
12
12
14
15
30
Washington
San Francisco
New York
Chicago
Boston
Atlanta
Los Angeles
Seattle
Philadelphia
2013
2009
2
9
32
3
3
10
33
2
7
9
11
2
3
4
9
1
10
13
Sonoma
Solano
Alameda
Santa Clara
San Mateo
Marin
Contra Costa
San Francisco
Napa
SOURCE: US Census three-year estimates, MTC
Exhibit 38
STRAINED PHYSICAL INFRASTRUCTURETransportation presents another critical challenge. The cost of congestion is higher in San Francisco than in any other US city except Washington, DC. The average San Francisco commuter spends about 80 hours in traffic per year, equating to about $1,675 of wasted time (Exhibit 37). San Jose also ranks in the top 12 most congested cities.
Public transportation use in the region is particularly driven by San Francisco County, where a third of commuters currently use public transportation. In other Bay Area counties, fewer than 10% of commuters use public transportation (Exhibit 38). To address the Bay Area’s growing mobility challenge, accelerated investment is needed in all modes of transportation. First and foremost is BART. Its system has seen a steady increase in ridership levels in recent years and at peak hours operates above capacity at its core in the Transbay Tube.
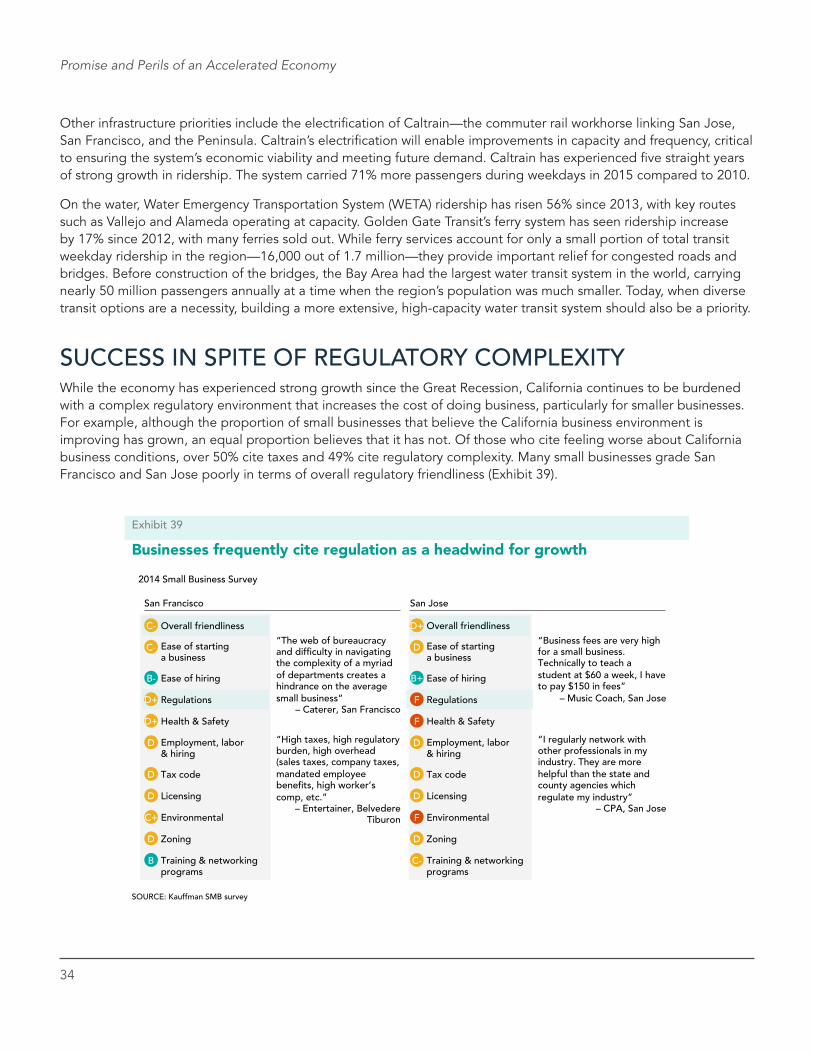
34
Promise and Perils of an Accelerated Economy
Exhibit 39
Businesses frequently cite regulation as a headwind for growth
SOURCE: Kauffman SMB survey
2014 Small Business Survey
San Francisco San Jose
“Business fees are very high for a small business. Technically to teach a student at $60 a week, I have to pay $150 in fees”
– Music Coach, San Jose
“I regularly network with other professionals in my industry. They are more helpful than the state and county agencies which regulate my industry”
– CPA, San Jose
“High taxes, high regulatory burden, high overhead (sales taxes, company taxes, mandated employee bene ts, high worker’s comp, etc.”
– Entertainer, BelvedereTiburon
“The web of bureaucracy and dif culty in navigating the complexity of a myriad of departments creates a hindrance on the average small business”
– Caterer, San Francisco
Overall friendliness C-
Ease of starting a business
C-
Ease of hiring B-
Regulations D+
Health & Safety D+
Employment, labor & hiring
D
Tax code D
Licensing D
Environmental C+
Zoning D
Training & networking programs
B
Overall friendliness D+
Ease of starting a business
D
Ease of hiring B+
Regulations F
Health & Safety F
Employment, labor & hiring
D
Tax code D
Licensing D
Environmental F
Zoning D
Training & networking programs
C-
Other infrastructure priorities include the electrification of Caltrain—the commuter rail workhorse linking San Jose, San Francisco, and the Peninsula. Caltrain’s electrification will enable improvements in capacity and frequency, critical to ensuring the system’s economic viability and meeting future demand. Caltrain has experienced five straight years of strong growth in ridership. The system carried 71% more passengers during weekdays in 2015 compared to 2010.
On the water, Water Emergency Transportation System (WETA) ridership has risen 56% since 2013, with key routes such as Vallejo and Alameda operating at capacity. Golden Gate Transit’s ferry system has seen ridership increase by 17% since 2012, with many ferries sold out. While ferry services account for only a small portion of total transit weekday ridership in the region—16,000 out of 1.7 million—they provide important relief for congested roads and bridges. Before construction of the bridges, the Bay Area had the largest water transit system in the world, carrying nearly 50 million passengers annually at a time when the region’s population was much smaller. Today, when diverse transit options are a necessity, building a more extensive, high-capacity water transit system should also be a priority.
SUCCESS IN SPITE OF REGULATORY COMPLEXITYWhile the economy has experienced strong growth since the Great Recession, California continues to be burdened with a complex regulatory environment that increases the cost of doing business, particularly for smaller businesses. For example, although the proportion of small businesses that believe the California business environment is improving has grown, an equal proportion believes that it has not. Of those who cite feeling worse about California business conditions, over 50% cite taxes and 49% cite regulatory complexity. Many small businesses grade San Francisco and San Jose poorly in terms of overall regulatory friendliness (Exhibit 39).
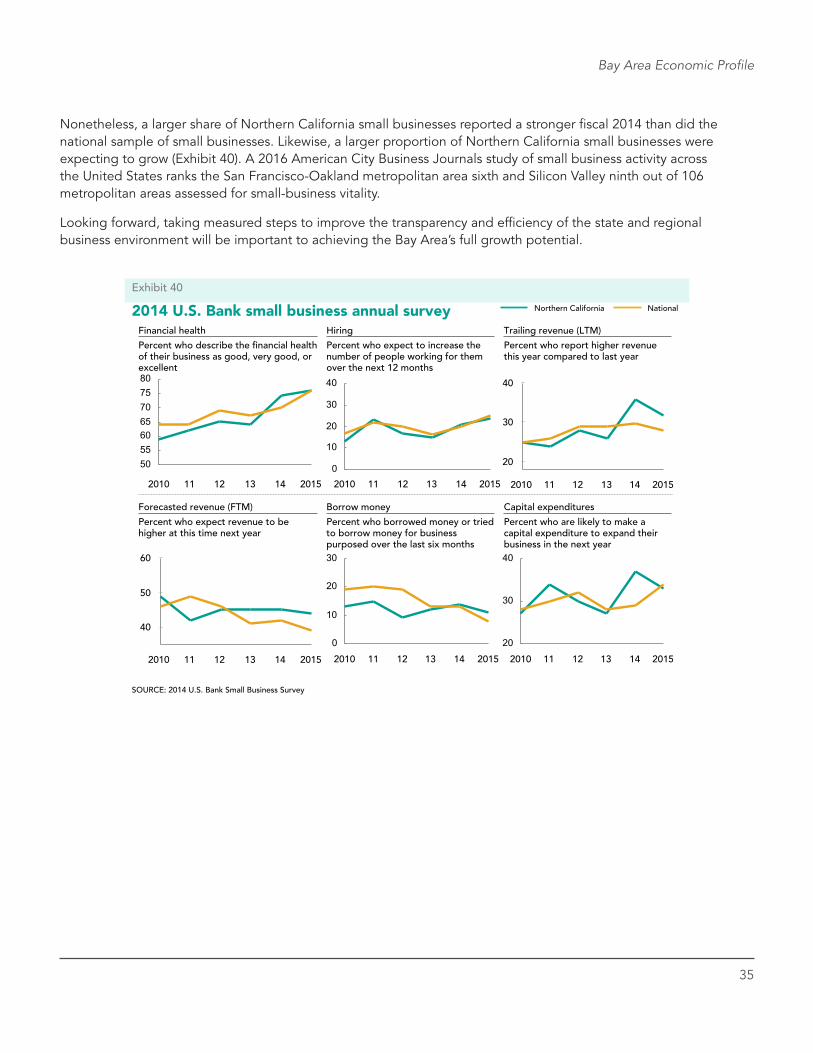
35
Bay Area Economic Profile
Financial health Hiring Trailing revenue (LTM)
Borrow money Forecasted revenue (FTM) Capital expenditures
Percent who expect to increase the number of people working for them over the next 12 months
Percent who describe the nancial health of their business as good, very good, or excellent
Percent who report higher revenue this year compared to last year
Percent who expect revenue to be higher at this time next year
Percent who borrowed money or tried to borrow money for business purposed over the last six months
Percent who are likely to make a capital expenditure to expand their business in the next year
50556065707580
14 13 12 11 2010 2015
0
10
20
30
40
14 13 12 11 2010 2015
30
20
40
14 13 12 11 2010 2015
60
50
40
14 13 12 11 2010 2015
0
10
20
30
14 13 12 11 2010 2015
20
30
40
14 13 12 11 2010 2015
SOURCE: 2014 U.S. Bank Small Business Survey
2014 U.S. Bank small business annual survey
Exhibit 40
Northern California National
Nonetheless, a larger share of Northern California small businesses reported a stronger fiscal 2014 than did the national sample of small businesses. Likewise, a larger proportion of Northern California small businesses were expecting to grow (Exhibit 40). A 2016 American City Business Journals study of small business activity across the United States ranks the San Francisco-Oakland metropolitan area sixth and Silicon Valley ninth out of 106 metropolitan areas assessed for small-business vitality.
Looking forward, taking measured steps to improve the transparency and efficiency of the state and regional business environment will be important to achieving the Bay Area’s full growth potential.
36
Promise and Perils of an Accelerated Economy
INVESTING TO SUSTAIN SUCCESSMost of the Bay Area’s current challenges are a product of its extraordinary success and reflect a level of activity and opportunity most regions of the country or of the world could only wish for. The region has built a reputation as the world’s leading center for technology, innovation, and entrepreneurship, with a critical mass that continues to attract talent, companies, and investment.
We should not take this success for granted. Instead, the region must continue to reinvest in the assets that have made it great and that are a precondition to sustained long-term growth and a high quality of life: a skilled and educated workforce, housing where they can live, and infrastructure that provides mobility.
Economies inevitably go through cycles, and at some point the current pace of growth will slow or reverse. In the past, the Bay Area has been resilient in the face of these downturns; future success will depend, however, on meeting both new and old challenges. As the complexity of global competition and of regional needs grows, the Bay Area must increasingly look to regional solutions and strategies to identify key priorities and act on them. If we think and invest strategically, the Bay Area can maintain its current status as a national and global economic leader well into the future.
The region must continue to reinvest in the assets that have made it great and that are a precondition to sustained long-term growth and a high quality of life: a skilled and educated workforce, housing where they can live, and infrastructure that provides mobility.

Bay Area Council Economic Institute353 Sacramento Street, Suite 1000, San Francisco, CA 94111
Phone: (415) 981-7117 | Fax: (415) 981-6408
www.bayareaeconomy.org | @bayareaeconomy | [email protected]