project selection and portfolio
DESCRIPTION
Project Selection and Portfolio Project Selection and PortfolioTRANSCRIPT

70
Project Selection and PortfolioManagement
Chapter Outline
PROJECT PROFILEProject Selection Procedures: A Cross-Industry Sampler
INTRODUCTION
3.1 PROJECT SELECTION
3.2 APPROACHES TO PROJECT SCREENING AND SELECTIONMethod One: Checklist ModelMethod Two: Simplified Scoring ModelsLimitations of Scoring ModelsMethod Three: The Analytical Hierarchy ProcessMethod Four: Profile Models
3.3 FINANCIAL MODELSPayback PeriodNet Present ValueDiscounted PaybackInternal Rate of ReturnOptions ModelsChoosing a Project Selection Approach
PROJECT PROFILEProject Selection and Screening at GE: The Tollgate Process
3.4 PROJECT PORTFOLIO MANAGEMENTObjectives and InitiativesDeveloping a Proactive PortfolioKeys to Successful Project Portfolio ManagementProblems in Implementing Portfolio Management
SummaryKey TermsSolved ProblemsDiscussion QuestionsProblemsCase Study 3.1 Keflavik Paper Company
C H A P T E R
3000200010270649984
Project Management: Achieving Competitive Advantage, Second Edition, by Jeffrey K. Pinto. Published by Prentice Hall. Copyright © 2010 by Pearson Education, Inc.

Project Profile 71
Case Study 3.2 Project Selection at Nova Western, Inc.Internet ExercisesNotes
Chapter ObjectivesAfter completing this chapter you should be able to:
1. Explain six criteria for a useful project-selection/screening model.
2. Understand how to employ checklists and simple scoring models to select projects.
3. Use more sophisticated scoring models, such as the Analytical Hierarchy Process.
4. Learn how to use financial concepts, such as the efficient frontier and risk/return models.
5. Employ financial analyses and options analysis to evaluate the potential for new project investments.
6. Recognize the challenges that arise in maintaining an optimal project portfolio for an organization.
7. Understand the three keys to successful project portfolio management.
PROJECT PROFILE
Project Selection Procedures: A Cross-Industry Sampler
The art and science of selecting projects is one that organizations take extremely seriously. Firms in a variety ofindustries have developed highly sophisticated methods for project screening and selection to ensure that theprojects they choose to fund offer the best promise of success. As part of this screening process, organizationsoften evolve their own particular methods, based on technical concerns, available data, and corporate culture andpreferences. This list gives you a sense of the lengths to which some organizations go with project selection:
• Hoechst AG, a pharmaceutical firm, uses a scoring portfolio model with 19 questions in five major categories whenrating project opportunities. The five categories include: probability of technical success, probability of commercialsuccess, reward to the company, business strategy fit, and strategic leverage (ability of the project to employ andelevate company resources and skills). Within each of these factors are a number of specific questions, which arescored on a 1 to 10 scale by management.
• The Royal Bank of Canada has developed a scoring model to rate its project opportunities. The criteria for theportfolio scoring include project importance (strategic importance, magnitude of impact, and economic benefits)and ease of doing (cost of development, project complexity, and resource availability). Expected annualexpenditure and total project spending are then added to this rank-ordered list to prioritize the project options.Decision rules are used (e.g., projects of low importance that are difficult to execute get a “no go” rating).
• The Weyerhaeuser corporate R&D program has put processes in place to align and prioritize R&D projects. Theprogram has three types of activities: technology assessment (changes in external environment and impact tothe company); research (building knowledge bases and competencies in core technical areas); and development(development of specific commercial opportunities). Four key inputs are considered when establishing priorities:significant changes in the external environment; long-term future needs of lead customers; business strategies,priorities, and technology needs; and corporate strategic direction.
• Mobil Chemical uses six categories of projects to determine the right balance of projects that will enter its portfolio:(1) cost reductions and process improvements; (2) product improvements, product modifications, and customersatisfaction; (3) new products; (4) new platform projects and fundamental/breakthrough research projects; (5) plantsupport; and (6) technical support for customers. Senior management reviews all project proposals and determinesthe division of capital funding across these six project types. One of the key decision variables involves a comparisonof “what is” with “what should be.”
• At 3M’s Traffic Control Materials Division, during project screening and selection, management uses a projectviability chart to score project alternatives. As part of the profile and scoring exercise, personnel must addresshow the project accomplishes strategic project objectives and critical business issues affecting a specific groupwithin the target market. Projected project return on investment is always counterbalanced with riskiness of theproject option.
• Exxon Chemical’s management begins evaluating all new project proposals in light of the business unit’s strategyand strategic priorities. Target spending is decided according to the overall project mix portfolio. As the yearprogresses, all projects are reprioritized using a scoring model. As significant differences between projected andactual spending are uncovered, the top management group makes adjustments for next year’s portfolio.1
0002
0001
0270
6499
84
Project Management: Achieving Competitive Advantage, Second Edition, by Jeffrey K. Pinto. Published by Prentice Hall. Copyright © 2010 by Pearson Education, Inc.

72 Chapter 3 • Project Selection and Portfolio Management
INTRODUCTION
All organizations must select the projects they decide to pursue from among numerous opportunities. Whatcriteria determine which projects should be supported? Obviously, this is no simple decision. The conse-quences of poor decisions can be enormously expensive. Recent research suggests that in the realm of infor-mation technology (IT), companies squander over $50 billion a year on projects that are created but neverused by their intended clients. How do we make the most reasonable choices in selecting projects? Whatkind of information should we collect? Should decisions be based strictly on financial analysis, or shouldother criteria be considered? In this chapter, we will try to answer such questions as we take a closer look atthe process of project selection.
We will examine a number of different approaches for evaluating and selecting potential projects. Thevarious methods for project selection run along a continuum from highly qualitative, or judgment-based,approaches to those that rely on quantitative analysis. Of course, each approach has benefits and drawbacks,which must be considered in turn.
We will also discuss a number of issues related to the management of a project portfolio—the set ofprojects that an organization is undertaking at any given time. For example, Rubbermaid, Inc. routinelyundertakes hundreds of new product development projects simultaneously, always searching for opportu-nities with strong commercial prospects. When a firm is pursuing multiple projects, the challenges ofstrategic decision making, resource management, scheduling, and operational control are magnified.
3.1 PROJECT SELECTION
Firms are literally bombarded with opportunities, but of course, no organization enjoys infinite resources to beable to pursue every opportunity that presents itself. Choices must be made, and to best ensure that they selectthe most viable projects, many managers develop priority systems—guidelines for balancing the opportunitiesand costs entailed by each alternative. The goal is to balance the competing demands of time and advantage.2
The pressures of time and money affect most major decisions, and decisions are usually more successful whenthey are made in a timely and efficient manner. For example, if your firm’s sales department recognizes a com-mercial opportunity it can exploit, you need to generate alternative projects quickly to capitalize on theprospect. Time wasted is generally opportunity lost. On the other hand, you need to be careful: You want to besure that, at least as far as possible, you are making the best choice among your options. Thus organizationaldecision makers develop guidelines—selection models that permit them to save time and money while maxi-mizing the likelihood of success.
A number of decision models are available to managers responsible for evaluating and selecting poten-tial projects. As you will see, they run the gamut from qualitative and simple to quantitative and complex. Allfirms, however, try to develop a screening model (or set of models) that will allow them to make the bestchoices among alternatives within the usual constraints of time and money.
Suppose you were interested in developing a model that allowed you to effectively screen project alter-natives. How might you ensure that the model was capable of picking potential “winners” from the large setof possible project choices? After much consideration, you decide to narrow the focus for your screeningmodel and create one that will allow you to select only projects that have high potential payoffs. All otherissues are ignored in favor of the sole criterion of commercial profitability. The question is: Would such ascreening model be useful? Souder3 identifies five important issues that managers should consider when eval-uating screening models:
1. Realism: An effective model must reflect organizational objectives, including a firm’s strategic goals andmission. Criteria must also be reasonable in light of such constraints on resources as money and personnel.Finally, the model must take into account both commercial risks and technical risks, including perform-ance, cost, and time. That is: Will the project work as intended? Can we keep to the original budget or isthere a high potential for escalating costs? Is there a strong risk of significant schedule slippage?
2. Capability: A model should be flexible enough to respond to changes in the conditions under whichprojects are carried out. For example, the model should allow the company to compare different types ofprojects (long-term versus short-term projects, projects of different technologies or capabilities, projectswith different commercial objectives). It should be robust enough to accommodate new criteria andconstraints, suggesting that the screening model must allow the company to use it as widely as possiblein order to cover the greatest possible range of project types.
000200010270649984
Project Management: Achieving Competitive Advantage, Second Edition, by Jeffrey K. Pinto. Published by Prentice Hall. Copyright © 2010 by Pearson Education, Inc.

3. Flexibility: The model should be easily modified if trial applications require changes. It must, forexample, allow for adjustments due to changes in exchange rates, tax laws, building codes, and soforth.
4. Ease of Use: A model must be simple enough to be used by people in all areas of the organization,both those in specific project roles and those in related functional positions. Further, the screeningmodel that is applied, the choices made for project selection, and the reasons for those choices shouldbe clear and easily understood by organizational members. The model should also be timely: It shouldgenerate the screening information rapidly, and people should be able to assimilate that informationwithout any special training or skills.
5. Cost: The screening model should be cost effective. A selection approach that is expensive to use interms of either time or money is likely to have the worst possible effect: causing organizational membersto avoid using it because of the excessive cost of employing the screening model. The cost of obtainingselection information and generating optimal results should be low enough to encourage use of themodels rather than diminish their applicability.
Let’s add a sixth criterion for a successful selection model:
6. Comparability: It must be broad enough to be applied to multiple projects. If a model is too narrowlyfocused, it may be useless in comparing potential projects or foster biases toward some over others.A useful model must support general comparisons of project alternatives.
Project selection models come in two general classes: numeric and nonnumeric.4 Numeric models seekto use numbers as inputs for the decision process involved in selecting projects. These values can be derivedeither objectively or subjectively; that is, we may employ objective, external values (“The bridge’s construc-tion will require 800 cubic yards of cement”) or subjective, internal values (“You will need to hire two codecheckers to finish the software development within eight weeks”). Neither of these two input alternatives isnecessarily wrong: An expert’s opinion on an issue may be subjective but very accurate. On the other hand, anincorrectly calibrated surveyor’s level can give objective but wrong data. The key is to remember that mostselection processes for project screening involve a combination of subjective and objective data assessmentand decision making. Nonnumeric models, on the other hand, do not employ numbers at decision inputs,relying instead on other data.
Companies spend great amounts of time and effort trying to make the best project selection decisionspossible. These decisions are typically made with regard for the overall objectives that the company’s seniormanagement staff have developed and promoted based on their strategic plan. These objectives can be quitecomplex and reflect a number of external factors that can affect a firm’s operations. For example, suppose thenew head of Sylvania’s Lighting Division mandated that the strategic objectives of the organization were to besales growth at all costs. Any new project opportunity would be evaluated against this key strategic impera-tive. Thus, a project offering the potential for opening new markets might be viewed more favorably than acompeting project that promised a higher potential rate of return.
The list of factors that can be considered when evaluating project alternatives is enormous (see Table 3.1).In general terms, we may look at risk and commercial factors, internal operating issues, and other factors.
Table 3.1 is only a partial list of the various elements that a company must address when consideringnew project alternatives. Although the list can be long, in reality the strategic direction emphasized by topmanagement often highlights certain criteria over others. In fact, if we apply Pareto’s 80/20 principle, whichstates that a few issues (20%) are vital and many (80%) are trivial, it may be fairly argued that for many proj-ects, less than 20% of all possible decision criteria account for over 80% of the decision of whether or not topursue the project.
This being said, we should also reflect on two final points regarding the use of any decision-makingapproach to project selection. First, the most complete model in the world is still only a partial reflection oforganizational reality. The potential list of inputs into any project selection decision is literally limitless; somuch so, in fact, that we must recognize this truth before exploring project selection lest we erroneouslyassume that it is possible, given enough time and effort, to identify all relevant issues that play a role. Second,embedded in every decision model are both objective and subjective factors. We may form opinions basedon objective data; we may also derive complex decision models from subjective inputs. It is worthwhileacknowledging that there exists a place for both subjective and objective inputs and decisions in any usefulscreening model.
3.1 Project Selection 73
0002
0001
0270
6499
84
Project Management: Achieving Competitive Advantage, Second Edition, by Jeffrey K. Pinto. Published by Prentice Hall. Copyright © 2010 by Pearson Education, Inc.

74 Chapter 3 • Project Selection and Portfolio Management
TABLE 3.1 Issues in Project Screening and Selection
1. Risk—Factors that reflect elements of unpredictability to the firm, including:a. Technical risk—risks due to the development of new or untested technologiesb. Financial risk—risks from the financial exposure caused by investing in the projectc. Safety risk—risks to the well-being of users or developers of the projectd. Quality risk—risks to the firm’s goodwill or reputation due to the quality of the completed projecte. Legal exposure—potential for lawsuits or legal obligation
2. Commercial—Factors that reflect the market potential of the project, including:a. Expected return on investmentb. Payback periodc. Potential market shared. Long-term market dominancee. Initial cash outlayf. Ability to generate future business/new markets
3. Internal operating issues—Factors that refer to the impact of the project on internal operations of thefirm, including:a. Need to develop/train employeesb. Change in workforce size or compositionc. Change in physical environmentd. Change in manufacturing or service operations resulting from the project
4. Additional factorsa. Patent protectionb. Impact on company’s imagec. Strategic fit
3.2 APPROACHES TO PROJECT SCREENING AND SELECTION
A project-screening model that generates useful information for project choices in a timely and useful fashion atan acceptable cost can serve as a valuable tool in helping an organization make optimal choices among numerousalternatives.5 With these criteria in mind, let’s consider some of the more common project-selection techniques.
Method One: Checklist Model
The simplest method of project screening and selection is developing a checklist, or a list of criteria that pertainto our choice of projects, and then applying them to different possible projects. Let’s say, for example, that in ourcompany, the key selection criteria are cost and speed to market. Because of our strategic competitive model andthe industry we are in, we favor low-cost projects that can be brought to the marketplace within one year. Wewould screen each possible project against these two criteria and select the project that best satisfies them. Butdepending on the type and size of our possible projects, we may have to consider literally dozens of relevant cri-teria. In deciding among several new product development opportunities, a firm must weigh a variety of issues,including the following:
• Cost of development: What is a reasonable cost estimate?• Potential return on investment: What kind of return can we expect? What is the likely payback period?• Riskiness of the new venture: Does the project entail the need to create new-generation technology?
How risky is the venture in terms of achieving our anticipated specifications?• Stability of the development process: Are both the parent organization and the project team stable?
Can we expect this project to face funding cuts or the loss of key personnel, including senior manage-ment sponsors?
• Governmental or stakeholder interference: Is the project subject to levels of governmental oversightthat could potentially interfere with its development? Might other stakeholders oppose the project andattempt to block completion? For example, environmental groups commonly referred to as “intervenor”
000200010270649984
Project Management: Achieving Competitive Advantage, Second Edition, by Jeffrey K. Pinto. Published by Prentice Hall. Copyright © 2010 by Pearson Education, Inc.

stakeholders have a long history of opposing natural resource development projects and work in opposi-tion to project objectives.6
• Product durability and future market potential: Is this project a one-shot opportunity, or could it be theforerunner of future opportunities? A software development firm may, for example, develop an applicationfor a client in hopes that successful performance on this project will lead to future business. On the otherhand, they may perceive that the project is simply a one-time opportunity with little potential for futurework with the customer.
This is just a partial list of criteria that may be relevant when we are selecting among project alterna-tives. A checklist approach to the evaluation of project opportunities is a fairly simple device for recordingopinions and encouraging discussion. Thus, checklists may best be used in a consensus-group setting, as amethod for initiating conversation, stimulating discussion and the exchange of opinions, and highlighting thegroup’s priorities.
EXAMPLE 3.1 Checklist
Let’s assume that SAP Corporation, a leader in the business applications software industry, is interested indeveloping a new application package for inventory management and shipping control. It is trying to decidewhich project to select from a set of four potential alternatives. Based on past commercial experiences, thecompany feels that the most important selection criteria for its choice are: cost, profit potential, time tomarket, and development risks. Table 3.2 shows a simple checklist model with only four project choices andthe four decision criteria. In addition to developing the decision criteria, we create evaluative descriptors thatreflect how well the project alternatives correspond to our key selection criteria. We evaluate each criterion(which is rated high, medium, or low) in order to see which project accumulates the most positive checks—and may thus be regarded as the optimal choice.
SOLUTION
Based on this analysis, Project Gamma is the best alternative in terms of maximizing our key criteria—cost,profit potential, time to market, and development risks.
TABLE 3.2 Simplified Checklist Model for Project Selection
Performance on Criteria
Project Criteria High Medium Low
Project Alpha Cost X
Profit potential X
Time to market X
Development risks X
Project Beta Cost X
Profit potential X
Time to market X
Development risks X
Project Gamma Cost X
Profit potential X
Time to market X
Development risks X
Project Delta Cost X
Profit potential X
Time to market X
Development risks X
3.2 Approaches to Project Screening and Selection 75
0002
0001
0270
6499
84
Project Management: Achieving Competitive Advantage, Second Edition, by Jeffrey K. Pinto. Published by Prentice Hall. Copyright © 2010 by Pearson Education, Inc.

TABLE 3.3 Simple Scoring Model
(A) (B) (A) × (B)
Project CriteriaImportance
Weight ScoreWeighted
Score
Project Alpha
Cost 1 3 3
Profit potential 2 1 2
Development risk 2 1 2
Time to market 3 2 6
Total Score 13
Project Beta
Cost 1 2 2
Profit potential 2 2 4
Development risk 2 2 4
Time to market 3 3 9
Total Score 19
76 Chapter 3 • Project Selection and Portfolio Management
Of course, the flaws in such a model include the subjective nature of such ratings as high, medium, orlow. Such terms are inexact and subject to misinterpretation or misunderstanding. Checklist screeningmodels also fail to resolve trade-off issues. What if our criteria are differentially weighted—that is, what ifsome criteria are more important than others? How will relative, or weighted, importance affect our finaldecision? Let’s say, for instance, that we regard time to market as our paramount criterion. Is Project Gamma,which rates as low on this criterion, still “better” than Project Beta or Delta, both of which rate high on timeto market though lower on other, less important criteria? Are we willing to make a trade-off, accepting lowtime to market in order to get the highest benefits in cost, profit potential, and development risks?
Because the simple checklist model does not deal satisfactorily with such questions, let’s turn next to amore complex screening model in which we distinguish more important from less important criteria byassigning each criterion a simple weight.
Method Two: Simplified Scoring Models
In the simplified scoring model, each criterion is ranked according to its relative importance. Our choice ofprojects will thus reflect our desire to maximize the impact of certain criteria on our decision. In order toscore our simplified checklist, we assign a specific weight to each of our four criteria:
Now let’s reconsider the decision that we made using the basic checklist approach illustrated in Table 3.2.
EXAMPLE 3.2 Scoring Models
Using the criterion weighting values we developed above, SAP Corporation is attempting to determine theoptimal project to fund. As you can see in Table 3.3, although adding a scoring component to our simplechecklist complicates our decision, it also gives us a more precise screening model—one that more closelyreflects our desire to emphasize certain criteria over others.
Criterion Importance Weight
Time to Market 3
Profit Potential 2
Development Risks 2
Cost 1
000200010270649984
Project Management: Achieving Competitive Advantage, Second Edition, by Jeffrey K. Pinto. Published by Prentice Hall. Copyright © 2010 by Pearson Education, Inc.

SOLUTION
In Table 3.3, the numbers in the column labeled Importance Weight specify the numerical values that we haveassigned to each criterion: Time to Market always receives a value of 3, profit potential a value of 2, develop-ment risk a value of 2, and cost a value of 1. We then assign relative values to each of our four dimensions.
The numbers in the column labeled Score replace the X’s of Table 3.2 with their assigned score values:
(High = 3Medium = 2Low = 1)
In Project Alpha, for example, the High rating given Cost becomes a 3 in Table 3.3 because High is here valuedat 3. Likewise, the Medium rating given Time to Market in Table 3.2 becomes a 2. But notice what happenswhen we calculate the numbers in the column labeled Weighted Score. When we multiply the numerical valueof Cost (1) by its rating of High (3), we get a Weighted Score of 3. But when we multiply the numerical valueof Time to Market (3) by its rating of Medium (2), we get a Weighted Score of 6. We add up the total WeightedScores for each project, and according to Table 3.3, Project Beta (with a total of 19) is the best alternative, com-pared to the other options: Project Alpha (with a total of 13), Project Gamma (with a total of 18), and ProjectDelta (with a total of 16).
Thus the simple scoring model consists of the following steps:
• Assign importance weights to each criterion: Develop logic for differentiating among various levels ofimportance and devise a system for assigning appropriate weights to each criterion. Relying on collectivegroup judgment may help to validate the reasons for determining importance levels. The team may alsodesignate some criteria as “must” items. Safety concerns, for example, may be stipulated as nonnegotiable.In other words, all projects must achieve an acceptable safety level or they will not be considered further.
• Assign score values to each criterion in terms of its rating (High = 3, Medium = 2, Low = 1): The logic ofassigning score values is often an issue of scoring sensitivity—of making differences in scores distinct. Someteams, for example, prefer to widen the range of possible values—say, by using a 1-to-7 scale instead of a1-to-3 scale in order to ensure a clearer distinction among scores and, therefore, among project choices.Such decisions will vary according to the number of criteria being applied and, perhaps, by team members’experience with the accuracy of outcomes produced by a given approach to screening and selection.
• Multiply importance weights by scores to arrive at a weighted score for each criterion: The weightedscore reflects both the value that the team gives each criterion and the ratings that the team gives eachcriterion as an output of the project.
• Add the weighted scores to arrive at an overall project score: The final score for each project becomesthe sum of all its weighted criteria.
3.2 Approaches to Project Screening and Selection 77
Project Gamma
Cost 1 3 3
Profit potential 2 3 6
Development risk 2 3 6
Time to market 3 1 3
Total Score 18
Project Delta
Cost 1 1 1
Profit potential 2 1 2
Development risk 2 2 4
Time to market 3 3 9
Total Score 16
(A) (B) (A) × (B)Importance Weighted
Project Criteria Weight Score Score
TABLE 3.3 Continued
0002
0001
0270
6499
84
Project Management: Achieving Competitive Advantage, Second Edition, by Jeffrey K. Pinto. Published by Prentice Hall. Copyright © 2010 by Pearson Education, Inc.

78 Chapter 3 • Project Selection and Portfolio Management
The pharmaceuticals company Hoechst Marion Roussel uses a scoring model for selecting projects thatidentifies not only five main criteria—reward, business strategy fit, strategic leverage, probability of commer-cial success, and probability of technical success—but also a number of more specific subcriteria. Each ofthese 19 subcriteria is scored on a scale of 1 to 10. The score for each criterion is then calculated by averagingthe scores for each criterion. The final project score is determined by adding the average score of each of thefive subcategories. Hoechst has had great success with this scoring model, both in setting project prioritiesand in making go/no-go decisions.7
The simple scoring model has some useful advantages as a project selection device. First, it is easy to useit to tie critical strategic goals for the company to various project alternatives. In the case of the pharmaceuti-cal company Hoechst, the company has assigned several categories to strategic goals for its project options,including Business strategy fit and Strategic leverage. These strategic goals become a critical hurdle for all newproject alternatives. Second, the simple scoring model is easy to comprehend and use. With a checklist of keycriteria, evaluation options (high, medium, and low), and attendant scores, top managers can quickly grasphow to employ this technique.
Limitations of Scoring Models
The simple scoring model illustrated here is an abbreviated and unsophisticated version of the weighted-scoring approach. In general, scoring models try to impose some structure on the decision-making processwhile, at the same time, combining multiple criteria.
Most scoring models, however, share some important limitations. A scale from 1 to 3 may be intuitivelyappealing and easy to apply and understand, but it is not very accurate. From the perspective of mathematicalscaling, it is simply wrong to treat evaluations on such a scale as real numbers that can be multiplied andsummed. If 3 means High and 2 means Medium, we know that 3 is better than 2, but we do not know by howmuch. Furthermore, we cannot assume that the difference between 3 and 2 is the same as the differencebetween 2 and 1. Thus in Table 3.3, if the score for Project Alpha is 13 and 19 is the score for Project Beta, maywe assume that Beta is 46 percent better than Alpha? Unfortunately, no. Critics of scoring models argue thattheir ease of use may blind novice users to the sometimes-false assumptions that underlie them.
From a managerial perspective, another drawback of scoring models is the fact that they depend onthe relevance of the selected criteria and the accuracy of the weight given them. In other words, they do notensure that there is a reasonable link between the selected and weighted criteria and the business objectivesthat prompted the project in the first place.
Here’s an example. As a means of selecting projects, the Information Systems steering committee of alarge bank adopted three criteria: contribution to quality, financial performance, and service. The bank’s strat-egy was focused on customer retention, but the criteria selected by the committee did not reflect this fact. Asa result, a project aimed at improving service to potential new markets might score high on service eventhough it would not serve existing customers (the people whose business the bank wants to retain). Note, too,that the criteria of quality and service could overlap, leading managers to double-count and overestimate thevalue of some factors.8 Thus, the bank employed a project selection approach that neither achieved its desiredends nor matched overall strategic goals.
Method Three: The Analytical Hierarchy Process
The Analytical Hierarchy Process (AHP) was developed by Dr. Thomas Saaty9 to address many of the tech-nical and managerial problems frequently associated with decision making through scoring models. Anincreasingly popular method for effective project selection, the AHP is a four-step process.
STRUCTURING THE HIERARCHY OF CRITERIA The first step consists of constructing a hierarchy of criteriaand subcriteria. Let’s assume, for example, that a firm’s IT steering committee has selected three criteria forevaluating project alternatives: (1) Financial benefits, (2) Contribution to strategy, and (3) Contribution to ITinfrastructure. The Financial benefits criterion, which focuses on the tangible benefits of the project, is furthersubdivided into long-term and short-term benefits. Contribution to strategy, an intangible factor, is subdividedinto three subcriteria: (a) Increasing market share for product X; (b) Retaining existing customers for product Y;and (c) Improving cost management.
Table 3.4 is a representational breakdown of all these criteria. Note that subdividing relevant criteriainto a meaningful hierarchy gives managers a rational method for sorting among and ordering priorities.Higher-order challenges, such as Contribution to strategy, can be broken down into discrete sets of supporting
000200010270649984
Project Management: Achieving Competitive Advantage, Second Edition, by Jeffrey K. Pinto. Published by Prentice Hall. Copyright © 2010 by Pearson Education, Inc.

requirements, including market share, customer retention, and cost management, thus building a hierarchy ofalternatives that simplifies matters. Because the hierarchy can reflect the structure of organizational strategyand critical success factors, it also provides a way to select and justify projects according to their consistencywith business objectives.10 This illustrates how we can use meaningful strategic issues and critical factors toestablish logic for both the types of selection criteria and their relative weighting.
Recently, a large U.S. company used the AHP to rank more than a hundred project proposals worthmillions of dollars. Because the first step in using the AHP is to establish clear criteria for selection, 10 managersfrom assorted disciplines, including finance, marketing, management information systems, and operations,spent a full day establishing the hierarchy of criteria. Their challenge was to determine the key success criteriathat should be used to guide project selection, particularly as these diverse criteria related to each other (relativeweighting). They found that, in addition to clearly defining and developing the criteria for evaluating projects,the process also produced a more coherent and unified vision of organizational strategy.
ALLOCATING WEIGHTS TO CRITERIA The second step in applying AHP consists of allocating weights topreviously developed criteria and, where necessary, splitting overall criterion weight among subcriteria. Mianand Dai11 and others have recommended the so-called pairwise comparison approach to weighting, inwhich every criterion is compared with every other criterion. This procedure, argue the researchers, permitsmore accurate weighting because it allows managers to focus on a series of relatively simple exchanges—namely, two criteria at a time.
The simplified hierarchy in Figure 3.1 shows the breakdown of criterion weights across the same threemajor criteria that we used in Table 3.4. As Figure 3.3 shows, Financial benefits received a weighting value of52%, which was split between Short-term benefits (30%) and Long-term benefits (70%). This configurationmeans that long-term financial benefits receives an overall weighting of (0.52) × (0.7) = 36.4%.
The hierarchical allocation of criteria and splitting of weights resolves the problem of double countingin scoring models. In these models, criteria such as Service, Quality, and Customer satisfaction may be eitherseparate or overlapping factors, depending on the objectives of the organization. As a result, too little or toomuch may be assigned to a given criterion. With AHP, however, these factors are grouped as subcriteria andshare the weight of a common higher-level criterion.
ASSIGNING NUMERICAL VALUES TO EVALUATION DIMENSIONS For our third step, once the hierarchy isestablished, we can use the pairwise comparison process to assign numerical values to the dimensions of our
3.2 Approaches to Project Screening and Selection 79
TABLE 3.4 Hierarchy of Selection Criteria Choices
First Level Second Level
1. Financial Benefits 1A: Short-term
1B: Long-term
2. Contribution to Strategy 2A: Increasing market share for product X2B: Retaining existing customers for product Y
2C: Improving cost management
3. Contribution to IT Infrastructure
FIGURE 3.1 Sample AHP with
Rankings for Salient Selection Criteria
Source: J. K. Pinto and I. Millet. 1999.Successful Information SystemImplementation: The Human Side,Second Edition, figure on page 76.Newtown Square, PA: ProjectManagement Institute. Copyright andall rights reserved. Material from thispublication has been reproduced withthe permission of PMI.
Rank Information SystemsProject Proposals
Goal(1.000)
InformationTechnology
(0.140)
Poor
Fair
Good
Very Good
Excellent
Strategy
(0.340)
Market Share
Retention
Cost Mgmt.
Short-term
Long-term
Finance
(0.520)
0002
0001
0270
6499
84
Project Management: Achieving Competitive Advantage, Second Edition, by Jeffrey K. Pinto. Published by Prentice Hall. Copyright © 2010 by Pearson Education, Inc.

Nominal
Poor 0.00000 0.000
0.050
1.000
0.500
0.300
0.150
2.00000
1.00000
0.60000
0.30000
0.10000Fair
Excellent
Total
Very Good
Good
Priority Bar Graph
FIGURE 3.2 Assigning Numerical Values to Labels
Source: J. K. Pinto and I. Millet. 1999. Successful Information SystemImplementation: The Human Side, Second Edition, figure on page 77.Newtown Square, PA: Project Management Institute. Copyright and all rightsreserved. Material from this publication has been reproduced with thepermission of PMI.
Finance
Poor1 (.000)
Fair2 (.100)
Alternatives
1 Perfect Project 1.000 Excellent Excellent Excellent Excellent Excellent Excellent
Excellent
Excellent
Excellent
Excellent
Excellent
Excellent
Excellent
Very Good Very Good Very Good Very Good Very Good Very Good
Very GoodFairPoor
Good
Good
Good
Good
Good
Good
Good
Good
0.762
0.538
0.284
0.600
Aligned
Not Aligned
All Very Good
Mixed
2
3
4
5
6
7
89
10
Total
Finance
Short-Term Long-Term
Strategy
Market Share Retention CostManagement
Technology
.1400.0816.1564.1020.3640.1560
Good3 (.300)
Very Good4 (.600)
Excellent5 (1.000)
Short-term
FIGURE 3.3 The Project Rating Spreadsheet
Source: J. K. Pinto and I. Millet. 1999. Successful Information SystemImplementation: The Human Side, Second Edition, figure on page 78.Newtown Square, PA: Project Management Institute. Copyright and all rightsreserved. Material from this publication has been reproduced with thepermission of PMI.
80 Chapter 3 • Project Selection and Portfolio Management
evaluation scale. Figure 3.2 is an evaluation scale with five dimensions: Poor, Fair, Good, Very Good, andExcellent. Figure 3.2 also shows that for purposes of illustration, we have assigned the values of 0.0, 0.10, 0.30,0.60, and 1.00, respectively, to these dimensions. Naturally, we can change these values as necessary. For exam-ple, if a company wants to indicate a greater discrepancy between Poor and Fair, managers may increase therange between these two dimensions.
By adjusting values to suit specific purposes, managers also avoid the fallacy of assuming that the differ-ences between numbers on a scale of, say, 1 to 5 are equal—that is, assuming that the difference between 4 and5 is the same as the difference between 3 and 4. With the AHP approach, the “best” outcome receives a perfectscore of 1.00 and all other values represent some proportion relative to that score.
When necessary, project managers are encouraged to apply different scales for each criterion. Note, forexample, that Figure 3.2 used scale points ranging from Poor to Excellent. Suppose, however, that we wereinterviewing a candidate for our project team and one of the criterion items was “Education Level.” Clearly,using a scale ranging from Poor to Excellent makes no sense, so we would adjust the scales to make themmeaningful; for example, using levels such as “High School,” “Some College,” “College Graduate,” and soforth. Allocating weights across dimensions gives us a firmer understanding of both our goals and the meth-ods by which we are comparing opportunities to achieve them.
EVALUATING PROJECT PROPOSALS In our final step, we multiply the numeric evaluation of the project bythe weights assigned to the evaluation criteria and then add up the results for all criteria. Figure 3.3 shows
000200010270649984
Project Management: Achieving Competitive Advantage, Second Edition, by Jeffrey K. Pinto. Published by Prentice Hall. Copyright © 2010 by Pearson Education, Inc.

how five potential projects might be evaluated by means of an AHP program offered by Expert Choice, amaker of decision software.12 Here’s how to read the key features of the spreadsheet:
• The second row specifies the value assigned to each of five possible ratings (from Poor = 1 = .000 toExcellent = 5 = 1.000).
• The fourth row specifies the five decision criteria and their relative weights (Finance/Short-Term = .1560,Strategy/Cost Management = .0816, and so forth). (Note that three criteria have been broken down intosix subcriteria.)
• The second column lists the five projects (Perfect Project, Aligned, etc.).• The column labeled “Total” gives a value for each alternative. This number is found by multiplying each
evaluation by the appropriate criterion weight and summing the results across all criteria evaluations.
To illustrate how the calculations are derived, let us take the Aligned project as an example. Rememberthat each rating (excellent, very good, good, etc.) carries with it a numerical score. These scores, when multi-plied by the evaluation criteria, yield:
The Perfect Project, for example, was rated Excellent on all six dimensions and thus received a score of1.000. Note, too, the evaluations of the Aligned and Not Aligned project choices. Although both projectsreceived an equal number of Excellent and Good rankings, the Aligned project was clearly preferable because itwas rated higher on criteria viewed as more important and thus more heavily weighted.
Unlike the results of typical scoring models, the AHP scores are significant. The Aligned project, forexample, which scored 0.762, is almost three times better than the Mixed project, with its score of 0.284. Thisfeature—the ability to quantify superior project alternatives—allows project managers to use AHP scores asinput to other calculations. We might, for example, sort projects by the ratios of AHP scores to total theirdevelopment costs. Let’s say that based on this ratio, we find that the Not Aligned project is much cheaper toinitiate than the Aligned project. This finding may suggest that from a cost/benefit perspective, the Not Alignedproject offers a better alternative than the Aligned project.
The AHP methodology can also dramatically improve the process of developing project proposals. Infirms that have incorporated AHP analysis, new project proposals must contain, as part of their core infor-mation, a sophisticated AHP breakdown listing the proposed project, alternatives, and projected outcomes.The Analytical Hierarchy Process offers a real advantage over traditional scoring models, primarily becauseit reduces many of the technical and managerial problems that plague such approaches.
The AHP does have some limitations, however. First, current research suggests that the model does notadequately account for “negative utility”; that is, the fact that certain choice options do not contribute posi-tively to the decision goals but actually lead to negative results. For example, suppose that your companyidentified a strong project option that carried a prohibitively expensive price tag. As a result, selecting thisproject is really not an option because it would be just too high an investment. However, using the AHP, youwould first need to weigh all positive elements, develop your screening score, and then compare this scoreagainst negative aspects, such as cost. The result can lead to bias in the project scoring calculations.13 A secondlimitation is that the AHP requires that all criteria be fully exposed and accounted for at the beginning of theselection process. Powerful members of the organization with political agendas or pet projects they wish topursue may resist such an open selection process.
Method Four: Profile Models
Profile models allow managers to plot risk/return options for various alternatives and then select the projectthat maximizes return while staying within a certain range of minimum acceptable risk. “Risk,” of course, is asubjective assessment: That is to say, it may be difficult to reach overall agreement on the level of risk associ-ated with a given project. Nevertheless, the profile model offers another way of evaluating, screening, andcomparing projects.14
Let us return to our example of project screening at SAP Corporation. Suppose that instead of the fourproject alternatives for the new software project we discussed earlier, they had identified six candidates fordevelopment. For simplicity’s sake, they chose to focus on the two criteria of risk and reward.
(.1560)(.3) + (.3640)(1.0) + (.1020)(.3) + (.1564)(1.0) + (.0816)(.3) + (.1400)(1.0) = .762
3.2 Approaches to Project Screening and Selection 81
0002
0001
0270
6499
84
Project Management: Achieving Competitive Advantage, Second Edition, by Jeffrey K. Pinto. Published by Prentice Hall. Copyright © 2010 by Pearson Education, Inc.

MaximumDesired Risk
Efficient Frontier
Ris
k
MinimumDesired Return
X2
X3
X1
X5X4
X6
Return
FIGURE 3.4 Profile Model
Source: Evans and Souder (1998), “Methods for Selecting and Evaluating Projects,” inPinto (Ed.), The Project Management Institute Project Management Handbook. SanFrancisco, CA: Jossey-Bass Publishers. Reprinted with permission of John Wiley & Sons, Inc.
82 Chapter 3 • Project Selection and Portfolio Management
In Figure 3.4, the six project alternatives are plotted on a graph showing perceived Risk on the y-axis andpotential Return on the x-axis. Because of the cost of capital to the firm, we will specify some minimum desiredrate of return. All projects will be assigned some risk factor value and be plotted relative to the maximum riskthat the firm is willing to assume. Figure 3.4, therefore, graphically represents each of our six alternatives on aprofile model. (Risk values have been created here simply for illustrative purposes.) Consider Project X4 forexample. In our example, SAP can employ a variety of measures to assess the likely return offered by this proj-ect, including discounted cash flow analysis and internal rate of return expectations. Likewise, it is increasinglycommon for firms to quantify their risk assessment of various projects, enabling us to plot them along the y-axis. The key lies in employing identical evaluation criteria and quantification approaches across all projectsto be profiled on the graph. Clearly, when project risks are unique or we have no way of comparing the relativerisks from project to project, it is impossible to accurately plot project alternatives.
We see that Project X2 and Project X3 have similar expected rates of return. Project X3, however,represents a better selection choice. Why? Because SAP can achieve the same rate of return with ProjectX3 as it can with Project X2 but with less risk. Likewise, Project X5 is a superior choice to X4: Althoughthey have similar risk levels, X5 offers greater return as an investment. Finally, while Project X6 offers themost potential return, it does so at the highest level of risk.
The profile model makes use of a concept most widely associated with financial management andinvestment analysis—the efficient frontier. In project management, the efficient frontier is the set of projectportfolio options that offers either a maximum return for every given level of risk or the minimum risk forevery level of return.15 When we look at the profile model in Figure 3.4, we note that certain options (X1, X3,X5, X6) lie along an imaginary line balancing optimal risk and return combinations. Others (X2 and X4),however, are less desirable alternatives and would therefore be considered inferior choices. The efficient fron-tier serves as a decision-making guide by establishing the threshold level of risk/return options that all futureproject choices must be evaluated against.
One advantage of the profile model is that it offers another alternative to compare project alternatives,this time in terms of the risk/return trade-off. It is sometimes difficult to evaluate and compare projects onthe basis of scoring models or other qualitative approaches. The profile model, however, gives managers achance to map out potential returns while considering the risk that accompanies each choice. Thus profilemodels give us another method for eliminating alternatives, either because they threaten too much risk orpromise too little return. On the other hand, profile models also have disadvantages:
1. They limit decision criteria to just two—risk and return. Although an array of issues, including safety,quality, and reliability, can come under the heading of “risk,” the approach still necessarily limits thedecision maker to a small set of criteria.
000200010270649984
Project Management: Achieving Competitive Advantage, Second Edition, by Jeffrey K. Pinto. Published by Prentice Hall. Copyright © 2010 by Pearson Education, Inc.

2. In order to be evaluated in terms of an efficient frontier, some value must be attached to risk. Expectedreturn is a measure that is naturally given to numerical estimate. But because risk may not be readily quan-tified, it may be misleading to designate “risk” artificially as a value for comparison among project choices.
EXAMPLE 3.3 Profile Model
Let’s consider a simple example. Suppose that our company has identified two new project alternativesand we wish to use risk/return analysis to determine which of the two projects would fit best with ourcurrent project portfolio. We assess return in terms of the profit margin we expect to achieve on theprojects. Risk is evaluated at our company in terms of four elements: (1) technical risk—the technicalchallenge of the project, (2) capital risk—the amount invested in the project, (3) safety risk—the risk ofproject failure, and (4) goodwill risk—the risk of losing customers or diminishment of our company’simage. The magnitude of each of these types of risk is determined by applying a “low, medium, high” riskscale where 1 = low, 2 = medium, and 3 = high.
After conducting a review of likely profitability for both the projects and evaluating their riskiness, weconclude the following:
3.2 Approaches to Project Screening and Selection 83
Risk Return Potential
Project Saturn 10 23%
Project Mercury 6 16%
Figure 3.5 shows our firm’s efficient frontier for the current portfolio of projects. How would we evalu-ate the attractiveness of either Project Saturn or Project Mercury?
SOLUTION
When we consider the two choices, Projects Saturn and Mercury, in terms of their projected risk and return, wecan chart them on our profile model relative to other projects that we are undertaking. Figure 3.5 illustrates theplacement of the two new project options. Note that Project Saturn, although within our maximum risk limit,does not perform as well as the other projects in our current portfolio (it has a higher risk rating for its projectedreturn than other comparable projects). On the other hand, Project Mercury offers us a 16% rate of return for alower level of risk than the current efficient frontier, suggesting that this project is an attractive option and a bet-ter alternative than Project Saturn.
Risk
12
10
8
6
4
2
8%6% 10% 12% 16% 20% 24% 28% 32%
Return
MaximumAllowableRisk
Efficient Frontier
Saturn
Mercury
MinimumDesiredReturn
X2
X3
X1
X4
FIGURE 3.5 Efficient Frontier for Our Firm
0002
0001
0270
6499
84
Project Management: Achieving Competitive Advantage, Second Edition, by Jeffrey K. Pinto. Published by Prentice Hall. Copyright © 2010 by Pearson Education, Inc.

84 Chapter 3 • Project Selection and Portfolio Management
3.3 FINANCIAL MODELS
Another important series of models relies on financial analysis to make project selection decisions. In thissection, we will examine three common financial models: discounted cash flow analysis, net present value, andinternal rate of return. These are not the only financial methods for assessing project alternatives, but they areamong the more popular.
Financial models are all predicated on the time value of money principle. The time value of moneysuggests that money earned today is worth more than money we expect to earn in the future. In other words,$100 that I receive four years from now is worth significantly less to me than if I were to receive that moneytoday. In the simplest example, we can see that putting $100 in a bank account at 3% interest will grow themoney at a compounded rate each year. Hence, at the end of year 1, the initial investment will be worth $103.After two years, it will have grown to $106.09, and so forth. The principle also works in reverse: To calculatethe present value of $100 that I expect to have in the bank in four years’ time I must first discount the amountby the same interest rate. Hence, assuming an interest rate of 3%, I need only invest $88.85 today to yield $100in four years.
There are two reasons why we would expect future money to be worth less: (1) the impact of infla-tion, and (2) the inability to invest the money. Inflation, as we know, causes prices to rise and henceerodes consumers’ spending power. In 1900, for example, the average house may have cost a few thousanddollars to build. Today these costs have soared. As a result, if I am to receive $100 in four years, its valuewill have decreased due to the negative effects of inflation. Further, not having that $100 today means thatI cannot invest it and earn a return on my money for the next four years. Money that we cannot invest ismoney that earns no interest. In real terms, therefore, the real, present value of money must be discount-ed by some factor the farther out into the future I expect to receive it. When deciding among nearlyidentical project alternatives, if Project A will earn our firm $50,000 in two years and Project B willearn our company $50,000 in four years, Project A is the best choice because we will receive the moneysooner.
Payback Period
The intent of project payback period is to estimate the amount of time that will be necessary to recoupthe investment in a project; that is, how long it will take for the project to pay back its initial budget andbegin to generate positive cash flow for the company. In determining payback period for a project, wemust employ a discounted cash flow analysis, based on the principal of the time value of money. The goalof the discounted cash flow (DCF) method is to estimate cash outlays and expected cash inflows result-ing from investment in a project. All potential costs of development (most of which are contained in theproject budget) are assessed and projected prior to the decision to initiate the project. They are then com-pared with all expected sources of revenue from the project. For example, if the project is a new chemicalplant, projected revenue streams will be based on expected capacity, production levels, sales volume, andso forth.
We then apply to this calculation a discount rate based on the firm’s cost of capital. The value of that rateis weighted across each source of capital to which the firm has access (typically, debt and equity markets). Inthis way we weight the cost of capital, which can be calculated as follows:
The weighted cost of capital is the percentage of capital derived from either debt (wd) or equity (we)times the percentage costs of debt and equity (kd and ke, respectively). (The value t refers to the company’smarginal tax rate: Because interest payments are tax deductible, we calculate the cost of debt after taxes.)
There is a standard formula for payback calculations:
The reciprocal of this formula can be used to calculate the average rate of return for the project.Once cost of capital has been calculated, we can set up a table projecting costs and revenue streams that
are discounted at the calculated rate. The key is to determine how long it will take the firm to reach the
Payback period = investment/annual cash savings
Kfirm = (wd)(kd)(1 - t) + (we)(ke)
000200010270649984
Project Management: Achieving Competitive Advantage, Second Edition, by Jeffrey K. Pinto. Published by Prentice Hall. Copyright © 2010 by Pearson Education, Inc.

breakeven point on a new project. Breakeven point represents the amount of time necessary to recover the ini-tial investment of capital in the project. Shorter paybacks are more desirable than longer paybacks, primarilybecause the farther we have to project payback into the future, the greater the potential for additional risk.
EXAMPLE 3.4 Payback Period
Our company wants to determine which of two project alternatives is the more attractive investmentopportunity, using a payback period approach. We have calculated the initial investment cost of the twoprojects and the expected revenues they should generate for us (see Table 3.5). Which project should weinvest in?
SOLUTION
For our example, the payback for the two projects can be calculated as in Table 3.6. These results suggest thatProject A is a superior choice over Project B, based on a shorter projected payback period (2.857 years versus4.028 years) and a higher rate of return (35% versus 24.8%).
3.3 Financial Models 85
TABLE 3.5 Initial Outlay and Projected Revenues for Two Project Options
Project A Project BRevenues Outlays Revenues Outlays
Year 0 $500,000 $500,000
Year 1 $ 50,000 $ 75,000
Year 2 150,000 100,000
Year 3 350,000 150,000
Year 4 600,000 150,000
Year 5 500,000 900,000
TABLE 3.6 Comparison of Payback for Projects A and B
Project A Year Cash Flow Cum. Cash Flow
0 ($500,000) ($500,000)
1 50,000 (450,000)
2 150,000 (300,000)
3 350,000 50,000
4 600,000 650,000
5 500,000 1,150,000
Payback = 2.857 years
Rate of Return = 35%
Project B Year Cash Flow Cum. Cash Flow
0 ($500,000) ($500,000)
1 75,000 (425,000)
2 100,000 (325,000)
3 150,000 (175,000)
4 150,000 (25,000)
5 900,000 875,000
Payback = 4.028 years
Rate of Return = 24.8%
0002
0001
0270
6499
84
Project Management: Achieving Competitive Advantage, Second Edition, by Jeffrey K. Pinto. Published by Prentice Hall. Copyright © 2010 by Pearson Education, Inc.

TABLE 3.7 Running Score on Discounted Cash Flows
Year Inflows Outflows Net Flow Discount Factor NPV
0 100,000 (100,000) 1.000
1 20,000 20,000 0.8772
2 50,000 50,000 0.7695
3 50,000 50,000 0.6749
4 25,000 25,000 0.5921
86 Chapter 3 • Project Selection and Portfolio Management
Net Present Value
The most popular financial decision-making approach in project selection, the net present value (NPV)method, projects the change in the firm’s value if a project is undertaken. Thus a positive NPV indicates thatthe firm will make money—and its value will rise—as a result of the project. Net present value also employsdiscounted cash flow analysis, discounting future streams of income to estimate the present value of money.
The simplified formula for NPV is as follows:
Where:Ft = the net cash flow for period tr = the required rate of returnI = initial cash investment (cash outlay at time 0)
pt = inflation rate during period t
The optimal procedure for developing an NPV calculation consists of several steps, including the con-struction of a table listing the outflows, inflows, discount rate, and discounted cash flows across the relevanttime periods. We construct such a table in Example 3.5 (see Table 3.7).
EXAMPLE 3.5 Net Present Value
Assume that you are considering whether or not to invest in a project that will cost $100,000 in initial invest-ment. Your company requires a rate of return of 10%, and you expect inflation to remain relatively constantat 4%. You anticipate a useful life of four years for the project and have projected future cash flows as follows:
Year 1: $20,000
Year 2: $50,000
Year 3: $50,000
Year 4: $25,000
SOLUTION
We know the formula for determining NPV:
We can now construct a simple table to keep a running score on discounted cash flows (both inflows andoutflows) to see if the project is worth its initial investment. We already know that we will need the followingcategories: Year, Inflows, Outflows, and NPV. We will also need two more categories:
Net flows: just the difference between inflows and outflowsDiscount factor: simply the reciprocal of the discount rate (1/(1 + k + p)t)
In Table 3.7, if we fill in the Discount Factor column assuming that k = 10% and p = 4%, we can beginwork on the NPV. Note that Year 0 means the present time, Year 1 the first year of operation.
NPV = I0 + g Ft /(1 + r + p)t
NPV(project) = I0 + g Ft /(1 + r + pt)t
000200010270649984
Project Management: Achieving Competitive Advantage, Second Edition, by Jeffrey K. Pinto. Published by Prentice Hall. Copyright © 2010 by Pearson Education, Inc.

How did we arrive at the Discount Factor for Year 3? Using the formula we set above, calculate theappropriate data:
Now supply the data for the Inflows, Outflows, and Net Flows columns.Finally, we complete the table by multiplying the Net Flow amount by the Discount Factor. The results
give us the data for the NPV column of our table. The sum of the discounted cash flows (their net presentvalue) shown in Table 3.8 gives us the NPV of the project.
The total is a positive number, indicating that the investment is worthwhile and should be pursued.
Net present value is one of the most common project selection methods in use today. Its principaladvantage is that it allows firms to link project alternatives to financial performance, better ensuring that theprojects a company does choose to invest its resources in are likely to generate profit. Among its disadvantagesis the difficulty in using NPV to make accurate long-term predictions. For example, suppose that we wereconsidering investing in a project with an expectation that it would continue to generate returns over the next10 years. In choosing whether or not to invest in the project today, we must make some assumptions aboutthe future interest rates and our required rate of return (RRR) for the next 10 years. In uncertain financial oreconomic times, it can be risky to make long-term investment decisions when discount rates may fluctuate.
Discounted Payback
Now that we have considered the time value of money, as shown in the NPV method, we can apply this logicto the simple payback model to create a screening and selection model with a bit more power. Remember thatwith NPV we use discounted cash flow as our means to decide whether or not to invest in a project opportu-nity. Now, let’s apply that same principle to the discounted payback method. Under the discounted paybackmethod, the time period we are interested in is the length of time until the sum of the discounted cash flowsis equal to the initial investment.
Let’s try a simple example to illustrate the difference between straight payback and discounted paybackmethods. Suppose we require a 12.5% return on new investments and we have a project opportunity that willcost an initial investment of $30,000 with a promised return per year of $10,000. Under the simple paybackmodel, it should only take three years to pay off the initial investment. However, as Table 3.9 demonstrates,when we discount our cash flows at 12.5 percent and start adding them, it actually takes four years to pay backthe initial project investment.
The advantage of the discounted payback method is that it allows us to make a more “intelligent”determination of the length of time needed to satisfy the initial project investment. That is, while simple paybackis useful for accounting purposes, discounted payback is actually more representative of financial realities that allorganizations must consider when pursuing projects. The effects of inflation and future investment opportunitiesdo matter with individual investment decisions and so, should also matter when evaluating project opportunities.
Internal Rate of Return
Internal rate of return (IRR) is an alternative method for evaluating the expected outlays and income associ-ated with a new project investment opportunity. IRR asks the simple question: What rate of return will this
Discount factor = (1/(1 + .10 + .04)3) = .6749
3.3 Financial Models 87
TABLE 3.8 Discounted Cash Flows and NPV (I)
Year Inflows Outflows Net Flow Discount Factor NPV
0 100,000 (100,000) 1.000 (100,000)
1 20,000 20,000 0.8772 17,544
2 50,000 50,000 0.7695 38,475
3 50,000 50,000 0.6749 33,745
4 25,000 25,000 0.5921 14,803
Total $4,567
0002
0001
0270
6499
84
Project Management: Achieving Competitive Advantage, Second Edition, by Jeffrey K. Pinto. Published by Prentice Hall. Copyright © 2010 by Pearson Education, Inc.

TABLE 3.9 Discounted Payback Method
Project Cash Flow*
Year Discounted Undiscounted
1 $8,900 $10,000
2 7,900 10,000
3 7,000 10,000
4 6,200 10,000
5 5,500 10,000
Payback Period 4 Years 3 Years
*Cash flows rounded to the nearest $100.
88 Chapter 3 • Project Selection and Portfolio Management
project earn? Under this model, the project must meet some required “hurdle” rate applied to all projectsunder consideration. Without detailing the mathematics of the process, we will say only that IRR is the dis-count rate that equates the present values of a project’s revenue and expense streams. If a project has a life oftime t, the IRR is defined as:
Where:ACFt = the annual after-tax cash flow for time period t
IO = the initial cash outlayn = the project’s expected life
IRR = the project’s internal rate of return
IRR is found through a straightforward process, although it requires tables representing present value of anannuity in order to determine the project’s rate of return. Alternatively, many pocket calculators can deter-mine IRR quickly. Without such tables or access to a calculator, it is necessary to employ an iterative processto identify the approximate IRR for the project.
EXAMPLE 3.6 Internal Rate of Return
Let’s take a simple example. Suppose that a project required an initial cash investment of $5,000 and wasexpected to generate inflows of $2,500, $2,000, and $2,000 for the next three years. Further, assume that ourcompany’s required rate of return for new projects is 10%. The question is: Is this project worth funding?
SOLUTION
Answering this question requires four steps:
1. Pick an arbitrary discount rate and use it to determine the net present value of the stream of cash inflows.2. Compare the present value of the inflows with the initial investment; if they are equal, you have
found IRR.3. If the present value is larger (or less than) than the initial investment, select a higher (or lower) discount
rate for the computation.4. Determine the present value of the inflows and compare it with the initial investment. Continue to
repeat steps 2–4 until you have determined the IRR.
Using our example, we know:
Cash investment = $5,000Year 1 inflow = $2,500Year 2 inflow = $2,000Year 3 inflow = $2,000Required rate of return = 10%
IO = at
n=1
ACF t
(1 + IRR)t
000200010270649984
Project Management: Achieving Competitive Advantage, Second Edition, by Jeffrey K. Pinto. Published by Prentice Hall. Copyright © 2010 by Pearson Education, Inc.

Step One: Try 12%.
3.3 Financial Models 89
Discount Factor
Year Inflows at 12% NPV
1 2,500 .893 2,232.50
2 2,000 .797 1,594
3 2,000 .712 1,424
Present value of inflows 5,250.50
Cash investment - 5,000
Difference $ 250.50
Decision: Present value difference at 12% is 250.50, which is too high. Try a higher discount rate.
Step Two: Try 15%.
Discount Factor
Year Inflows at 15% NPV
1 2,500 .870 2,175
2 2,000 .756 1,512
3 2,000 .658 1,316
Present value of inflows 5,003
Cash investment 5,000
Difference $3
Decision: Present value difference at 15% is $3, which suggests that 15% is a close approximation of IRR.
If the IRR is greater than or equal to the company’s required rate of return, the project is worth funding. Inthe example above, we found that the IRR is 15% for the project, making it higher than the hurdle rate of 10%and a good candidate for investment. The advantage of using IRR analysis lies in its ability to compare alter-native projects from the perspective of expected return on investment (ROI). Projects having higher IRR aregenerally superior to those having lower IRR.
IRR does, however, have some disadvantages. First, it is not the rate of return for a project. In fact, IRRequals the project’s rate of return only when project-generated cash inflows can be reinvested in new projectsat similar rates of return. If the firm can reinvest revenues only on lower-return projects, the “real” return onthe project is something less than the calculated IRR. Several other problems with IRR make NPV a morerobust determinant of project viability:16
• IRR and NPV calculations typically agree (that is, make the same investment recommendations) onlywhen projects are independent of each other. If projects are not mutually exclusive, IRR and NPV mayrank them differently. The reason is that NPV employs a weighted average cost of capital discount ratethat reflects potential reinvestment while IRR does not. Because of this distinction, NPV is generallypreferred as a more realistic measure of investment opportunity.
• If cash flows are not normal, IRR may arrive at multiple solutions. For example, if net outflows follow aperiod of net cash inflows, IRR may give conflicting results. If, following the completion of plant con-struction, it is necessary to invest in land reclamation or other incidental but significant expenses, anIRR calculation may result in multiple return rates, only one of which is correct.
Options Models
Let’s say that a firm has an opportunity to build a power plant in a developing nation. The investment isparticularly risky: The company may ultimately fail to make a positive return on its investment and may failto find a buyer for the plant if it chooses to abandon the project. Both the NPV and IRR methods fail to
0002
0001
0270
6499
84
Project Management: Achieving Competitive Advantage, Second Edition, by Jeffrey K. Pinto. Published by Prentice Hall. Copyright © 2010 by Pearson Education, Inc.
90 Chapter 3 • Project Selection and Portfolio Management
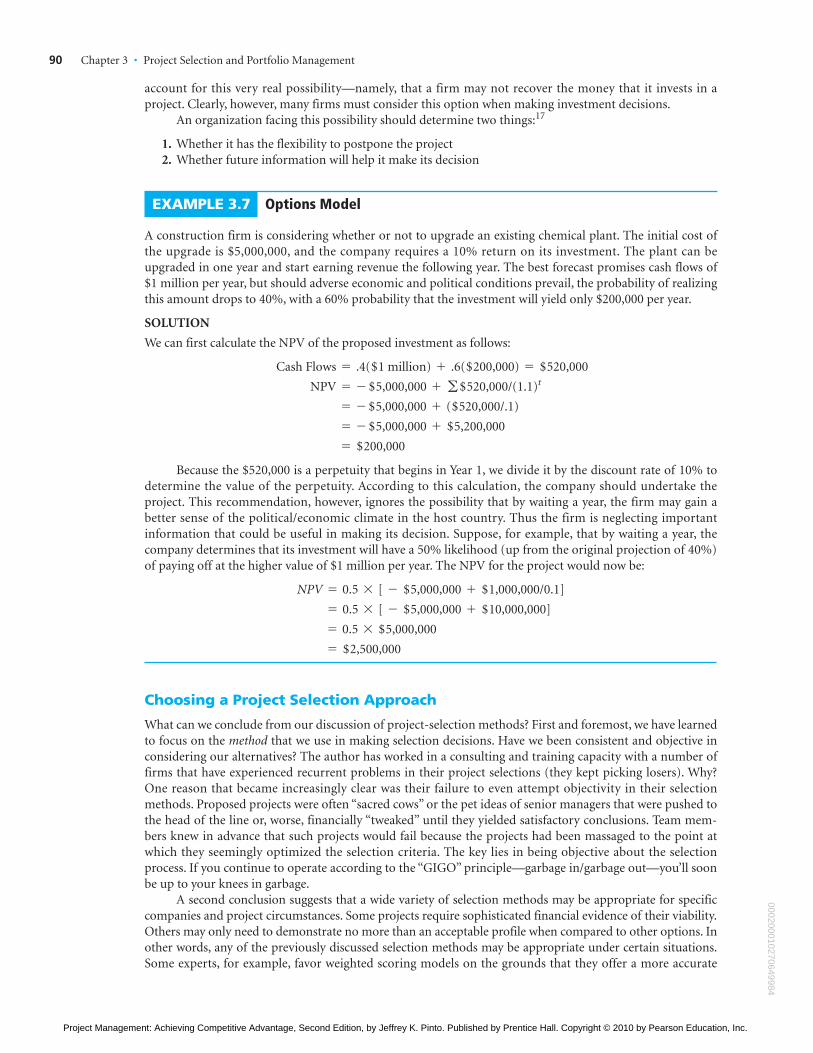
account for this very real possibility—namely, that a firm may not recover the money that it invests in aproject. Clearly, however, many firms must consider this option when making investment decisions.
An organization facing this possibility should determine two things:17
1. Whether it has the flexibility to postpone the project2. Whether future information will help it make its decision
EXAMPLE 3.7 Options Model
A construction firm is considering whether or not to upgrade an existing chemical plant. The initial cost ofthe upgrade is $5,000,000, and the company requires a 10% return on its investment. The plant can beupgraded in one year and start earning revenue the following year. The best forecast promises cash flows of$1 million per year, but should adverse economic and political conditions prevail, the probability of realizingthis amount drops to 40%, with a 60% probability that the investment will yield only $200,000 per year.
SOLUTION
We can first calculate the NPV of the proposed investment as follows:
Because the $520,000 is a perpetuity that begins in Year 1, we divide it by the discount rate of 10% todetermine the value of the perpetuity. According to this calculation, the company should undertake theproject. This recommendation, however, ignores the possibility that by waiting a year, the firm may gain abetter sense of the political/economic climate in the host country. Thus the firm is neglecting importantinformation that could be useful in making its decision. Suppose, for example, that by waiting a year, thecompany determines that its investment will have a 50% likelihood (up from the original projection of 40%)of paying off at the higher value of $1 million per year. The NPV for the project would now be:
Choosing a Project Selection Approach
What can we conclude from our discussion of project-selection methods? First and foremost, we have learnedto focus on the method that we use in making selection decisions. Have we been consistent and objective inconsidering our alternatives? The author has worked in a consulting and training capacity with a number offirms that have experienced recurrent problems in their project selections (they kept picking losers). Why?One reason that became increasingly clear was their failure to even attempt objectivity in their selectionmethods. Proposed projects were often “sacred cows” or the pet ideas of senior managers that were pushed tothe head of the line or, worse, financially “tweaked” until they yielded satisfactory conclusions. Team mem-bers knew in advance that such projects would fail because the projects had been massaged to the point atwhich they seemingly optimized the selection criteria. The key lies in being objective about the selectionprocess. If you continue to operate according to the “GIGO” principle—garbage in/garbage out—you’ll soonbe up to your knees in garbage.
A second conclusion suggests that a wide variety of selection methods may be appropriate for specificcompanies and project circumstances. Some projects require sophisticated financial evidence of their viability.Others may only need to demonstrate no more than an acceptable profile when compared to other options. Inother words, any of the previously discussed selection methods may be appropriate under certain situations.Some experts, for example, favor weighted scoring models on the grounds that they offer a more accurate
= $2,500,000
= 0.5 * $5,000,000
= 0.5 * [ - $5,000,000 + $10,000,000]
NPV = 0.5 * [ - $5,000,000 + $1,000,000/0.1]
= $200,000
= - $5,000,000 + $5,200,000
= - $5,000,000 + ($520,000/.1)
NPV = - $5,000,000 + g $520,000/(1.1)t
Cash Flows = .4($1 million) + .6($200,000) = $520,000
000200010270649984
Project Management: Achieving Competitive Advantage, Second Edition, by Jeffrey K. Pinto. Published by Prentice Hall. Copyright © 2010 by Pearson Education, Inc.

reflection of a firm’s strategic goals without sacrificing long-term effectiveness for short-term financial gains.18
They also argue that such important, nonfinancial criteria should not be excluded from the decision-modelingprocess. Perhaps the key lies in a selection algorithm broad enough to encompass both financial and nonfinan-cial considerations. Regardless of the approach that a company selects, we can be sure of one thing: Makinggood project choices is a crucial step in ensuring good project management downstream.
3.3 Financial Models 91
PROJECT PROFILE
Project Selection and Screening at GE: The Tollgate Process
General Electric has developed a highly sophisticated approach to project screening and selection that the companycalls the Tollgate Process. As you can see from Figure 3.6, Tollgate involves a series of seven formal procedural check-points (labeled 100 to 700) established along the project development timeline. As such, Tollgate is more than just aproject-selection methodology; it involves controlling the selection and development of the project as it movesthrough its life cycle. Each stage in this control process is carefully monitored.
Each of the seven Tollgate stages can be broken down into a so-called process map that guides managers andteams in addressing specific necessary elements in the completion of a stage. These elements are the substeps thatguide project screening in order to ensure that all projects conform to the same set of internal standards at GE.
Figure 3.7 lays out the Process Flow Map that is used to evaluate the progress each project makes at the var-ious stages to final completion. Note that teams must complete all action substeps at each Tollgate stage. Oncethey have completed a given stage, a cross-functional management review team provides oversight at a reviewconference. Approval at this stage permits the team to proceed to the next stage. Rejection means that the teammust back up and deal with any issues that the review team feels it has not addressed adequately. For example,suppose that the project fails a technical conformance test during field testing at the system verification stage. Thetechnical failure would require the team to cycle back to the appropriate point to analyze the cause for the fieldtest failure and begin remedial steps to correct it. After a project team has received approval from the reviewteam, it needs the approval of senior management before moving on to the next Tollgate stage. Rejection at thispoint by senior management often effectively kills the project.
Some critics argue that formalized and sophisticated review processes such as Tollgate add excessive layers ofbureaucratic oversight to the project-screening process. In fact, the sheer number of actions, steps, checklists, andmanagerial reviews stipulated by the Tollgate process can add significant delays to projects—a critical concern if a
New Product Introduction ProcessSeven Stages
IdentifyCustomerRequire-ments
ProposalNegotiation/ResourcePlanning
SystemsDesign
DetailedDesign
SystemVerification
Production/Release
100 200 300 400 500 600 700
FIGURE 3.6 GE’s Tollgate Process
Source: Used with permission of General Electric Company.
0002
0001
0270
6499
84
Project Management: Achieving Competitive Advantage, Second Edition, by Jeffrey K. Pinto. Published by Prentice Hall. Copyright © 2010 by Pearson Education, Inc.
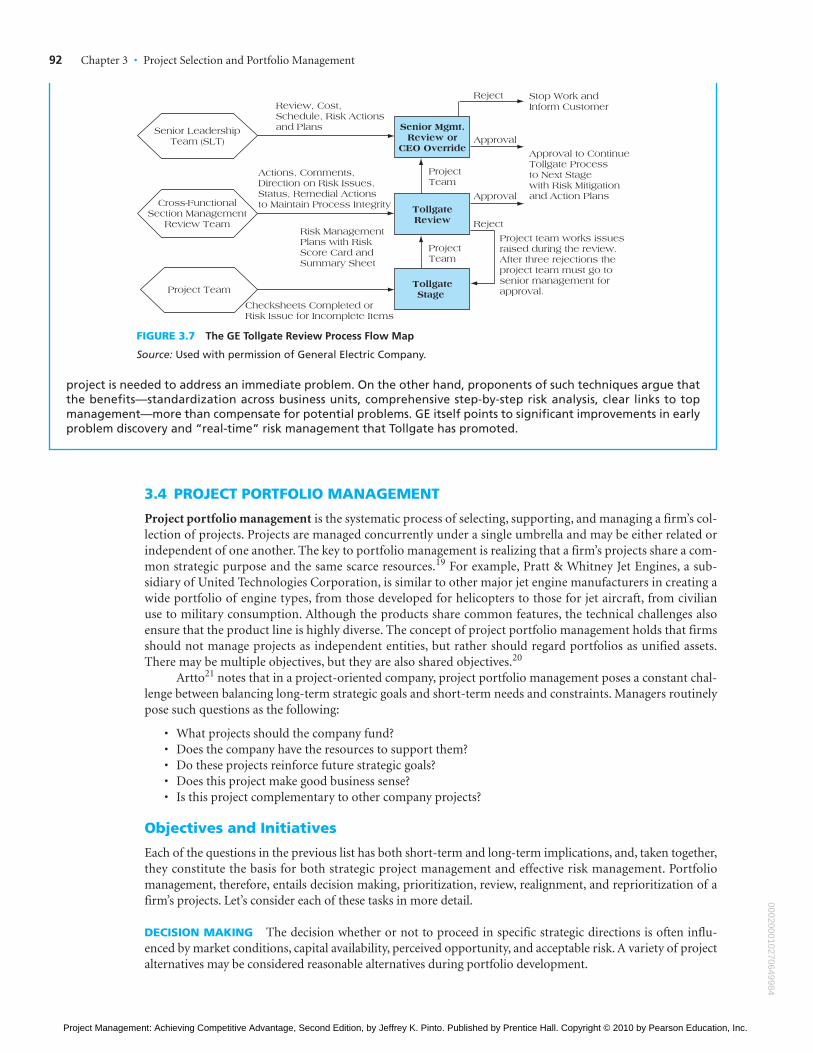
project is needed to address an immediate problem. On the other hand, proponents of such techniques argue thatthe benefits—standardization across business units, comprehensive step-by-step risk analysis, clear links to topmanagement—more than compensate for potential problems. GE itself points to significant improvements in earlyproblem discovery and “real-time” risk management that Tollgate has promoted.
3.4 PROJECT PORTFOLIO MANAGEMENT
Project portfolio management is the systematic process of selecting, supporting, and managing a firm’s col-lection of projects. Projects are managed concurrently under a single umbrella and may be either related orindependent of one another. The key to portfolio management is realizing that a firm’s projects share a com-mon strategic purpose and the same scarce resources.19 For example, Pratt & Whitney Jet Engines, a sub-sidiary of United Technologies Corporation, is similar to other major jet engine manufacturers in creating awide portfolio of engine types, from those developed for helicopters to those for jet aircraft, from civilianuse to military consumption. Although the products share common features, the technical challenges alsoensure that the product line is highly diverse. The concept of project portfolio management holds that firmsshould not manage projects as independent entities, but rather should regard portfolios as unified assets.There may be multiple objectives, but they are also shared objectives.20
Artto21 notes that in a project-oriented company, project portfolio management poses a constant chal-lenge between balancing long-term strategic goals and short-term needs and constraints. Managers routinelypose such questions as the following:
• What projects should the company fund?• Does the company have the resources to support them?• Do these projects reinforce future strategic goals?• Does this project make good business sense?• Is this project complementary to other company projects?
Objectives and Initiatives
Each of the questions in the previous list has both short-term and long-term implications, and, taken together,they constitute the basis for both strategic project management and effective risk management. Portfoliomanagement, therefore, entails decision making, prioritization, review, realignment, and reprioritization of afirm’s projects. Let’s consider each of these tasks in more detail.
DECISION MAKING The decision whether or not to proceed in specific strategic directions is often influ-enced by market conditions, capital availability, perceived opportunity, and acceptable risk. A variety of projectalternatives may be considered reasonable alternatives during portfolio development.
Cross-FunctionalSection Management
Review Team
Senior LeadershipTeam (SLT)
Senior Mgmt.Review or
CEO Override
TollgateReview
TollgateStage
ProjectTeam
Review, Cost,Schedule, Risk Actionsand Plans
Actions, Comments,Direction on Risk Issues,Status, Remedial Actionsto Maintain Process Integrity
Approval to ContinueTollgate Processto Next Stagewith Risk Mitigationand Action Plans
Checksheets Completed orRisk Issue for Incomplete Items
Risk ManagementPlans with RiskScore Card andSummary Sheet
ProjectTeam
Reject Stop Work andInform Customer
Reject
Approval
Approval
Project team works issuesraised during the review.After three rejections theproject team must go tosenior management forapproval.Project Team
FIGURE 3.7 The GE Tollgate Review Process Flow Map
Source: Used with permission of General Electric Company.
92 Chapter 3 • Project Selection and Portfolio Management
000200010270649984
Project Management: Achieving Competitive Advantage, Second Edition, by Jeffrey K. Pinto. Published by Prentice Hall. Copyright © 2010 by Pearson Education, Inc.

3.4 Project Portfolio Management 93
PRIORITIZATION Because firms have limited resources, they typically cannot fund every project opportunity.Thus they must prioritize. For this task, several criteria may be used:
• Cost: Projects with lower development costs are more favorable because they come with less upfront risk.• Opportunity: The chance for a big payout is a strong inducement for funding.• Top management pressure: Political pressure from top management (say, managers with pet projects)
can influence decisions.• Risk: Project payouts must justify some level of acceptable risk; those that are too risky are scratched.• Strategic “fit”: If a firm has a policy of pursuing a family of products, all opportunities are evaluated
in terms of their complementarity—that is, either their strategic fit with existing product lines or theirability to augment the current product family.
• Desire for portfolio balance: A firm may want to offset risky initiatives by funding other projects. TheBoston Consulting Group’s product matrix framework, for example, balances company product linesin terms of relative market share and product growth, suggesting that firms maintain a strategic balancewithin their portfolios between products with different profiles. A firm might use its profitable but low-growth products to fund investment into projects with high growth prospects. Portfolio balancesupports developing a strategy that allows companies to balance or offset risk; explore alternativemarket opportunities; and/or allow the funding of innovation in other product lines.
REVIEW All project alternatives are evaluated according to the company’s prioritization scheme. Projectsselected for the firm’s portfolio are the ones that, based on those priorities, offer maximum return.
REALIGNMENT When portfolios are altered by the addition of new projects, managers must reexaminecompany priorities. In the wake of new project additions, a number of important questions should be consid-ered. Does the new project conform to strategic goals as characterized by the project portfolio, or does it repre-sent a new strategic direction for the firm? Does a new project significantly alter the firm’s strategic goals? Doesthe portfolio now require additional rebalancing? The decision to change a portfolio by adding new projectsrestarts the analysis cycle in which we must again reexamine the portfolio for signs of imbalance or updating.
REPRIORITIZATION If strategic realignment means shifting the company’s focus (i.e., creating new strategicdirections), managers must then reprioritize corporate goals and objectives. In this sense, then, portfoliomanagement means managing overall company strategy. A good example of this phenomenon was the disas-trous L-1011 commercial jet project initiated by Lockheed over 20 years ago. The project’s cost overruns cou-pled with poor demand so soured Lockheed’s management on the commercial jet industry that they madethe decision to refocus their priorities exclusively on defense-related aviation projects.
Developing a Proactive Portfolio
Portfolio management, therefore, is an important component in strategic project management. In addition tomanaging specific projects, organizations routinely strategically plan for profitability, and the road to profitabil-ity often runs through the area of strategic project management. One of the most effective methods for aligningprofit objectives and strategic plans is the development of a proactive project portfolio, or an integrated familyof projects, usually with a common strategic goal. Such a portfolio supports overall strategic integration, ratherthan an approach that would simply move from project opportunity to opportunity.
Consider the example of the large pharmaceutical firm Pfizer.22 Pfizer and its competitors routinely managelarge families of projects in an integrated manner. The overall integration of project management efforts helps thecompany’s managers deal with certain realities of the pharmaceutical industry, such as extremely high develop-ment costs and long lead times for new products. At any particular point in time, for example, Pfizer has numerousprojects under research and development, a smaller number of projects entering various stages of clinical trials,and finally, an even smaller line of projects already on the market. Each step in the cycle is fraught with risks anduncertainties. Will a drug work in clinical trials? Will it have minimal negative side effects? Can it be produced in acost-effective manner? Is its release time-sensitive (is there, for instance, a limited market opportunity of which totake advantage)? Often the answers to such questions will reduce Pfizer’s ongoing portfolio of development proj-ects. In fact, as Table 3.10 shows, the lead time for bringing a new drug to market can easily stretch over 15 years.Moreover, the success rate of a drug actually being commercially developed is estimated to be less than 0.002%.
Under circumstances this risky, in which development time is lengthy, the financial repercussions offailure are huge, and success is never certain, pharmaceutical firms must practice highly sophisticated project
0002
0001
0270
6499
84
Project Management: Achieving Competitive Advantage, Second Edition, by Jeffrey K. Pinto. Published by Prentice Hall. Copyright © 2010 by Pearson Education, Inc.

TABLE 3.10 Phases in New Drug Development
Phase Duration % of Success Contents
Discovery 4–7 yrs 1% Research a selected pool of molecules in computer models and test tubes.
Preclinical research
Test on animals and in test tubes to research the safety, possible indications, toxicology, and metabolism of the molecule.
Phase I 1 yr 70–75% Small clinical studies on healthy volunteers to study the safety and ADME characteristics of the molecule.
Phase II 2 yrs 50% Small studies on patients with the target disease to study the efficacy, dosage, and formulation of the drug.
Phase III 3 yrs 75–85% Large clinical studies on patients to confirm the results of phase II. The most expensive phase in the project.
Marketing Application (MA)
1.5–3 yrs 75–80% Compile marketing authorization application (MAA) to the authorities. After the authorization the drug may be sold and marketed.
Total 12–16 yrs <0.002%
Source: M. Lehtonen. 2001. “Resource Allocation and Project Portfolio Management in Pharmaceutical R&D,” in Artto, Martinsuo, andAalto (Eds.), (2001), Project Portfolio Management: Strategic Management through Projects, pp. 107–140, figure on page 112. Helsinki,Finland: Project Management Association.
94 Chapter 3 • Project Selection and Portfolio Management
portfolio management. Because failure rates are high and washouts constant, the need to take advantage ofnew product opportunities is critical. Only in this way can the company ensure a steady supply of new prod-ucts in the pipeline.
The pitfalls and possibilities of the pharmaceuticals development process is illustrated in Figure 3.8. Drugcompanies compensate for the lengthy lead times necessary to get final approval of new products by simultane-ously funding and managing literally scores of development efforts. Unfortunately, only a small proportion ofan R&D portfolio will show sufficient promise to be advanced to the clinical-trial stage. Many projects arefurther weeded out during this phase, with very few projects reaching the stage of commercial rollout.
Busin
ess
Launch
Product support
Time
MAMAA
Time to market
Proof ofConcept
Dis
co
very
StartPhase I
Selection ofmolecule
Time to approval
Name of phase
Implementation
Planning
I
II
III
Pre
FIGURE 3.8 The Flow of New Drug Development over Time
Source: M. Lehtonen. 2001. “Resource Allocation and Project Portfolio Management inPharmaceutical R&D,” in Artto, Martinsuo, and Aalto (Eds.), (2001), Project Portfolio Management:Strategic Management through Projects, pp. 107–140, figure on page 120. Helsinki, Finland: ProjectManagement Association.
000200010270649984
Project Management: Achieving Competitive Advantage, Second Edition, by Jeffrey K. Pinto. Published by Prentice Hall. Copyright © 2010 by Pearson Education, Inc.

Pfizer uses portfolio management to manage the flow of new drug development projects, much as Nokiaand Erickson use it to keep track of product pipelines that include mobile phones, baseband modems, and fire-wall systems. Project portfolios are necessary because a certain percentage of projects will be canceled prior tofull funding, others will be eliminated during development, and still others will fail commercially. This cycleleaves only a few projects to account for a firm’s return on all of its investments. In short, any company thatputs all its R&D eggs in one project basket runs huge risks if that project fails during development or provesdisappointing in the marketplace. As a rule, therefore, companies guarantee themselves fallback options,greater financial stability, and the chance to respond to multiple opportunities by constantly creating andupdating portfolios of projects.
Keys to Successful Project Portfolio Management
Although examples of successfully managed portfolios abound, few researchers have investigated the keyreasons why some companies are better at it than others. Brown and Eisenhardt23 recently studied six firmsin the computer industry; all are involved in multiple project development activities. They determined thatsuccessfully managed project portfolios usually reflect the following three factors.
FLEXIBLE STRUCTURE AND FREEDOM OF COMMUNICATION Multiple-project environments cannotoperate effectively when they are constrained by restrictive layers of bureaucracy, narrow communicationchannels, and rigid development processes. Successful portfolios emerge from environments that foster flexi-bility and open communication. When project teams are allowed to improvise and experiment on existingproduct lines, innovative new product ideas are more likely to emerge.
LOW-COST ENVIRONMENTAL SCANNING Many firms devote a lot of time and money in efforts to hitproduct “home runs.” They put their faith (and financing) in one promising project and aim to take the mar-ketplace by storm, often without sufficiently analyzing alternative opportunities or future commercial trends.As a rule, successful project portfolio strategies call for launching a number of low-cost probes into thefuture, the idea behind environmental scanning—developing and market-testing a number of experimentalproduct prototypes, sometimes by entering strategic alliances with potential partners. Successful firms do notrely on home runs and narrowly concentrated efforts. They are constantly building and testing new projectsprior to full-scale development. Rubbermaid, for example, routinely brings dozens of new product ideas tothe market, samples the commercial response, and uses the resulting information to improve potentialwinners and discard products that don’t measure up.
TIME-PACED TRANSITION Successful portfolio management requires a sense of timing, especially as firmsmake transitions from one product to the next. Successful firms use project portfolio planning routinely todevelop long lead times and plan ahead in order to make the smoothest possible transition from one productto another, whether the product lines are diverse or constitute creating a follow-on upgrade. Gillette, forexample, has made a lucrative business out of developing and selling new models of shaving razors. Gillette’sproduct life cycle planning is highly sophisticated, allowing it to make accurate predictions of the likely lifecycle of current products and the timing necessary for beginning new product development projects to main-tain a seamless flow of consumer products.
Problems in Implementing Portfolio Management
What are some of the common problems in creating an effective portfolio management system? Althoughnumerous factors can adversely affect the practice of portfolio management, recent research seems to suggestthat the following are among the most typical problem areas.24
CONSERVATIVE TECHNICAL COMMUNITIES In many organizations, there is a core of technical profes-sionals—project engineers, research scientists, and other personnel—who develop project prototypes. Acommon phenomenon is this group’s unwillingness, whether out of pride, organizational inertia, or due toarguments supporting pure research, to give up project ideas that are too risky, too costly, or out of sync withstrategic goals. Often, when top management tries to trim the portfolio of ongoing projects for strategic rea-sons, they find engineers and scientists reluctant to accept their reasoning. Data General Corporation, amanufacturer of computers and IT products, found itself increasingly under the dominance of its hardwareengineering department, a group intent on pursuing their own new product goals and fostering their own
3.4 Project Portfolio Management 95
0002
0001
0270
6499
84
Project Management: Achieving Competitive Advantage, Second Edition, by Jeffrey K. Pinto. Published by Prentice Hall. Copyright © 2010 by Pearson Education, Inc.

96 Chapter 3 • Project Selection and Portfolio Management
vision for the organization. By the mid-1990s, with one product after another resulting in significant losses,the company could not continue to operate independently and was acquired by EMC Corporation.
OUT-OF-SYNC PROJECTS AND PORTFOLIOS Sometimes after a firm has begun realigning and reprioritizingits strategic outlook, it continues to develop projects or invest in a portfolio that no longer accurately reflects itsnew strategic focus. Strategy and portfolio management must accurately reflect a similar outlook. When strat-egy and portfolio management are out of alignment, one or both of two things will probably happen: either theportfolio will point the firm toward outmoded goals or the firm’s strategy will revert to its old objectives.
UNPROMISING PROJECTS The worst-case scenario finds a company pursuing poor-quality or unnecessaryprojects. A recent battle in consumer video electronics pitted Sony’s Blu-ray high definition Digital Video Disc(DVD) technology against Toshiba’s offering, the High Definition Digital Versatile Disc (HD-DVD). Althoughthe Sony product requires a relatively expensive machine to play the discs, it convinced the majority of thepublic that its format is the superior one. Major content manufacturers and retailers had been steadily with-drawing their support for the HD-DVD technology, leaving Toshiba to continue developing it alone. Afterpursing HD-DVD technology for several years at high cost, Toshiba announced in early 2008 that it wasabandoning its foray. When portfolio management is geared to product lines, managers routinely rebalance theportfolio to ensure that there are a sufficient number of products of differing type to offset those with weak-nesses. Revenues from “cash cows,” for example, can fund innovative new products. Sometimes, of course,critical analysis of a portfolio requires hard decisions, project cancellations, and reallocated resources. But it isprecisely this ongoing attention to the portfolio that prevents it from becoming weighted down withunpromising projects.
SCARCE RESOURCES A key resource for all projects is human beings. In fact, personnel costs comprise oneof the highest sources of project expense. Additional types of resources include any raw materials, financialresources, or supplies that are critical to successfully completing the project. Before spending large amounts oftime creating a project portfolio, organizations thus like to ensure that the required resources will be availablewhen needed. A principle cause of portfolio underperformance is a lack of adequate resources, especiallypersonnel, to support required development.
Portfolio management is the process of bringing an organization’s project management practices intoline with its overall corporate strategy. By creating complementarity in its project portfolio, a company canensure that its project management teams are working together rather than at cross-purposes. Portfolio man-agement is also a visible symbol of the strategic direction and commercial goals of a firm. Taken together, theprojects that a firm chooses to promote and develop send a clear signal to the rest of the company aboutpriorities, resource commitment, and future directions. Finally, portfolio management is an alternativemethod for managing overall project risk by seeking a continuous balance among various families of projects,between risks and return trade-offs, and between efficiently run projects and nonperformers. As more andmore organizations rely on project management to achieve these ends, it is likely that more and more firmswill take the next logical step: organizing projects by means of portfolio management.
Summary
1. Explain six criteria for a useful project-selectionscreening model. No organization can pursue everyopportunity that presents itself. Choices must be made,and to best ensure that they select the most viable proj-ects, many firms develop priority systems or guide-lines—selection models that permit them to save timeand money while maximizing the likelihood of success.
There are a number of decision models avail-able to managers responsible for evaluating andselecting potential projects. All firms, however, try todevelop a screening model (or set of models) thatwill allow them to make the best choices within theusual constraints of time and money. Souder (1983)
identifies five important issues that managers shouldconsider when evaluating screening models:(1) Realism: An effective model must reflect organi-zational objectives and must be reasonable in light ofsuch constraints on resources as money and person-nel. Finally, the model must take into account bothcommercial risks and technical risks. (2) Capability:A model should be flexible enough to respond tochanges in the conditions under which projects arecarried out and robust enough to accommodate newcriteria and constraints. (3) Flexibility: The modelshould be easily modified if trial applications requirechanges. (4) Ease of Use: A model must be simple
000200010270649984
Project Management: Achieving Competitive Advantage, Second Edition, by Jeffrey K. Pinto. Published by Prentice Hall. Copyright © 2010 by Pearson Education, Inc.

Summary 97
enough to be used by people in all areas of the organ-ization, and it should be timely: It should generateinformation rapidly, and people should be able toassimilate that information without any specialtraining or skills. (5) Cost: The cost of gathering,storing, and arranging information in the form ofuseful reports or proposals should be relatively low inrelation to the costs associated with implementing aproject (in other words, low enough to encourage use of the models rather than diminish their applica-bility). To Souder’s list we add one more criterion:(6) Comparability: The model must be broad enoughthat it can be applied to multiple projects, and it must support general comparisons of projectalternatives.
2. Understand how to employ checklists and simplescoring models to select projects, including the recog-nition of their strengths and weaknesses. Checklistsrequire decision makers to develop a list of the criteriathat are deemed important when considering amongproject alternatives. For example, a firm may decide thatall project alternatives must be acceptable on criteriasuch as return on investment, safety, cost of develop-ment, commercial opportunities, and stakeholderacceptability. Once the list is created, all project alterna-tives are evaluated against the list and assigned a ratingof high, medium, or low depending upon how well theysatisfy each criterion in the checklist. Projects that ratehighest across the relevant criteria are selected.Checklists are useful because they are simple andrequire the firm to make trade-off decisions among cri-teria to determine which issues are most important inselecting new projects. Among their disadvantages arethe subjective nature of the rating process and the factthat they assume equal weighting for all criteria whensome, in fact, may be much more important than othersin making the final decision.
Simple scoring models are similar to checklistsexcept that they employ criterion weights for each of thedecision criteria. Hence, all project alternatives are firstweighted by the importance score for the criterion andthen final scores are evaluated against one another. Theadvantage of this method is that it recognizes the factthat decision criteria may be weighted differently, lead-ing to better choices among project alternatives. Itsdisadvantages are due to the difficulty in assigningmeaningful values to scoring anchors such as “High = 3,Medium = 2, Low =1.” The results of simple scoringmodels using weighted rankings lies in the uncertaintyof their interpretation. Further, these models dependupon the relevance of the selected criteria and the accu-racy of the weight given to them if they are to be useful.
3. Use more sophisticated scoring models, such as the Analytical Hierarchy Process. The AnalyticalHierarchy Process (AHP) is a four-step process that
allows decision makers to understand the nature ofproject alternatives in making selection decisions. TheAHP first structures the hierarchy of criteria to be usedin the decision process, then allocates weights to thesecriteria. The next step is to assign numerical values to allevaluation dimensions, and finally, to use this scoringdevice in evaluating project alternatives. The AHP hasbeen shown to create more accurate decision alterna-tives and lead to more informed choices, provided theorganization’s decision makers develop accurate deci-sion criteria and evaluate and weight them honestly.
4. Learn how to use financial concepts, such as theefficient frontier and risk/return models. Manyprojects are selected as a result of their perceivedrisk/return trade-off potential. That is, all projects entailrisk (uncertainty). Project organizations seek to balancehigher risk with comparatively higher expectations ofreturn if they are to consider funding the project. Theefficient frontier concept is defined as the portfolio offer-ing the lowest risk for its expected reward and is made upof projects reflecting various combinations of risk andreturn. The efficient frontier allows projects to be evalu-ated against each other by assessing the potential returnsfor each alternative compared to the risk the firm isexpected to undertake in producing the project.
5. Employ financial analyses and options analysis toevaluate the potential for new project investments.Financial analysis using discounted cash flows andinternal rates of return allow us to apply the concept ofthe time value of money to any decision we have tomake regarding the attractiveness of various projectalternatives. The time value of money suggests thatfuture streams of return from a project investmentshould at least offset the initial investment in the proj-ect plus some required rate of return imposed by thecompany. Options analysis takes this process one stepfurther and considers alternatives in which an invest-ment is either made or foregone, depending upon rea-sonable alternative investments the company canmake in the future. Each of these financial modelsargues that the principle determinant of an attractiveproject investment must be the money it promises toreturn. Clearly, therefore, a reasonably accurate esti-mate of future streams of revenue is required forfinancial models to create meaningful results.
6. Recognize the challenges that arise in maintaining anoptimal project portfolio for an organization. Thereare a number of challenges associated with managing aportfolio of projects, including: (a) conservative techni-cal communities that refuse to support new projectinitiatives, (b) out-of-sync projects and portfolios inwhich the projects no longer align with overall strategicportfolio plans, (c) unpromising projects that unbal-ance the portfolio, and (d) scarce resources, so that it isimpossible to support new projects.
0002
0001
0270
6499
84
Project Management: Achieving Competitive Advantage, Second Edition, by Jeffrey K. Pinto. Published by Prentice Hall. Copyright © 2010 by Pearson Education, Inc.

7. Understand the three keys to successful projectportfolio management. The three keys to successproject portfolio management include the creation oravailability of a flexible structure and freedom ofcommunication, in which excessive bureaucracy andadministrative oversight have been reduced to allowthe portfolio management team maximum flexibilityin seeking out and investing in projects. Additionally,successful portfolio management strategies allow for
low-cost environmental scanning, which launches aseries of inexpensive “probes” into the future to devel-op and test-market project alternatives. Finally, suc-cessful portfolio management requires a time-pacedtransition strategy based on a sense of the timing nec-essary to successfully transition from one product tothe next, whether the next product is a direct offshootof the original, or an additional innovative productfor the firm’s portfolio.
Key Terms
Analytical HierarchyProcess (AHP) (p. 78)
Checklist (p. 74)Discounted cash flow
(DCF) method (p. 84)Discounted payback
method (p. 87)Efficient frontier (p. 82)Internal rate of return
(IRR) (p. 87)
Lead time (p. 93)Net present value (NPV)
method (p. 86)Nonnumeric models (p. 73)Numeric models (p. 73)Pairwise comparison
approach (p. 79)Payback period (p. 84)Present value of
money (p. 84)
Profile models (p. 81)Project portfolio (p. 72)Project portfolio
management (p. 92)Project-screening model
(p. 74)Required rate of return
(RRR) (p. 87)Risk/return (p. 81)
98 Chapter 3 • Project Selection and Portfolio Management
Simplified scoring model(p. 76)
Time value of money(p. 84)
3.1 Net Present ValueYour firm is trying to decide whether or not to invest in a new proj-ect opportunity based on the following information. The initial cashoutlay will total $250,000 over two years. The firm expects to invest$200,000 immediately and the final $50,000 in one year’s time. Thecompany predicts that the project will generate a stream of earningsof $50,000, $100,000, $200,000, and $75,000 per year, respectively,starting in Year 2. The required rate of return is 12%, and the expect-ed rate of inflation over the life of the project is forecast to remainsteady at 3%. Should you invest in this project?
SOLUTION
In order to answer this question, we need to organize the followingdata in the form of a table (see Table 3.11):
Total outflow = $250,000Total inflow = $400,000
Required rate of return (r) = 12%Inflation rate (p) = 3%Discount factor = 1/(1 + r + p)t
The result is Table 3.11.Because the discounted revenue stream is positive ($11,725),
the project would be a good investment and should be pursued.
3.2 Discounted PaybackYour firm has the opportunity to invest $75,000 in a new projectopportunity but due to cash flow concerns, your boss wants toknow when you can pay back the original investment. Using thediscounted payback method, you determine that the project shouldgenerate inflows of $30,000, $30,000, $25,000, $20,000, and $20,000respectively for an expected five years after completion of the proj-ect. Your firm’s required rate of return is 10%. Calculate how long itshould take to pay back the initial project investment.
Solved Problems
TABLE 3.11 Discounted Cash Flows and NPV (II)
Year Inflows Outflows Net Flow Discount Factor NPV
0 $0 $200,000 $(200,000) 1.000 $(200,000)
1 0 50,000 (50,000) .8696 (43,480)
2 50,000 0 50,000 .7561 37,805
3 100,000 0 100,000 .6575 65,750
4 200,000 0 200,000 .5718 114,360
5 75,000 0 75,000 .4972 37,290
Total $(11,725)
000200010270649984
Project Management: Achieving Competitive Advantage, Second Edition, by Jeffrey K. Pinto. Published by Prentice Hall. Copyright © 2010 by Pearson Education, Inc.

Problems 99
SOLUTION
To answer this question, it is helpful to organize the informationinto a table. Remember that:
Total outflow = $75,000Required rate of return = 10%Discount factor = 1/(1 + .10)t
Decision: Present value difference at 10% is $860, which istoo high. Try a higher discount rate.
Step Two: Try 12%.
Year Cash FlowDiscount
Factor Net Inflows
0 ($75,000) 1.0 ($75,000)
1 30,000 .91 27,300
2 30,000 .83 24,900
3 25,000 .75 18,750
4 20,000 .68 13,600
5 20,000 .62 12,400
Payback = 3.3 years
3.3 Internal Rate of returnSuppose that a project required an initial cash investment of $24,000and was expected to generate inflows of $10,000, $10,000, and$10,000 for the next three years. Further, assume that our company’srequired rate of return for new projects is 12%. Is this project worthfunding? Is it still a good investment when the company’s requiredrate of return is 15%?
Cash investment = $24,000Year 1 inflow = $10,000Year 2 inflow = $10,000Year 3 inflow = $10,000Required rate of return = 12%
Discount Factor
Year Inflows at 10% NPV
1 10,000 .909 9,090
2 10,000 .826 8,260
3 10,000 .751 7,510
Present value of inflows 24,860
Cash investment – 24,000
Difference $860
Discount Factor
Year Inflows at 12% NPV
1 10,000 .893 8,930
2 10,000 .797 7,970
3 10,000 .712 7,120
Present value of inflows 24,020
Cash investment – 24,000
Difference $20
SOLUTION
Step One: Try 10%.
Decision: Present value difference at 12% is $20, which sug-gests that 12% is a close approximation of IRR. This project wouldbe a good investment at 12% but it would not be acceptable if thefirm’s required rate of return were 15%.
Discussion Questions
1. If you were to prioritize the criteria for a successful screeningmodel, which criteria do you rank at the top of your prioritylist? Why?
2. What are the benefits and drawbacks of project checklists forscreening alternatives?
3. How does use of the Analytical HierarchyProcess (AHP) aid inproject selection? In particular, what aspects of the screeningprocess does the AHP seem to address and improve directly?
4. What are the benefits and drawbacks of the profile model forproject screening? Be specific about the problems that may arisein identifying the efficient frontier.
5. How are financial models superior to other screening models?How are they inferior?
6. How does the options model address the problem of nonrecov-erable investment in a project?
7. What advantages do you see in the GE Tollgate screening approach?What disadvantages do you see? How would you alter it?
8. Why is project portfolio management particularly challengingin the pharmaceutical industry?
9. What are the keys to successful project portfolio management?10. What are some of the key difficulties in successfully implement-
ing portfolio management practices?
Problems
1. Checklist. Suppose that you are trying to choose which of twoIT projects to accept. Your company employs three primaryselection criteria for evaluating all IT projects: (1) proven tech-nology, (2) ease of transition, and (3) projected cost savings.
One option, Project Demeter, is evaluated as:
Technology highEase of transition lowProjected cost savings high
0002
0001
0270
6499
84
Project Management: Achieving Competitive Advantage, Second Edition, by Jeffrey K. Pinto. Published by Prentice Hall. Copyright © 2010 by Pearson Education, Inc.

100 Chapter 3 • Project Selection and Portfolio Management
Alpha Beta Gamma Delta
Quality 1 3 3 5
Cost 7 7 5 3
Speed 5 5 3 1
Visibility 3 1 5 3
Reliability 5 5 7 7
The second option, Project Cairo, is evaluated as:
Technology mediumEase of transition highProjected cost savings high
Construct a table identifying the projects, their evaluative crite-ria, and ratings. Based on your analysis, which project wouldyou argue in favor of adopting? Why?
2. Checklist. Consider the following information in choosingamong the four project alternatives below (labeled A, B, C, andD). Each has been assessed according to four criteria:
• Payoff potential• Lack of risk• Safety• Competitive advantage
Construct a project checklist model for screening these fouralternatives. Based on your model, which project is the bestchoice for selection? Why? Which is the worst? Why?
3. Scoring Model. Suppose the information in Problem 2 wassupplemented by importance weights for each of the fourassessment criteria that follow, where 1 = low importance and 4 = high importance:
Assume, too, that evaluations of high receive a score of 3,medium 2, and low 1. Recreate your project scoring model andreassess the four project choices (A, B, C, and D). Now whichproject alternative is the best? Why?
4. Scoring Model. Now assume that for Problem 3, the same im-portance weights are altered as follows:
DE
C
RiskF
B
A
Return
FIGURE 3.9 Project Profile Model (Problem 6)
Assessment Criteria Importance Weights
1. Payoff potential 4
2. Lack of risk 3
3. Safety 1
4. Competitive advantage 3
Assessment Criteria Importance Weights
1. Payoff potential 1
2. Lack of risk 1
3. Safety 4
4. Competitive advantage 2
Project A is rated:
Payoff potential high Safety highLack of risk low Competitive
advantagemedium
Project B is rated:
Payoff potential low Safety mediumLack of risk medium Competitive
advantagemedium
Project C is rated:
Payoff potential medium Safety lowLack of risk medium Competitive
advantagelow
Project D is rated:
Payoff potential high Safety mediumLack of risk high Competitive
advantagemedium
How does this new information alter your decision? Whichproject now looks most attractive? Why?
5. Screening Matrix. Assume that the following information isrelative to the process of screening various project opportuni-ties. Our relevant criteria (including importance weightings)include the following:
Quality (5)Cost (3)Speed to Market (7)Visibility (5)Reliability (1)
Our company has four project alternatives, which satisfy thekey features listed above as follows:
Construct a project screening matrix to identify among thesefour projects the most likely candidate to be implemented.
6. Profile Model. Assume the project profile model shown inFigure 3.9.
Define the efficient frontier. The dotted lines represent theminimum return and the maximum risk that the company willaccept. Which projects would be suitable for retaining andwhich should be dropped from the company’s portfolio? Why?
000200010270649984
Project Management: Achieving Competitive Advantage, Second Edition, by Jeffrey K. Pinto. Published by Prentice Hall. Copyright © 2010 by Pearson Education, Inc.

7. Using the information from the profile model in Problem 6, con-struct an argument as to why project B is preferable to project C.
8. Discounted Payback. Your company is seriously consideringinvesting in a new project opportunity but cash flow is tightthese days. Top management is concerned about how long itwill take for this new project to pay back the initial invest-ment of $50,000. You have determined that the projectshould generate inflows of $30,000, $30,000, $40,000,$25,000, and $15,000 for the next five years. Your firm’srequired rate of return is 15%. How long will it take to payback the initial investment?
9. Net Present Value. Assume that your firm wants to choosebetween two project options:
• Project A offers the following opportunity: $450,000 invest-ed today will yield an expected income stream of $150,000per year for five years, starting in Year 1.
• Project B requires an initial investment of $400,000, but itsexpected revenue stream is: Year 1 = 0, Year 2 = $50,000, Year3 = $200,000, Year 4 = $300,000, and Year 5 = $200,000.
Assume that a required rate of return for your company is 12%and that inflation is expected to remain steady at 5% for the lifeof the project. Which is the better investment? Why?
10. Net Present Value. Your vice president for MIS informs youthat she has researched the possibility of automating your
organization’s order-entry system. She has projected that thenew system will reduce labor costs by $25,000 each year overthe next five years. The purchase price (including installationand testing) of the new system is $105,250. The system isexpected to have a useful life of five years, after which time itcan be sold in the secondary computer systems market for$10,250. What is the net present value of this investment if thediscount rate is 8.5% per year?
11. Net Present Value. A company has four project investment alter-natives. The required rate of return on projects is 20%, and infla-tion is projected to remain at 3% into the foreseeable future. Thepertinent information about each alternative is listed in the chart:Which project should be the firm’s first priority? Why? If thecompany could invest in more than one project, indicate theorder in which it should prioritize these project alternatives.
12. Options Model. A heavy manufacturing company wants todecide whether to initiate a new project. The success of theproject depends heavily on the state of the economy, which hasa 50/50 chance of being strong enough to support the venture.The project will require an initial investment of $1 million, andthe company expects to earn $500,000 in annual revenues fromthe project—unless the economy goes into recession, in whichcase the project will return only $100,000 per year. Thecompany requires a 12% return on its investments. Should itundertake the project?
Project Carol Year Investment Revenue Streams
0 $500,000 0
1 50,000
2 250,000
3 350,000
Project George Year Investment Revenue Streams
0 $250,000 0
1 75,000
2 75,000
3 75,000
4 50,000
Project Thomas Year Investment Revenue Streams
0 $1,000,000 0
1 200,000
2 200,000
3 200,000
4 200,000
5 200,000
6 200,000
Project Anna Year Investment Revenue Streams
0 $75,000 0
1 15,000
2 25,000
3 50,000
4 50,000
5 150,000
Problems 101
0002
0001
0270
6499
84
Project Management: Achieving Competitive Advantage, Second Edition, by Jeffrey K. Pinto. Published by Prentice Hall. Copyright © 2010 by Pearson Education, Inc.

102 Chapter 3 • Project Selection and Portfolio Management
If the company decides to wait a year, the economy has a 75%chance of improving sufficiently to ensure $500,000 in annualreturns. Does it make sense to wait for a year before making theinvestment? Use the options model approach to project evalua-tion to answer these two questions.
13. Options Model. Massivesoft Corporation is trying to decidewhether or not to invest in a new software project. The initialinvestment will be $5 million. The project has a 40% chanceof returning $1 million per year into the future and a 60%chance of generating only $100,000 in revenues. Assumingthat Massivesoft requires a 15% return on capital invest-ments, determine whether or not this is a viable project.
If Massivesoft decides to wait one year before investingin the project, its odds of returning $1 million per yearimprove to 70%. Should Massivesoft wait one year to initiatethe project?
14. Portfolio Management. Crown Corporation is interested inexpanding its project portfolio. Currently, the firm specializesin water conservation and land reclamation projects. It antici-pates, however, a huge increase in the demand for home fuelcells as an alternative to current methods of energy generation
and usage. Although fuel-cell projects involve different tech-nologies than those in which Crown currently specializes, theprofit potential is very large. Develop a list of benefits anddrawbacks associated with this potential expansion of Crown’sproject portfolio. In your opinion, do the risks outweigh theadvantages from such a move? Justify your answer.
15. Project Screening. Assume you are the IT manager for a largeurban health care system. You have lately found yourself bom-barded with requests for new projects, including systemupgrades, support services, automated record keeping, billing,and so forth. With an average of 50 software and hardware sup-port projects going on at any time, you have decided that youmust create a system for screening new project requests fromthe various departments within the health care system.Develop a project selection and screening system similar toGE’s Tollgate process. What elements would you include insuch a system? How many steps would you recommend? Atwhat points in the process should “gates” be installed? Howmight a tollgate system for a software development companydiffer from one used by an architectural firm specializing in thedevelopment of commercial office buildings?
Case Study 3.1Keflavik Paper Company
In recent years, Keflavik Paper Company has been havingproblems with its project management process. A number ofcommercial projects, for example, have come in late and wellover budget. A comprehensive analysis of the process tracedmany of the problems back to faulty project-selection meth-ods. Keflavik is a medium-sized corporation that manufac-tures a variety of paper products, including specialty papersand the coated papers used in the photography and printingindustries. Despite cyclical downturns due to general eco-nomic conditions, the firm’s annual sales have grown steadilythough slowly. About five years ago, Keflavik embarked on aproject-based approach to new product opportunities. Thegoal was to improve profitability and generate additional salesvolume by developing new commercial products quickly, withbetter targeting to specific customer needs.
The results so far have not been encouraging. Forone thing, the company’s project development record hasbeen spotty: While some projects have been delivered ontime, others have been late. Budgets are routinely overrun,and product performance has been inconsistent, with theresult that some projects yield good returns and others losemoney. Top management hired a consultant to analyze thefirm’s processes and determine the most efficient way to fixits project management procedures. The consultant attrib-uted the main problems not to the project managementprocesses themselves, but to the manner in which projectsare added to the company’s portfolio. The primary mecha-nism for new project selection focused almost exclusivelyon discounted cash flow models, such as net present value
analysis. Essentially, if it promised profitable revenuestreams, a project was okayed by top management.
One result of this practice was the development of a“family” of projects that were often almost completelyunrelated. No one, it seems, ever asked whether projectsthat were added to the portfolio fit with other ongoing proj-ects. Keflavik attempted to expand into coated papers,photographic products, shipping and packaging materials,and other lines that strayed far from their original niche.New projects were rarely measured against the firm’s strate-gic mission, and little effort was made to evaluate themaccording to its technical resources. Some new projects, forexample, failed to fit because they required significant orga-nizational learning and new technical expertise and training(all of which was also expensive and time consuming). Theresult was a portfolio of diverse, mismatched projects thatwas difficult to manage. Further, it decreased organizationallearning as the diverse nature of the new product line anddevelopment processes made it impossible for Keflavik’sproject managers to move easily from one assignment to thenext. Likewise, this hodgepodge of projects made it difficultto apply lessons learned from one project to the next.Because the skills acquired on one project were largelynontransferable, project teams routinely had to relearnprocesses whenever they moved on to a new project.
The consultant suggested that Keflavik rethink itsproject selection and screening processes. In order to lendsome coherence to its portfolio, the firm needed to includealternative screening mechanisms. All new projects, for
000200010270649984
Project Management: Achieving Competitive Advantage, Second Edition, by Jeffrey K. Pinto. Published by Prentice Hall. Copyright © 2010 by Pearson Education, Inc.
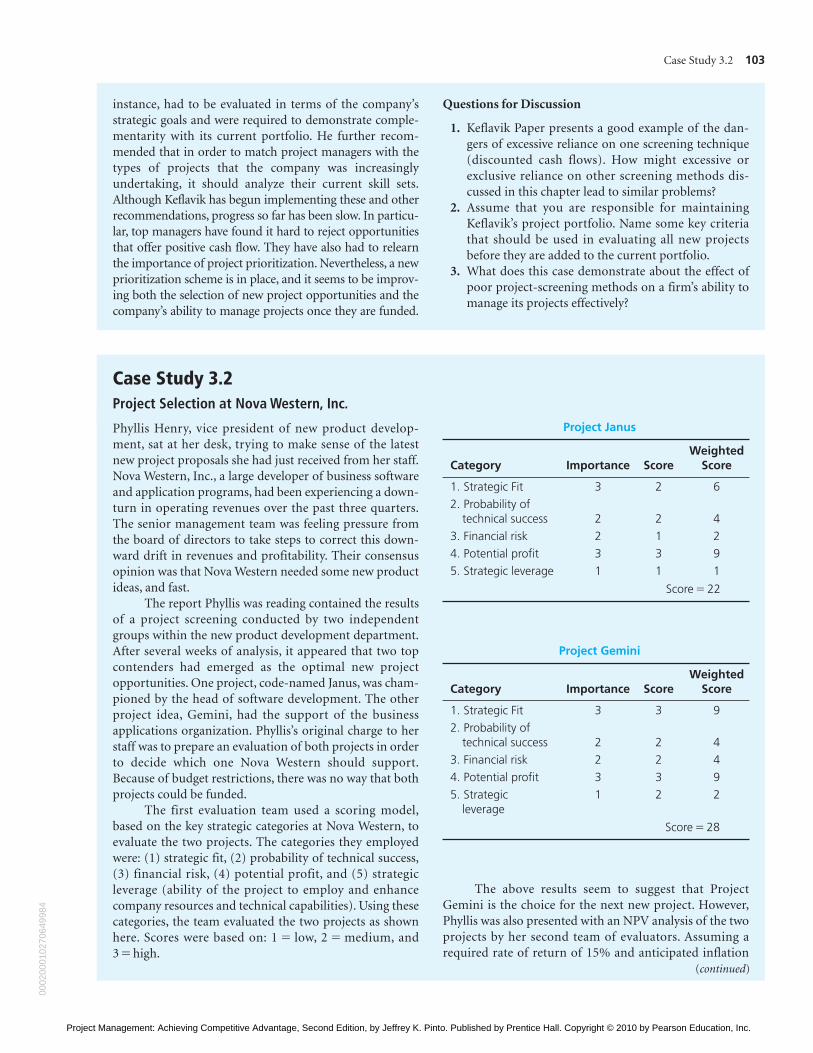
instance, had to be evaluated in terms of the company’sstrategic goals and were required to demonstrate comple-mentarity with its current portfolio. He further recom-mended that in order to match project managers with thetypes of projects that the company was increasinglyundertaking, it should analyze their current skill sets.Although Keflavik has begun implementing these and otherrecommendations, progress so far has been slow. In particu-lar, top managers have found it hard to reject opportunitiesthat offer positive cash flow. They have also had to relearnthe importance of project prioritization. Nevertheless, a newprioritization scheme is in place, and it seems to be improv-ing both the selection of new project opportunities and thecompany’s ability to manage projects once they are funded.
Questions for Discussion
1. Keflavik Paper presents a good example of the dan-gers of excessive reliance on one screening technique(discounted cash flows). How might excessive orexclusive reliance on other screening methods dis-cussed in this chapter lead to similar problems?
2. Assume that you are responsible for maintainingKeflavik’s project portfolio. Name some key criteriathat should be used in evaluating all new projectsbefore they are added to the current portfolio.
3. What does this case demonstrate about the effect ofpoor project-screening methods on a firm’s ability tomanage its projects effectively?
Case Study 3.2Project Selection at Nova Western, Inc.
Phyllis Henry, vice president of new product develop-ment, sat at her desk, trying to make sense of the latestnew project proposals she had just received from her staff.Nova Western, Inc., a large developer of business softwareand application programs, had been experiencing a down-turn in operating revenues over the past three quarters.The senior management team was feeling pressure fromthe board of directors to take steps to correct this down-ward drift in revenues and profitability. Their consensusopinion was that Nova Western needed some new productideas, and fast.
The report Phyllis was reading contained the resultsof a project screening conducted by two independentgroups within the new product development department.After several weeks of analysis, it appeared that two topcontenders had emerged as the optimal new projectopportunities. One project, code-named Janus, was cham-pioned by the head of software development. The otherproject idea, Gemini, had the support of the businessapplications organization. Phyllis’s original charge to herstaff was to prepare an evaluation of both projects in orderto decide which one Nova Western should support.Because of budget restrictions, there was no way that bothprojects could be funded.
The first evaluation team used a scoring model,based on the key strategic categories at Nova Western, toevaluate the two projects. The categories they employedwere: (1) strategic fit, (2) probability of technical success,(3) financial risk, (4) potential profit, and (5) strategicleverage (ability of the project to employ and enhancecompany resources and technical capabilities). Using thesecategories, the team evaluated the two projects as shownhere. Scores were based on: 1 = low, 2 = medium, and 3 = high.
The above results seem to suggest that ProjectGemini is the choice for the next new project. However,Phyllis was also presented with an NPV analysis of the twoprojects by her second team of evaluators. Assuming arequired rate of return of 15% and anticipated inflation
Project Janus
Category Importance ScoreWeighted
Score
1. Strategic Fit 3 2 6
2. Probability of technical success 2 2 4
3. Financial risk 2 1 2
4. Potential profit 3 3 9
5. Strategic leverage 1 1 1
Score = 22
Project Gemini
Category Importance ScoreWeighted
Score
1. Strategic Fit 3 3 9
2. Probability of technical success 2 2 4
3. Financial risk 2 2 4
4. Potential profit 3 3 9
5. Strategic leverage
1 2 2
Score = 28
Case Study 3.2 103
(continued)
0002
0001
0270
6499
84
Project Management: Achieving Competitive Advantage, Second Edition, by Jeffrey K. Pinto. Published by Prentice Hall. Copyright © 2010 by Pearson Education, Inc.

104 Chapter 3 • Project Selection and Portfolio Management
Project Janus
Initial investment = $250,000
Life of the project = 5 years
Anticipated stream of future cash flows:
Year 1 = $50,000
Year 2 = 100,000
Year 3 = 100,000
Year 4 = 200,000
Year 5 = 75,000
Calculated NPV = $60,995
Project Gemini
Initial investment = $400,000
Life of the project = 3 years
Anticipated stream of future cash flows:
Year 1 = 75,000
Year 2 = 250,000
Year 3 = 300,000
Calculated NPV = $25,695
rate of 3% over the lives of the two projects, their findingsare shown as follows:
The analyses of the two projects by different meanshad yielded different findings. The scoring model indi-cated that Project Gemini was the best alternative, and thefinancial screening favored the higher project NPV ofProject Janus. Phyllis was due to present her recommenda-tions to the full top management team this afternoon,seemingly armed with more questions than answers.
Questions for Discussion
1. Phyllis has called you into her office to help her makesense of the contradictions in project evaluation. Howwould you explain the reasons for this divergence ofopinion from one technique to the next? What are thestrengths and weaknesses of each screening method?
2. Choose the project that you feel, based on the aboveanalysis, Nova Western should select. Defend yourchoice.
3. What does the above case suggest to you about the useof project selection methods in organizations? Howwould you resolve the contradictions found in thisexample?
Internet Exercises
1. Go to the Web sites for the following organizations:a. Merck & Company Pharmaceuticals at www.merck.com/
about/b. Boeing Corporation at www.boeing.com/companyoffices/
aboutus/index.htmlc. Rolls-Royce, Plc. at www.rolls-royce.comd. ExxonMobil, Inc. at www.exxonmobil.com/Corporate/
about.aspxBased on your review of the companies’ posted mission andstrategic goals, what types of projects would you expect them topursue? If you worked for one of these firms and sought to
maintain strategic alignment with their project portfolio, whatproject options would you suggest?
2. Access the Web site www-01.ibm.com/software/awdtools/port-folio/. What is IBM’s philosophy regarding project portfoliomanagement as demonstrated by this software product? Whatdo they mean by their goal of helping clients “align their IT andsystems investments with business priorities”?
3. Internet Reading: Pellegrinelli, S. (1997), “Programme manage-ment: Organizing project-based change,” International Journalof Project Management, 15, 141–49. This article can be found onthe Prentice Hall Companion Website.
Notes
1. Foti, R. (2002),“Priority decisions,” PMNetwork, 16(4), 24–29;Crawford, J. K. (2001), “Portfolio Management: Overview andBest Practices,” in J. Knutson (Ed.), Project Management forBusiness Professionals. New York: Wiley, pp. 33–48.
2. Pascale, S., Carland, J. W., and Carland, J. C. (1997), “A com-parative analysis of two concept evaluation methods for newproduct development projects,” Project Management Journal,28(4); Wheelwright, S. C. and Clark, K. B. (1992), “Creatingproject plans to focus product development,” HarvardBusiness Review, March–April.
3. Souder, W. E. and Sherman, J. D. (1994), Managing NewTechnology Development. New York: McGraw-Hill; Souder,
W. E. (1983), Project Selection and Economic Appraisal. NewYork: Van Nostrand Reinhold.
4. Meredith, J. R. and Mantel, Jr., S. J. (2003), ProjectManagement, 5th ed. New York: Wiley.
5. Khorramshahgol, R., Azani, H., and Gousty, Y. (1988), “Anintegrated approach to project evaluation and selection,” IEEETransactions on Engineering Management, EM-35 (4); Raz,T. (1997), “An iterative screening methodology for selectingproject alternatives,” Project Management Journal, 28(4).
6. Cleland, D. I. (1988),“Project stakeholder management,” in D. I.Cleland and W. R. King (Eds.), Project Management Handbook,2nd ed. New York: Van Nostrand Reinhold, pp. 275–301.
000200010270649984
Project Management: Achieving Competitive Advantage, Second Edition, by Jeffrey K. Pinto. Published by Prentice Hall. Copyright © 2010 by Pearson Education, Inc.

7. Artto, K. A., Martinsuo, M., and Aalto, T. (Eds.) (2001), ProjectPortfolio Management: Strategic Management Through Projects.Helsinki: Project Management Association; Artto, K. A. (2001),“Management of project-oriented organization—Conceptualanalysis,” in Artto, K. A., Martinsuo, M., and Aalto, T. (Eds.)(2001), Project Portfolio Management: Strategic ManagementThrough Projects. Helsinki: Project Management Association.
8. Pinto, J. K. and Millet, I. (1999), Successful Information SystemImplementation: The Human Side, 2nd ed. Newtown Square,PA: Project Management Institute.
9. Saaty, T. L. (1996), The Analytical Hierarchy Process.Pittsburgh, PA: RWS Publications.
10. Millet, I. (1994), “Who’s on first?” CIO Magazine, Feb. 15,pp. 24–27.
11. Mian, S. A. and Dai, C. X. (1999), “Decision-making over theproject life cycle: An analytical hierarchy approach,” ProjectManagement Journal, 30(1), 40–52.
12. Foreman, E. H., Saaty, T. L., Selly, M., and Waldron, R. (1996),Expert Choice. McLean, VA: Decision Support Software.
13. Millet, I. and Schoner, B. (2005), “Incorporating negative val-ues into the Analytical Hierarchy Process,” Computers andOperations Research,(12), 3163–3173.
14. Evans, D. A. and Souder, W. E. (1998), “Methods for selectingand evaluating projects,” in Pinto, J. K. (Ed.), The ProjectManagement Institute Project Management Handbook. SanFrancisco, CA: Jossey-Bass.
15. Reilly, F. K. (1985), Investment Analysis and PortfolioManagement, 2nd ed. Chicago, IL: The Dryden Press.
16. Keown, A. J., Scott, Jr., D. F., Martin, J. D., and Petty, J.W.(1996), Basic Financial Management, 7th ed. Upper SaddleRiver, NJ: Prentice Hall; Evans, D. A. and Souder, W. E., ibid.
17. Dixit, A. K. and Pindyck, R. S. (1994), Investment underUncertainty. Princeton, NJ: Princeton University Press;Huchzermeier, W. and Loch, C. H. (2001), “Project manage-ment under risk: Using the real options approach to evaluateflexibility in R&D,” Management Science, 47(1), 85–101.
18. Meredith, J. R. and Mantel, S. J. (2003), ibid.19. Dye, L. D. and Pennypacker, J. S. (Eds.) (1999), Project
Portfolio Management: Selecting and Prioritizing Projects forCompetitive Advantage. West Chester, PA: Center for BusinessPractices.
20. Elton, J. and Roe, J. (1998), “Bringing discipline to projectmanagement,” Harvard Business Review, March–April.
21. Artto, K. A., (2001), ibid.22. Lehtonen, M. (2001), “Resource allocation and project port-
folio management in pharmaceutical R&D,” in Artto, K. A.,Martinsuo, M., and Aalto, T. (Eds.), (2001), Project PortfolioManagement: Strategic Management Through Projects.Helsinki: Project Management Association, pp. 107–140.
23. Brown, S. L. and Eisenhardt, K. M. (1997), “The art of contin-uous change: Linking complexity theory and time-paced evo-lution in relentlessly shifting organizations,” AdministrativeScience Quarterly, 42(1), 1–34.
24. Cooper, R. and Edgett, S. (1997), “Portfolio management innew product development: Lesson from the leaders I,”Research Technology Management, 40(5), 16–28; Longman,A., Sandahl, D., and Speir, W. (1999),“Preventing project pro-liferation,” PMNetwork, 13(7); Dobson, M. (1999), TheJuggler’s Guide to Managing Multiple Projects. NewtownSquare, PA: Project Management Institute.
Notes 105
0002
0001
0270
6499
84
Project Management: Achieving Competitive Advantage, Second Edition, by Jeffrey K. Pinto. Published by Prentice Hall. Copyright © 2010 by Pearson Education, Inc.