programme of activities design document (poa-dd) -...
TRANSCRIPT
UNFCCC/CCNUCC
CDM – Executive Board Page 1
PROGRAMME DESIGN DOCUMENT FORM FOR
SMALL-SCALE CDM PROGRAMMES OF ACTIVITIES (F-CDM-SSC-PoA-DD)
Version 02.0
PROGRAMME OF ACTIVITIES DESIGN DOCUMENT (PoA-DD)
PART I. Programme of activities (PoA)
SECTION A. General description of PoA
A.1. Title of the PoA
Pakistan Domestic Biogas Programme, CDM Programme of Activities
Version: 09
Date: 10/09/2012
A.2. Purpose and general description of the PoA
The goal of the Pakistan Domestic Biogas Programme, CDM Programme of Activities is to improve the
quality of life of rural farmers, particularly women, and their livelihoods in Pakistan through exploiting
the market and non-market benefits of domestic biogas. The Pakistan Domestic Biogas Programme
(PDBP) will be implemented through the development of commercially viable domestic biogas sector.
PDBP aims to construct domestic biogas plants at household level. These biogas plants displace the non
renewable biomass being used as domestic energy sources with biogas produced from the biogas plant
using animal manure. The biogas will be used as a fuel for cooking. Following the methodological
guidance under Programme of Activities (PoA), only the replacement of non renewable biomass (NRB)
is counted as emission reduction under the CDM.
The feasibility study of biogas programme estimates that at least 5 million domestic biogas plants can be
installed in Pakistan. This PoA envisions a period of 10 years to establish a biogas sector with the target
of installing 300,000 biogas plants. This vision can only be realized if the programme can be developed
as CDM project because the carbon revenue is the major source of fund for this project. Based on the
nature of the programme, this will be developed as CDM Programme of Activity (PoA). The total
estimated CER from this POA is around 783,000 CER per year once all these plants are installed.
The programme will be implemented through a modular approach. Each module will be carried out to fit
within a small-scale CDM Project Activity (CPA), which generates no more than 45 MWth power. The
financing of each module will be achieved through a combination of carbon financing and self financing
by users and through the use public sector funding for meeting technical assistance to the extent required.
The first module will be implemented in Punjab Province. Embassy of the Kingdom of Netherlands has
agreed to provide partial financial support to the project in Punjab with the remainder of the funds
coming from carbon financing.
Each CPA will include maximum of 20,000 domestic biogas plants, which will generate no more than
45MWth power output. The total estimated CPAs under this POA are 20. Total power output from each
CPA will be calculated as per described in section B.2 of Part II of this PoA.
Biogas construction companies (BCCs) promoted by the PDBP will be responsible for services such as
construction, after sales service, and user training.
UNFCCC/CCNUCC
CDM – Executive Board Page 2
PDBP promotes biogas plants of 4-15 m
3 capacity. The cost of the biogas plants varies depending upon
the size of the plant. In December 2010, the average cost of the 10 m3 biogas plant is 43,933
1. To ensure
the quality of the plants, the programme provides PKR7,500 per plant per household as a quality-
ensuring discount (QED)2. The amount of QED would be reviewed regularly and may be varied based on
the review. This will work as the carbon rebate and an incentive to households that install the biogas
plant. The households invest the remaining cost, paying 79% to 88% of the price of the digester, and are
the owner of these plants. Each biogas household agrees by contract to transfer the right to the CO2
emission reductions to PBDP/RSPN.
Netherlands Development Organization (SNV) and Winrock International provide the technical support
for this programme.
As the carbon revenue will be realized in the later stages of the programme, PDBP will look for the
upfront carbon payment for the deficit amount to implement the project during the first 4 years of the
project.
This project targets the households who are currently using energy sources like non-renewable biomass
(firewood) for cooking purposes and have at least 2 buffaloes or cattle.
Major activities under the PoA are as follows:
1. Set up of the framework for the implementation of number of CPAs
2. Launch the CPAs in a modular approach in the provinces with a good market for biogas plant.
3. Design and facilitate to maintain the data base system (electronic and hard copy) to ensure
there is no double counting of the biogas plants.
Voluntary action
The proposed PoA is a voluntary action by PDBP/RSPN, the coordinating/managing entity of this PoA.
The implementation of the programme is not mandatory.
In addition to the quality ensuring discount from the programme, the household also invest for the
construction of the biogas plant. So the installation of biogas plants is a voluntary action by the
households.
Contribution for the sustainable development
The biogas plant has multiple benefits in terms of health, environment, gender etc. The benefits can be
categorized into three levels;
Household levels- Biogas provides energy source for cooking and lighting, improves health
through better indoor air quality and reduce the workload of women.
At the national level- It replaces the use of non renewable biomass and contributes towards forest
conservation. The biogas sector creates employment at local level and contributes towards the
development of responsible private sector enterprises.
At the global level- it reduces the green house gas emission and contributes towards the climate
change mitigation.
Biogas is such a product that contributes to almost all the aspects of the MDGs.
1 PDBP Guidelines 3 – Determination of Plant cost, 2011
2 PDBP Guidelines 1- Quality Ensuring Discount Delivery Mechanism, 2011
UNFCCC/CCNUCC
CDM – Executive Board Page 3
Table 1: MDGs and Biogas programs
Millennium
Development Goals
(MDGs)
Domestic Biogas Contribution
Eradicate extreme
poverty and hunger
Through employment and increased agriculture yield, improved sanitation
and integrated animal husbandry practices
Achieve universal
primary education
Direct impact through reduced drudgery (time collecting firewood, for
example), especially for girls, as well as access to brighter light
Promote gender equality
and empower women
Reduces the burden of collecting firewood on women and allows the
alternative allocation of precious time of, in particular, the female members
of the household, empowers women by offering opportunities in the
development of the National Domestic Biogas Programme as operators of
biogas plants, construction companies.
Reduce child mortality Reduced air pollution, associated respiratory diseases and accidents from
open fire, improved sanitation and hygiene education, reduced parasitic
infections, diarrhoea and other water and vector-borne diseases
Improve maternal health Direct impact through reduced drudgery, improved indoor environment, etc.
Combat HIV/AIDS,
malaria and other
diseases
Biogas stoves replace conventional cook stoves and energy sources, virtually
eliminating indoor smoke pollution and, hence, the related health risks (e.g.,
respiratory and eye diseases, burning accidents of women and children)
Ensure environmental
sustainability
Reduced deforestation, controlled GHG emission by replacing the firewood
for cooking, and recycled nutrients and restored soil fertility
A.3. CMEs and participants of PoA
Rural Support Programmes Network (RSPN) is the coordinating/managing entity (CME) of the Pakistan
Domestic Biogas Programme -PoA.
RSPN was registered in 2001 under Pakistan‟s Companies Ordinance (1984) as a non-profit company by
the Rural Support Programmes (RSPs) of Pakistan. RSPN is a network of 11 RSPs (AJKRSP, AKRSP,
BRSP, GBTI, NRSP, PRSP, SRSO, SGA, SRSP, FIDA and TRDP), and N-IRM. The RSPs involve poor
communities (mainly but not exclusively rural) in improved management and delivery of basic services
through a process of social mobilization. RSPN is a strategic platform for the RSPs: it provides capacity
building support to them and assists them in policy advocacy and donor linkages. Currently, the RSPs
have a presence in 108 out of 131 districts (districts include those in the four provinces, Gilgit-Baltistan
and AJK) and 2 out of 13 Federally Administered Tribal Areas (FATA) and Frontier Regions. The RSPs
collectively work with a rural membership of community organizations of 4.8 million rural households.
Project Participants under PoA:
Rural Support Programmes Network is the Project Participant.
UNFCCC/CCNUCC
CDM – Executive Board Page 4
A.4. Party(ies)
Name of Party involved (host)
indicates a host Party
Private and/or public
entity(ies) project participants
(as applicable)
Indicate if the Party involved
wishes to be considered as
project participant (Yes/No)
Pakistan (Host) Rural Support Programmes
Network –Private entity (Project
Participant)
No
The contact information on entity responsible for the PoA is attached as Appendix 1.
A.5. Physical/ Geographical boundary of the PoA
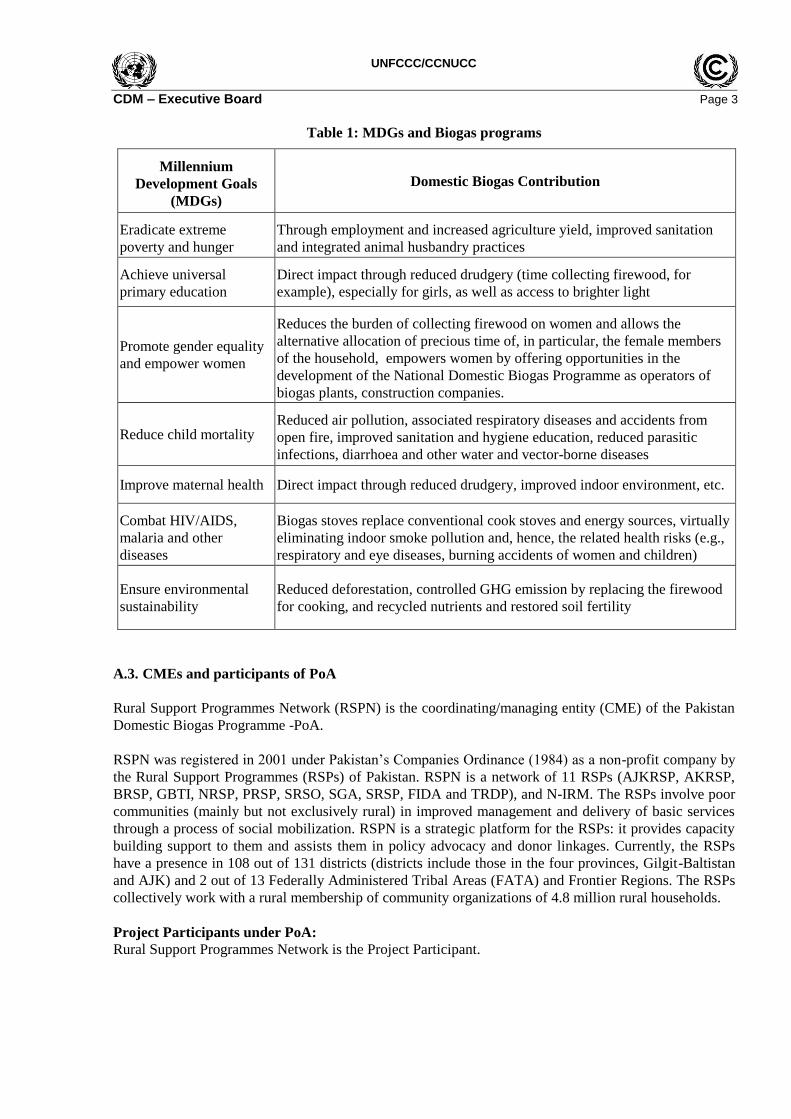
The Pakistan Domestic Biogas Programme -PoA is located in the Pakistan. The geographical boundary of
the PoA will be the Pakistan, which is located within the latitudes 23°35‟ and 37°05‟ N, and longitudes
60°50‟ and 77°50‟ E.3. The PoA can include biogas plants constructed all over Pakistan.
Figure 1: Map of the Pakistan
A.6. Technologies/measures
The technologies used in the PoA are domestic biogas plants of fixed dome type. Proven in several other
countries, the technology is robust, reliable and requires little maintenance. The concrete – masonry
3 http://www.pakistan.gov.pk (About Pakistan Tab)
UNFCCC/CCNUCC
CDM – Executive Board Page 5
structure can be constructed with locally available materials and skills, and typically has a life of over 20
years. The programme covers the biogas plants with capacity ranging from 4-15 m3.
The biogas plants will provide biogas to meet the thermal energy needs of households which have at least
2 heads of cattle (cows or buffaloes). These plants will be of fixed dome design constructed only as per
the specifications in the “Modified GGC Model Biogas Plant for Pakistan, Construction Manual,
February 2009”. All the plants will follow the quality standards set by the program. (Please see “PDBP
Program Guidelines, February 2011- Guideline 2: Quality Control”). The GGC 2047 model was initially
designed and developed in Nepal and slight modified for the local context in Pakistan. This model is
considered to be reliable, well functioning, simple, durable and with low maintenance cost.
All the biogas stoves included in each CPA will replace the use of non renewable biomass with biogas
produced from the biogas plant using animal manure.
The biogas plants are based on a uniform technical design and are manufactured and installed following
established technical standards. This model is designed for cow/buffalo manure as a feed material. So the
households feed cow/buffalo dung mixed with water into the biogas plant, which through anaerobic
digestion produces biogas. The biogas produced in the digester goes to the kitchen through a pipe. The
biogas contains around 60% of methane and burns with clear blue flame.
The biogas digester is made up of several interconnected parts. The specific role of each component is
summarized below:
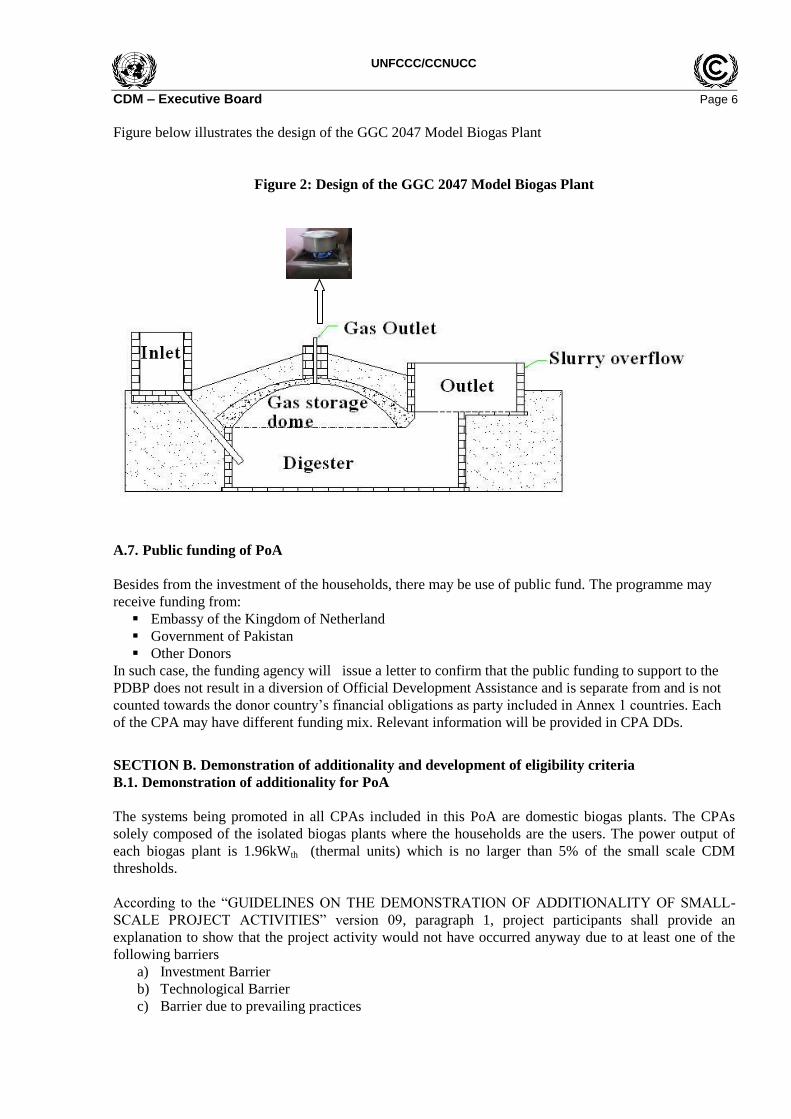
Inlet – The main purpose of the inlet is to mix organic material and water into homogenized mixture.
This mixture is fed into the digester via an inlet pipe. A manual mixer in the inlet helps mix the organic
material and water thoroughly.
Digester – The digester holds the mixture of manure and water while microorganism activity produces
biogas in an anaerobic condition. It is cylindrical in shape and is made of brick masonry with a concrete
dome cover.
Dome - The purpose of the dome is to collect the gas produced in the digester. This is plastered in
several layers and painted with a special paint in order to make it gas tight. Gas accumulates under the
dome creating pressure and pushing down the level of the slurry and increasing the slurry level in the
connected slurry tank. It is the difference in slurry levels between the slurry tank and the inside of the
dome that maintains the pressure to push the gas into the outlet pipe and into the kitchen.
The Main Valve - The main gas valve releases the collected gas under the dome to the biogas stove.
Biogas Stove: Gas is conveyed to the biogas stove in the kitchen in galvanized iron (GI) pipes. Biogas
produced burns through the biogas stove for cooking purpose.
Water Drain – The water drain is put in at the lowest profile of the GI pipe conveying gas to the kitchen.
Its purpose is to release any condensed water from the pipeline. It needs to be opened periodically to
release condensed water.
Slurry Tank: The slurry tank holds the slurry that the gas pressure from under the dome displaces. This
slurry overflows into a composting tank as more manure is fed into the digester. The slurry (bio slurry)
can either be used directly as a fertilizer in its liquid form or can be turned more solid after it has been
composted with other organic material.
UNFCCC/CCNUCC
CDM – Executive Board Page 6
Figure below illustrates the design of the GGC 2047 Model Biogas Plant
Figure 2: Design of the GGC 2047 Model Biogas Plant
A.7. Public funding of PoA
Besides from the investment of the households, there may be use of public fund. The programme may
receive funding from:
Embassy of the Kingdom of Netherland
Government of Pakistan
Other Donors
In such case, the funding agency will issue a letter to confirm that the public funding to support to the
PDBP does not result in a diversion of Official Development Assistance and is separate from and is not
counted towards the donor country‟s financial obligations as party included in Annex 1 countries. Each
of the CPA may have different funding mix. Relevant information will be provided in CPA DDs.
SECTION B. Demonstration of additionality and development of eligibility criteria
B.1. Demonstration of additionality for PoA
The systems being promoted in all CPAs included in this PoA are domestic biogas plants. The CPAs
solely composed of the isolated biogas plants where the households are the users. The power output of
each biogas plant is 1.96kWth (thermal units) which is no larger than 5% of the small scale CDM
thresholds.
According to the “GUIDELINES ON THE DEMONSTRATION OF ADDITIONALITY OF SMALL-
SCALE PROJECT ACTIVITIES” version 09, paragraph 1, project participants shall provide an
explanation to show that the project activity would not have occurred anyway due to at least one of the
following barriers
a) Investment Barrier
b) Technological Barrier
c) Barrier due to prevailing practices

UNFCCC/CCNUCC
CDM – Executive Board Page 7
d) Other barriers
As per the Paragraph 2 of the guidelines, documentation of barriers is not required for the positive list of
technologies and project activity types that are defined as automatically additional for project sizes up to
and including the small-scale CDM thresholds (e.g. installed capacity up to 15 MW). The positive list
also comprises of:
Project activities solely composed of isolated units where the users of the technology/measure
are households or communities or Small and Medium Enterprises (SMEs) and where the size1 of
each unit is no larger than 5% of the small-scale CDM thresholds;
Domestic biogas plants being promoted in this PoA fulfil the criteria of the positive list.
Isolated renewable technology units,
The users are households, and
The power output of each plant is 1.96kWth (thermal units) which is not larger than 5% of the
small-scale CDM thresholds.
Biomass is the main source of fuel for cooking in Pakistan. Baseline scenario is described in section B.4
of Part II of this PoA. Installation of biogas plant will replace the use of non renewable biomass being
used for cooking. In the absence of the POA, households continue using non renewable biomass for
cooking that result into GHG emission. Hence the PoA is additional.
B.2. Eligibility criteria for inclusion of a CPA in the PoA
The eligibility criteria for inclusion of a SSC-CPA in the PoA are:
Table 2: Eligibility Criteria for inclusion of a SSC-CPA
S.
No.
Eligibility Criteria
1 All biogas plants listed in the CPA should be the household biogas plants of size ranges from 4-
15 m3.
2 All the biogas stoves included in each CPA will replace the use of non renewable biomass. The
prior construction survey form will be completed for all households constructing biogas plants.
Data on use of biomass in the baseline situation will be collected. The biogas plants will be of
fixed dome design constructed only as per the specifications in the “Modified GGC Model Biogas
Plant for Pakistan, Construction Manual, February 2009”. All the plants will follow the quality
standards set by the program. (Please see “PDBP Program Guidelines, February 2011- Guideline
2: Quality Control”).
3 A CPA will include maximum of 20,000 plants to fit within a small-scale CPA activity which
generates no more than 45 MWth power.
4 Each biogas plant listed in the CPA will have a unique number. For example the unique code
number of the plants constructed in Faisalabad will be FSD-P000001, FSD-P000002 and so on.
„FSD‟ represents Faisalabad, one of the districts in Panjab and „P‟ represents for Punjab province.
Similarly for the plants constructed in Sargodha district the plant code number will be like SGD-
P000001, SDG-P000002 and so on. Data base will also invariably include the GPS coordinates of
the plant location which will also be unique for each plant. So there will be no risk of double
counting.
5 All biogas plants listed in the CPA should be located in Pakistan.
6 All biogas plants listed in the CPA should be implemented under the PDBP
7 All CPAs should perform the CPA level stakeholder consultation
UNFCCC/CCNUCC
CDM – Executive Board Page 8
8 All CPAs should be verified to prevent double counting and are not registered as a separate CDM
project activity, nor as part of another registered CDM PoA.
9 The households installing the biogas plants are the owner of the plants. They should sign an
agreement with the project participant to transfer the carbon credit rights of these plants
10 Confirmation that SSC-CPA is not a de-bundled component of another large-scale CPA or CDM
project activity as per the latest guidance given in the CDM EB. As per the Guidelines on
assessment of de-bundling for SSC project activities, the biogas programme SSC CPA DD need
not justify de-bundling refer section C of Part I of the PoA DD.
11 Starting date of all CPAs will be after the commencement of validation of Programme of
activities i.e. the date on which the CDM-POA-DD is first published for the global stakeholder
consultation. In this case the CDM –POA-DD was first published on December 11, 2010, and
the start date of any CPA will not be prior to this date. The documentary evidence presented for
start date of CPA 1 and subsequent CPAs will include date of commencement of the validation of
the PoA; and data of launch of CPA as signified by substantial investment and start of
construction,
12 All the CPAs will comply with the CDM methodology used for this PoA i.e. AMS I.E version 4.
Applicability criteria for the methodology will be
Each CPA will be with within the limit of 45MWth (thermal units) power output i.e.
maximum number of plants included in any CPA will be 20,000
the end user technology will be biogas stove, that replaces the use of non renewable
biomass
Each CPA will demonstrate that non-renewable biomass has been used in the baseline
since 31 December 1989.
Leakage in each CPA will be accounted by multiplying the quantity of biomass that is
substituted or replaced (By) by a net to gross adjustment factor of 0.95.
13 All CPAs will meet the requirements pertaining to the demonstration of additionality of the PoA
and typical CPA. Each CPA must demonstrate the project‟s additionality by applying relevant
guidelines and the standards of UNFCCC i.e.‟ Standard for Demonstration of Additionality,
Development of Eligibility Criteria and application of multiple methodologies for Programme of
Activities‟; Guidelines for the demonstration of additionality of small scale project activities.
Conditions for the additionality would be:
The biogas plants installed under each CPA would be isolated units.
The users of the plants would be households.
The size of the each unit will be no larger than 5% of the small scale CDM thresholds.
14 Target group of all the CPAs will be cattle (cows/buffalos) holding household in the rural and
semi urban areas, which are using non renewable biomass as cooking fuel; and interested to use
the biogas for cooking purpose. These households will be distributed across Pakistan. Private
sector Biogas Construction Companies trained by PDBP will install the biogas plants as per the
prescribed design and quality parameters at these households. PDBP technician will do the
quality inspection.
15 If funding from annex -1 parties is received for any CPA, it should be confirmed that funding
from Annex -1 parties does not result in a diversion of official development assistance.
16 Sampling requirements are in accordance with the “Standard for sampling and surveys for CDM
project activities and programme of activities.”
B.3. Application of methodologies
UNFCCC/CCNUCC
CDM – Executive Board Page 9
AMS-I.E. Version 4 “Switch from Non-Renewable Biomass for thermal applications by the user” will be
used as baseline and monitoring methodology for SSC-CPA included in this PoA. This methodology is
approved by the CDM EB on its 56th meeting. This methodology is approved by the EB for the
application of PoA. (Meeting Report of EB37, paragraph 26)
SECTION C. Management system
Rural Support Programme Network is the coordinating and managing entity of this PoA. PDBP/RSPN
has an office set up in Islamabad and project offices will be established in the respective project areas.
An Area Office for the implementation of CPA 1 is already established in Faisalabad.
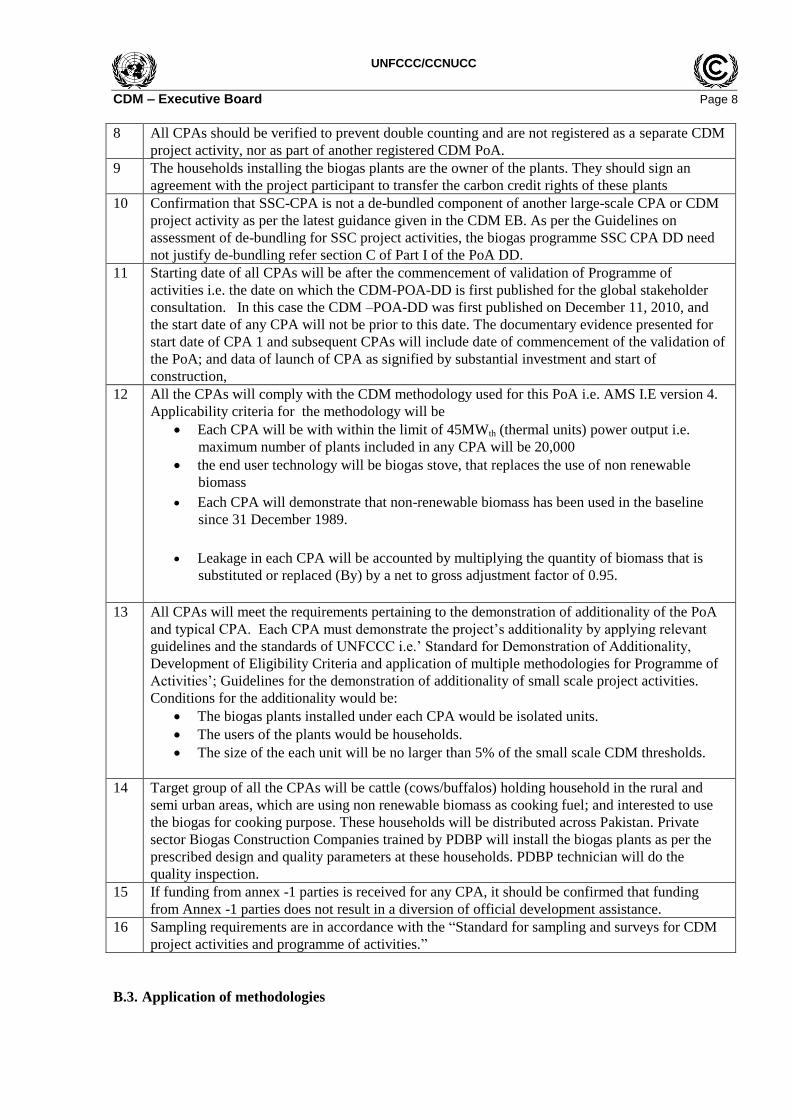
PDBP has 23 regular, qualified and competent staffs including;
Program Manager 1,
Area Manager 1,
Finance Officer 1,
Training and extension officer 1,
Management Information System Officer 1,
Communication officer 1,
Marketing officer 1,
Biogas technicians 7 and
Necessary administrative/support staffs.
Manager, Special Projects from RSPN provides the overall supervision to the program. Chief Executive
Officer of RSPN provides the overall leadership to the program.
Figure: 3- Staffing Structure of the PDBP is as below
Two International Advisors from SNV and Winrock International provide advisory services to the PDBP.
SNV (www.snvworld.org) is a leading organisation worldwide in establishing a market led domestic
biogas sector. With its extensive experience in managing and advising the domestic biogas sector in
several countries in Asia and more recently in Africa, SNV brings in a wealth of knowhow and lessons
UNFCCC/CCNUCC
CDM – Executive Board Page 10
learnt. Similarly Winrock International (www.winrock.org) brings its expertises and experiences in
carbon financing and micro financing of energy services. RSPN (www.rspn.org.pk) is the network of 11
Rural Support Programmes in Pakistan and brings strong linkages with the rural households who could
be potential biogas plant users.
Area/project office will be mostly responsible for the implementation of the biogas programme.
Islamabad office works as the secretariat for the PDBP Steering Committee, provide the managerial
support for the programme, carry out the coordination among the relevant stakeholders and develop the
subsequent CPAs/modules of the programme.
As PDBP follows the standardized approaches for training, plant design, quality control and data
management systems; inclusion of CPA into the PoA would be done by ensuring each CPA meets all
requirements and eligibility criteria before inclusion in the registered PoA.
The first CPA is being implemented by RSPN, the coordinating and managing entity. Future CPAs would
either be implemented by RSPN or by other implementing agencies. In either case PDBP/RSPN will be
involved from the very beginning of CPA set up. Experiences and knowledge resources of CPA 1 will be
shared/used to design and implement the other CPAs effectively and efficiently.
PoA Management System
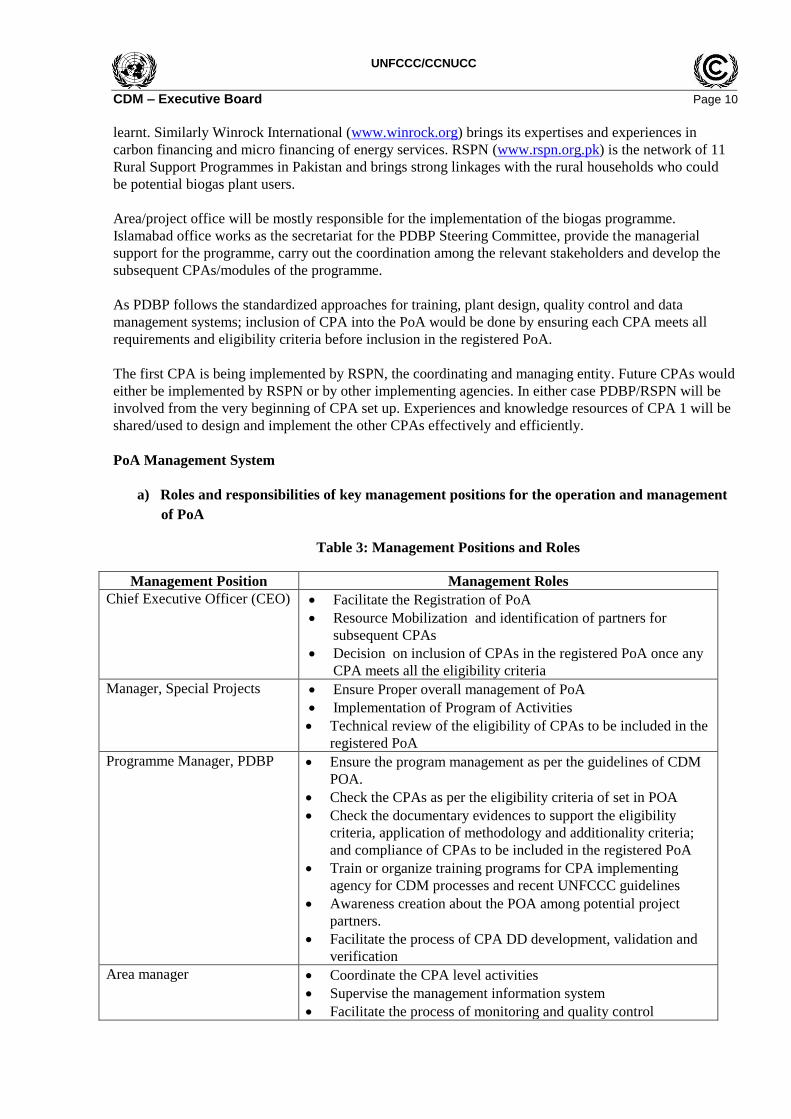
a) Roles and responsibilities of key management positions for the operation and management
of PoA
Table 3: Management Positions and Roles
Management Position Management Roles
Chief Executive Officer (CEO) Facilitate the Registration of PoA
Resource Mobilization and identification of partners for
subsequent CPAs
Decision on inclusion of CPAs in the registered PoA once any
CPA meets all the eligibility criteria
Manager, Special Projects Ensure Proper overall management of PoA
Implementation of Program of Activities
Technical review of the eligibility of CPAs to be included in the
registered PoA
Programme Manager, PDBP Ensure the program management as per the guidelines of CDM
POA.
Check the CPAs as per the eligibility criteria of set in POA
Check the documentary evidences to support the eligibility
criteria, application of methodology and additionality criteria;
and compliance of CPAs to be included in the registered PoA
Train or organize training programs for CPA implementing
agency for CDM processes and recent UNFCCC guidelines
Awareness creation about the POA among potential project
partners.
Facilitate the process of CPA DD development, validation and
verification
Area manager Coordinate the CPA level activities
Supervise the management information system
Facilitate the process of monitoring and quality control
UNFCCC/CCNUCC
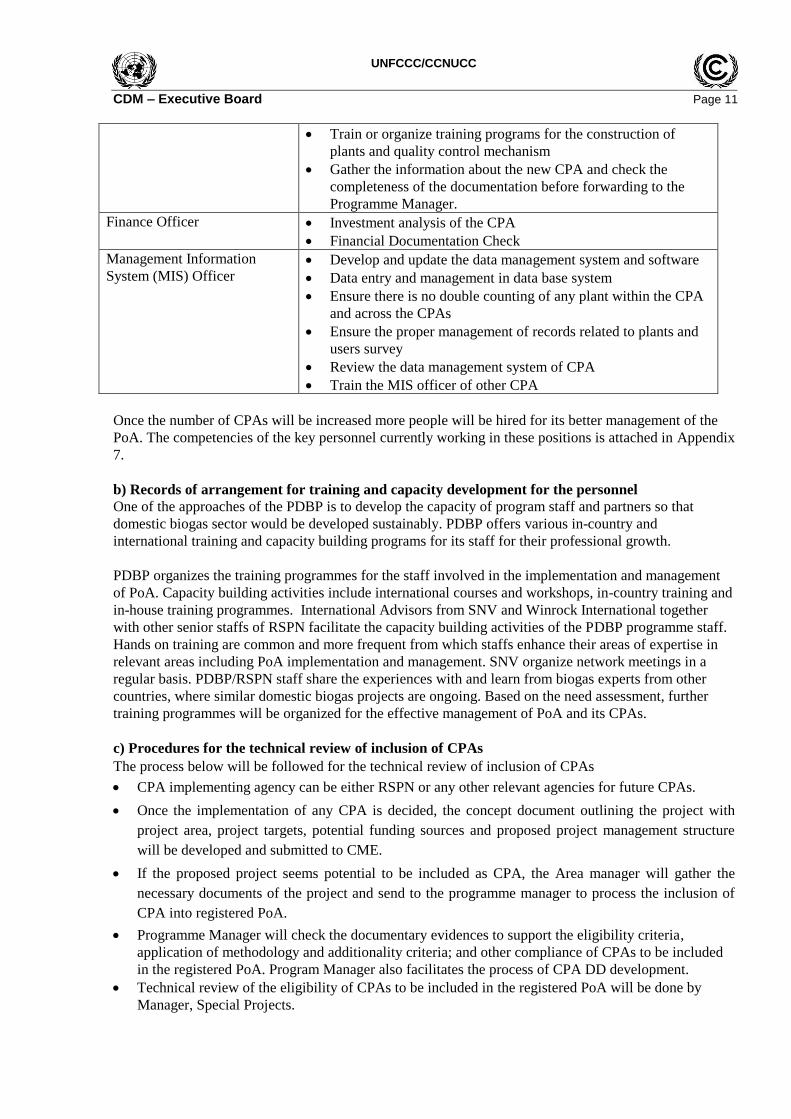
CDM – Executive Board Page 11
Train or organize training programs for the construction of
plants and quality control mechanism
Gather the information about the new CPA and check the
completeness of the documentation before forwarding to the
Programme Manager.
Finance Officer Investment analysis of the CPA
Financial Documentation Check
Management Information
System (MIS) Officer Develop and update the data management system and software
Data entry and management in data base system
Ensure there is no double counting of any plant within the CPA
and across the CPAs
Ensure the proper management of records related to plants and
users survey
Review the data management system of CPA
Train the MIS officer of other CPA
Once the number of CPAs will be increased more people will be hired for its better management of the
PoA. The competencies of the key personnel currently working in these positions is attached in Appendix
7.
b) Records of arrangement for training and capacity development for the personnel
One of the approaches of the PDBP is to develop the capacity of program staff and partners so that
domestic biogas sector would be developed sustainably. PDBP offers various in-country and
international training and capacity building programs for its staff for their professional growth.
PDBP organizes the training programmes for the staff involved in the implementation and management
of PoA. Capacity building activities include international courses and workshops, in-country training and
in-house training programmes. International Advisors from SNV and Winrock International together
with other senior staffs of RSPN facilitate the capacity building activities of the PDBP programme staff.
Hands on training are common and more frequent from which staffs enhance their areas of expertise in
relevant areas including PoA implementation and management. SNV organize network meetings in a
regular basis. PDBP/RSPN staff share the experiences with and learn from biogas experts from other
countries, where similar domestic biogas projects are ongoing. Based on the need assessment, further
training programmes will be organized for the effective management of PoA and its CPAs.
c) Procedures for the technical review of inclusion of CPAs
The process below will be followed for the technical review of inclusion of CPAs
CPA implementing agency can be either RSPN or any other relevant agencies for future CPAs.
Once the implementation of any CPA is decided, the concept document outlining the project with
project area, project targets, potential funding sources and proposed project management structure
will be developed and submitted to CME.
If the proposed project seems potential to be included as CPA, the Area manager will gather the
necessary documents of the project and send to the programme manager to process the inclusion of
CPA into registered PoA.
Programme Manager will check the documentary evidences to support the eligibility criteria,
application of methodology and additionality criteria; and other compliance of CPAs to be included
in the registered PoA. Program Manager also facilitates the process of CPA DD development.
Technical review of the eligibility of CPAs to be included in the registered PoA will be done by
Manager, Special Projects.
UNFCCC/CCNUCC
CDM – Executive Board Page 12
CEO of CME will take the decision to include the CPA into registered POA, in case the proposed
CPA meets all eligibility criteria, conditions of applicability of methodology and conditions of
additionality.
Once the number of CPA increased, more personnel will be hired for the effective management of
PoA.
(d) A record keeping system for each CPA under the PoA,
Each CPA is defined as consisting of digesters installed within a pre-defined area and within the limits of
a small-scale activity (with thermal power output of 45 MWth) under the programme in a number of
locations. Each CPA may be of different size based on the financial structure and the location of the
project. First CPA will be implemented by RSPN. Other subsequent CPAs may be implemented by either
RSPN or other implementing agencies, which will maintain the CPA level database.
Record keeping system
CME in coordination with the CPA will maintain an electronic data base of the installed biogas
plants under this PoA by assigning a unique code number to each plant.
Following Data of each CPA will be maintained at CME level.
o Name of the CPA implementing agency:
o Name of the Province where the CPA is implemented:
o Name of the Districts where the plants are/will be installed:
o Longitude and latitude of the each district, from where the plants to be included in particular
CPA:
o Details of all plants installed and to be included in the CPA in electronic data base: (Plant ID,
Customer Name, Address, GPS coordinates, plant installation date, plant size)
CME will provide the training for the data management and documentation for maintaining the
consistency in all CPAs.
Biogas users‟ Survey will be conducted by third party annually for each CPA. CME will provide
support in designing the Biogas Users‟ Surveys for consistency and to ensure that the sampling
guidelines of UNFCCC are followed properly.
CPA will provide the periodic reports of the implementation progress to CME.
Forms and formats developed in CPA 1 will be shared with other CPA for consistency.
All other relevant electronic data and documentation will be kept at CPA level and will be available
during the verification.
(e) A system/procedure to avoid double accounting e.g. to avoid the case of including a new CPA
that has been already registered either as a CDM project activity or as a CPA of another PoA,
As each plant will have unique plant code number, there will be no room for double counting. These
numbers will be associated with the GPS location of the plant.
Avoiding double counting within a CPA
A Unique code number associated with the GPS location of the plant will be assigned to each plant. The
electronic data base system of PDBP is such that; if the GPS code entered is already in the system, an
error message appears and reads as “The data you requested to enter would create duplicate values and
the record would not be saved so please check the value”. So there is no chance of double counting. Hard
copies of the details of each plant are also maintained at CPA level. The verification can be done any
time for each plant.
Avoiding double counting across of this PoA
UNFCCC/CCNUCC
CDM – Executive Board Page 13
Data management system is already developed for CPA 1 and that will be shared with other CPAs to
maintain the consistency. All CPAs will maintain the electronic data base of the installed plants and
share with CME. Electronic Data base of all the CPAs will be synchronized at CME level. So there is no
chance of double counting across CPAs within the PoA.
Avoiding double counting with other similar CDM projects of PoA (if any)
As of June 30, 2012; there is no other domestic biogas CDM project or PoA registered in Pakistan. To
ensure that the biogas plants included in other CDM projects (if any in future) are not included in any
CPA or vice-versa; information will also be regularly checked in the UNFCCC website. If any similar
project is registered, CME work with the project participant of registered CDM project to make the
arrangement about the data sharing to avoid double counting. CME will regularly coordinate with the
Designated National Authority (DNA) and the CDM Cell of Pakistan to find out if any other CDM or
voluntary carbon projects are in process of registration. If found any, CME will coordinate with the
respective project participants to make arrangement for data sharing to avoid double counting.
(f)The SSC-CPA included in the PoA is not a de-bundled component of another CDM programme
activity (CPA) or CDM project activity.
As per the provision of the Guidelines on assessment of de-bundling for SSC project activities, if each of
the independent system included in the CPA of a PoA is no greater than 1% of the Small Scale
thresholds defined by the methodology applied, then that CPA of PoA is exempted from performing de-
bundling check. In this project each biogas plant has a capacity of 1.96 kWth which is less than 1% of
the threshold. So the SSC –CPA is not a de-bundled component of another programme activity (CPA) or
CDM project activity.
(g)The provisions to ensure that those operating the CPA are aware of and have agreed that their
activity is being subscribed to the PoA;
While receiving the quality ensuring discount from the programme, the household (owner of the biogas
plant), signs an agreement with project proponent of each CPA and transfers the legal rights of carbon
credit to the project proponent.
At the CPA level, all the CPAs for the biogas project will be managed or coordinated by PBDP/RSPN,
which is also the coordinating entity for this PoA.
(h) System to check and control the state of verification of each CPA
Each CPA will be verified by the DOE. CME will maintain the database of various status of each CPA
included in the POA. CME will;
Check the status of verification of each CPA regularly.
Maintain all monitoring reports of all CPAs in accordance with the record keeping system identified
in the CDM-POA-DD
Select the DOE for the verification of CPAs.
Make available all monitoring reports requested by DOE for the verification purpose
(i) Measures for continuous improvements of the PoA management system
Data management and quality control process will be reviewed and updated periodically.
Management personnel will attend the relevant training programs for the effective management of
POA.
Quality control of monitoring and reporting will be done to comply with the UNFCCC standards.
UNFCCC/CCNUCC
CDM – Executive Board Page 14
Relevant guidelines from the UNFCCC will be studied regularly and followed for the effective
management of PoA and it management system.
Similar domestic biogas programs are being implemented in other countries. SNV is providing
advisory services to many of these programs and Winrock is also involved in few of the programmes.
CME attends networking meeting regularly and will benefit from lessons from other countries as
well.
More key personnel will be employed as the number of CPAs increase.
SECTION D. Duration of PoA
D.1. Start date of PoA
13/12/2010.
The first plant to be included in the CPA 1 was installed on 13th December 2010. Hence the start date of
the PoA is 13/12/2010.
D.2. Length of the PoA
28 years
SECTION E. Environmental impacts
E.1. Level at which environmental analysis is undertaken
As per the Pakistan Environmental Protection Agency (Review of IEE and EIA) regulation 2000, and
guidance from the Pakistan Environmental Protection Agency, PoA level Initial Environmental
Examination (IEE) was conducted. Environmental Impact Assessment is not required as the thermal
power output of a biogas plant is 1.96kWth . IEE is sufficient if the power output of a plant is less than
200kW as per the Pakistan Environmental Protection Agency regulation 2000. Letter of approval was
obtained from the Pakistan Environmental Protection Agency.
E.2. Analysis of the environmental impacts
As per the IEE,
Pakistan is an energy deficient country, a large part of the country‟s energy demands are met through
imports. There is therefore an urgent need to develop and provide additional energy resources,
particularly to communities whose basic energy needs are currently not being met. The proposed
programme to be implemented throughout the country at the household level will help towards achieving
this objective and will not result in any potential environmental impacts.
The assessment of any potential environmental impacts resulting from the proposed programme of
activities has been addressed in this IEE, which has covered in detail the following:
The proposed project activities;
Legislative requirements related to the project;
Potential environmental effects of the proposed project activities on physical, natural and
socio-economic receptors;
The IEE concludes that the proposed project activities will not lead to adverse environmental impacts of
any kind. Additionally, careful implementation of the environmental checklist will ensure that any
potential environmental impacts are managed and minimized and the project proponent meets all
statutory requirements.
UNFCCC/CCNUCC
CDM – Executive Board Page 15
SECTION F. Local stakeholder comments
F.1. Solicitation of comments from local stakeholders
The local stakeholder consultation was done at the SSC-CPA level. Pakistan is a large country with a lot
of diversity across the various provinces. It is not practical to call representatives of all the provinces to
one place to invite their comments and suggestions. So it is decided to organize the local stakeholders‟
consultations at each CPA level.
As the first CPA is being implemented in Punjab Province of Pakistan, the local consultation meeting for
the first CPA was organized in Faisalabad, where PDBP has its area office. The process by which
comments from local stakeholders were invited and compiled is described in CPA DD.
F.2. Summary of comments received
Local stakeholder consultation will be done at SSC-CPA level. Summary of comments of each CPA will
be explained at CPA DD.
F.3. Report on consideration of comments received
Local stakeholder consultation will be done at SSC-CPA level. Report on consideration of comments
received will be explained in CPA DD.
SECTION G. Approval and authorization
Designated National Authority of Pakistan has provided the letter of approval and the letter is submitted
to DOE.
PART II. Generic component project activity (CPA)
SECTION A. General description of a generic CPA
A.1. Purpose and general description of generic CPAs
The Programme of Activities will consist of a set of CPAs, consisting of installations of domestic biogas
plants, which will substitute cooking energy sources like unsustainable woody biomass. The programme
will be implemented through a modular approach. Each module will be carried out to fit within a small-
scale CPA activity which generates no more than 45 MWth power. Each CPA will include maximum
20,000 domestic biogas plants. The first CPA will be in Punjab Province.
SECTION B. Application of a baseline and monitoring methodology
B.1. Reference of the approved baseline and monitoring methodology(ies) selected
AMS-I.E. Version 4 “Switch from Non-Renewable Biomass for thermal applications by the user” will be
used as baseline and monitoring methodology for SSC-CPA included in this PoA. This methodology is
approved by the CDM EB on its 56th meeting. This methodology is approved by the EB for the
application of PoA. (Meeting Report of EB37, paragraph 26)
B.2. Application of methodology(ies)
Each CPA to be included in the Pakistan Domestic Biogas Programme-PoA meets the applicability
criteria of AMS-I.E Version 4 as follows:
UNFCCC/CCNUCC
CDM – Executive Board Page 16
Table 4: Applicability Criteria for AMS-I.E
SN Applicability Criteria for AMS-I.E Justification
i Within limit of small scale threshold of
45MW thermal power output:
The maximum number of biogas plants in each CPA
will not exceed 20,000 domestic biogas plants. As
explained below, with the power output of a biogas
plant is 1.96 kWth , maximum number of plants in a
CPA could be 22,951. Calculation on maximum
number of plants to be included in a CPA is given
below.*
ii This category comprises activities to
displace the use of non-renewable
woody biomass by introducing
renewable energy technologies.
Examples of these technologies include
biogas stoves, solar cookers passive
solar homes, renewable energy based
drinking water treatment technologies
The end user technology in this project is biogas stove.
iii Project participants are able to show
that non-renewable biomass has been
used since 31 December 1989, using
survey methods.
Pakistan has faced significantly high rates of
deforestation in the past. According to one estimate
[WRI and IIED (1988)], the forest area of Pakistan
decreased from 141530 square km in 1880 to 67310 in
1980; a decrease of 52 percent in one hundred years.
During the 1970‟s, the study estimates an annual
decrease of 1.5 percent per year [Vin Dijk and Hussein
(1994)]. Estimates of contemporary deforestation are
varied. Pakistan (1992c) reported that some 7000-9000
ha of forests were lost each year. Khattak (1994) puts
this estimate at 10,000 ha annually. Since these reports
came out in early nineties, these estimates cannot be
held true for the nineties. FAO (1998) provides the
most recent estimate of annual deforestation. It
reported that between 1990-95 Pakistan experienced
deforestation at a rate of 1.1 percent (55000 ha)
annually.4
The annual increment of the biomass in 1993 was
25,717,857 m3/year whereas the total consumption at
that time was 29,550,000 m3/year showing the clear
shortage. The share of non renewable biomass
consumed was 0.13 in Pakistan in 1993. Out of the
total consumption of 29,550,000 m3/year, 26,015,000
m3/year is for domestic fuel wood. Annual increment
was not even sufficient to meet the domestic fuel wood
consumption. (Data Source: Forestry Sector Master
Plan, Pakistan)
4 Analyzing Institutional Set-up of Forest Management in Pakistan, Lubna Hasan, RESEARCH ECONOMIST,
Pakistan Institute of Development Economics, Islamabad Page no. 2
http://www.pide.org.pk/Research/Report182.pdf
UNFCCC/CCNUCC
CDM – Executive Board Page 17
As per the Supply and Demand Survey, 2003 done by
Department of Forest the total consumption of woody
biomass is 64,010,900 m3/year out of which the
46,023,000 m3/year (which is around 72% of the total
consumption) is for domestic fuel wood. This is
significantly higher than the total estimated annual
increment of 25,717,857 m3/year. It clearly shows that
firewood is the major cause for deforestation.
Forest resources assessment 1990 - Tropical countries
by FAO states that the annual deforestation in 1981-
1990 was 76,700 hectares in Pakistan.5 This shows that
the use of non renewable biomass was prevalent even
before 1990.
iv As per the paragraph 18 of the
methodology AMS I.E version 04, use
of this methodology is legitimate if the
leakage is accounted by multiplying the
quantity of biomass that is substituted
or replaced (By) by a net to gross
adjustment factor of 0.95.
Leakage in each CPA is accounted by multiplying the
quantity of biomass that is substituted or replaced (By)
by a net to gross adjustment factor of 0.95.
* Maximum Number of Biogas Plants per CPA
Calculation of installed capacity per biogas plant is calculated by using the following formula;
5 http://www.fao.org/docrep/007/t0830e/T0830E14.htm
UNFCCC/CCNUCC
CDM – Executive Board Page 18
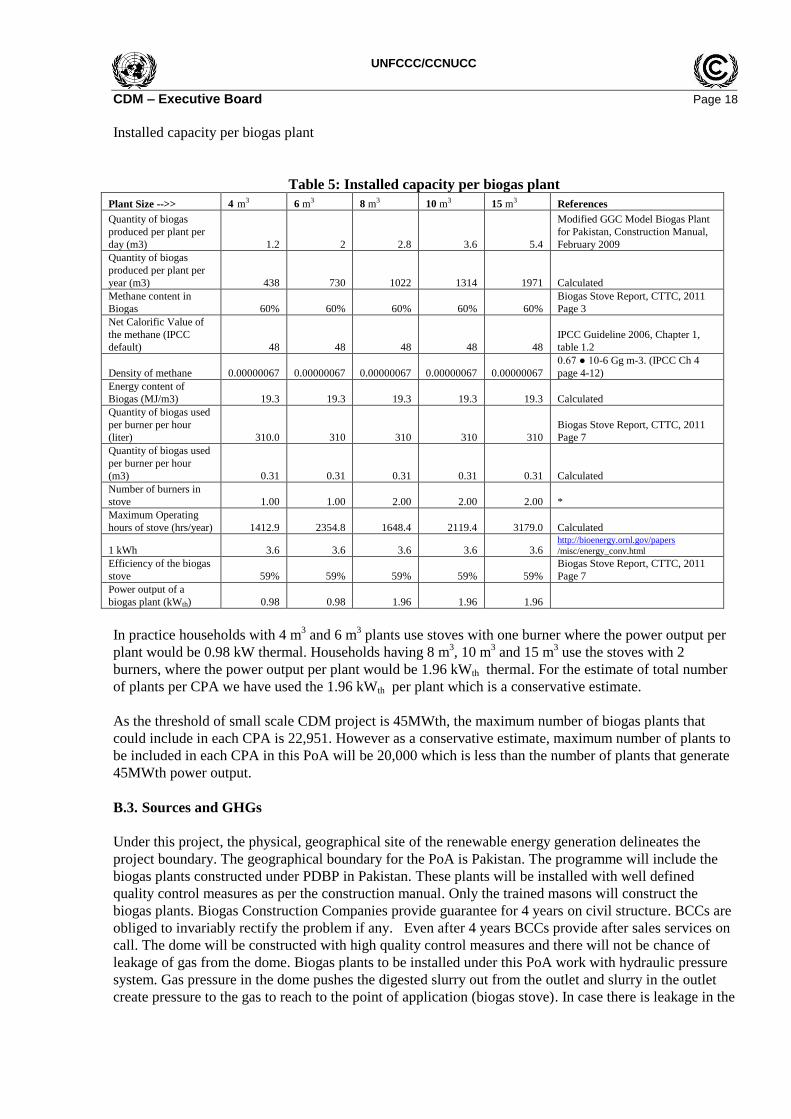
Installed capacity per biogas plant
Table 5: Installed capacity per biogas plant
Plant Size -->> 4 m3 6 m3 8 m3 10 m3 15 m3 References
Quantity of biogas
produced per plant per
day (m3) 1.2 2 2.8 3.6 5.4
Modified GGC Model Biogas Plant
for Pakistan, Construction Manual,
February 2009
Quantity of biogas
produced per plant per
year (m3) 438 730 1022 1314 1971 Calculated
Methane content in
Biogas 60% 60% 60% 60% 60%
Biogas Stove Report, CTTC, 2011
Page 3
Net Calorific Value of
the methane (IPCC
default) 48 48 48 48 48
IPCC Guideline 2006, Chapter 1,
table 1.2
Density of methane 0.00000067 0.00000067 0.00000067 0.00000067 0.00000067
0.67 ● 10-6 Gg m-3. (IPCC Ch 4
page 4-12)
Energy content of
Biogas (MJ/m3) 19.3 19.3 19.3 19.3 19.3 Calculated
Quantity of biogas used
per burner per hour
(liter) 310.0 310 310 310 310
Biogas Stove Report, CTTC, 2011
Page 7
Quantity of biogas used
per burner per hour
(m3) 0.31 0.31 0.31 0.31 0.31 Calculated
Number of burners in
stove 1.00 1.00 2.00 2.00 2.00 *
Maximum Operating
hours of stove (hrs/year) 1412.9 2354.8 1648.4 2119.4 3179.0 Calculated
1 kWh 3.6 3.6 3.6 3.6 3.6 http://bioenergy.ornl.gov/papers
/misc/energy_conv.html
Efficiency of the biogas
stove 59% 59% 59% 59% 59%
Biogas Stove Report, CTTC, 2011
Page 7
Power output of a
biogas plant (kWth) 0.98 0.98 1.96 1.96 1.96
In practice households with 4 m3 and 6 m
3 plants use stoves with one burner where the power output per
plant would be 0.98 kW thermal. Households having 8 m3, 10 m
3 and 15 m
3 use the stoves with 2
burners, where the power output per plant would be 1.96 kWth thermal. For the estimate of total number
of plants per CPA we have used the 1.96 kWth per plant which is a conservative estimate.
As the threshold of small scale CDM project is 45MWth, the maximum number of biogas plants that
could include in each CPA is 22,951. However as a conservative estimate, maximum number of plants to
be included in each CPA in this PoA will be 20,000 which is less than the number of plants that generate
45MWth power output.
B.3. Sources and GHGs
Under this project, the physical, geographical site of the renewable energy generation delineates the
project boundary. The geographical boundary for the PoA is Pakistan. The programme will include the
biogas plants constructed under PDBP in Pakistan. These plants will be installed with well defined
quality control measures as per the construction manual. Only the trained masons will construct the
biogas plants. Biogas Construction Companies provide guarantee for 4 years on civil structure. BCCs are
obliged to invariably rectify the problem if any. Even after 4 years BCCs provide after sales services on
call. The dome will be constructed with high quality control measures and there will not be chance of
leakage of gas from the dome. Biogas plants to be installed under this PoA work with hydraulic pressure
system. Gas pressure in the dome pushes the digested slurry out from the outlet and slurry in the outlet
create pressure to the gas to reach to the point of application (biogas stove). In case there is leakage in the
UNFCCC/CCNUCC
CDM – Executive Board Page 19
dome, although it is rare, there will not be enough pressure in the dome to push the digested slurry out
from the outlet or/and push the gas to the point of application. In such case plant will not be operational.
Only the operational plants will be included in the project boundary. Number of biogas plants installed
will be adjusted with the operational percentage of the plants (Details given in monitoring plan).
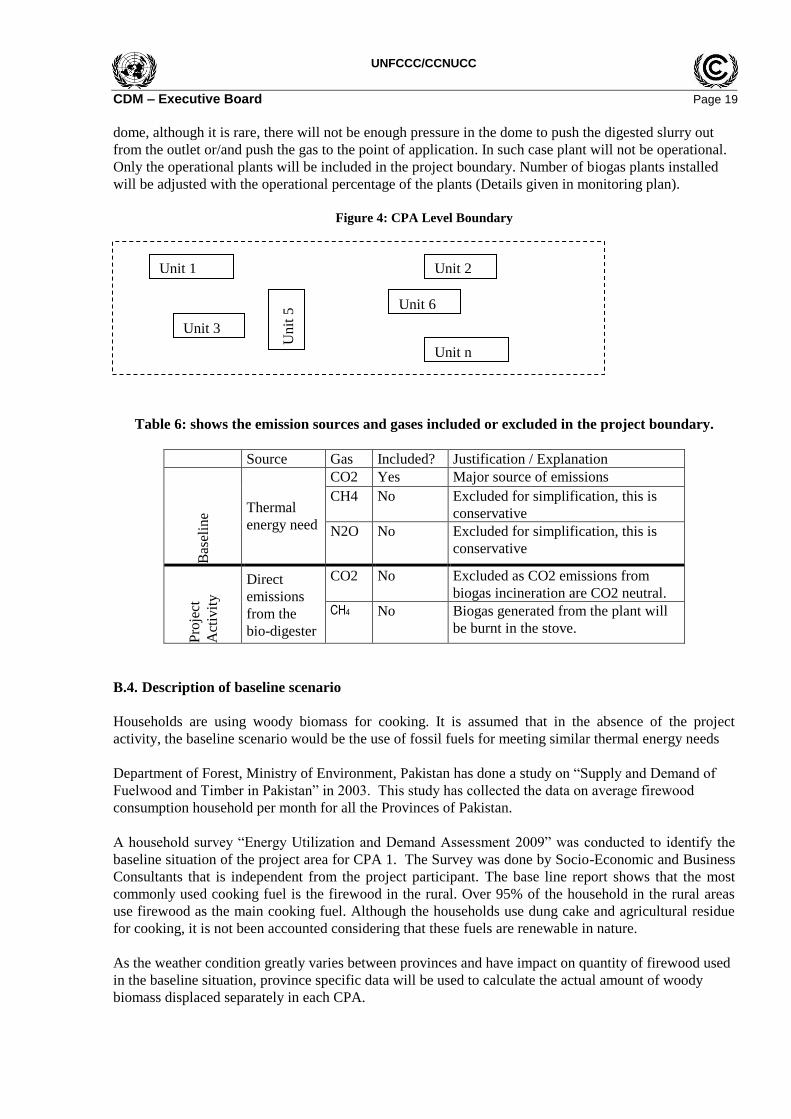
Figure 4: CPA Level Boundary
Table 6: shows the emission sources and gases included or excluded in the project boundary.
Source Gas Included? Justification / Explanation
Bas
elin
e
Thermal
energy need
CO2 Yes Major source of emissions
CH4 No Excluded for simplification, this is
conservative
N2O No Excluded for simplification, this is
conservative
Pro
ject
Act
ivit
y
Direct
emissions
from the
bio-digester
CO2 No Excluded as CO2 emissions from
biogas incineration are CO2 neutral.
CH4
No
Biogas generated from the plant will
be burnt in the stove.
B.4. Description of baseline scenario
Households are using woody biomass for cooking. It is assumed that in the absence of the project
activity, the baseline scenario would be the use of fossil fuels for meeting similar thermal energy needs
Department of Forest, Ministry of Environment, Pakistan has done a study on “Supply and Demand of
Fuelwood and Timber in Pakistan” in 2003. This study has collected the data on average firewood
consumption household per month for all the Provinces of Pakistan.
A household survey “Energy Utilization and Demand Assessment 2009” was conducted to identify the
baseline situation of the project area for CPA 1. The Survey was done by Socio-Economic and Business
Consultants that is independent from the project participant. The base line report shows that the most
commonly used cooking fuel is the firewood in the rural. Over 95% of the household in the rural areas
use firewood as the main cooking fuel. Although the households use dung cake and agricultural residue
for cooking, it is not been accounted considering that these fuels are renewable in nature.
As the weather condition greatly varies between provinces and have impact on quantity of firewood used
in the baseline situation, province specific data will be used to calculate the actual amount of woody
biomass displaced separately in each CPA.
Unit 1 Unit 2
Un
it 5
Unit 6
Unit 3
Unit n
UNFCCC/CCNUCC
CDM – Executive Board Page 20
Based on the Supply and Demand Study done by the Department of Forest, a total of 890 households in
rural areas of Punjab were interviewed and the total firewood consumption is 9,187 maunds6, which
gives average firewood consumption per household per month as 10.3 maunds7. According to Amur &
Bhattacharya (1999) 81% of the firewood consumed in the household sector was for cooking. Hence the
average quantity of woody biomass displaced with a biogas plant is 3.74 tonnes per household per year.
(10.3 maunds*37.32KG/maund*81%*12 months/1000). This data is being used for the calculation of
emission reduction in CPA 1.
Share of Non Renewable Biomass
The non-renewable biomass being used in the programme area is calculated using government data and
surveys.
Pakistan, with a per capita forest area of 0.03 hectare compared to the world average of 1.0 hectare, is
faced with the problems of resource scarcity and a deteriorating natural environment. The meagre forest
cover, 4.8 percent of the total land area, is deteriorating under the heavy demands of a rapidly increasing
population. With population growing at 3% annually, forest area per capita is declining. The area of
public forest cannot be expanded fast enough to keep pace with population growth and demands for
forest products. 8
Availability of forest and deteriorating rate of the forest varies across various Provinces in Pakistan. As
the first CPA will be implemented in Punjab, the NRB factor for Punjab will be used for calculating
amount of non renewable biomass substituted by the project activity. Similarly area specific NRB factor
for other Provinces will be calculated with the government data and survey. The data used for the
calculation of NRB factor are taken from the Forestry Sector Master Plan of Pakistan9, and Supply and
Demand Survey of Pakistan 2003.
Demonstrably Renewable woody biomass (DRB) and share of non renewable biomass (NRB)
Pakistan has faced significantly high rates of deforestation in the past. According to one estimate [WRI
and IIED (1988)], the forest area of Pakistan decreased from 141530 square km in 1880 to 67310 in
1980; a decrease of 52 percent in one hundred years. During the 1970‟s, the study estimates an annual
decrease of 1.5 percent per year [Vin Dijk and Hussein (1994)]. Estimates of contemporary deforestation
are varied. Pakistan (1992c) reported that some 7000-9000 ha of forests were lost each year. Khattak
(1994) puts this estimate at 10,000 ha annually. Since these reports came out in early nineties, these
estimates cannot be held true for the nineties. FAO (1998) provides the most recent estimate of annual
deforestation. It reported that between 1990-95 Pakistan experienced deforestation at a rate of 1.1 percent
(55000 ha) annually.10
6 Study on Supply and Demand of Fuelwood and Timber in Pakistan, Table 3.10 page 35,
7 Although the Maund is the international unit for weight, it is being used in Pakistan commonly and 1 maund is
equivalent to 37.32kg. Source: Letter from Government of Pakistan, Ministry of National Disaster Management,
Department of Forest. This department has conducted the above mentioned study on Supply and Demand of fuel
wood and timber in Pakistan. 2003. 8 Forestry Sector Master Plan of Paksiatan.
http://www.pakistan.gov.pk/divisions/ContentInfo.jsp?DivID=5&cPath=45_50&ContentID=5083 9 http://www.pakistan.gov.pk/divisions/ContentInfo.jsp?DivID=5&cPath=45_50&ContentID=5083
10 Analysing Institutional Set-up of Forest Management in Pakistan, Lubna Hasan, RESEARCH ECONOMIST,
Pakistan Institute of Development Economics, Islamabad Page no. 2
http://www.pide.org.pk/Research/Report182.pdf
UNFCCC/CCNUCC
CDM – Executive Board Page 21
On the other hand there is no such sustainable forest management practice in place. So annual increment
of the woody biomass is not sufficient for meeting the demand of woody biomass.
The baseline report “Energy Utilization and Demand Assessment 2009” has indicated that price, time and
distance of collecting fire wood is in increasing trend. The fire wood is being scarce in the project area
and firewood need of the community is a major cause of decreasing forest trees.
As per the Forestry Master Plan of Pakistan, the total annual biomass increment in 1992 was
14,402,000m3/year across Pakistan11
. Numbers of references have been presented above to demonstrate
the continuous deforestation since 1990. The analysis shows that biomass was being harvested
unsustainably from 1992. So the annual increment in 2003 would be lower than in 1992. The annual
increment in 2003 is estimated as that of 1992, i.e. 14,402,000m3/year, which is very conservative in the
context of continuous deforestation since then.
As per the estimate of HESS study, 56% of the firewod consumption would be round wood. Annual
wood increment of 14,402,000 m3 mentioned in the Table 2.8 of Forestry Sector Master Plan represent
the 56% of the total forest increment. So that the total forest increment is calculated by considering
14,402,000 m3 as 56% of total increment. The estimated total annual increment (DRB) for Pakistan is
25,717,857 m3 in 1992. Hence the estimated DRB in 2003 is 25,717,857 m
3, which is conservative.
Based on the Supply and Demand Study done by the Department of Forest, the total wood consumption
for the year 2002-03 is estimated at 64.0109 million m³ to which firewood has accounted for 51.772
million m³. Hence the country faced the annual wood shortage of about 38.293 million m³. This gap is
presently being met by over cutting of trees in the state and private forests and on farmlands.12
.
As per the methodology, Non-renewable woody biomass (NRB) is the quantity of woody biomass used in
the absence of the project activity (By), so long as at least two of the following supporting indicators are
shown to exist.
Trend showing increase in time spent or distance travelled by users (or fuel-wood
suppliers) for gathering fuel wood or alternatively trend showing increase in
transportation distances for the fuel wood transported into the project area;
Survey results, national or local statistics, studies, maps or other sources of information
such as remote sensing data that show that carbon stocks are depleting in the project
area;
Increasing trends in fuel wood price indicating scarcity;
Trends in the type of cooking fuel collected by users, suggesting scarcity of woody
biomass.
In this case, there are clear evidences to show the increasing trend of firewood price over time and
carbon stocks depleting in the program area.
Price of firewood
The following table shows the increasing trend of price of firewood in various areas in Pakistan
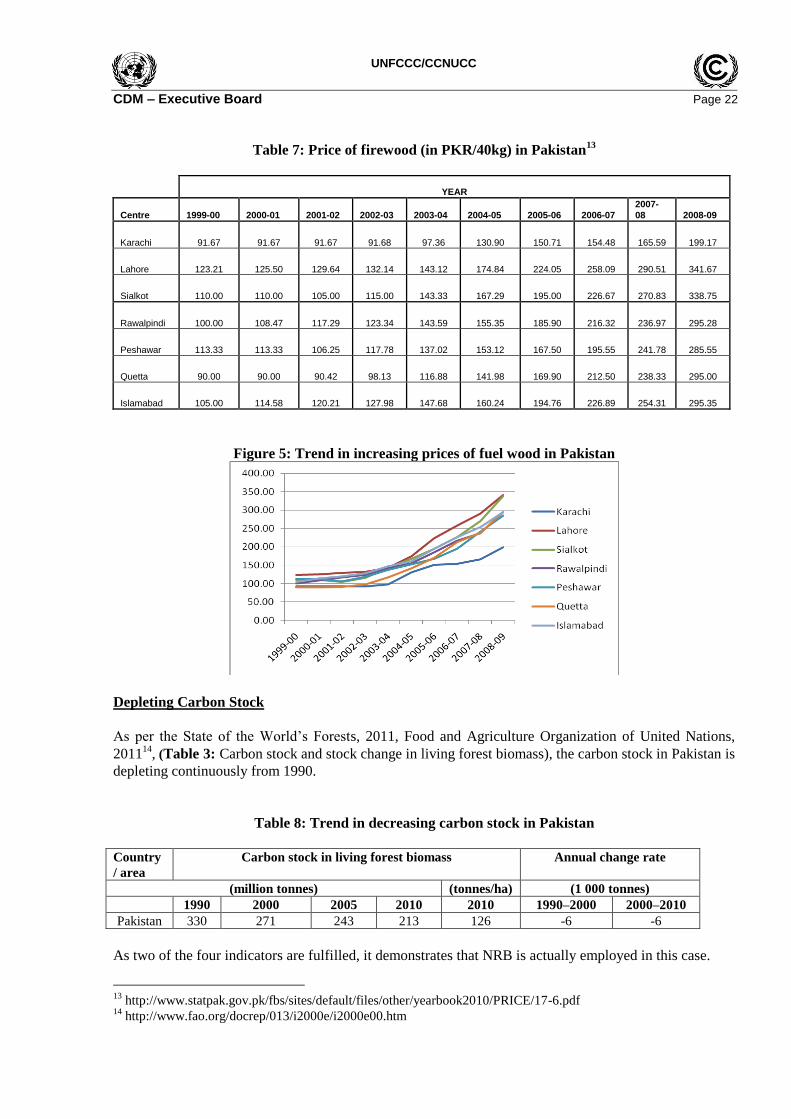
The price increase rages from 117% to 228% since 1999.
11
Forestry Sector Master Plan Pakistan (FSMP) Table 2.8 12
Study on Supply and Demand of Fuelwood and Timber in Pakistan (Executive Summary page no. 10)
UNFCCC/CCNUCC
CDM – Executive Board Page 22
Table 7: Price of firewood (in PKR/40kg) in Pakistan13
YEAR
Centre 1999-00 2000-01 2001-02 2002-03 2003-04 2004-05 2005-06 2006-07
2007-
08 2008-09
Karachi 91.67 91.67 91.67 91.68 97.36 130.90 150.71 154.48 165.59 199.17
Lahore 123.21 125.50 129.64 132.14 143.12 174.84 224.05 258.09 290.51 341.67
Sialkot 110.00 110.00 105.00 115.00 143.33 167.29 195.00 226.67 270.83 338.75
Rawalpindi 100.00 108.47 117.29 123.34 143.59 155.35 185.90 216.32 236.97 295.28
Peshawar 113.33 113.33 106.25 117.78 137.02 153.12 167.50 195.55 241.78 285.55
Quetta 90.00 90.00 90.42 98.13 116.88 141.98 169.90 212.50 238.33 295.00
Islamabad 105.00 114.58 120.21 127.98 147.68 160.24 194.76 226.89 254.31 295.35
Figure 5: Trend in increasing prices of fuel wood in Pakistan
Depleting Carbon Stock
As per the State of the World‟s Forests, 2011, Food and Agriculture Organization of United Nations,
201114
, (Table 3: Carbon stock and stock change in living forest biomass), the carbon stock in Pakistan is
depleting continuously from 1990.
Table 8: Trend in decreasing carbon stock in Pakistan
Country
/ area
Carbon stock in living forest biomass Annual change rate
(million tonnes) (tonnes/ha) (1 000 tonnes)
1990 2000 2005 2010 2010 1990–2000 2000–2010
Pakistan 330 271 243 213 126 -6 -6
As two of the four indicators are fulfilled, it demonstrates that NRB is actually employed in this case.
13
http://www.statpak.gov.pk/fbs/sites/default/files/other/yearbook2010/PRICE/17-6.pdf 14
http://www.fao.org/docrep/013/i2000e/i2000e00.htm
UNFCCC/CCNUCC
CDM – Executive Board Page 23
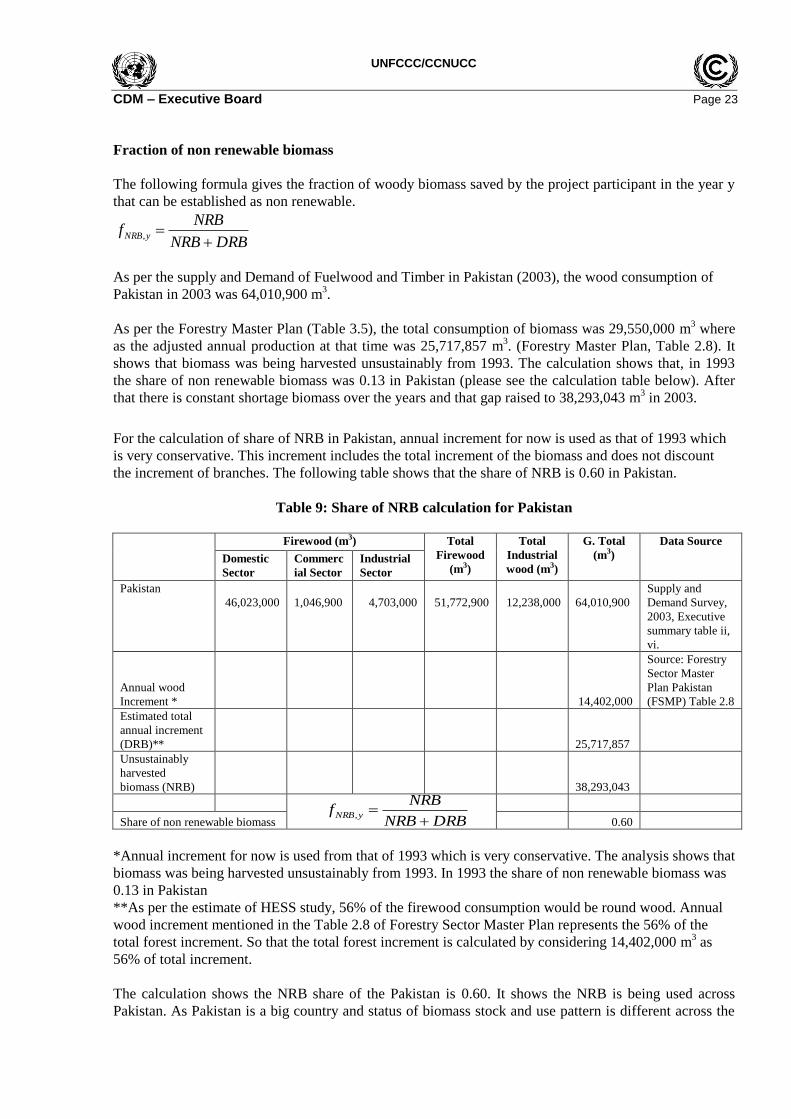
Fraction of non renewable biomass
The following formula gives the fraction of woody biomass saved by the project participant in the year y
that can be established as non renewable.
DRBNRB
NRBf yNRB
,
As per the supply and Demand of Fuelwood and Timber in Pakistan (2003), the wood consumption of
Pakistan in 2003 was 64,010,900 m3.
As per the Forestry Master Plan (Table 3.5), the total consumption of biomass was 29,550,000 m3 where
as the adjusted annual production at that time was 25,717,857 m3. (Forestry Master Plan, Table 2.8). It
shows that biomass was being harvested unsustainably from 1993. The calculation shows that, in 1993
the share of non renewable biomass was 0.13 in Pakistan (please see the calculation table below). After
that there is constant shortage biomass over the years and that gap raised to 38,293,043 m3 in 2003.
For the calculation of share of NRB in Pakistan, annual increment for now is used as that of 1993 which
is very conservative. This increment includes the total increment of the biomass and does not discount
the increment of branches. The following table shows that the share of NRB is 0.60 in Pakistan.
Table 9: Share of NRB calculation for Pakistan
Firewood (m3) Total
Firewood
(m3)
Total
Industrial
wood (m3)
G. Total
(m3)
Data Source
Domestic
Sector
Commerc
ial Sector
Industrial
Sector
Pakistan
46,023,000
1,046,900
4,703,000
51,772,900
12,238,000
64,010,900
Supply and
Demand Survey,
2003, Executive
summary table ii,
vi.
Annual wood
Increment * 14,402,000
Source: Forestry
Sector Master
Plan Pakistan
(FSMP) Table 2.8
Estimated total
annual increment
(DRB)**
25,717,857
Unsustainably
harvested
biomass (NRB)
38,293,043
Share of non renewable biomass
0.60
*Annual increment for now is used from that of 1993 which is very conservative. The analysis shows that
biomass was being harvested unsustainably from 1993. In 1993 the share of non renewable biomass was
0.13 in Pakistan
**As per the estimate of HESS study, 56% of the firewood consumption would be round wood. Annual
wood increment mentioned in the Table 2.8 of Forestry Sector Master Plan represents the 56% of the
total forest increment. So that the total forest increment is calculated by considering 14,402,000 m3 as
56% of total increment.
The calculation shows the NRB share of the Pakistan is 0.60. It shows the NRB is being used across
Pakistan. As Pakistan is a big country and status of biomass stock and use pattern is different across the
DRBNRB
NRBf yNRB
,
UNFCCC/CCNUCC
CDM – Executive Board Page 24
Provinces, Province wise NRB share will be calculated at CPA level and used to calculate the emission
reduction.
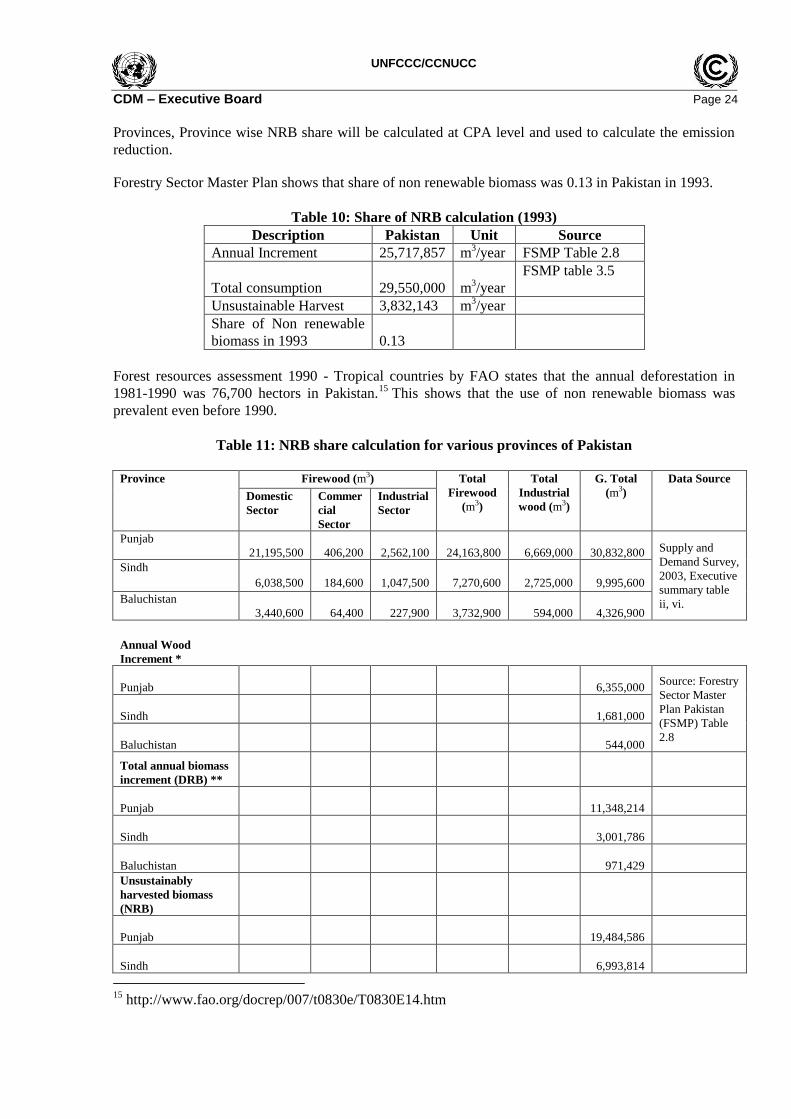
Forestry Sector Master Plan shows that share of non renewable biomass was 0.13 in Pakistan in 1993.
Table 10: Share of NRB calculation (1993)
Description Pakistan Unit Source
Annual Increment 25,717,857 m3/year FSMP Table 2.8
Total consumption
29,550,000 m3/year
FSMP table 3.5
Unsustainable Harvest 3,832,143 m3/year
Share of Non renewable
biomass in 1993 0.13
Forest resources assessment 1990 - Tropical countries by FAO states that the annual deforestation in
1981-1990 was 76,700 hectors in Pakistan.15
This shows that the use of non renewable biomass was
prevalent even before 1990.
Table 11: NRB share calculation for various provinces of Pakistan
Province Firewood (m3) Total
Firewood
(m3)
Total
Industrial
wood (m3)
G. Total
(m3)
Data Source
Domestic
Sector
Commer
cial
Sector
Industrial
Sector
Punjab
21,195,500
406,200
2,562,100
24,163,800
6,669,000
30,832,800 Supply and
Demand Survey,
2003, Executive
summary table
ii, vi.
Sindh
6,038,500
184,600
1,047,500
7,270,600
2,725,000
9,995,600
Baluchistan
3,440,600
64,400
227,900
3,732,900
594,000
4,326,900
Annual Wood
Increment *
Punjab
6,355,000 Source: Forestry
Sector Master
Plan Pakistan
(FSMP) Table
2.8
Sindh
1,681,000
Baluchistan
544,000
Total annual biomass
increment (DRB) **
Punjab
11,348,214
Sindh
3,001,786
Baluchistan
971,429
Unsustainably
harvested biomass
(NRB)
Punjab
19,484,586
Sindh
6,993,814
15
http://www.fao.org/docrep/007/t0830e/T0830E14.htm
UNFCCC/CCNUCC
CDM – Executive Board Page 25
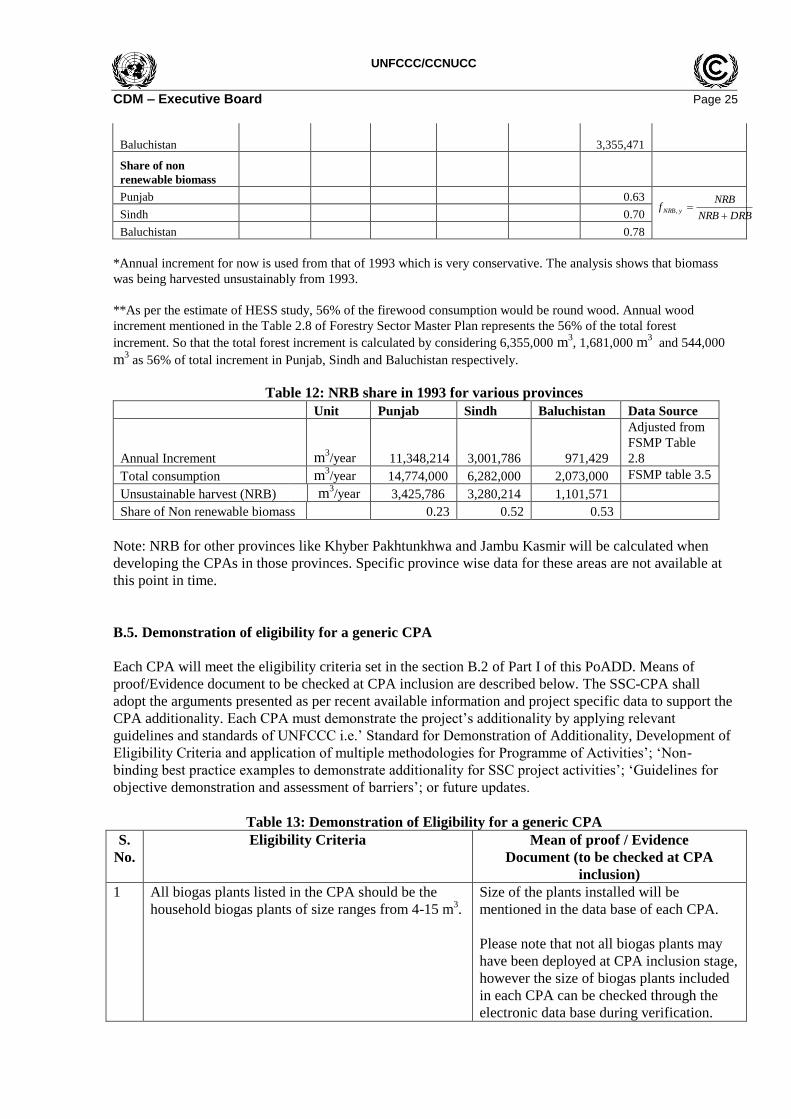
Baluchistan
3,355,471
Share of non
renewable biomass
Punjab
0.63
Sindh
0.70
Baluchistan
0.78
*Annual increment for now is used from that of 1993 which is very conservative. The analysis shows that biomass
was being harvested unsustainably from 1993.
**As per the estimate of HESS study, 56% of the firewood consumption would be round wood. Annual wood
increment mentioned in the Table 2.8 of Forestry Sector Master Plan represents the 56% of the total forest
increment. So that the total forest increment is calculated by considering 6,355,000 m3, 1,681,000 m
3 and 544,000
m3 as 56% of total increment in Punjab, Sindh and Baluchistan respectively.
Table 12: NRB share in 1993 for various provinces
Unit Punjab Sindh Baluchistan Data Source
Annual Increment m3/year 11,348,214 3,001,786 971,429
Adjusted from
FSMP Table
2.8
Total consumption m3/year 14,774,000 6,282,000 2,073,000 FSMP table 3.5
Unsustainable harvest (NRB) m3/year 3,425,786 3,280,214 1,101,571
Share of Non renewable biomass 0.23 0.52 0.53
Note: NRB for other provinces like Khyber Pakhtunkhwa and Jambu Kasmir will be calculated when
developing the CPAs in those provinces. Specific province wise data for these areas are not available at
this point in time.
B.5. Demonstration of eligibility for a generic CPA
Each CPA will meet the eligibility criteria set in the section B.2 of Part I of this PoADD. Means of
proof/Evidence document to be checked at CPA inclusion are described below. The SSC-CPA shall
adopt the arguments presented as per recent available information and project specific data to support the
CPA additionality. Each CPA must demonstrate the project‟s additionality by applying relevant
guidelines and standards of UNFCCC i.e.‟ Standard for Demonstration of Additionality, Development of
Eligibility Criteria and application of multiple methodologies for Programme of Activities‟; „Non-
binding best practice examples to demonstrate additionality for SSC project activities‟; „Guidelines for
objective demonstration and assessment of barriers‟; or future updates.
Table 13: Demonstration of Eligibility for a generic CPA
S.
No.
Eligibility Criteria Mean of proof / Evidence
Document (to be checked at CPA
inclusion)
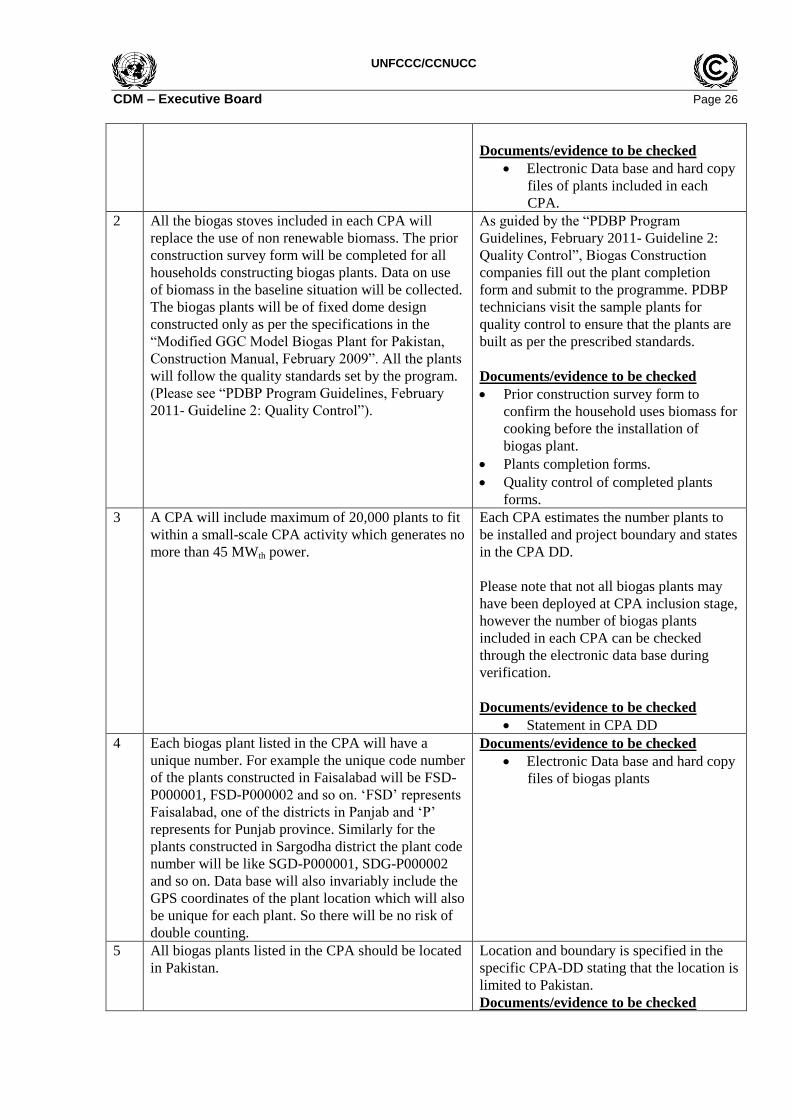
1 All biogas plants listed in the CPA should be the
household biogas plants of size ranges from 4-15 m3.
Size of the plants installed will be
mentioned in the data base of each CPA.
Please note that not all biogas plants may
have been deployed at CPA inclusion stage,
however the size of biogas plants included
in each CPA can be checked through the
electronic data base during verification.
DRBNRB
NRBf yNRB
,
UNFCCC/CCNUCC
CDM – Executive Board Page 26
Documents/evidence to be checked
Electronic Data base and hard copy
files of plants included in each
CPA.
2 All the biogas stoves included in each CPA will
replace the use of non renewable biomass. The prior
construction survey form will be completed for all
households constructing biogas plants. Data on use
of biomass in the baseline situation will be collected.
The biogas plants will be of fixed dome design
constructed only as per the specifications in the
“Modified GGC Model Biogas Plant for Pakistan,
Construction Manual, February 2009”. All the plants
will follow the quality standards set by the program.
(Please see “PDBP Program Guidelines, February
2011- Guideline 2: Quality Control”).
As guided by the “PDBP Program
Guidelines, February 2011- Guideline 2:
Quality Control”, Biogas Construction
companies fill out the plant completion
form and submit to the programme. PDBP
technicians visit the sample plants for
quality control to ensure that the plants are
built as per the prescribed standards.
Documents/evidence to be checked
Prior construction survey form to
confirm the household uses biomass for
cooking before the installation of
biogas plant.
Plants completion forms.
Quality control of completed plants
forms.
3 A CPA will include maximum of 20,000 plants to fit
within a small-scale CPA activity which generates no
more than 45 MWth power.
Each CPA estimates the number plants to
be installed and project boundary and states
in the CPA DD.
Please note that not all biogas plants may
have been deployed at CPA inclusion stage,
however the number of biogas plants
included in each CPA can be checked
through the electronic data base during
verification.
Documents/evidence to be checked
Statement in CPA DD
4 Each biogas plant listed in the CPA will have a
unique number. For example the unique code number
of the plants constructed in Faisalabad will be FSD-
P000001, FSD-P000002 and so on. „FSD‟ represents
Faisalabad, one of the districts in Panjab and „P‟
represents for Punjab province. Similarly for the
plants constructed in Sargodha district the plant code
number will be like SGD-P000001, SDG-P000002
and so on. Data base will also invariably include the
GPS coordinates of the plant location which will also
be unique for each plant. So there will be no risk of
double counting.
Documents/evidence to be checked
Electronic Data base and hard copy
files of biogas plants
5 All biogas plants listed in the CPA should be located
in Pakistan.
Location and boundary is specified in the
specific CPA-DD stating that the location is
limited to Pakistan.
Documents/evidence to be checked
UNFCCC/CCNUCC
CDM – Executive Board Page 27
Statement of CME that the location
and boundary is within Pakistan.
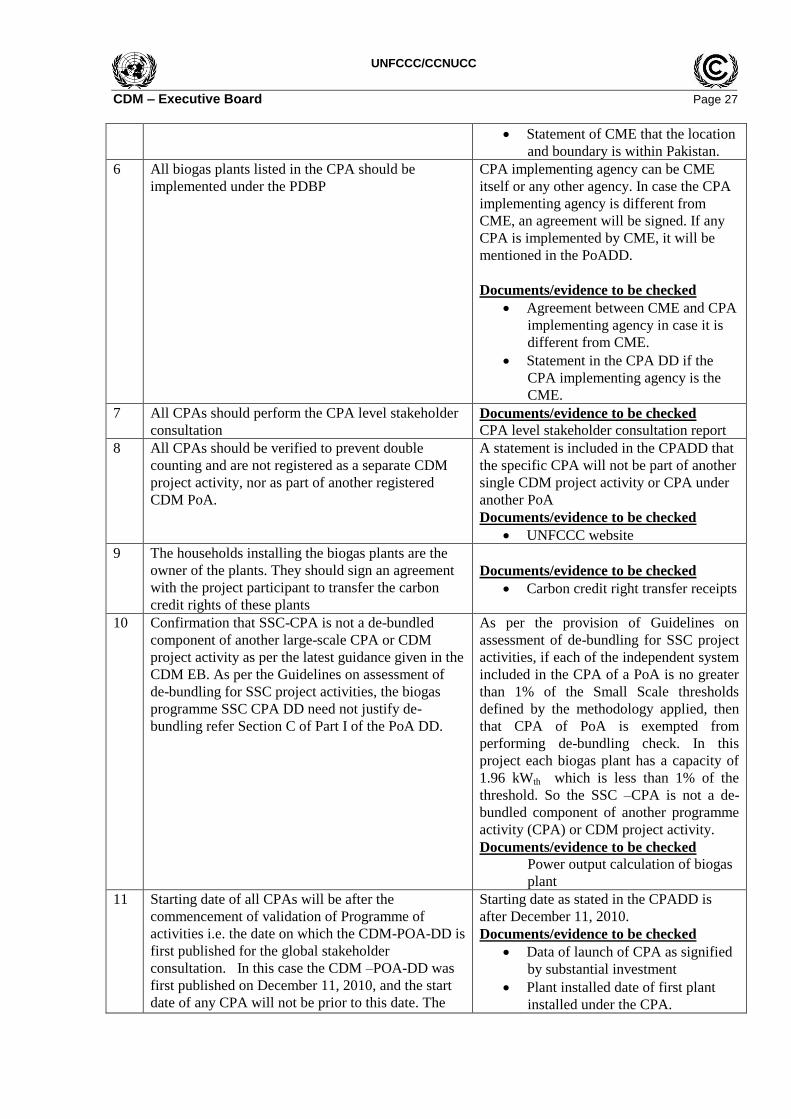
6 All biogas plants listed in the CPA should be
implemented under the PDBP
CPA implementing agency can be CME
itself or any other agency. In case the CPA
implementing agency is different from
CME, an agreement will be signed. If any
CPA is implemented by CME, it will be
mentioned in the PoADD.
Documents/evidence to be checked
Agreement between CME and CPA
implementing agency in case it is
different from CME.
Statement in the CPA DD if the
CPA implementing agency is the
CME.
7 All CPAs should perform the CPA level stakeholder
consultation
Documents/evidence to be checked
CPA level stakeholder consultation report
8 All CPAs should be verified to prevent double
counting and are not registered as a separate CDM
project activity, nor as part of another registered
CDM PoA.
A statement is included in the CPADD that
the specific CPA will not be part of another
single CDM project activity or CPA under
another PoA
Documents/evidence to be checked
UNFCCC website
9 The households installing the biogas plants are the
owner of the plants. They should sign an agreement
with the project participant to transfer the carbon
credit rights of these plants
Documents/evidence to be checked
Carbon credit right transfer receipts
10 Confirmation that SSC-CPA is not a de-bundled
component of another large-scale CPA or CDM
project activity as per the latest guidance given in the
CDM EB. As per the Guidelines on assessment of
de-bundling for SSC project activities, the biogas
programme SSC CPA DD need not justify de-
bundling refer Section C of Part I of the PoA DD.
As per the provision of Guidelines on
assessment of de-bundling for SSC project
activities, if each of the independent system
included in the CPA of a PoA is no greater
than 1% of the Small Scale thresholds
defined by the methodology applied, then
that CPA of PoA is exempted from
performing de-bundling check. In this
project each biogas plant has a capacity of
1.96 kWth which is less than 1% of the
threshold. So the SSC –CPA is not a de-
bundled component of another programme
activity (CPA) or CDM project activity.
Documents/evidence to be checked
Power output calculation of biogas
plant
11 Starting date of all CPAs will be after the
commencement of validation of Programme of
activities i.e. the date on which the CDM-POA-DD is
first published for the global stakeholder
consultation. In this case the CDM –POA-DD was
first published on December 11, 2010, and the start
date of any CPA will not be prior to this date. The
Starting date as stated in the CPADD is
after December 11, 2010.
Documents/evidence to be checked
Data of launch of CPA as signified
by substantial investment
Plant installed date of first plant
installed under the CPA.
UNFCCC/CCNUCC
CDM – Executive Board Page 28
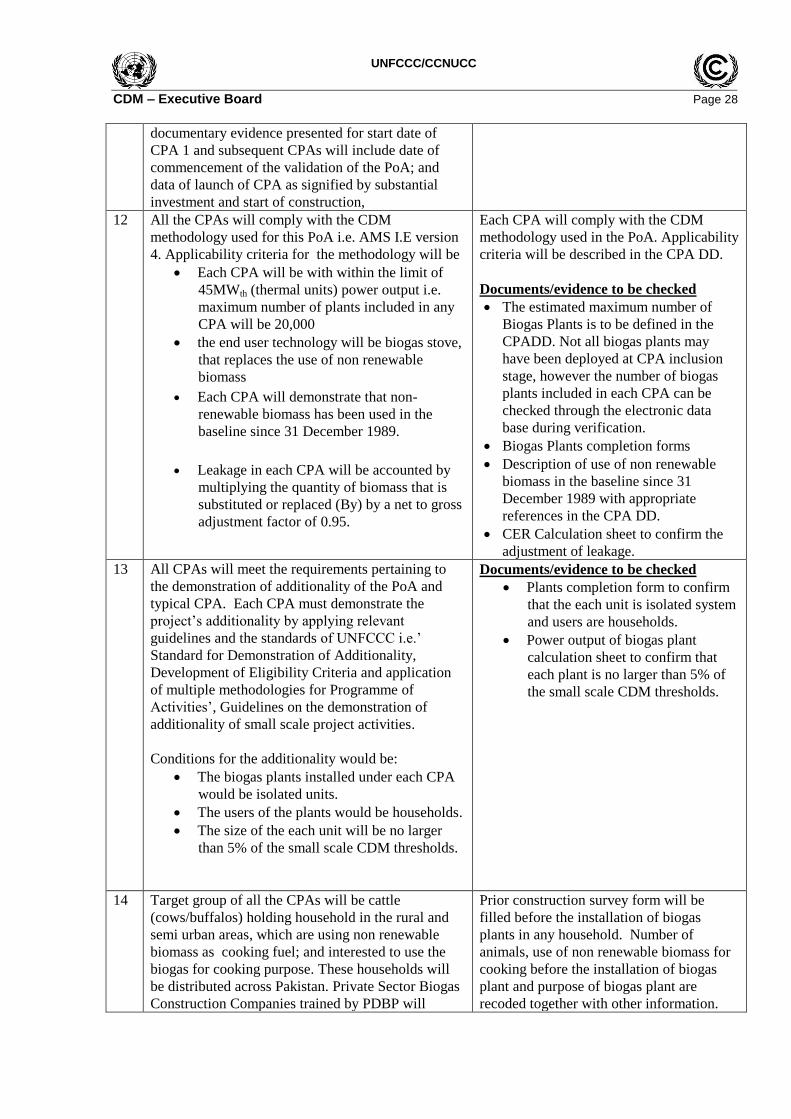
documentary evidence presented for start date of
CPA 1 and subsequent CPAs will include date of
commencement of the validation of the PoA; and
data of launch of CPA as signified by substantial
investment and start of construction,
12 All the CPAs will comply with the CDM
methodology used for this PoA i.e. AMS I.E version
4. Applicability criteria for the methodology will be
Each CPA will be with within the limit of
45MWth (thermal units) power output i.e.
maximum number of plants included in any
CPA will be 20,000
the end user technology will be biogas stove,
that replaces the use of non renewable
biomass
Each CPA will demonstrate that non-
renewable biomass has been used in the
baseline since 31 December 1989.
Leakage in each CPA will be accounted by
multiplying the quantity of biomass that is
substituted or replaced (By) by a net to gross
adjustment factor of 0.95.
Each CPA will comply with the CDM
methodology used in the PoA. Applicability
criteria will be described in the CPA DD.
Documents/evidence to be checked
The estimated maximum number of
Biogas Plants is to be defined in the
CPADD. Not all biogas plants may
have been deployed at CPA inclusion
stage, however the number of biogas
plants included in each CPA can be
checked through the electronic data
base during verification.
Biogas Plants completion forms
Description of use of non renewable
biomass in the baseline since 31
December 1989 with appropriate
references in the CPA DD.
CER Calculation sheet to confirm the
adjustment of leakage.
13 All CPAs will meet the requirements pertaining to
the demonstration of additionality of the PoA and
typical CPA. Each CPA must demonstrate the
project‟s additionality by applying relevant
guidelines and the standards of UNFCCC i.e.‟
Standard for Demonstration of Additionality,
Development of Eligibility Criteria and application
of multiple methodologies for Programme of
Activities‟, Guidelines on the demonstration of
additionality of small scale project activities.
Conditions for the additionality would be:
The biogas plants installed under each CPA
would be isolated units.
The users of the plants would be households.
The size of the each unit will be no larger
than 5% of the small scale CDM thresholds.
Documents/evidence to be checked
Plants completion form to confirm
that the each unit is isolated system
and users are households.
Power output of biogas plant
calculation sheet to confirm that
each plant is no larger than 5% of
the small scale CDM thresholds.
14 Target group of all the CPAs will be cattle
(cows/buffalos) holding household in the rural and
semi urban areas, which are using non renewable
biomass as cooking fuel; and interested to use the
biogas for cooking purpose. These households will
be distributed across Pakistan. Private Sector Biogas
Construction Companies trained by PDBP will
Prior construction survey form will be
filled before the installation of biogas
plants in any household. Number of
animals, use of non renewable biomass for
cooking before the installation of biogas
plant and purpose of biogas plant are
recoded together with other information.
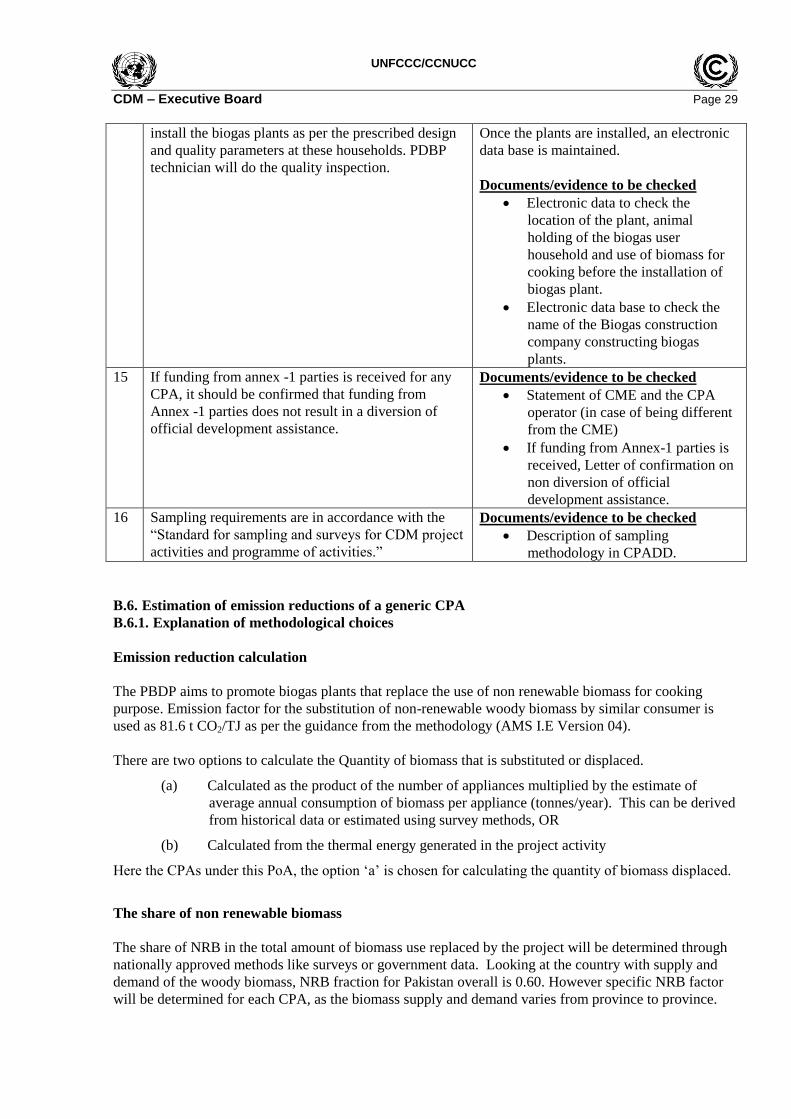
UNFCCC/CCNUCC
CDM – Executive Board Page 29
install the biogas plants as per the prescribed design
and quality parameters at these households. PDBP
technician will do the quality inspection.
Once the plants are installed, an electronic
data base is maintained.
Documents/evidence to be checked
Electronic data to check the
location of the plant, animal
holding of the biogas user
household and use of biomass for
cooking before the installation of
biogas plant.
Electronic data base to check the
name of the Biogas construction
company constructing biogas
plants.
15 If funding from annex -1 parties is received for any
CPA, it should be confirmed that funding from
Annex -1 parties does not result in a diversion of
official development assistance.
Documents/evidence to be checked
Statement of CME and the CPA
operator (in case of being different
from the CME)
If funding from Annex-1 parties is
received, Letter of confirmation on
non diversion of official
development assistance.
16 Sampling requirements are in accordance with the
“Standard for sampling and surveys for CDM project
activities and programme of activities.”
Documents/evidence to be checked
Description of sampling
methodology in CPADD.
B.6. Estimation of emission reductions of a generic CPA
B.6.1. Explanation of methodological choices
Emission reduction calculation
The PBDP aims to promote biogas plants that replace the use of non renewable biomass for cooking
purpose. Emission factor for the substitution of non-renewable woody biomass by similar consumer is
used as 81.6 t CO2/TJ as per the guidance from the methodology (AMS I.E Version 04).
There are two options to calculate the Quantity of biomass that is substituted or displaced.
(a) Calculated as the product of the number of appliances multiplied by the estimate of
average annual consumption of biomass per appliance (tonnes/year). This can be derived
from historical data or estimated using survey methods, OR
(b) Calculated from the thermal energy generated in the project activity
Here the CPAs under this PoA, the option „a‟ is chosen for calculating the quantity of biomass displaced.
The share of non renewable biomass
The share of NRB in the total amount of biomass use replaced by the project will be determined through
nationally approved methods like surveys or government data. Looking at the country with supply and
demand of the woody biomass, NRB fraction for Pakistan overall is 0.60. However specific NRB factor
will be determined for each CPA, as the biomass supply and demand varies from province to province.
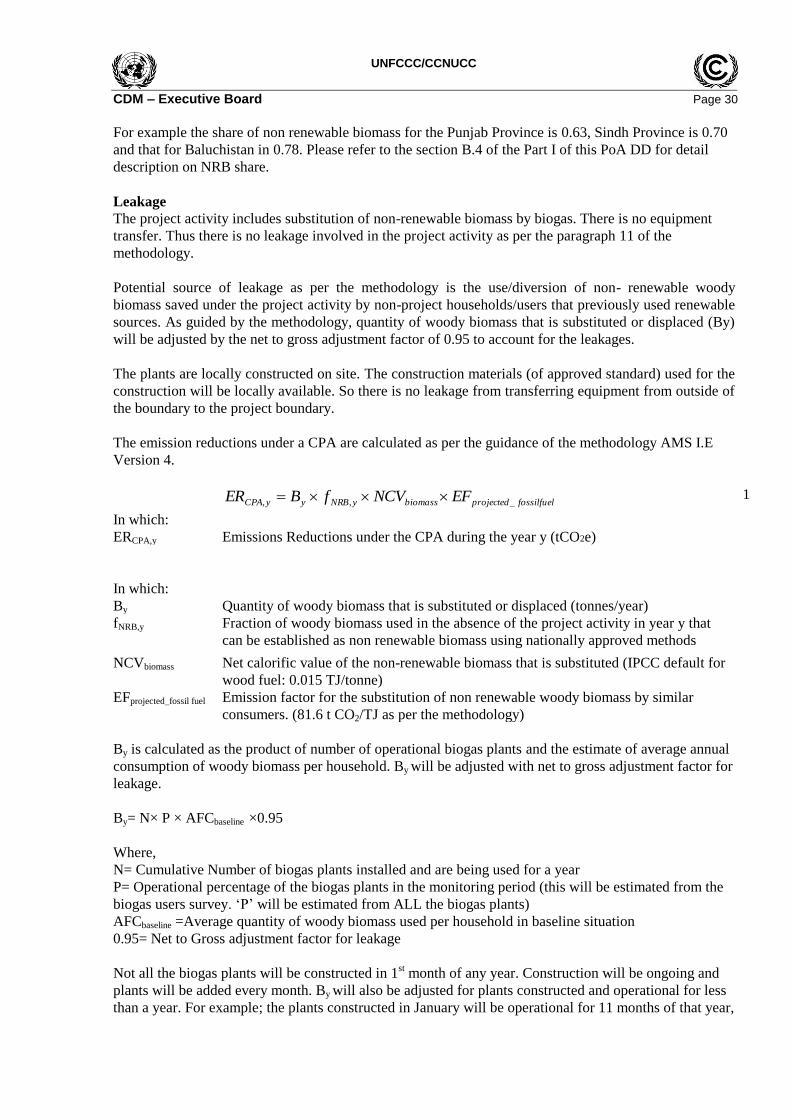
UNFCCC/CCNUCC
CDM – Executive Board Page 30
For example the share of non renewable biomass for the Punjab Province is 0.63, Sindh Province is 0.70
and that for Baluchistan in 0.78. Please refer to the section B.4 of the Part I of this PoA DD for detail
description on NRB share.
Leakage
The project activity includes substitution of non-renewable biomass by biogas. There is no equipment
transfer. Thus there is no leakage involved in the project activity as per the paragraph 11 of the
methodology.
Potential source of leakage as per the methodology is the use/diversion of non- renewable woody
biomass saved under the project activity by non-project households/users that previously used renewable
sources. As guided by the methodology, quantity of woody biomass that is substituted or displaced (By)
will be adjusted by the net to gross adjustment factor of 0.95 to account for the leakages.
The plants are locally constructed on site. The construction materials (of approved standard) used for the
construction will be locally available. So there is no leakage from transferring equipment from outside of
the boundary to the project boundary.
The emission reductions under a CPA are calculated as per the guidance of the methodology AMS I.E
Version 4.
fossilfuelprojectedbiomassyNRByyCPA EFNCVfBER _,, 1
In which:
ERCPA,y Emissions Reductions under the CPA during the year y (tCO2e)
In which:
By Quantity of woody biomass that is substituted or displaced (tonnes/year)
fNRB,y Fraction of woody biomass used in the absence of the project activity in year y that
can be established as non renewable biomass using nationally approved methods
NCVbiomass Net calorific value of the non-renewable biomass that is substituted (IPCC default for
wood fuel: 0.015 TJ/tonne)
EFprojected_fossil fuel Emission factor for the substitution of non renewable woody biomass by similar
consumers. (81.6 t CO2/TJ as per the methodology)
By is calculated as the product of number of operational biogas plants and the estimate of average annual
consumption of woody biomass per household. By will be adjusted with net to gross adjustment factor for
leakage.
By= N× P × AFCbaseline ×0.95
Where,
N= Cumulative Number of biogas plants installed and are being used for a year
P= Operational percentage of the biogas plants in the monitoring period (this will be estimated from the
biogas users survey. „P‟ will be estimated from ALL the biogas plants)
AFCbaseline =Average quantity of woody biomass used per household in baseline situation
0.95= Net to Gross adjustment factor for leakage
Not all the biogas plants will be constructed in 1st month of any year. Construction will be ongoing and
plants will be added every month. By will also be adjusted for plants constructed and operational for less
than a year. For example; the plants constructed in January will be operational for 11 months of that year,
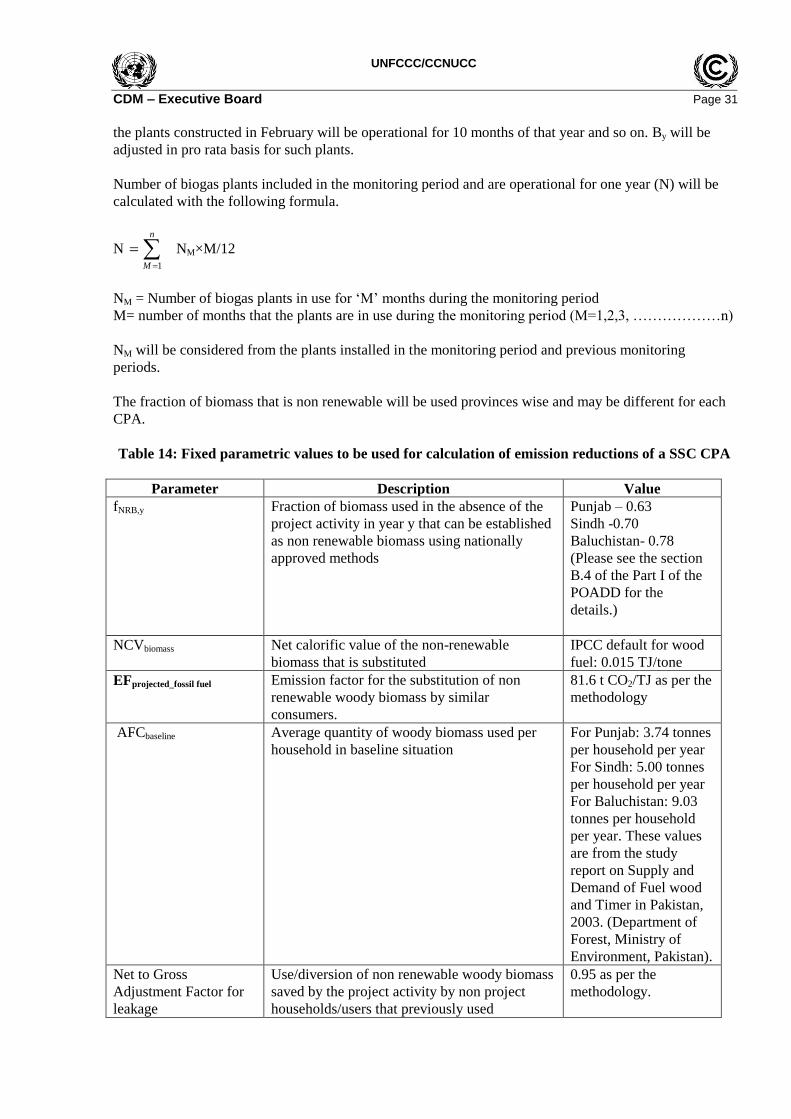
UNFCCC/CCNUCC
CDM – Executive Board Page 31
the plants constructed in February will be operational for 10 months of that year and so on. By will be
adjusted in pro rata basis for such plants.
Number of biogas plants included in the monitoring period and are operational for one year (N) will be
calculated with the following formula.
N
n
M 1
NM×M/12
NM = Number of biogas plants in use for „M‟ months during the monitoring period
M= number of months that the plants are in use during the monitoring period (M=1,2,3, ………………n)
NM will be considered from the plants installed in the monitoring period and previous monitoring
periods.
The fraction of biomass that is non renewable will be used provinces wise and may be different for each
CPA.
Table 14: Fixed parametric values to be used for calculation of emission reductions of a SSC CPA
Parameter Description Value
fNRB,y Fraction of biomass used in the absence of the
project activity in year y that can be established
as non renewable biomass using nationally
approved methods
Punjab – 0.63
Sindh -0.70
Baluchistan- 0.78
(Please see the section
B.4 of the Part I of the
POADD for the
details.)
NCVbiomass Net calorific value of the non-renewable
biomass that is substituted
IPCC default for wood
fuel: 0.015 TJ/tone
EFprojected_fossil fuel Emission factor for the substitution of non
renewable woody biomass by similar
consumers.
81.6 t CO2/TJ as per the
methodology
AFCbaseline Average quantity of woody biomass used per
household in baseline situation
For Punjab: 3.74 tonnes
per household per year
For Sindh: 5.00 tonnes
per household per year
For Baluchistan: 9.03
tonnes per household
per year. These values
are from the study
report on Supply and
Demand of Fuel wood
and Timer in Pakistan,
2003. (Department of
Forest, Ministry of
Environment, Pakistan).
Net to Gross
Adjustment Factor for
leakage
Use/diversion of non renewable woody biomass
saved by the project activity by non project
households/users that previously used
0.95 as per the
methodology.
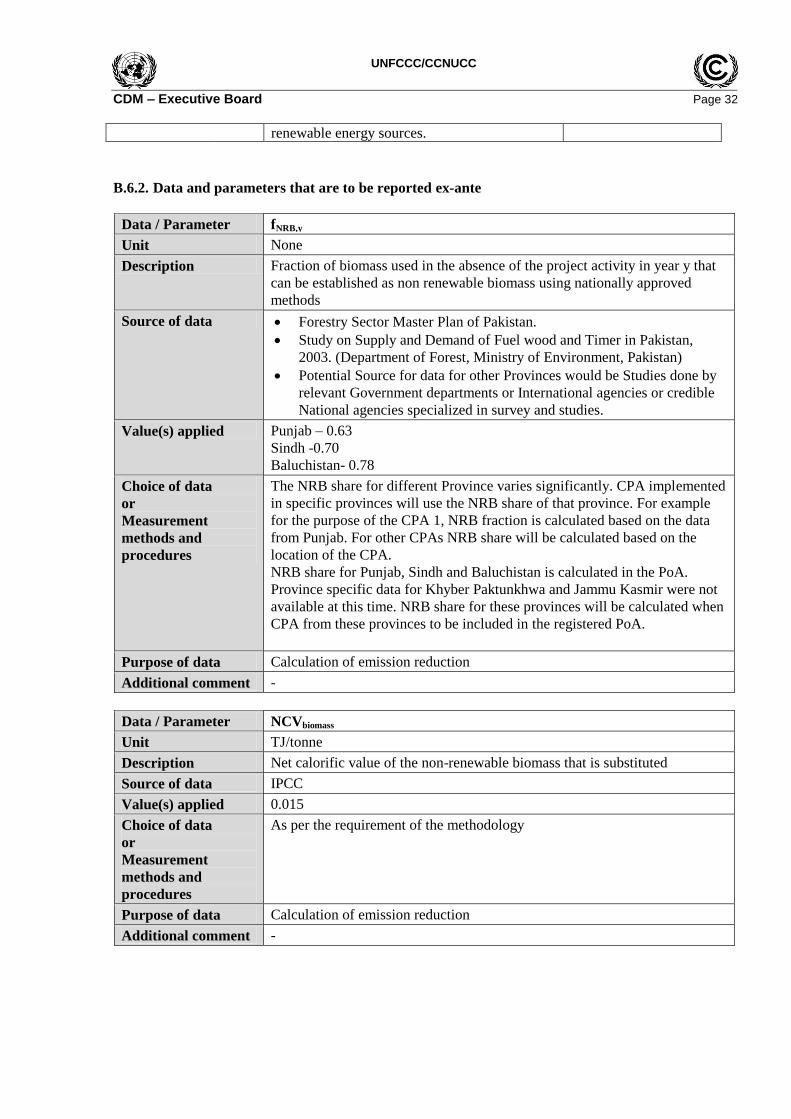
UNFCCC/CCNUCC
CDM – Executive Board Page 32
renewable energy sources.
B.6.2. Data and parameters that are to be reported ex-ante
Data / Parameter fNRB,y
Unit None
Description Fraction of biomass used in the absence of the project activity in year y that
can be established as non renewable biomass using nationally approved
methods
Source of data Forestry Sector Master Plan of Pakistan.
Study on Supply and Demand of Fuel wood and Timer in Pakistan,
2003. (Department of Forest, Ministry of Environment, Pakistan)
Potential Source for data for other Provinces would be Studies done by
relevant Government departments or International agencies or credible
National agencies specialized in survey and studies.
Value(s) applied Punjab – 0.63
Sindh -0.70
Baluchistan- 0.78
Choice of data
or
Measurement
methods and
procedures
The NRB share for different Province varies significantly. CPA implemented
in specific provinces will use the NRB share of that province. For example
for the purpose of the CPA 1, NRB fraction is calculated based on the data
from Punjab. For other CPAs NRB share will be calculated based on the
location of the CPA.
NRB share for Punjab, Sindh and Baluchistan is calculated in the PoA.
Province specific data for Khyber Paktunkhwa and Jammu Kasmir were not
available at this time. NRB share for these provinces will be calculated when
CPA from these provinces to be included in the registered PoA.
Purpose of data Calculation of emission reduction
Additional comment -
Data / Parameter NCVbiomass
Unit TJ/tonne
Description Net calorific value of the non-renewable biomass that is substituted
Source of data IPCC
Value(s) applied 0.015
Choice of data
or
Measurement
methods and
procedures
As per the requirement of the methodology
Purpose of data Calculation of emission reduction
Additional comment -
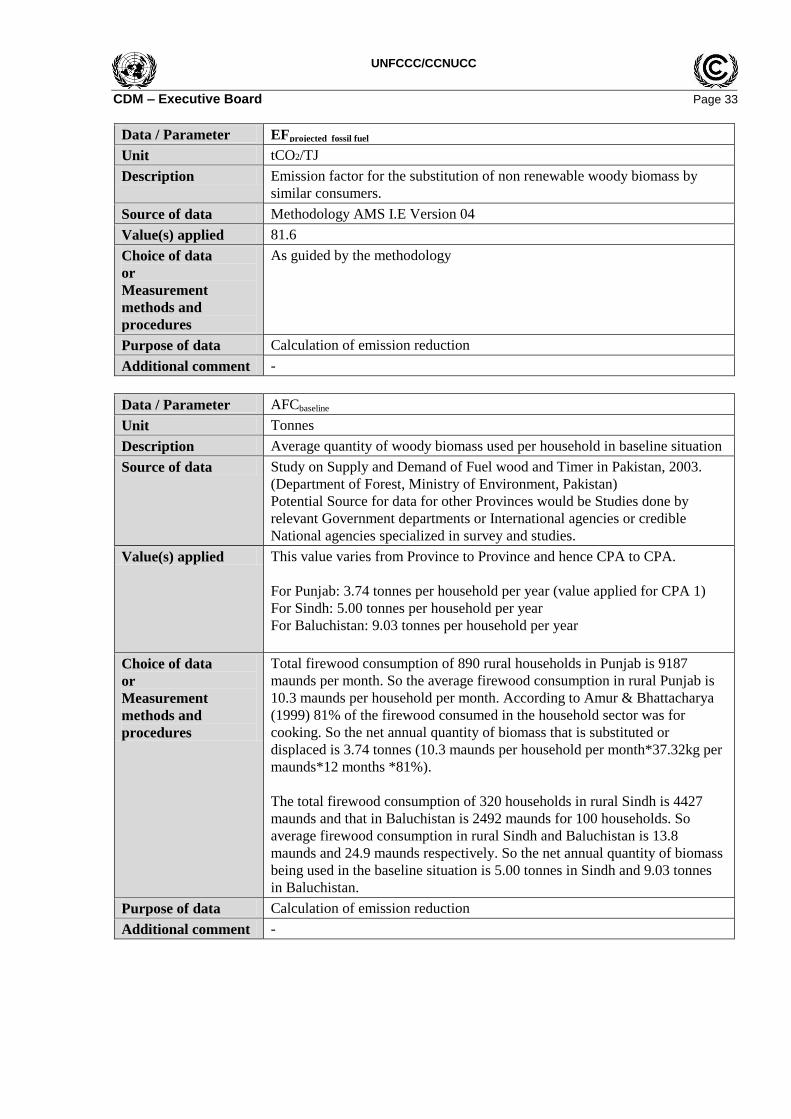
UNFCCC/CCNUCC
CDM – Executive Board Page 33
Data / Parameter EFprojected_fossil fuel
Unit tCO2/TJ
Description Emission factor for the substitution of non renewable woody biomass by
similar consumers.
Source of data Methodology AMS I.E Version 04
Value(s) applied 81.6
Choice of data
or
Measurement
methods and
procedures
As guided by the methodology
Purpose of data Calculation of emission reduction
Additional comment -
Data / Parameter AFCbaseline
Unit Tonnes
Description Average quantity of woody biomass used per household in baseline situation
Source of data Study on Supply and Demand of Fuel wood and Timer in Pakistan, 2003.
(Department of Forest, Ministry of Environment, Pakistan)
Potential Source for data for other Provinces would be Studies done by
relevant Government departments or International agencies or credible
National agencies specialized in survey and studies.
Value(s) applied This value varies from Province to Province and hence CPA to CPA.
For Punjab: 3.74 tonnes per household per year (value applied for CPA 1)
For Sindh: 5.00 tonnes per household per year
For Baluchistan: 9.03 tonnes per household per year
Choice of data
or
Measurement
methods and
procedures
Total firewood consumption of 890 rural households in Punjab is 9187
maunds per month. So the average firewood consumption in rural Punjab is
10.3 maunds per household per month. According to Amur & Bhattacharya
(1999) 81% of the firewood consumed in the household sector was for
cooking. So the net annual quantity of biomass that is substituted or
displaced is 3.74 tonnes (10.3 maunds per household per month*37.32kg per
maunds*12 months *81%).
The total firewood consumption of 320 households in rural Sindh is 4427
maunds and that in Baluchistan is 2492 maunds for 100 households. So
average firewood consumption in rural Sindh and Baluchistan is 13.8
maunds and 24.9 maunds respectively. So the net annual quantity of biomass
being used in the baseline situation is 5.00 tonnes in Sindh and 9.03 tonnes
in Baluchistan.
Purpose of data Calculation of emission reduction
Additional comment -
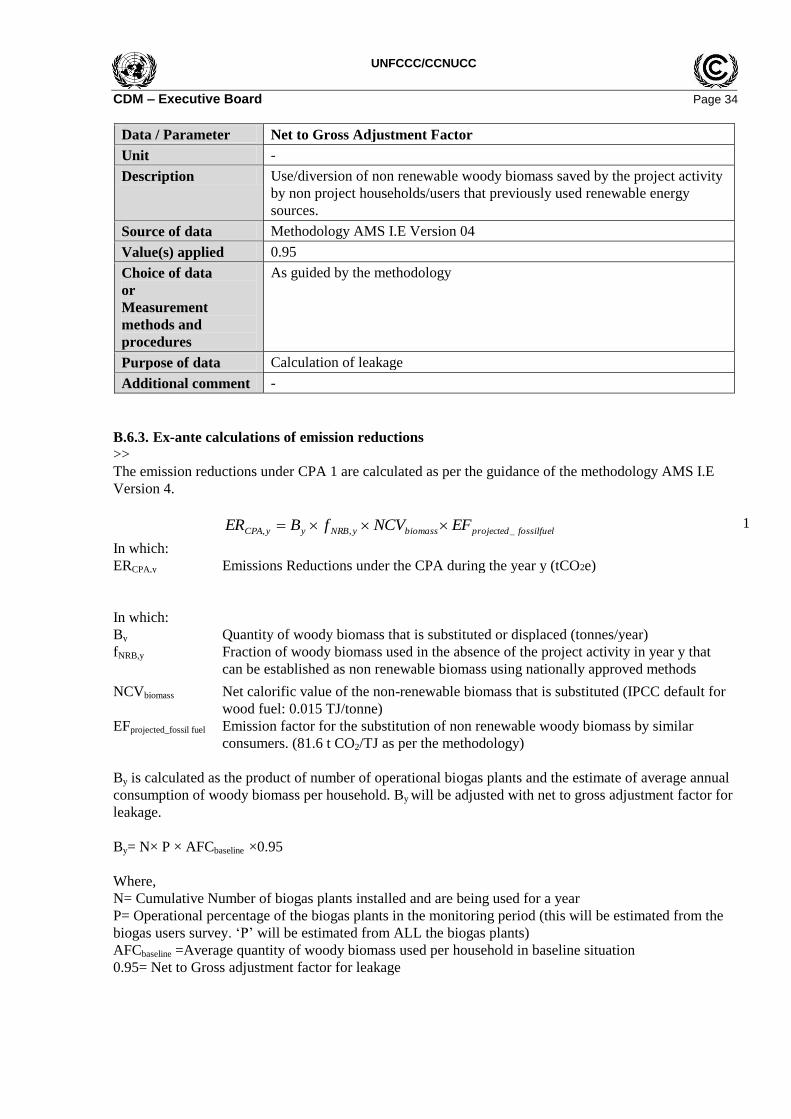
UNFCCC/CCNUCC
CDM – Executive Board Page 34
Data / Parameter Net to Gross Adjustment Factor
Unit -
Description Use/diversion of non renewable woody biomass saved by the project activity
by non project households/users that previously used renewable energy
sources.
Source of data Methodology AMS I.E Version 04
Value(s) applied 0.95
Choice of data
or
Measurement
methods and
procedures
As guided by the methodology
Purpose of data Calculation of leakage
Additional comment -
B.6.3. Ex-ante calculations of emission reductions
>>
The emission reductions under CPA 1 are calculated as per the guidance of the methodology AMS I.E
Version 4.
fossilfuelprojectedbiomassyNRByyCPA EFNCVfBER _,, 1
In which:
ERCPA,y Emissions Reductions under the CPA during the year y (tCO2e)
In which:
By Quantity of woody biomass that is substituted or displaced (tonnes/year)
fNRB,y Fraction of woody biomass used in the absence of the project activity in year y that
can be established as non renewable biomass using nationally approved methods
NCVbiomass Net calorific value of the non-renewable biomass that is substituted (IPCC default for
wood fuel: 0.015 TJ/tonne)
EFprojected_fossil fuel Emission factor for the substitution of non renewable woody biomass by similar
consumers. (81.6 t CO2/TJ as per the methodology)
By is calculated as the product of number of operational biogas plants and the estimate of average annual
consumption of woody biomass per household. By will be adjusted with net to gross adjustment factor for
leakage.
By= N× P × AFCbaseline ×0.95
Where,
N= Cumulative Number of biogas plants installed and are being used for a year
P= Operational percentage of the biogas plants in the monitoring period (this will be estimated from the
biogas users survey. „P‟ will be estimated from ALL the biogas plants)
AFCbaseline =Average quantity of woody biomass used per household in baseline situation
0.95= Net to Gross adjustment factor for leakage
UNFCCC/CCNUCC
CDM – Executive Board Page 35
Not all the biogas plants will be constructed in 1
st month of any year. Construction will be ongoing and
plants will be added every month. By will also be adjusted for plants constructed and operational for less
than a year. For example; the plants constructed in January will be operational for 11 months of that year,
the plants constructed in February will be operational for 10 months of that year and so on. By will be
adjusted in pro rata basis for such plants.
Number of biogas plants included in the monitoring period and are operational for one year (N) will be
calculated with the following formula.
N
n
M 1
NM×M/12
NM = Number of biogas plants in use for „M‟ months during the monitoring period
M= number of months that the plants are in use during the monitoring period (M=1,2,3, ………………n)
NM will be considered from the plants installed in the monitoring period and previous monitoring
periods.
Calculation of emission reduction of 1 plant:
Assumptions:
Plant is operational for 12 months in a monitoring period
Operational percentage is assumed as 100% for sample calculation. Actual operational percentage will be
used during the emission reduction report preparation.
M= 12 months
N
n
M 1
NM×M/12
Hence N = 1x12/12 = 1
By= N× P × AFCbaseline ×0.95
Here,
N=1
P= 100%
According to Supply and Demand of Fuel wood and Timber for Household and Industrial Sectors and
Consumption Pattern of Wood Products in Pakistan, 2003 (Table 3-10 Page 35), Quantity of firewood
used per month per household = 10.3 Maunds .
According to Amur & Bhattacharya (1999) 81% of the fuel wood consumed in the household sector was
for cooking. So Quantity of biomass that is substituted or displaced in tonnes is 8.36 Maund/hh/month.
AFCbaseline =8.36 Maund/hh/month
=312.04 kg/hh/month
=3.74 tonnes/hh/year (1 maund =37.32 kg Source : Letter from Ministry of National Disaster
Management, Department of Forest, Pakistan
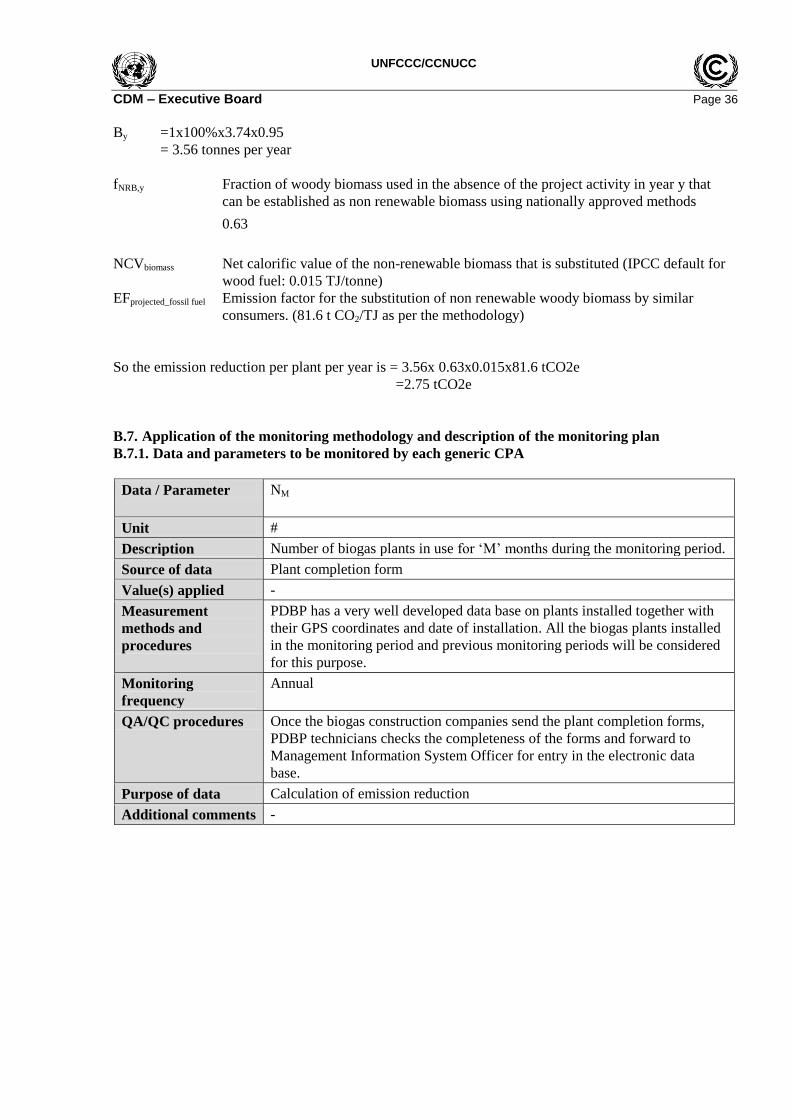
UNFCCC/CCNUCC
CDM – Executive Board Page 36
By =1x100%x3.74x0.95
= 3.56 tonnes per year
fNRB,y Fraction of woody biomass used in the absence of the project activity in year y that
can be established as non renewable biomass using nationally approved methods
0.63
NCVbiomass Net calorific value of the non-renewable biomass that is substituted (IPCC default for
wood fuel: 0.015 TJ/tonne)
EFprojected_fossil fuel Emission factor for the substitution of non renewable woody biomass by similar
consumers. (81.6 t CO2/TJ as per the methodology)
So the emission reduction per plant per year is = 3.56x 0.63x0.015x81.6 tCO2e
=2.75 tCO2e
B.7. Application of the monitoring methodology and description of the monitoring plan
B.7.1. Data and parameters to be monitored by each generic CPA
Data / Parameter NM
Unit #
Description Number of biogas plants in use for „M‟ months during the monitoring period.
Source of data Plant completion form
Value(s) applied -
Measurement
methods and
procedures
PDBP has a very well developed data base on plants installed together with
their GPS coordinates and date of installation. All the biogas plants installed
in the monitoring period and previous monitoring periods will be considered
for this purpose.
Monitoring
frequency
Annual
QA/QC procedures Once the biogas construction companies send the plant completion forms,
PDBP technicians checks the completeness of the forms and forward to
Management Information System Officer for entry in the electronic data
base.
Purpose of data Calculation of emission reduction
Additional comments -
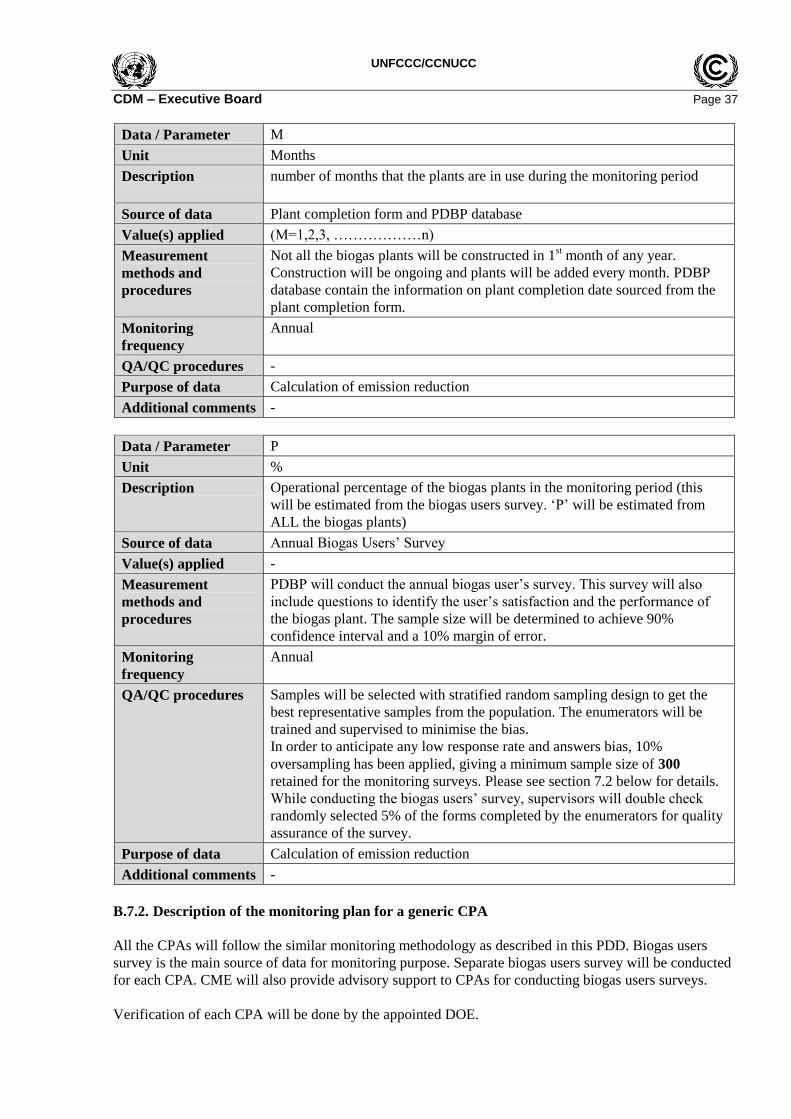
UNFCCC/CCNUCC
CDM – Executive Board Page 37
Data / Parameter M
Unit Months
Description number of months that the plants are in use during the monitoring period
Source of data Plant completion form and PDBP database
Value(s) applied (M=1,2,3, ………………n)
Measurement
methods and
procedures
Not all the biogas plants will be constructed in 1st month of any year.
Construction will be ongoing and plants will be added every month. PDBP
database contain the information on plant completion date sourced from the
plant completion form.
Monitoring
frequency
Annual
QA/QC procedures -
Purpose of data Calculation of emission reduction
Additional comments -
Data / Parameter P
Unit %
Description Operational percentage of the biogas plants in the monitoring period (this
will be estimated from the biogas users survey. „P‟ will be estimated from
ALL the biogas plants)
Source of data Annual Biogas Users‟ Survey
Value(s) applied -
Measurement
methods and
procedures
PDBP will conduct the annual biogas user‟s survey. This survey will also
include questions to identify the user‟s satisfaction and the performance of
the biogas plant. The sample size will be determined to achieve 90%
confidence interval and a 10% margin of error.
Monitoring
frequency
Annual
QA/QC procedures Samples will be selected with stratified random sampling design to get the
best representative samples from the population. The enumerators will be
trained and supervised to minimise the bias.
In order to anticipate any low response rate and answers bias, 10%
oversampling has been applied, giving a minimum sample size of 300
retained for the monitoring surveys. Please see section 7.2 below for details.
While conducting the biogas users‟ survey, supervisors will double check
randomly selected 5% of the forms completed by the enumerators for quality
assurance of the survey.
Purpose of data Calculation of emission reduction
Additional comments -
B.7.2. Description of the monitoring plan for a generic CPA
All the CPAs will follow the similar monitoring methodology as described in this PDD. Biogas users
survey is the main source of data for monitoring purpose. Separate biogas users survey will be conducted
for each CPA. CME will also provide advisory support to CPAs for conducting biogas users surveys.
Verification of each CPA will be done by the appointed DOE.
UNFCCC/CCNUCC
CDM – Executive Board Page 38
In line with Indicative simplified baseline and monitoring methodologies for selected small-scale CDM
project activity categories for the Type I. E - Renewable Energy Projects,.: “Switch from Non-Renewable
Biomass for Thermal Application by the user“ version 4 requires to monitor the following parameters.
1. Monitoring shall consist of an annual check of all appliances or a representative sample thereof to
ensure that they are still operating or are replaced by an equivalent in service appliance.
2. In order to assess the leakages relating to the NRB, Monitoring shall include data on the amount of
woody biomass saved under the project activity that is used by non-project households/users (who
previously used renewable energy sources).
3. Monitoring should confirm the displacement or substitution of the non-renewable woody biomass
at each location. In the case of appliances switching to renewable biomass the quantity of
renewable biomass used shall be monitored.
4. In case option (b) in paragraph 6 is chosen for baseline calculations, monitoring shall include the
amount of thermal energy generated by the new renewable energy technology.
5. In the case of renewable energy based water treatment technologies, water quality shall be
monitored to ensure that it conforms to drinking water quality specified in relevant national
microbiological water quality guidelines/standards of the host country. In case a national
standard/guideline is not available, the standards/guidelines by the World Health Organization
(WHO) or United States Environmental Protection Agency (US-EPA) shall be applied.
PDBP will conduct the annual monitoring by selecting the representative samples of the installed and
operated biogas plants in the specific monitoring period. As per the “Standard for sampling and surveys
for CDM project activities and programme of activities”, the sample size shall be chosen for a 90/10
precision (90% confidence interval and 10% margin of error) for parameter values used to determine
emission reductions. As 5 different sized biogas plants are being installed in the project area, Stratified
random samples per size category will be selected. Once number of samples required per size category is
calculated based on the number of plants constructed and operational in that monitoring period, samples
will be selected randomly from PDBP‟s electronic data base.
Enumerators will be trained on basic concept of the PDBP and administering of the developed
questionnaire before sending to the field. They will also fill questionnaires during the training process
and problems faced during the test filling will be shared and discussed to avoid similar problems in the
actual survey. Biogas Technicians of PDBP in the field will provide support if needed. Customized data
entry software will be developed and all the filled questionnaires will be recorded in the software. MIS
Officer of PDBP will check the quality of the data entered into the electronic database system.
Prior to the training, questionnaires will be translated in local language and pre-tested.
In order to estimate the leakage, By will be adjusted by the net to gross adjustment factor of 0.95 as
guided by the methodology.
In order to confirm the displacement of non renewable woody biomass, only the plant where the
household was using non renewable woody biomass in the baseline situation and using biogas for
cooking will be included in the CPA. The prior construction form for each of the households will be
filled to confirm the use of biomass for cooking in the baseline situation. The households not using the
biomass for cooking before the plant is constructed will not be included in any CPA. The displacement of
non renewable biomass will be confirmed by including only the operational biogas plants from where the
gas is being used for cooking,
UNFCCC/CCNUCC
CDM – Executive Board Page 39
Fourth provisions of the monitoring is not relevant in this case as the quantity of biogas displaced is
calculated as the product of the number of appliances multiplied by the estimate of average annual
consumption of woody biomass per appliance.
Similarly fifth provision is not relevant in this case as this is not the case of renewable energy based
water treatment technologies.
Sampling Plan
Sampling objectives
PDBP will conduct the annual monitoring to find out the annual performance of the biogas plants
installed by selecting the representative samples of the installed and operated biogas plants in the specific
monitoring period.
Field Measurement Objectives and Data to be collected
Performance of the biogas plants installed will be monitored annually. As 5 different sized biogas plants
are being installed in the project area, Stratified random samples per size category will be selected. Once
number of samples required per size category is calculated based on the number of plants constructed and
operational in that monitoring period, samples will be selected randomly from PDBP‟s electronic data
base. Operational plant will be identified by asking the sample households if the plant installed in his/her
house is producing gas regularly or not.
The number of total installed plants will be multiplied by the percent of operational plants to get the
actual number of operational plants in that monitoring period.
Target Population and sampling frame
The total number of plants installed and operated in that monitoring period will be the total population.
Out of these plants samples will be selected. Proportionate samples will be selected from each size
category i.e. 4 m3, 6 m
3, 8 m
3, 10 m
3 and 15 m
3 biogas plants.
Sampling method
Stratified random sampling will be used to select the sample biogas plants. Stratification will be done by
size category of the plants. Once the total number of sample is calculated, the proportionate samples from
each size category will be selected to ensure the representation of all size plants. Within the strata a
simple random sampling will be used to select the sample.
Desired Precision/Expected Variance and Sample Size
As guided by the EB, the sample size shall be chosen for a 90/10 precision (90% confidence interval and
10% margin of error).
Once the samples are surveyed, percentage of the operational biogas plants out of plants included in the
monitoring period will be calculated.
Number of biogas plants operational for “M‟ months (during the monitoring period) will be sourced from
the plant completion forms.
The sample size is determined using the Standard for sampling and surveys for CDM project activities
and programme of activities. As required by AMS I.E for annual surveys, the level of precision will be
90/10. (90% confidence interval and 10% margin of error).
The minimum sample size is calculated using;
n = t2×p×q/d
2
UNFCCC/CCNUCC
CDM – Executive Board Page 40
Where:
t = value for the standard normal distribution value, with an infinite number of readings, and for the
desired confidence level. For confidence level of 90% , t = 1.65
(pxq) = estimate of variance value = 0.25, meaning standard deviation (variability) of 50% is assumed.
d = acceptable margin of error (precision) for proportion being estimated 10%. As this is the real
precision expected, d would be 10%x50%
n = (1.65)2×.25/(0.1x0.5%)
2
= 272
In order to anticipate any low response rate and answers bias, 10% oversampling has been applied, giving
a minimum sample size of 300 retained for the monitoring surveys.
A biogas plant is operational means the household is using biogas for cooking and replacing the cooking
fuel used in the baseline situation. Those plants, where biomass was used in the baseline situation will be
considered for emission reduction. From the first Biogas users‟ survey conducted in CPA 1, the
operational percentage is 94%. It may vary but will be around this figure.
Procedures for Administering Data Collection and Minimizing Non-Sampling Errors
Enumerators will be trained on basic concept of the PDBP and filling of the developed questionnaire
before sending to the field. They will also fill questionnaires during the training process and problems
faced during the test filling will be shared and discussed to avoid similar problems in the actual survey.
Biogas Technicians of PDBP in the field will provide support if needed. Customized data entry software
will be developed and all the filled questionnaires will be recorded in the software. MIS Officer of PDBP
will check the quality of the data entered into the database system.
Prior to the training, questionnaires will be translated in local language and pre tested.
Implementation
Each plant installed will have an unique plant identification number and a data base is maintained at
PDBP offices. Random samples will be selected from the PDBP data base.
In order to estimate the leakage By will be adjusted by the net to gross adjustment factor of 0.95 as
guided by the methodology.
Quality Assurance and Quality Control
Samples will be selected with stratified random sampling design to get the best representative samples
from the population. The enumerators will be trained and supervised to minimise the bias.
In order to anticipate any low response rate and answers bias, 10% oversampling has been applied, giving
a minimum sample size of 300 retained for the monitoring surveys. Please see section 7.2 below for
details.
While conducting the biogas users‟ survey, supervisors will double check randomly selected 5% of the
forms completed by the enumerators for quality assurance of the survey. The following table describe the
monitoring plan.
UNFCCC/CCNUCC
CDM – Executive Board Page 41
Table 15: Monitoring Plan
Data to be
monitored
Description Frequency Data
source
Number of
biogas plants
operational for
“M’ months
(during the
monitoring
period)
Cumulative number of biogas plants operational
during the monitoring period under each CPA will
be obtained from project data base.
Annually Plant
Completi
on form
Operational
percentage of
the biogas
plants in the
monitoring
period.
Operational percentage of the biogas plants in the
monitoring period will be estimated from the
biogas users survey and will be the operational
percentage of all the biogas plants
Since the emissions reduction per system is less
than 5 tons of CO2e per year, number of operating
plants will be checked annually. For this purpose,
the Biogas Users‟ Survey will be conducted for
the representative samples annually. The sample
will include the proportionate representations
from 4 m3, 6 m
3, and 8 m
3, 10 m
3, 15 m
3 plants
included in each CPA.
Operational plant will be identified by asking the
sample households if the plant installed in his/her
house is producing gas regularly or not; and if the
household has been using cow/buffalo dung to
feed the plant. The enumerators will also
physically check the operational status of the plant
during the user‟s survey.
Some of the indicators they will check include;
physical condition of inlet, physical condition of
biogas stove, color of the flame and over flow of
the slurry among others.
Annually Annual
Biogas
User‟s
Survey
NRB displaced
or substituted
A biogas plant is operational means the household
is using biogas for cooking and replacing the
cooking fuel used in the baseline situation. In each
CPA, biogas user households using NRB for
cooking install biogas plants and the use of NRB
will be replaced by the biogas. Those biogas
plants, where biomass was used in the baseline
situation (confirmed by the prior construction
survey form) and households with operational
biogas plant (confirmed by the annual monitoring
through biogas users‟ survey) will be considered
for emission reduction.
Annually PDBP
data base
Annual
Biogas
Users‟
Survey
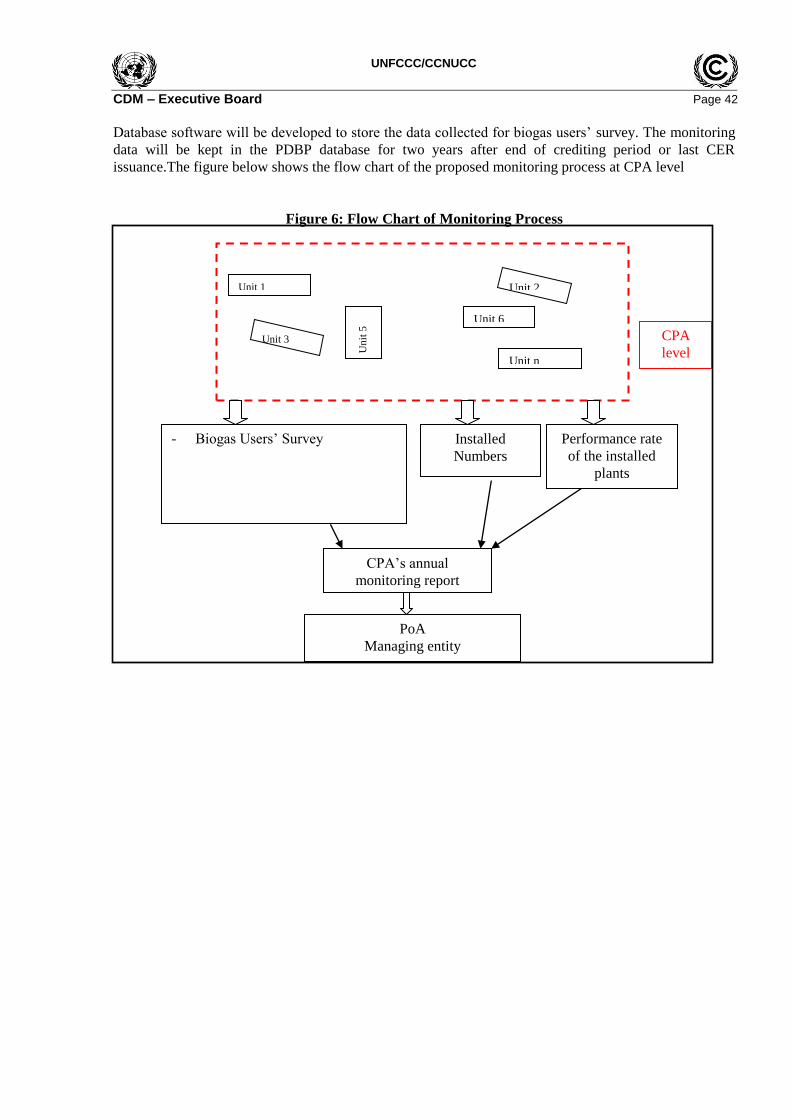
UNFCCC/CCNUCC
CDM – Executive Board Page 42
Database software will be developed to store the data collected for biogas users‟ survey. The monitoring
data will be kept in the PDBP database for two years after end of crediting period or last CER
issuance.The figure below shows the flow chart of the proposed monitoring process at CPA level
Figure 6: Flow Chart of Monitoring Process
- - - - -
Unit 1 Unit 2
Un
it 5
Unit 6
Unit 3
Unit n
- Biogas Users‟ Survey Installed
Numbers
-
CPA
level
PoA
Managing entity
CPA‟s annual
monitoring report
Performance rate
of the installed
plants
-
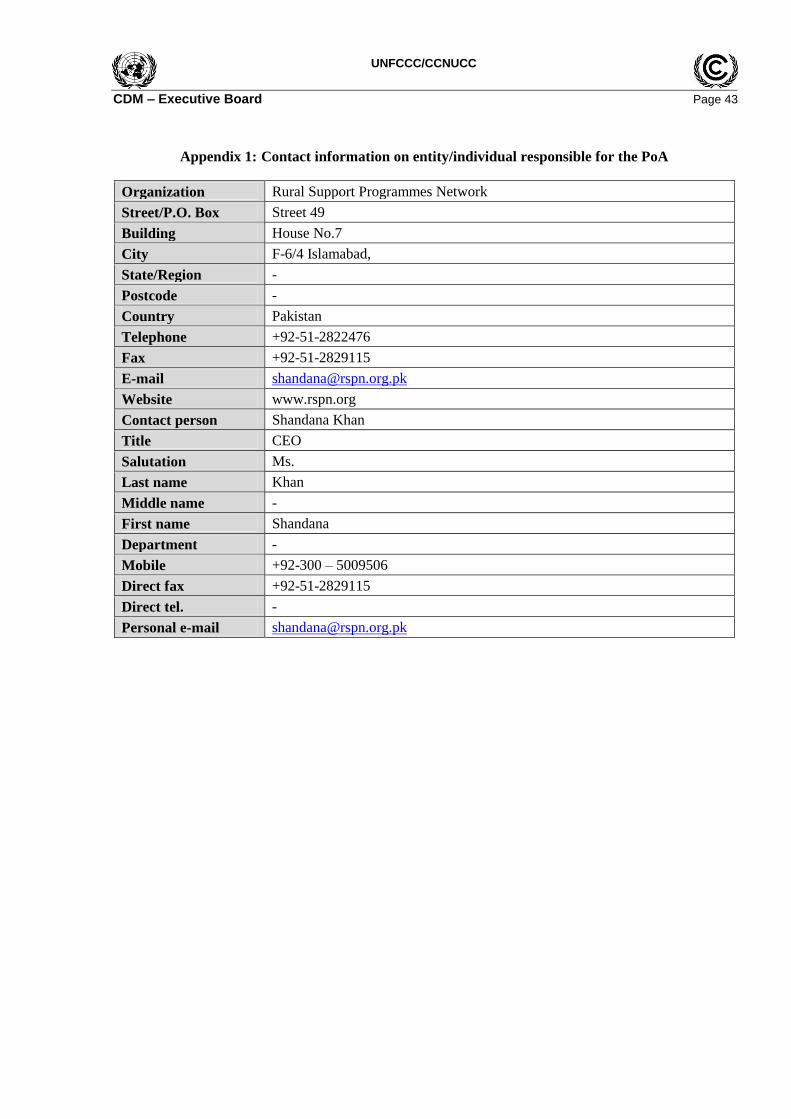
UNFCCC/CCNUCC
CDM – Executive Board Page 43
Appendix 1: Contact information on entity/individual responsible for the PoA
Organization Rural Support Programmes Network
Street/P.O. Box Street 49
Building House No.7
City F-6/4 Islamabad,
State/Region -
Postcode -
Country Pakistan
Telephone +92-51-2822476
Fax +92-51-2829115
E-mail [email protected]
Website www.rspn.org
Contact person Shandana Khan
Title CEO
Salutation Ms.
Last name Khan
Middle name -
First name Shandana
Department -
Mobile +92-300 – 5009506
Direct fax +92-51-2829115
Direct tel. -
Personal e-mail [email protected]

UNFCCC/CCNUCC
CDM – Executive Board Page 44
Appendix 2: Affirmation regarding public funding
Besides from the investment of the households, there may be use of public fund. In such case, the
funding agency will issue a letter to confirm that the public funding to support to the PDBP does not
result in a diversion of Official Development Assistance and is separate from and is not counted towards
the donor country‟s financial obligations as party included in Annex 1 countries.
Each of the CPA may have different funding mix. Relevant information will be provided in CPA DDs.

UNFCCC/CCNUCC
CDM – Executive Board Page 45
Appendix 3: Application of methodology(ies)
Detailed on application of methodology is described in Part I section B.3 and Part II section B.2.

UNFCCC/CCNUCC
CDM – Executive Board Page 46
Appendix 4: Further background information on ex ante calculation of emission reductions
Detailed information on ex ante calculation of emission reductions is described in section B6.3 of Part II
of this PoA DD.

UNFCCC/CCNUCC
CDM – Executive Board Page 47
Appendix 5: Further background information on the monitoring plan
Detailed Monitoring plan is described in section B.7.2 of Part II of this PoA DD.
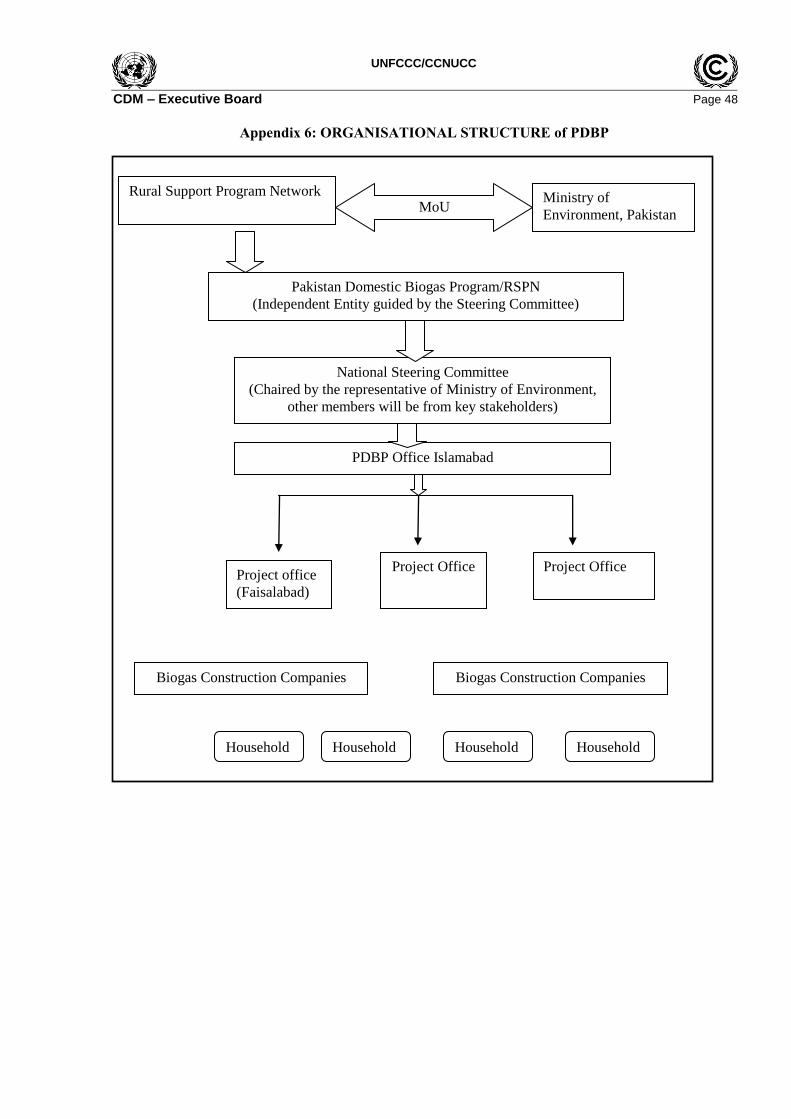
UNFCCC/CCNUCC
CDM – Executive Board Page 48
Appendix 6: ORGANISATIONAL STRUCTURE of PDBP
Rural Support Program Network
Pakistan Domestic Biogas Program/RSPN
(Independent Entity guided by the Steering Committee)
Ministry of
Environment, Pakistan MoU
National Steering Committee
(Chaired by the representative of Ministry of Environment,
other members will be from key stakeholders)
Project office
(Faisalabad)
Project Office
Project Office
PDBP Office Islamabad
Biogas Construction Companies Biogas Construction Companies
Household Household Household Household
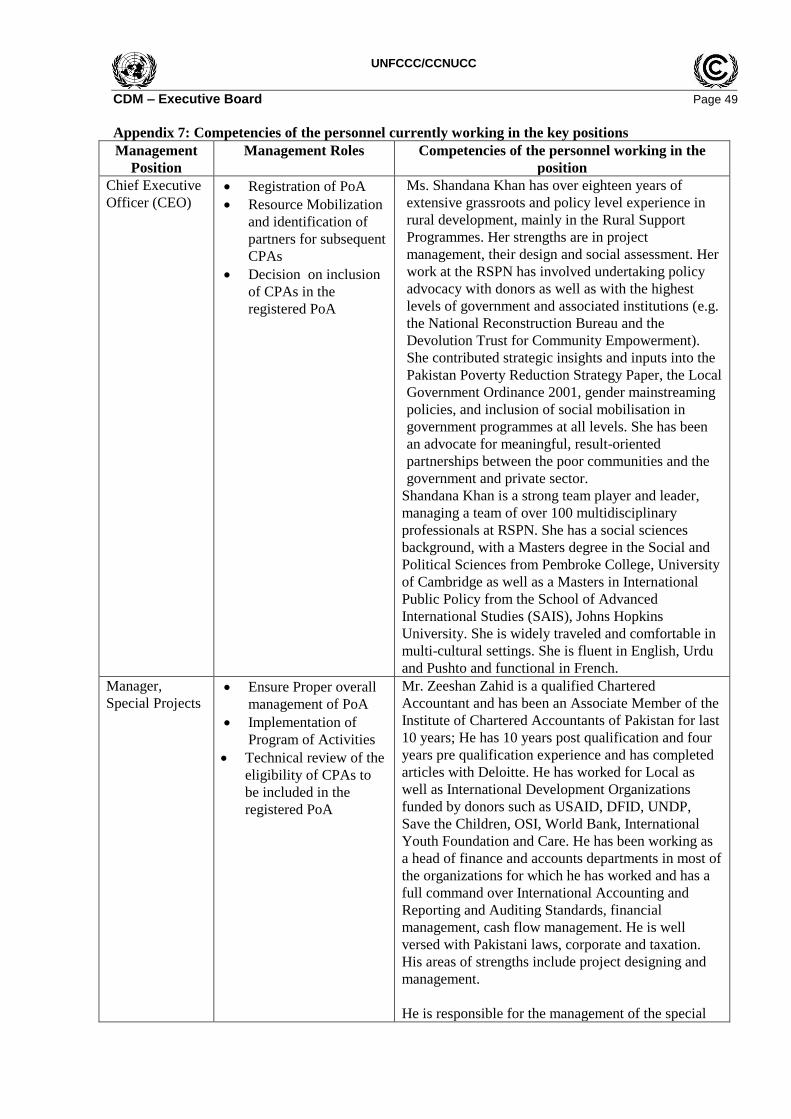
UNFCCC/CCNUCC
CDM – Executive Board Page 49
Appendix 7: Competencies of the personnel currently working in the key positions
Management
Position
Management Roles Competencies of the personnel working in the
position
Chief Executive
Officer (CEO) Registration of PoA
Resource Mobilization
and identification of
partners for subsequent
CPAs
Decision on inclusion
of CPAs in the
registered PoA
Ms. Shandana Khan has over eighteen years of
extensive grassroots and policy level experience in
rural development, mainly in the Rural Support
Programmes. Her strengths are in project
management, their design and social assessment. Her
work at the RSPN has involved undertaking policy
advocacy with donors as well as with the highest
levels of government and associated institutions (e.g.
the National Reconstruction Bureau and the
Devolution Trust for Community Empowerment).
She contributed strategic insights and inputs into the
Pakistan Poverty Reduction Strategy Paper, the Local
Government Ordinance 2001, gender mainstreaming
policies, and inclusion of social mobilisation in
government programmes at all levels. She has been
an advocate for meaningful, result-oriented
partnerships between the poor communities and the
government and private sector.
Shandana Khan is a strong team player and leader,
managing a team of over 100 multidisciplinary
professionals at RSPN. She has a social sciences
background, with a Masters degree in the Social and
Political Sciences from Pembroke College, University
of Cambridge as well as a Masters in International
Public Policy from the School of Advanced
International Studies (SAIS), Johns Hopkins
University. She is widely traveled and comfortable in
multi-cultural settings. She is fluent in English, Urdu
and Pushto and functional in French.
Manager,
Special Projects Ensure Proper overall
management of PoA
Implementation of
Program of Activities
Technical review of the
eligibility of CPAs to
be included in the
registered PoA
Mr. Zeeshan Zahid is a qualified Chartered
Accountant and has been an Associate Member of the
Institute of Chartered Accountants of Pakistan for last
10 years; He has 10 years post qualification and four
years pre qualification experience and has completed
articles with Deloitte. He has worked for Local as
well as International Development Organizations
funded by donors such as USAID, DFID, UNDP,
Save the Children, OSI, World Bank, International
Youth Foundation and Care. He has been working as
a head of finance and accounts departments in most of
the organizations for which he has worked and has a
full command over International Accounting and
Reporting and Auditing Standards, financial
management, cash flow management. He is well
versed with Pakistani laws, corporate and taxation.
His areas of strengths include project designing and
management.
He is responsible for the management of the special
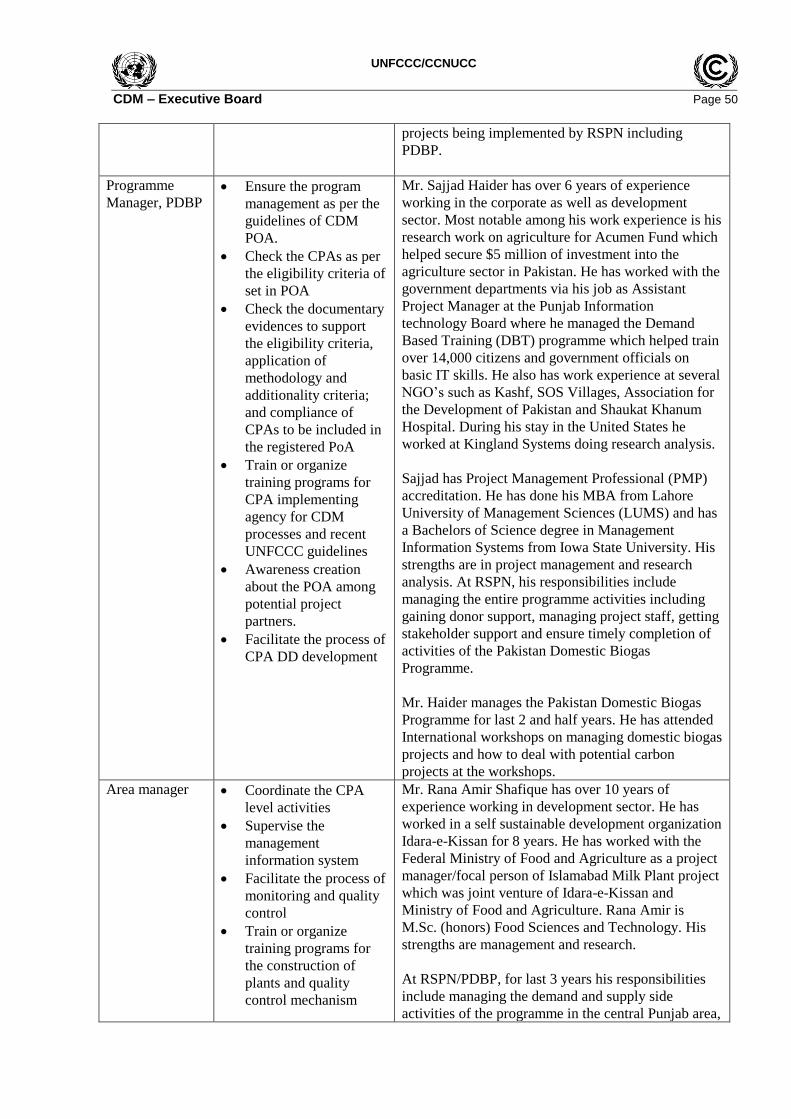
UNFCCC/CCNUCC
CDM – Executive Board Page 50
projects being implemented by RSPN including
PDBP.
Programme
Manager, PDBP Ensure the program
management as per the
guidelines of CDM
POA.
Check the CPAs as per
the eligibility criteria of
set in POA
Check the documentary
evidences to support
the eligibility criteria,
application of
methodology and
additionality criteria;
and compliance of
CPAs to be included in
the registered PoA
Train or organize
training programs for
CPA implementing
agency for CDM
processes and recent
UNFCCC guidelines
Awareness creation
about the POA among
potential project
partners.
Facilitate the process of
CPA DD development
Mr. Sajjad Haider has over 6 years of experience
working in the corporate as well as development
sector. Most notable among his work experience is his
research work on agriculture for Acumen Fund which
helped secure $5 million of investment into the
agriculture sector in Pakistan. He has worked with the
government departments via his job as Assistant
Project Manager at the Punjab Information
technology Board where he managed the Demand
Based Training (DBT) programme which helped train
over 14,000 citizens and government officials on
basic IT skills. He also has work experience at several
NGO‟s such as Kashf, SOS Villages, Association for
the Development of Pakistan and Shaukat Khanum
Hospital. During his stay in the United States he
worked at Kingland Systems doing research analysis.
Sajjad has Project Management Professional (PMP)
accreditation. He has done his MBA from Lahore
University of Management Sciences (LUMS) and has
a Bachelors of Science degree in Management
Information Systems from Iowa State University. His
strengths are in project management and research
analysis. At RSPN, his responsibilities include
managing the entire programme activities including
gaining donor support, managing project staff, getting
stakeholder support and ensure timely completion of
activities of the Pakistan Domestic Biogas
Programme.
Mr. Haider manages the Pakistan Domestic Biogas
Programme for last 2 and half years. He has attended
International workshops on managing domestic biogas
projects and how to deal with potential carbon
projects at the workshops.
Area manager Coordinate the CPA
level activities
Supervise the
management
information system
Facilitate the process of
monitoring and quality
control
Train or organize
training programs for
the construction of
plants and quality
control mechanism
Mr. Rana Amir Shafique has over 10 years of
experience working in development sector. He has
worked in a self sustainable development organization
Idara-e-Kissan for 8 years. He has worked with the
Federal Ministry of Food and Agriculture as a project
manager/focal person of Islamabad Milk Plant project
which was joint venture of Idara-e-Kissan and
Ministry of Food and Agriculture. Rana Amir is
M.Sc. (honors) Food Sciences and Technology. His
strengths are management and research.
At RSPN/PDBP, for last 3 years his responsibilities
include managing the demand and supply side
activities of the programme in the central Punjab area,
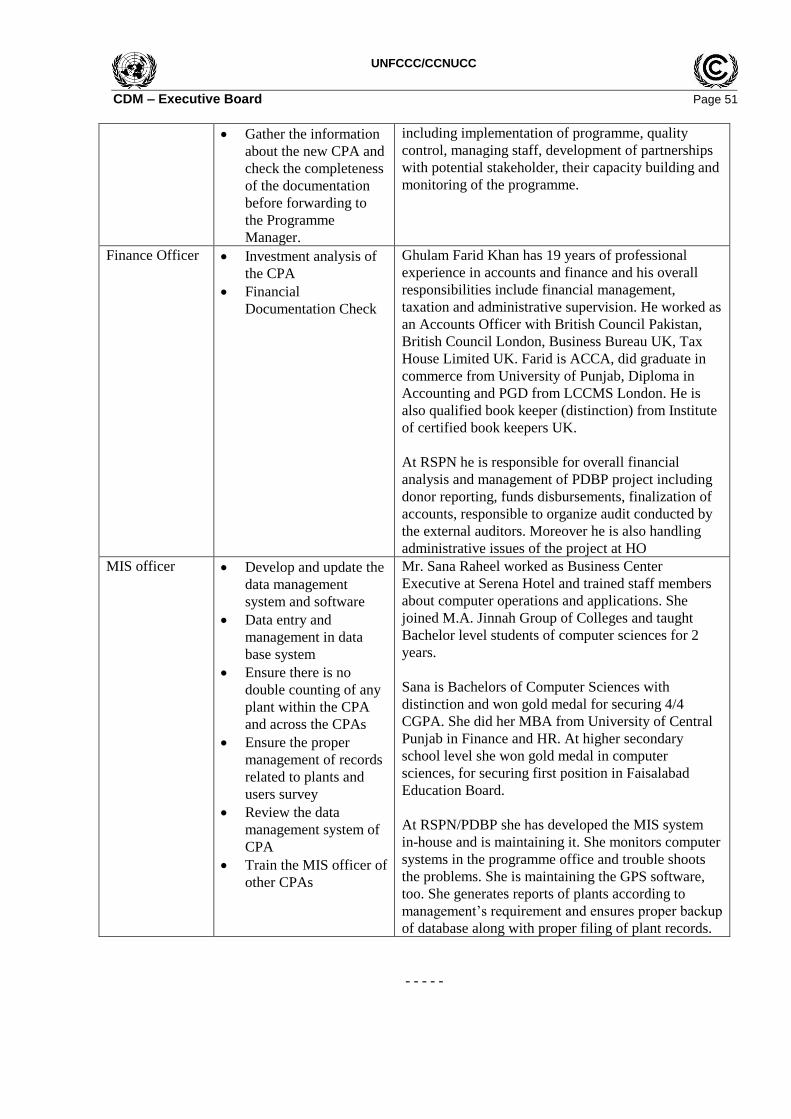
UNFCCC/CCNUCC
CDM – Executive Board Page 51
Gather the information
about the new CPA and
check the completeness
of the documentation
before forwarding to
the Programme
Manager.
including implementation of programme, quality
control, managing staff, development of partnerships
with potential stakeholder, their capacity building and
monitoring of the programme.
Finance Officer Investment analysis of
the CPA
Financial
Documentation Check
Ghulam Farid Khan has 19 years of professional
experience in accounts and finance and his overall
responsibilities include financial management,
taxation and administrative supervision. He worked as
an Accounts Officer with British Council Pakistan,
British Council London, Business Bureau UK, Tax
House Limited UK. Farid is ACCA, did graduate in
commerce from University of Punjab, Diploma in
Accounting and PGD from LCCMS London. He is
also qualified book keeper (distinction) from Institute
of certified book keepers UK.
At RSPN he is responsible for overall financial
analysis and management of PDBP project including
donor reporting, funds disbursements, finalization of
accounts, responsible to organize audit conducted by
the external auditors. Moreover he is also handling
administrative issues of the project at HO
MIS officer Develop and update the
data management
system and software
Data entry and
management in data
base system
Ensure there is no
double counting of any
plant within the CPA
and across the CPAs
Ensure the proper
management of records
related to plants and
users survey
Review the data
management system of
CPA
Train the MIS officer of
other CPAs
Mr. Sana Raheel worked as Business Center
Executive at Serena Hotel and trained staff members
about computer operations and applications. She
joined M.A. Jinnah Group of Colleges and taught
Bachelor level students of computer sciences for 2
years.
Sana is Bachelors of Computer Sciences with
distinction and won gold medal for securing 4/4
CGPA. She did her MBA from University of Central
Punjab in Finance and HR. At higher secondary
school level she won gold medal in computer
sciences, for securing first position in Faisalabad
Education Board.
At RSPN/PDBP she has developed the MIS system
in-house and is maintaining it. She monitors computer
systems in the programme office and trouble shoots
the problems. She is maintaining the GPS software,
too. She generates reports of plants according to
management‟s requirement and ensures proper backup
of database along with proper filing of plant records.
- - - - -
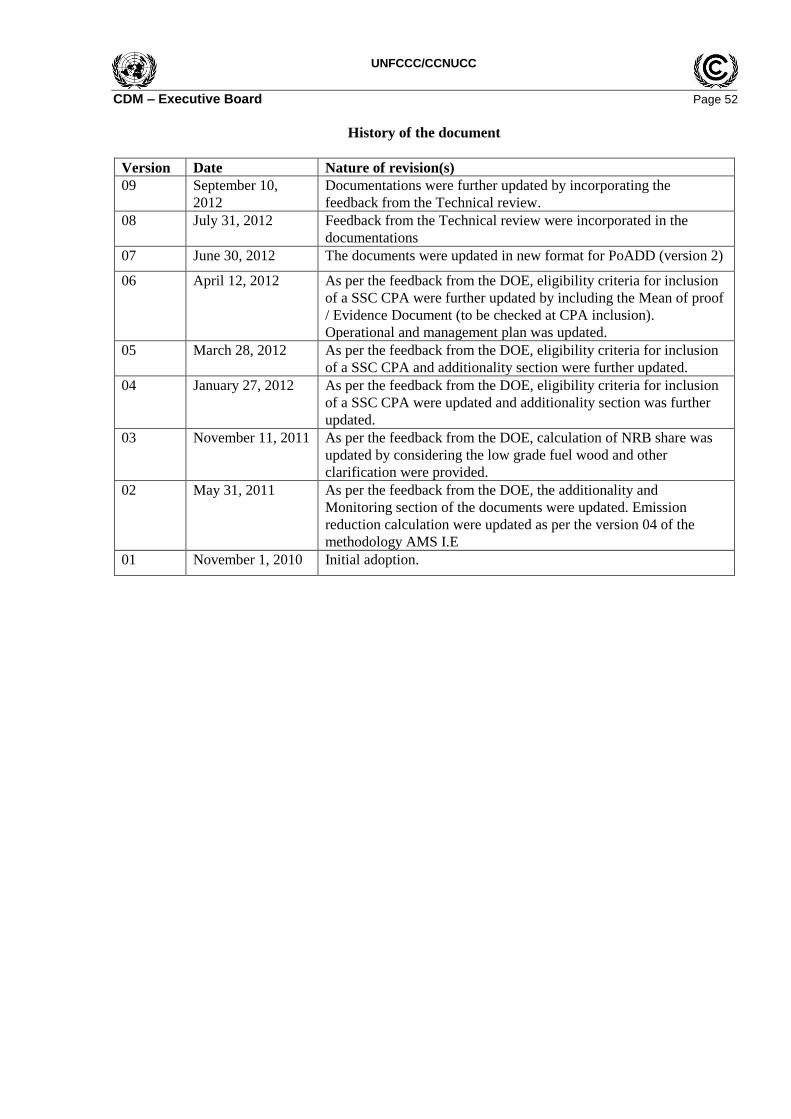
UNFCCC/CCNUCC
CDM – Executive Board Page 52
History of the document
Version Date Nature of revision(s)
09 September 10,
2012
Documentations were further updated by incorporating the
feedback from the Technical review.
08 July 31, 2012 Feedback from the Technical review were incorporated in the
documentations
07 June 30, 2012 The documents were updated in new format for PoADD (version 2)
06 April 12, 2012 As per the feedback from the DOE, eligibility criteria for inclusion
of a SSC CPA were further updated by including the Mean of proof
/ Evidence Document (to be checked at CPA inclusion).
Operational and management plan was updated.
05 March 28, 2012 As per the feedback from the DOE, eligibility criteria for inclusion
of a SSC CPA and additionality section were further updated.
04 January 27, 2012 As per the feedback from the DOE, eligibility criteria for inclusion
of a SSC CPA were updated and additionality section was further
updated.
03 November 11, 2011 As per the feedback from the DOE, calculation of NRB share was
updated by considering the low grade fuel wood and other
clarification were provided.
02 May 31, 2011 As per the feedback from the DOE, the additionality and
Monitoring section of the documents were updated. Emission
reduction calculation were updated as per the version 04 of the
methodology AMS I.E
01 November 1, 2010 Initial adoption.