profile of alcohol and drug indicators - tampa tacprofile of alcohol and drug indicators t january...
TRANSCRIPT
Profile of Alcohol and Drug Indicators t January 2013 t 1
January 2013
for Hillsborough County, Florida
Profile of Alcohol and Drug Indicators
Kathleen A. Moore, Ph.D.M. Scott Young, Ph.D.Mental Health Law and PolicyCollege of Behavioral and Community SciencesUniversity of South Florida
Ellen Snelling, MSCindy Grant, DirectorHillsborough County Anti Drug Alliance
HCADAHillsborough County Anti-Drug Alliance
Hillsborough County Anti Drug Coalition (HCADA) is a community coalition with over 100 members. HCADA envisions a community where youth and families are safe, healthy and free of substance abuse and addiction. HCADA’s mission is to plan and implement strategies to prevent and reduce youth and adult substance use/misuse by promoting healthy communities in Hillsborough County through education, collaboration and advocacy. The mission and vision guide the work of HCADA. The work of the coalition is accomplished via volunteer community collaboration through the various workgroups and task forces of the coalition.
HCADA is committed to a community collaboration and planning process that continues to make Hillsborough County a healthier and safer place for all of us to live. We invite you to join one or more of our task forces and to attend our by-monthly General Membership Meetings.
Prescription Drug Abuse Task Force is a multiple county task force addressing the issues around prescription drug abuse and misuse. Task Force members plan for effective strategies to reduce the growing prescription drug misuse problem in our communities.
Tampa Alcohol Coalition’s (TAC) mission is to prevent underage drinking and impaired driving. TAC strives to increase awareness about the consequences of underage drinking and high risk drinking in our community. TAC advocates for effective alcohol policies. TAC supports consistent enforcement of underage drinking laws. Members collaborate with local and state organizations, agencies, media and officials in their efforts to prevent underage, high risk drinking and impaired driving.
Tobacco Free Partnership, Hillsborough provides leadership on community issues related to tobacco including prevention, cessation, second hand smoke, advocacy, and Students Working Against Tobacco (SWAT). There are currently 15 active SWAT youth clubs working in Hillsborough County to influence their peers toward no tobacco use.
Marijuana Task Force was formed in April 2011 in response to the rapid increase in the use of marijuana among middle and high school students in Hillsborough County as reported in the Florida Youth Substance Abuse Survey.
Community/Campus Collaborative is a partnership between local institutions of higher education, HCADA and the local community with the primary goal of addressing underage alcohol issues on college campuses and in the surrounding communities. Hillsborough County is one of four counties in the State of Florida working on this issue under the Florida CSI grant.
AcknowledgementsThis research project was conducted as part of a community substance abuse
assessment for the Hillsborough County Anti Drug Alliance. The participation and feedback of a number of individuals have been crucial in the completion of this project. We would like to express our appreciation to all who have contributed. Several local agencies contributed data, including the Hillsborough County Medical Examiner, Central Florida Behavioral Health Network, Hillsborough County State Attorney’s Office, Hillsborough County Sheriff’s Office, Tampa Police Department, and the Division of Alcoholic Beverage and Tobacco, Tampa office. Thanks to Carrie Wagner for her assistance with the graphic design and layout of this report. Finally, thanks to the Department of Children and Families for helping fund this research project and publication.
For more information about HCADA or the Profile of Alcohol and Drug Indicators, please contact:
HCADA2815 E. Henry Avenue, Suite B-1Tampa FL 33610813-238-4034www.hcada.com
HCADASonya Bufe, ChairEllen Snelling, SecretaryKevin Rick, Treasurer
Cindy Grant, [email protected]
Ellen Snelling, TAC [email protected]
Helen JusticePrescription Drug Task Force Chair(813) 875-6201 Extension [email protected]
Amy RonshausenMarijuana Task Force Chair 727-828-0210 ext 107www.saveoursociety.org
Charlotte PetonicTobacco Free Hillsborough [email protected]
HCADAHillsborough County Anti-Drug Alliance
Page 2 t Profile of Alcohol and Drug Indicators
Profile of Alcohol and Drug Indicators t January 2013 t 3
List of Tables
Table 1. Number of Hillsborough County Active Alcohol Licenses, by License Type ............................................... 11
Table 2. Uniform Crime Report Alcohol- and Drug-Related Offense and Arrest Data ............................................ 11
Table 3. Local Law Enforcement and State Attorney’s Office Alcohol- and Drug-Related Offense and Arrest Data . 12
Table 4. Behavioral Risk Factor Surveillance System Data ....................................................................................... 13
Table 5. District National Household Survey on Drug Use and Health (NSDUH) Prevalence Data ....................... 14
Table 6. Students Reporting Lifetime Use of Selected Drugs ................................................................................... 15
Table 7. Hillsborough County Students Reporting Lifetime Use of Selected Drugs ................................................. 16
Table 8. Hillsborough County Students Reporting Past 30-Day Use of Selected Drugs ........................................... 17
Table 9. Students Reporting Past 30-Day Use of Selected Drugs ............................................................................. 18
Table 10. Percent of Hillsborough County Students Reporting Drug-Related Behavior........................................... 19
Table 11. Hillsborough County Drug-Related Deaths by Lethal/Non-Lethal Levels ................................................ 20
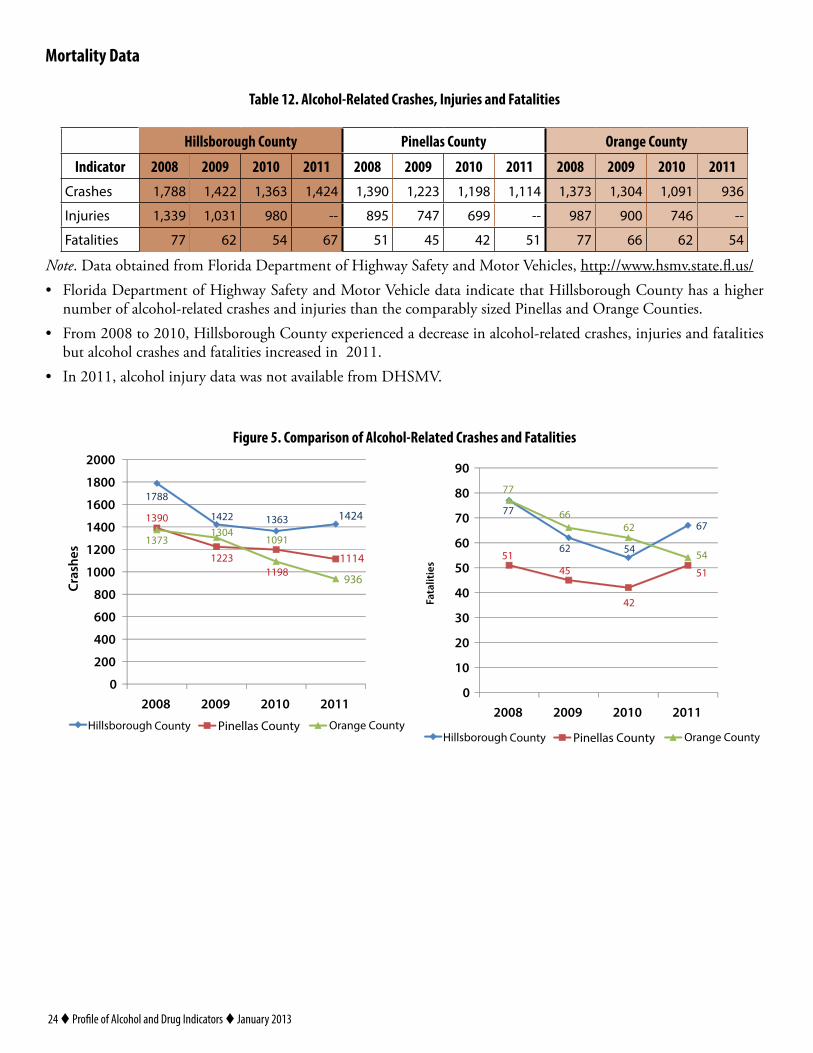
Table 12. Alcohol-Related Crashes, Injuries and Fatalities ....................................................................................... 22
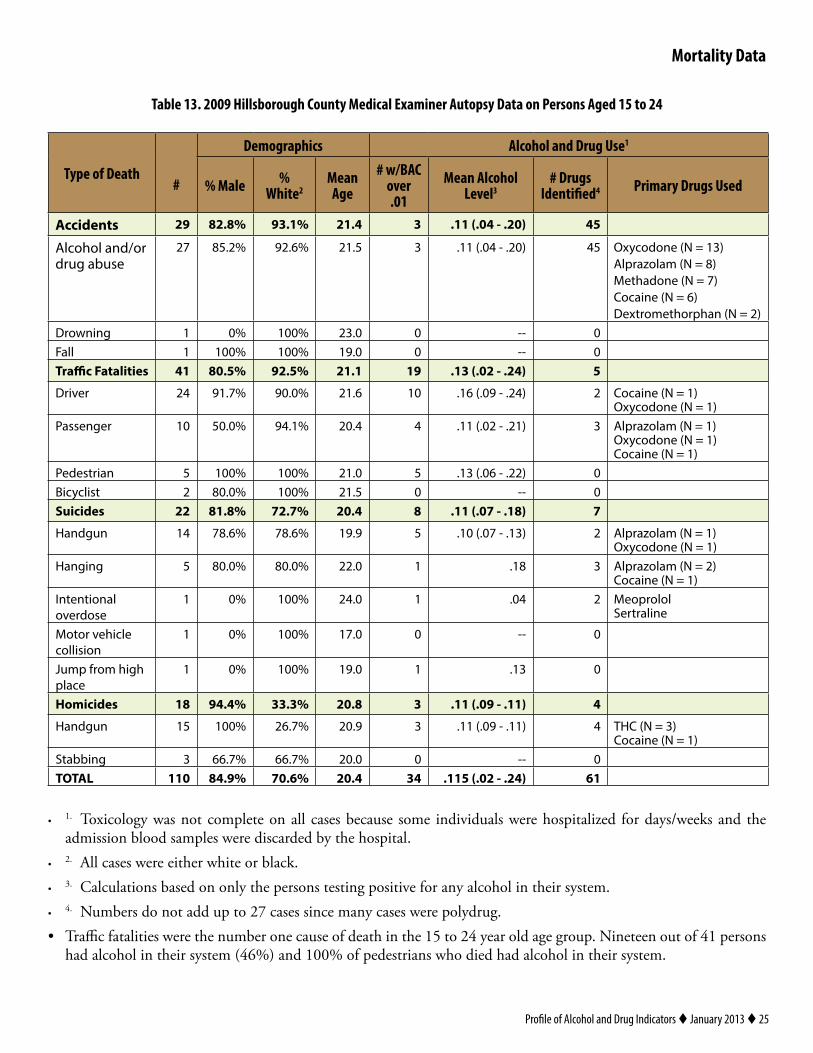
Table 13. 2009 Hillsborough County Medical Examiner Autopsy Data on Persons Aged 15 to 24 .......................... 23
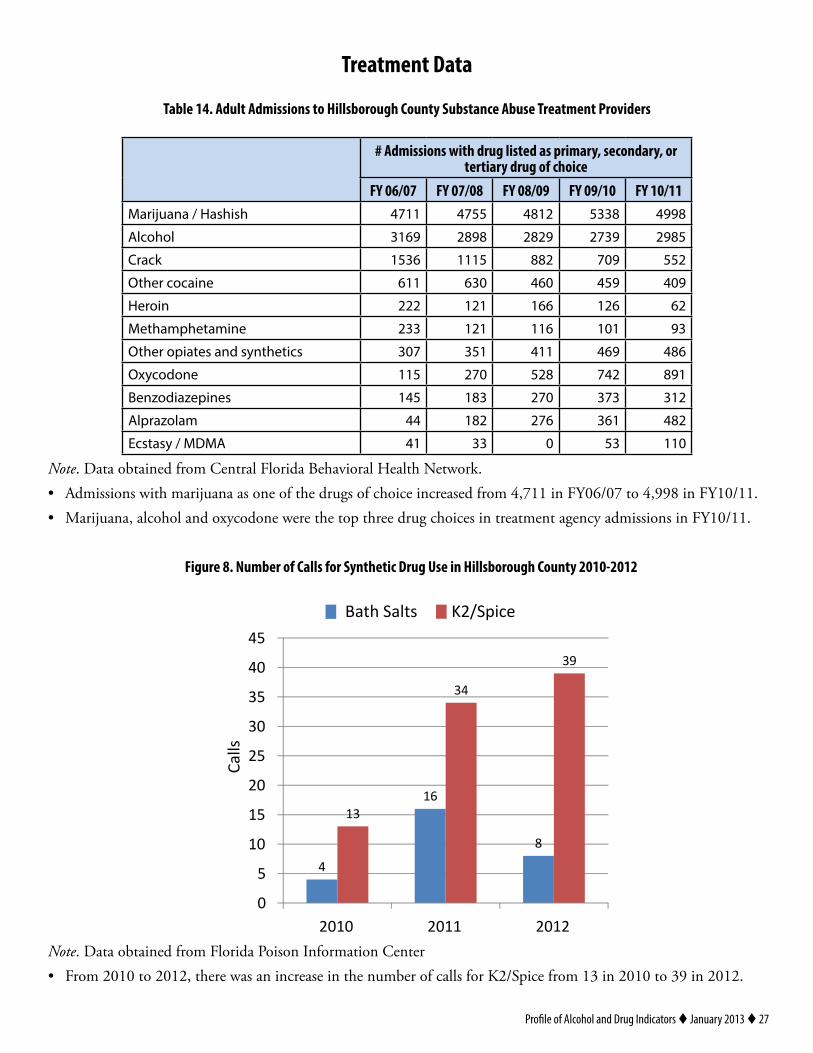
Table 14. Adult Admissions to Hillsborough County Substance Abuse Treatment Providers .................................... 25
Table of Contents
Overview............................................................................................................................................ 6
Alcohol.Outlet.Indicators.................................................................................................................. 13
General.Population.Surveys:.Adult.Prevalence.Rates......................................................................... 15
Mortality.Data................................................................................................................................... 22
Treatment.Data.................................................................................................................................. 27
Appendix.A:.Florida.Collegiate.Success.Initiative.............................................................................. 28
Appendix.B:.HCSO.DUI.Reports...................................................................................................... 34
Appendix.C:.Tampa.Police.Department............................................................................................. 37
Appendix.D:.Traffic.Crash.Facts......................................................................................................... 39
4 t Profile of Alcohol and Drug Indicators t January 2013
List of Figures
Figure 1. Past 30-Day Middle and High School Alcohol Use: Hillsborough County versus Statewide ..................... 20
Figure 2. Past 30-Day Middle and High School Binge Drinking: Hillsborough County versus Statewide ................ 20
Figure 3. Comparison of Hillsborough County Drug-Related Deaths by Lethal Level .................................. 23Figure 4. Comparison of Hillsborough County Drug-Related Deaths With Non-Lethal Levels Present................... 23
Figure 5. Comparison of Alcohol-Related Crashes and Fatalities ............................................................................. 24
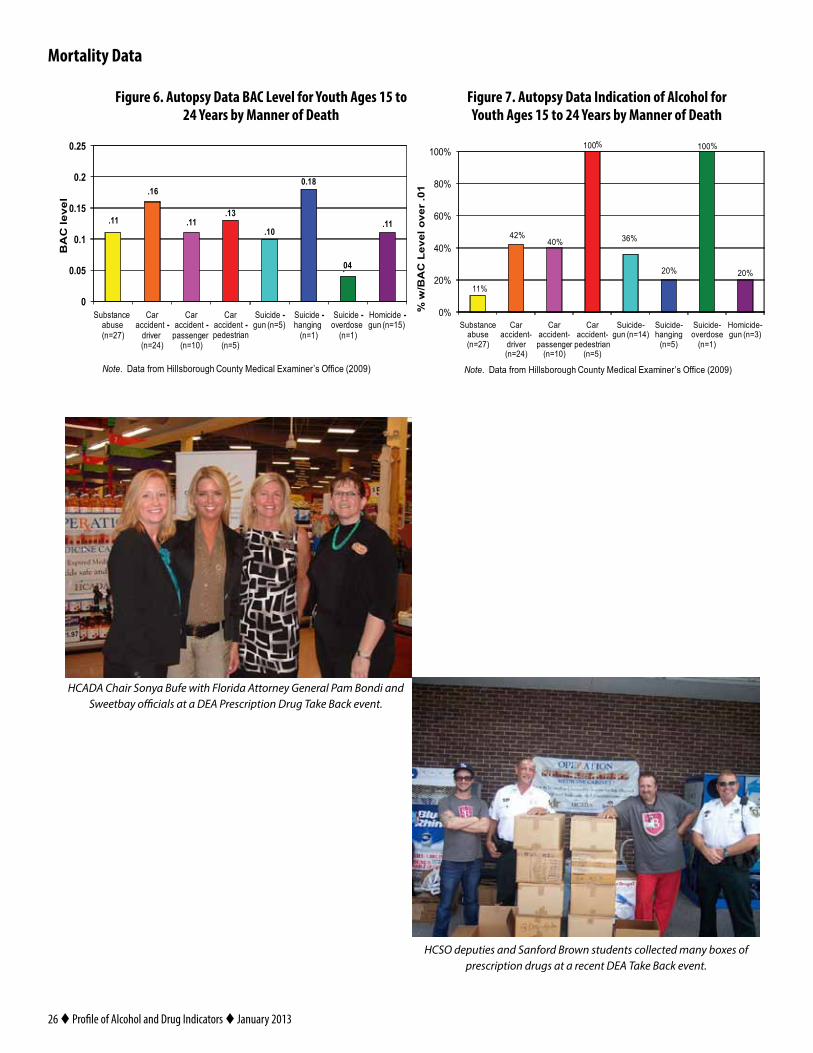
Figure 6. Autopsy Data BAC Level for Youth Ages 15 to 24 Years by Manner of Death .......................................... 26
Figure 7. Autopsy Data Indication of Alcohol for Youth Ages 15 to 24 Years by Manner of Death .......................... 26
Figure 8. Number of Calls for Synthetic Drug Use in Hillsborough County 2010-2012 ......................................... 27
Profile of Alcohol and Drug Indicators t January 2013 t 5
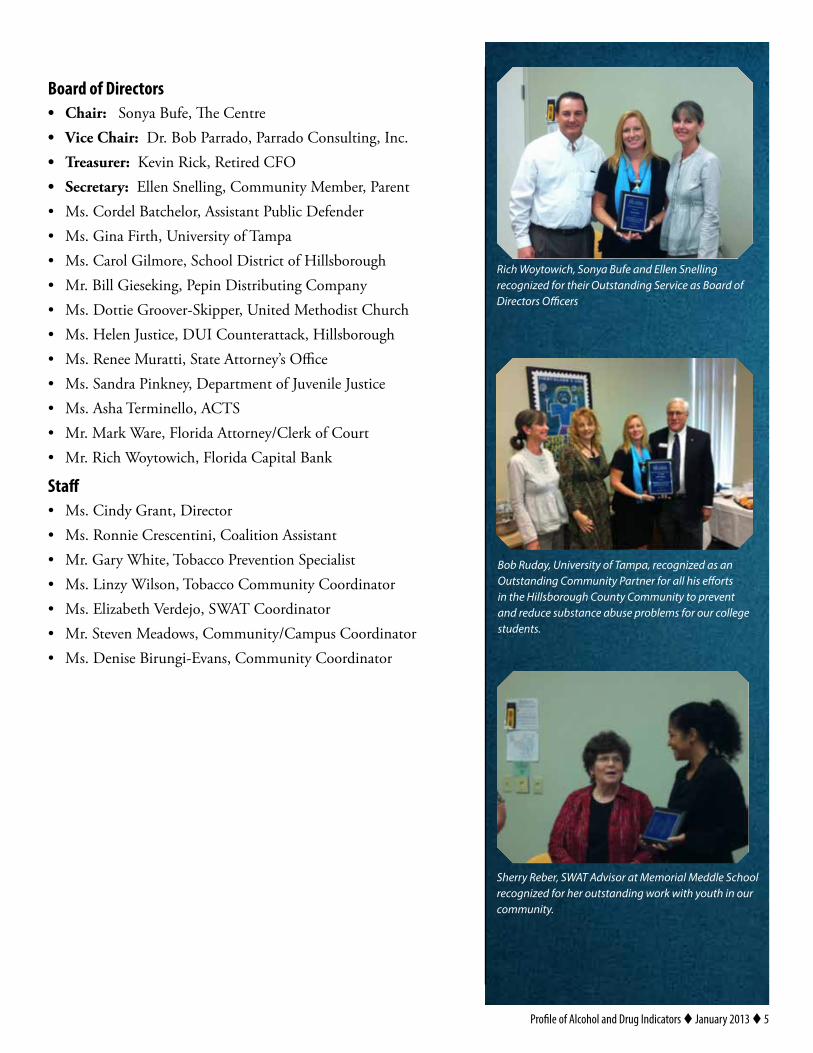
Board of Directors •. Chair:.. Sonya Bufe, The Centre•. Vice.Chair: Dr. Bob Parrado, Parrado Consulting, Inc.•. Treasurer:. Kevin Rick, Retired CFO•. Secretary: Ellen Snelling, Community Member, Parent• Ms. Cordel Batchelor, Assistant Public Defender• Ms. Gina Firth, University of Tampa• Ms. Carol Gilmore, School District of Hillsborough • Mr. Bill Gieseking, Pepin Distributing Company• Ms. Dottie Groover-Skipper, United Methodist Church• Ms. Helen Justice, DUI Counterattack, Hillsborough• Ms. Renee Muratti, State Attorney’s Office• Ms. Sandra Pinkney, Department of Juvenile Justice• Ms. Asha Terminello, ACTS• Mr. Mark Ware, Florida Attorney/Clerk of Court• Mr. Rich Woytowich, Florida Capital Bank
Staff• Ms. Cindy Grant, Director• Ms. Ronnie Crescentini, Coalition Assistant• Mr. Gary White, Tobacco Prevention Specialist• Ms. Linzy Wilson, Tobacco Community Coordinator• Ms. Elizabeth Verdejo, SWAT Coordinator• Mr. Steven Meadows, Community/Campus Coordinator• Ms. Denise Birungi-Evans, Community Coordinator
Rich Woytowich, Sonya Bufe and Ellen Snelling recognized for their Outstanding Service as Board of Directors Officers
Bob Ruday, University of Tampa, recognized as an Outstanding Community Partner for all his efforts in the Hillsborough County Community to prevent and reduce substance abuse problems for our college students.
Sherry Reber, SWAT Advisor at Memorial Meddle School recognized for her outstanding work with youth in our community.
6 t Profile of Alcohol and Drug Indicators t January 2013
OverviewAlcohol has the highest prevalence of use of any substance in Hillsborough County and throughout the nation.
In 2011, Hillsborough County ranked first among all counties in alcohol-related fatalities. Although Hillsborough County DUI arrests decreased in 2011, Hillsborough still had more DUI arrests than any other Florida county. To address these concerns, the Hillsborough County Anti Drug Alliance (HCADA) and the Tampa Alcohol Coalition (TAC) have continued to support: DUI law enforcement operations, The Hillsborough County Sheriff’s Alcohol Vendor Enforcement program (SAVE), DUI Counterattack, DUI media coverage, alcohol awareness programs, improved alcohol policies and community coalitions’ collaborative efforts to reduce impaired driving and crashes, including the Community Traffic Safety Team (CTST) and Mothers Against Drunk Driving (MADD).
Alcohol is the most abused substance among youth in Hillsborough County. The 2012 Florida Youth Substance Abuse Survey revealed that 28.5% of middle school and 60.9% of high school students used alcohol in their lifetime. Further, 12.8% of middle school and 28% of high school students reported drinking in the past 30 days, with 14.1% of high school students reporting binge drinking. The Tampa Alcohol Coalition continues to collaborate with its partners in the schools and universities to prevent underage drinking and its consequences. TAC supports the Division of Alcoholic Beverage and Tobacco and other law enforcement agency partners that enforce underage drinking laws.
National surveys show that 18 to 25 year olds, particularly full time college students, typically have the highest rate of alcohol and other drug use of all age groups. Because this age group is extremely vulnerable to alcohol- and drug-related accidents, autopsy reports were examined from the Hillsborough County Medical Examiner’s office on all 110 accidental or suicidal deaths that occurred in 2009 among those aged 15 to 24 years old. Alcohol and other drug use contributed significantly to deaths in the 15 to 24 year old age group.
Local and national news stories have reported on high rates of prescription drug abuse. Hillsborough County data indicate that rates of prescription drug abuse by middle and high school students increased through 2008 then started a downward trend. Local Medical Examiner data indicate that prescription drugs are the leading cause of overdose deaths. As a result, HCADA recently created the Prescription Drug Abuse Task Force that meets on a bimonthly basis. HCADA also sponsors regular prescription drug take back events.
Over the past several years, the Hillsborough County Anti Drug Alliance has made a concerted effort to reduce tobacco use among youth. Data from middle and high school students indicate that lifetime and past 30-day tobacco use is still common, although there has been a decrease among middle school and high school students. Recent activities include supporting local chapters of Students Working Against Tobacco (SWAT) and mandatory Teen Tobacco Offender education classes as well as supporting smoke-free housing and resolutions against candy flavored tobacco.
Large scale survey data from the Florida Youth Substance Abuse Survey (FYSAS) indicate that in 2012, alcohol was the substance most used by Hillsborough County high school students, followed by marijuana and cigarettes. The use of inhalants was prevalent among middle school students and has increased over the past two years. Past 30-day rates of student alcohol use decreased in Hillsborough County from 2010 to 2012, and fell below statewide rates. Likewise, other drug use rates in Hillsborough County decreased including cigarettes, marijuana, inhalants, and other illicit drug use, as did the statewide rates. Middle school and high school students reported decreased rates of selling drugs, and less middle school students being drunk or high at school in 2012 compared to 2010. HCADA and its community partners including the Mendez Foundation, MADD Hillsborough, Pepin Distributing, DUI Counterattack, University of South Florida, University of Tampa, treatment agencies, juvenile drug court, media partners and law enforcement agencies will continue to work together to try and reduce substance abuse among youth. The Too Good for Drugs Kidfest sponsored by Hillsborough County and the Mendez Foundation is a major prevention event offered each year in Tampa. This event attracts over 6,000 children and families and features a variety of prevention activities including the Too Good for Drugs Walk and Banner Contest.
Profile of Alcohol and Drug Indicators tJanuary 2013 t 7
Report Highlights
•. Alcohol.Outlets
{ Since 2011, there has been a decrease in Alcohol Package Sales Licenses for beer only as well as beer and wine, with an increase in beer, wine and liquor or package sales.
{ Over the past year there has been a decrease in all three types of Consumed on Premises Licenses.
{ All licenses decreased between 2004 and 2012 except Other License Types (theme parks, bottle clubs, golf clubs, symphony/orchestra).
•. Criminal.Justice.Indicators
{ DUI arrests decreased in Hillsborough, Pinellas, and Orange Counties in 2011. { Hillsborough has nearly as many DUI arrests as both Pinellas and Orange Counties
combined from 2008-2010. { There was decrease in the number of drug/narcotic arrests in all 3 counties from
2008-2011, with Hillsborough having higher rates than Pinellas and Orange. { Liquor law violations decreased in Hillsborough, Pinellas, and Orange Counties in
2011. { CBT Countywide DUI arrests have decreased each year. { TPD drug offenses/narcotics decreased from 2006 to 2009 then increased in 2010
and 2011. { Notices to appear for underage drinking increased from 2008 to 2010, then decreased
in 2011.•. General.Population.Surveys:.Adult.Prevalence.Rates
{ Hillsborough County Behavioral Risk Factor Surveillance System data indicate that adult drinking, binge drinking, and heavy drinking increased from 2009 to 2010.
{ Hillsborough County heavy drinking, binge drinking, and smoking rates were all higher than state averages.
•. General.Population.Surveys:.Adolescent.Prevalence.Rates
Among the sample, the pattern of data from 2006/2008 indicates: { For past month use, alcohol use was more prevalent than cigarette use, followed by
marijuana and then other illicit drugs. { Circuit 13 (Hillsborough) had higher rates of illicit drug use including cocaine use,
marijuana use, binge drinking, and nonmedical use of pain relievers in the past year compared to Circuit 6 (Pasco and Pinellas)
{ Circuit 6 had higher rates of alcohol and cigarette use, past month compared to Circuit 13.
Florida Youth Substance Abuse Survey lifetime drug use data from 2006 to 2012 indicate that:
{ In 2012, alcohol was the most commonly used drug among students in Hillsborough County and Florida Statewide, followed by marijuana then cigarettes.
{ In 2012, Hillsborough County experienced a decrease in reported lifetime use of alcohol, cigarettes, marijuana, inhalants, and illicit drugs.
Photo source: Community Traffic Safety Team (CTST), D7
$10,000DRINK!
Lawyer Fees .....................................$3,500Towing Charges ..................................$150Bond .................................................$1,000Fine & Court Costs ..........................$1,000DUI School ..........................................$2153-Year Insurance Surcharge ...........$1,800License Reinstatement ......................$225Drug & Alcohol Evaluation ................$100Alcohol Treatment ..............................$400Cost of Supervision ............................$610Vehicle Impound .................................$100Ignition Interlock Device ....................$600Loss of Work .......................................$300
TOTAL .............$10,000THE LAWLegal drinking age - 21 years oldLevel of Blood Alcohol .08 or greater - DUI, automatic 6 months suspension of Driver’s License.20 Blood Alcohol Content - Increased penalties for DUIA refusal to submit to a breath test requested by law enforcement - 1 year automatic suspension of Driver’s License, and 18 months suspension for a second or subsequent refusal
PERSONS UNDER THE AGE OF 21Possession of an alcoholic beverage under the age of 21- arrestable 2nd degree misdemeanor with a one of up to $500.00Operating or in physical control of a motor vehicle with a Blood Alcohol Content of .02 or greater - automatic 6 month suspension of Driver’s License
Your Community Traffi c Safety Team - www.ctst.orgAugust 2011
Overview
8 t Profile of Alcohol and Drug Indicators t January 2013
{ In 2012, Hillsborough County lifetime student substance abuse rates were lower than state averages, except for inhalant use which was the same as the state average and any illicit except marijuana which was higher than the state average.
{ Alcohol, cigarette and inhalant use decreased between 2006 and 2012 but marijuana increased.
{ Prior to 2010 hallucinogens and (cocaine and crack cocaine) were reported separately but are now combined.
{ In 2012, alcohol was the most commonly used drug among students in Hillsborough County and Florida Statewide, followed by marijuana then cigarettes.
{ In 2012, Hillsborough County experienced a decrease in reported lifetime use of alcohol, cigarettes, marijuana, inhalants, and illicit drugs.
{ In 2012, Hillsborough County lifetime student substance abuse rates were lower than state averages, except for inhalant use which was the same as the state average and any illicit except marijuana which was higher than the state average.
{ Alcohol, cigarette and inhalant use decreased between 2006 and 2012 but marijuana increased.
{ Prior to 2010 hallucinogens and (cocaine and crack cocaine) were reported separately but are now combined.
{ Alcohol remains the most commonly used drug among both middle and high school students.
{ For middle school students, cigarettes were the second most commonly used drug, followed by inhalants.
{ For high school students, marijuana was the second most commonly used drug in 2010 and 2012 followed by cigarettes.
{ In 2012, alcohol, cigarettes, and marijuana lifetime use decreased among middle and high school students.
{ Prior to 2010 hallucinogens and (cocaine and crack cocaine) were reported separately but are now combined
{ Alcohol has consistently remained the most commonly used drug among both middle and high school students from 2006-2012.
{ Following alcohol, marijuana and inhalants were the drugs most commonly used by middle school students in 2012.
{ Alcohol, marijuana and cigarettes were the top three drugs used by high school students in 2012.
{ Use of prescription pain relievers peaked in 2008 for middle school students then declined.
{ Middle and high school students past 30 day use rates for alcohol, binge drinking, marijuana, and cigarettes decreased in 2012.
{ Inhalant use increased in middle school students in 2012. { Alcohol is the most commonly used drug among Hillsborough County and Florida
Statewide.
Overview
Profile of Alcohol and Drug Indicators tJanuary 2013 t 9
{ Hillsborough County rates for alcohol binge drinking, inhalants, and cigarettes reached their lowest levels in 2012.
{ Any illicit drug except marijuana and alcohol or any illicit drug use also reached their lowest level in 2012.
{ In 2012, Hillsborough County rates fell below Florida Statewide rates for alcohol, marijuana, and cigarette use.
{ Inhalant use was above the Florida Statewide rate in 2012. { Middle and high school students reported decreased rates of selling drugs and being
drunk or high at school from 2010 to 2012. { Selling drugs and being drunk or high at school were at the lowest rates in 2012.
•. Mortality.Data
Hillsborough County Drug-Related Death data from 2007 - 2011 indicate that: { One hundred and forty-one deaths were caused by oxycodone in 2010. Oxycodone
deaths decreased to 114 in 2011. Oxycodone deaths peaked in 2010. { In 2011, there was an increase in the number of non-lethal level deaths due to cocaine,
methadone, oxycodone, diazepam, and alprazolam; there have been no deaths in which non-lethal levels of heroin were detected in 2010 and 2011.
{ In 2011, the prescription drugs oxycodone, alprazolam, and methadone were most commonly found in lethal levels, followed by cocaine.
{ In 2011, deaths were drug was the cause of death increased from cocaine, methadone, heroin, morphine, alprazolam, and diazepam where as oxycodone and hydrocodone decreased.
{ Total drug deaths were drug was cause of death decreased from 414 in 2010 to 401 in 2011.
{ Florida Department of Highway Safety and Motor Vehicle data indicate that Hillsborough County has a higher number of alcohol-related crashes and injuries than the comparably sized Pinellas and Orange Counties.
{ From 2008 to 2010, Hillsborough County experienced a decrease in alcohol-related crashes, injuries and fatalities but alcohol crashes and fatalities increased in 2011.
{ In 2011, alcohol injury data was not available from DHSMV. { Toxicology was not complete on all cases because some individuals were hospitalized
for days/weeks and the admission blood samples were discarded by the hospital. { All cases were either white or black. { Calculations based on only the persons testing positive for any alcohol in their system. { Numbers do not add up to 27 cases since many cases were polydrug. { Traffic fatalities were the number one cause of death in the 15 to 24 year old age
group. Nineteen out of 41 persons had alcohol in their system (46%) and 100% of pedestrians who had died had alcohol in their system.
Overview
10 t Profile of Alcohol and Drug Indicators t January 2013
•. Treatment.Data
{ Admissions with marijuana as one of the drugs of choice increased from 4711 in FY06/07 to 4998 in FY10/11.
{ Marijuana, alcohol and oxycodone were the top three drug choices in treatment agency admissions in FY10/11.
Overview
Profile of Alcohol and Drug Indicators tJanuary 2013 t 11
Area DescriptionHillsborough County is composed of the cities of Tampa, Temple Terrace, and Plant
City plus 47 other unincorporated areas. The County covers over 1,200 square miles, including 215 miles of coastline. According to the 2010 census estimate, the population was 1,229,226 with 75.8% White, 17.6% Black, 3.6% Asian, .6% other races, and 2.3% multiracial. Census 2010 figures also indicate that over one fourth (25.1%) of Hillsborough’s population report being of Hispanic or Latino origin, the slight majority (51%) are female, 11.9% of the population are 65 years old or older, and 15% live below the poverty level. Hillsborough County is the fourth most populated county in Florida and accounts for over 6% of the State’s total population.
Hillsborough County Alcohol and Drug Indicator AnalysisIndicator reporting programs are a useful means of gauging the extent of local alcohol
and drug use and their related problems. Additionally, collecting indicator data over time will help to ascertain the impact of efforts designed to reduce alcohol and drug use and its related problems. Indicators can be used by community leaders in the following ways (1) to identify the most important local substance use problems, (2) to target community prevention and treatment strategies, and (3) to evaluate the results of new policies and programs. To this end, the Hillsborough County Anti Drug Alliance worked with University of South Florida FMHI researchers to conduct an evaluation of indicators available throughout Hillsborough County relevant to alcohol and drug use among both adolescents and adults. Some of the local data was compared to other counties with similar sized populations in metropolitan areas (Pinellas and Orange). Other data was compared to state averages.
The Indicator Report will be used to help evaluate the effectiveness of existing substance abuse prevention and treatment programs, alcohol and narcotic law enforcement, substance abuse awareness activities and alcohol and other drug policies, to determine the need for new programs and policies, and to help secure future funding.
Data SourcesThis report describes alcohol and other drug trends in Hillsborough County, using the
data sources summarized below:• Division of Alcoholic Beverages and Tobacco (DABT)• Uniform Crime Report (UCR)• Hillsborough County Sheriff’s Office (HCSO)• Hillsborough County State Attorney’s Office• Tampa Police Department (TPD) crime statistics• National Institute of Justice (NIJ)• National Center for Disease Control’s Behavioral Risk Factor Surveillance System• National Household Survey on Drug Use and Health (NSDUH)• Florida Youth Substance Abuse Survey (FYSAS)• Florida Department of Highway Safety and Motor Vehicles (FDHSMV)• Florida Department of Law Enforcement (FDLE)• Hillsborough County Medical Examiner• Florida Office of Vital Statistics• Central Florida Behavioral Health Network (CFBHN)
Overview
12 t Profile of Alcohol and Drug Indicators t January 2013
• Organized and conducted four prescription drug take back events in conjunction with community partners from HCSO, TTPD, TPD, DEA, Sweetbay, MOSI and Sanford Brown Pharmacy Tech Students in 2011 and 2012
• Worked with community partners to establish more permanent take back boxes in Hillsborough County
• Implemented strategies through the Collegiate Success Initiative to reduce college age underage and binge drinking
• Initiated a Marijuana Task Force to study consequences of marijuana usage and plan a Marijuana Summit together with community partners across the State
• Tampa Alcohol Coalition participated in Tampa City Council meetings and discussion on alcohol ordinances for the City of Tampa and continues to support law enforcement efforts throughout Hillsborough County
• HCADA presented prevention information at Hillsborough Board of County Commission, Tampa City Council, Temple Terrace City Council meetings
• HCADA provided educational opportunities at Health Fairs throughout Hillsborough County, MOSI Target America events, Candlelight Vigils for NOPE and MOSI, Seminole Tribes Red Ribbon Dinner
• HCADA assisted in facilitating NOPE Chapter in Hillsborough County and provides support as speaker for school events
• HCADA works on a regional level in the Suncoast Region in prevention planning, education and advocacy efforts through Central Florida Behavioral Health Network’s monthly regional coalition meeting and four workgroups including Strategic Planning, Environmental Strategies, Youth Development and Community Health and Wellness.
• HCADA works on a regional level with other coalitions in the region to develop a regional strategic plan to reduce prescription drug abuse/misuse
• HCADA works on a statewide level in prevention planning, education and advocacy efforts through Florida Coalition Alliance, Inc., FADAA Prevention Committee, Florida Coalition for Alcohol Policy, and other state workgroups and strategic planning efforts.
• HCADA Tobacco Free Partnership and SWAT presented and passed candy flavored tobacco resolutions at the County and all municipalities and continue to work on policy for schools, multi-unit housing and the workplace.
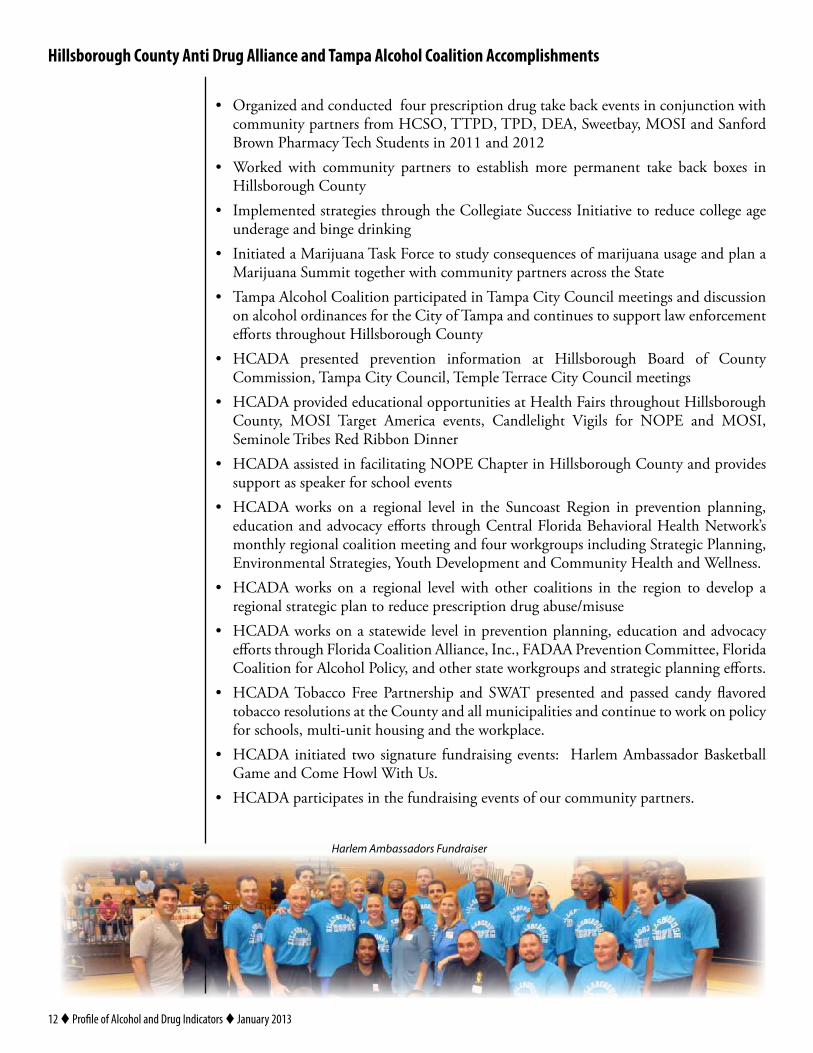
• HCADA initiated two signature fundraising events: Harlem Ambassador Basketball Game and Come Howl With Us.
• HCADA participates in the fundraising events of our community partners.
Hillsborough County Anti Drug Alliance and Tampa Alcohol Coalition Accomplishments
Harlem Ambassadors Fundraiser
Profile of Alcohol and Drug Indicators t January 2013 t 13
Alcohol Outlet Indicators
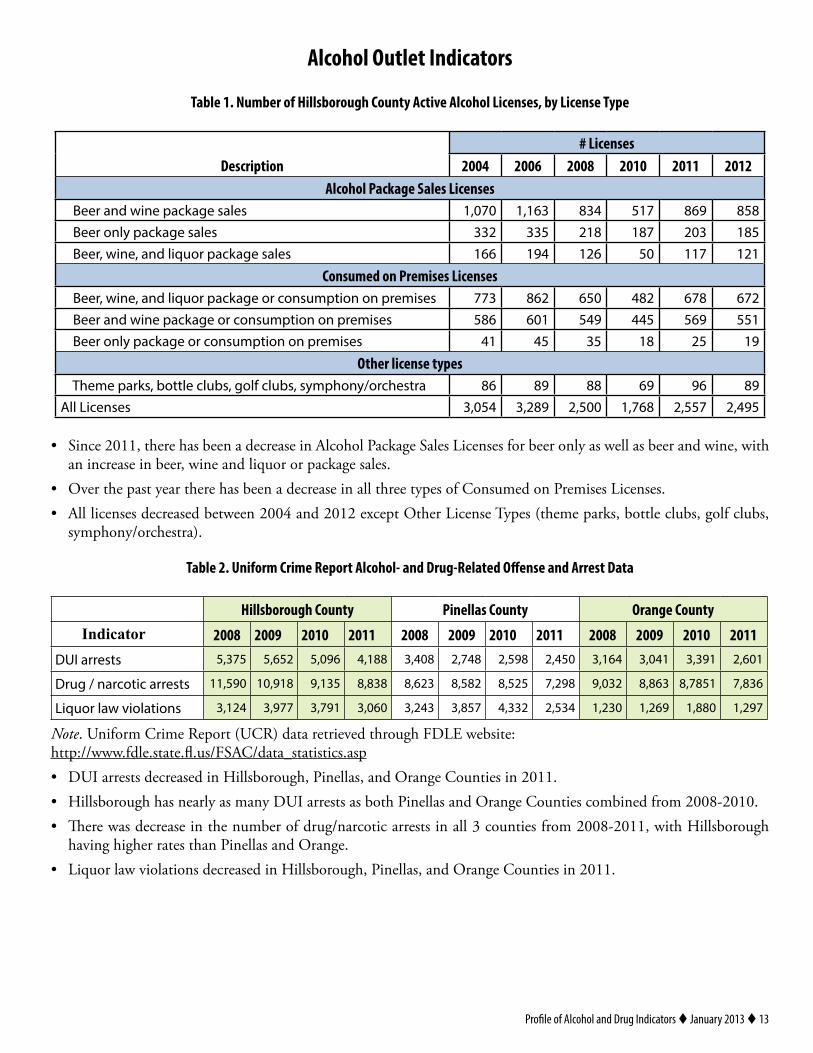
Table 1. Number of Hillsborough County Active Alcohol Licenses, by License Type
Description# Licenses
2004 2006 2008 2010 2011 2012Alcohol Package Sales Licenses
Beer and wine package sales 1,070 1,163 834 517 869 858 Beer only package sales 332 335 218 187 203 185 Beer, wine, and liquor package sales 166 194 126 50 117 121
Consumed on Premises Licenses Beer, wine, and liquor package or consumption on premises 773 862 650 482 678 672 Beer and wine package or consumption on premises 586 601 549 445 569 551 Beer only package or consumption on premises 41 45 35 18 25 19
Other license types Theme parks, bottle clubs, golf clubs, symphony/orchestra 86 89 88 69 96 89All Licenses 3,054 3,289 2,500 1,768 2,557 2,495
• Since 2011, there has been a decrease in Alcohol Package Sales Licenses for beer only as well as beer and wine, with an increase in beer, wine and liquor or package sales.
• Over the past year there has been a decrease in all three types of Consumed on Premises Licenses.• All licenses decreased between 2004 and 2012 except Other License Types (theme parks, bottle clubs, golf clubs,
symphony/orchestra).
Table 2. Uniform Crime Report Alcohol- and Drug-Related Offense and Arrest Data
Hillsborough County Pinellas County Orange County
Indicator 2008 2009 2010 2011 2008 2009 2010 2011 2008 2009 2010 2011
DUI arrests 5,375 5,652 5,096 4,188 3,408 2,748 2,598 2,450 3,164 3,041 3,391 2,601
Drug / narcotic arrests 11,590 10,918 9,135 8,838 8,623 8,582 8,525 7,298 9,032 8,863 8,7851 7,836
Liquor law violations 3,124 3,977 3,791 3,060 3,243 3,857 4,332 2,534 1,230 1,269 1,880 1,297
Note. Uniform Crime Report (UCR) data retrieved through FDLE website: http://www.fdle.state.fl.us/FSAC/data_statistics.asp• DUI arrests decreased in Hillsborough, Pinellas, and Orange Counties in 2011.• Hillsborough has nearly as many DUI arrests as both Pinellas and Orange Counties combined from 2008-2010.• There was decrease in the number of drug/narcotic arrests in all 3 counties from 2008-2011, with Hillsborough
having higher rates than Pinellas and Orange. • Liquor law violations decreased in Hillsborough, Pinellas, and Orange Counties in 2011.
14 t Profile of Alcohol and Drug Indicators t January 2013
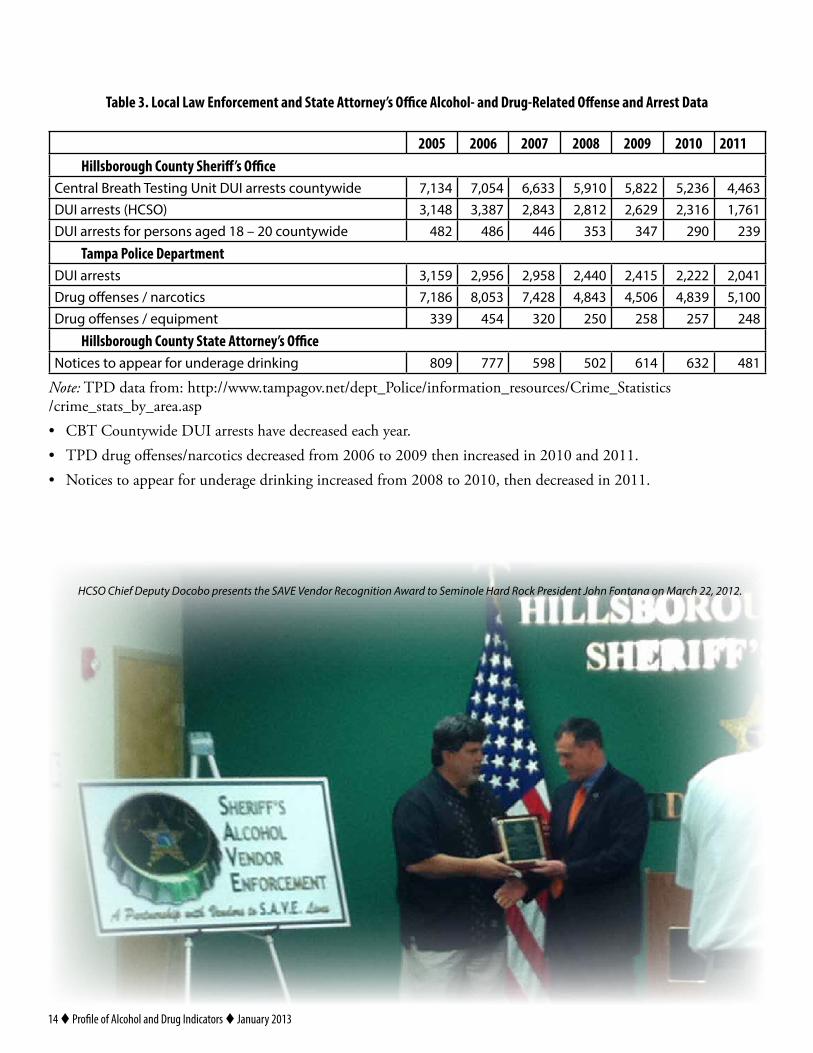
Table 3. Local Law Enforcement and State Attorney’s Office Alcohol- and Drug-Related Offense and Arrest Data
2005 2006 2007 2008 2009 2010 2011Hillsborough County Sheriff’s Office
Central Breath Testing Unit DUI arrests countywide 7,134 7,054 6,633 5,910 5,822 5,236 4,463DUI arrests (HCSO) 3,148 3,387 2,843 2,812 2,629 2,316 1,761DUI arrests for persons aged 18 – 20 countywide 482 486 446 353 347 290 239
Tampa Police DepartmentDUI arrests 3,159 2,956 2,958 2,440 2,415 2,222 2,041Drug offenses / narcotics 7,186 8,053 7,428 4,843 4,506 4,839 5,100Drug offenses / equipment 339 454 320 250 258 257 248
Hillsborough County State Attorney’s OfficeNotices to appear for underage drinking 809 777 598 502 614 632 481
Note: TPD data from: http://www.tampagov.net/dept_Police/information_resources/Crime_Statistics /crime_stats_by_area.asp• CBT Countywide DUI arrests have decreased each year.• TPD drug offenses/narcotics decreased from 2006 to 2009 then increased in 2010 and 2011.• Notices to appear for underage drinking increased from 2008 to 2010, then decreased in 2011.
HCSO Chief Deputy Docobo presents the SAVE Vendor Recognition Award to Seminole Hard Rock President John Fontana on March 22, 2012.
Profile of Alcohol and Drug Indicators t January 2013 t 15
General Population Surveys: Adult Prevalence Rates
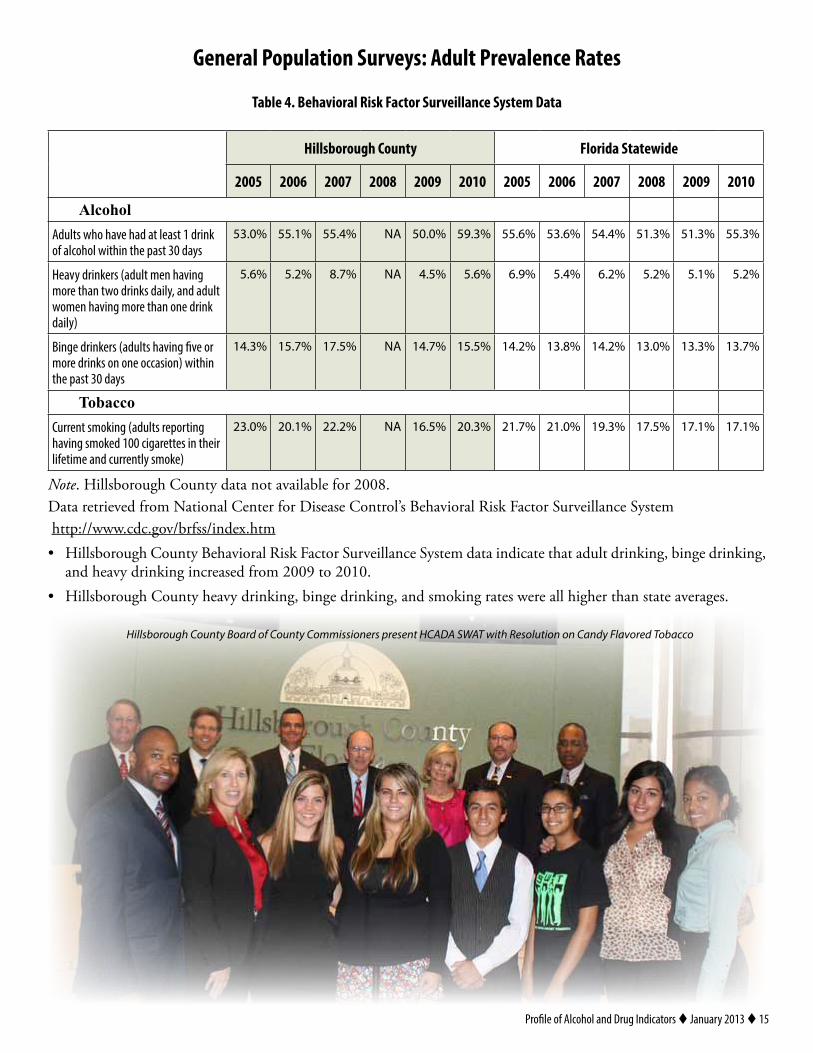
Table 4. Behavioral Risk Factor Surveillance System Data
Hillsborough County Florida Statewide
2005 2006 2007 2008 2009 2010 2005 2006 2007 2008 2009 2010
AlcoholAdults who have had at least 1 drink of alcohol within the past 30 days
53.0% 55.1% 55.4% NA 50.0% 59.3% 55.6% 53.6% 54.4% 51.3% 51.3% 55.3%
Heavy drinkers (adult men having more than two drinks daily, and adult women having more than one drink daily)
5.6% 5.2% 8.7% NA 4.5% 5.6% 6.9% 5.4% 6.2% 5.2% 5.1% 5.2%
Binge drinkers (adults having five or more drinks on one occasion) within the past 30 days
14.3% 15.7% 17.5% NA 14.7% 15.5% 14.2% 13.8% 14.2% 13.0% 13.3% 13.7%
TobaccoCurrent smoking (adults reporting having smoked 100 cigarettes in their lifetime and currently smoke)
23.0% 20.1% 22.2% NA 16.5% 20.3% 21.7% 21.0% 19.3% 17.5% 17.1% 17.1%
Note. Hillsborough County data not available for 2008.Data retrieved from National Center for Disease Control’s Behavioral Risk Factor Surveillance System http://www.cdc.gov/brfss/index.htm• Hillsborough County Behavioral Risk Factor Surveillance System data indicate that adult drinking, binge drinking,
and heavy drinking increased from 2009 to 2010. • Hillsborough County heavy drinking, binge drinking, and smoking rates were all higher than state averages.
Hillsborough County Board of County Commissioners present HCADA SWAT with Resolution on Candy Flavored Tobacco
16 t Profile of Alcohol and Drug Indicators t January 2013
General Population Surveys: Adolescent Prevalence Rates
Table 5. District National Household Survey on Drug Use and Health (NSDUH) Prevalence Data
2006, 2007, and 2008
Circuit 6 (Pasco, Pinellas) Circuit 13 (Hillsborough)
Alcohol
Alcohol use, past month 51.7 50.0
Binge alcohol use, past month 20.7 22.9
Perceptions of great risk of having 5 or more alcoholic drinks once or twice a week
42.3 45.0
Cigarettes
Cigarette use, past month 23.9 23.3
Any tobacco product use, past month 29.4 28.1
Perceptions of great risk of smoking one or more packs per day 74.6 77.0
Marijuana
Marijuana use, past month 5.4 6.0
Marijuana use, past year 9.2 10.5
Perceptions of great risk of smoking marijuana once a month 41.5 42.1
Illicit Drugs
Illicit drug use, past month 7.6 7.9
Any illicit drug use other than marijuana, past month 3.2 3.6
Cocaine use, past year 1.9 2.3
Nonmedical use of pain relievers, past year 3.8 4.3
Note. NSDUH substate data are reported as annual averages, http://oas.samhsa.gov/substate2k8/SecC.htm
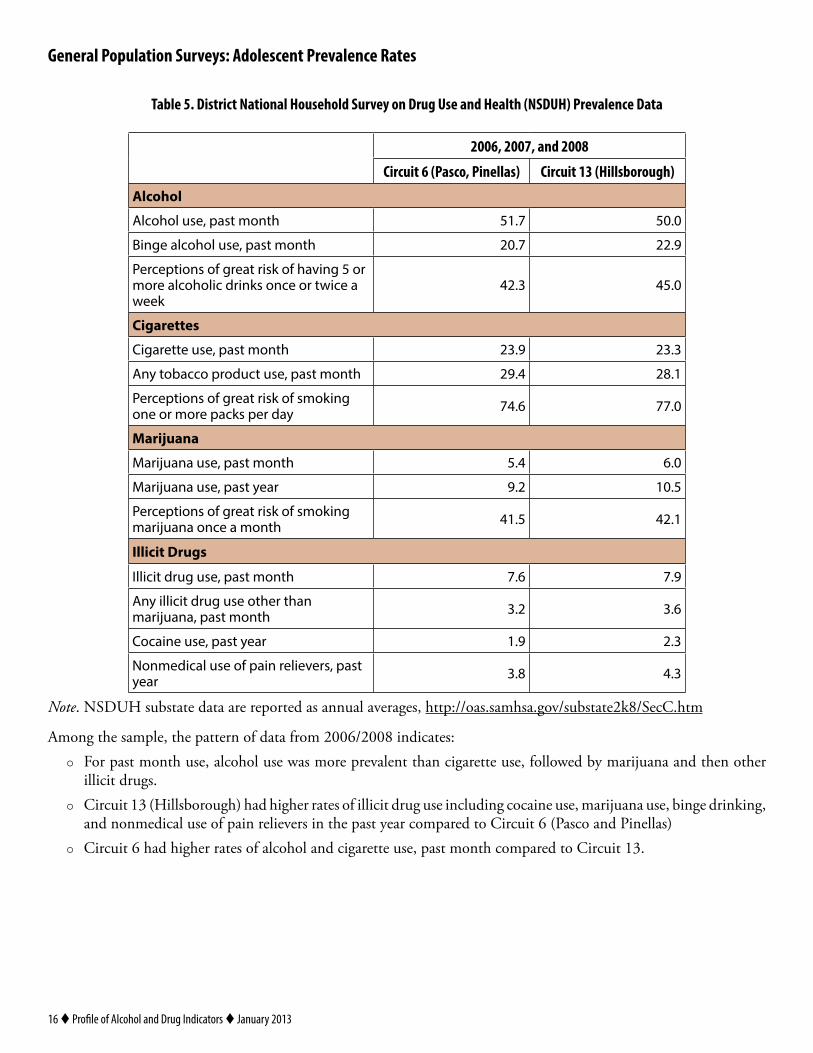
Among the sample, the pattern of data from 2006/2008 indicates: { For past month use, alcohol use was more prevalent than cigarette use, followed by marijuana and then other
illicit drugs. { Circuit 13 (Hillsborough) had higher rates of illicit drug use including cocaine use, marijuana use, binge drinking,
and nonmedical use of pain relievers in the past year compared to Circuit 6 (Pasco and Pinellas) { Circuit 6 had higher rates of alcohol and cigarette use, past month compared to Circuit 13.
Profile of Alcohol and Drug Indicators t January 2013 t 17
General Population Surveys: Adolescent Prevalence Rates
Table 6. Students Reporting Lifetime Use of Selected Drugs
Hillsborough County Florida Statewide
Drug Type 2006 2008 2010 2012 2006 2008 2010 2012Any alcohol 52.0% 52.0% 51.5% 46.3% 56.1% 53.2% 51.5% 47.3%
Cigarettes 27.7% 27.9% 25.1% 17.3% 30.6% 27.0% 25.9% 21.3%
Marijuana 20.4% 22.4% 26.0% 21.9% 22.5% 21.1% 23.8% 23.2%
Inhalant use 13.2% 13.0% 9.5% 7.9% 12.2% 11.4% 10.0% 7.9%
Any illicit except marijuana 18.1% 22.0% 22.5% 19.3% 18.1% 20.7% 21.0% 18.8%
Alcohol or any illicit drug use 56.5% 57.4% 56.0% 51.2% 59.5% 57.1% 56.3% 52.5%
Note. Data obtained from Florida Youth Substance Abuse Survey (FYSAS) of middle and high school students, http://www.dcf.state.fl.us/mentalhealth/publications/fysas
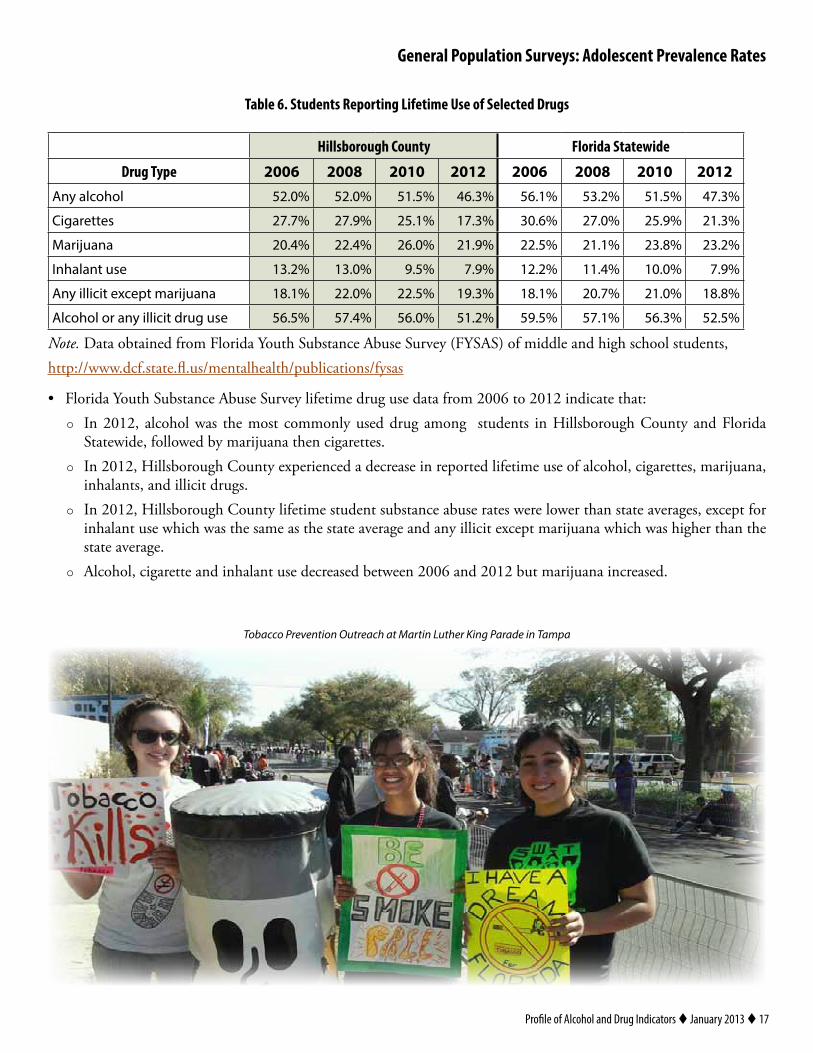
• Florida Youth Substance Abuse Survey lifetime drug use data from 2006 to 2012 indicate that: { In 2012, alcohol was the most commonly used drug among students in Hillsborough County and Florida
Statewide, followed by marijuana then cigarettes. { In 2012, Hillsborough County experienced a decrease in reported lifetime use of alcohol, cigarettes, marijuana,
inhalants, and illicit drugs. { In 2012, Hillsborough County lifetime student substance abuse rates were lower than state averages, except for
inhalant use which was the same as the state average and any illicit except marijuana which was higher than the state average.
{ Alcohol, cigarette and inhalant use decreased between 2006 and 2012 but marijuana increased.
Tobacco Prevention Outreach at Martin Luther King Parade in Tampa
18 t Profile of Alcohol and Drug Indicators t January 2013
General Population Surveys: Adolescent Prevalence Rates
Table 7. Hillsborough County Students Reporting Lifetime Use of Selected Drugs
Middle School High School
Drug Type 2006 2008 2010 2012 2006 2008 2010 2012Alcohol 36.1% 36.9% 30.3% 28.5% 65.3% 63.7% 69.1% 60.9%
Cigarettes 17.6% 18.5% 13.8% 10.4% 35.9% 36.0% 34.6% 23.0%
Marijuana 9.0% 11.1% 9.8% 8.7% 29.5% 31.1% 39.4% 32.6%
Inhalants 12.7% 15.4% 10.1% 10.2% 13.4% 11.1% 9.1% 5.9%
Ecstasy 1.4% -- -- -- 4.7% 4.3% -- --
Rohypnol 0.5% -- -- -- 1.7% 1.1% -- --
GHB 1.0% -- -- -- 1.0% 0.3% -- --
Ketamine 0.3% -- -- -- 1.3% 0.8% -- --
LSD/PCP 0.5% -- -- -- 2.4% 2.6% -- --
Hallucinogenic mushrooms
1.9% -- -- -- 5.8% 4.4% -- --
LSD/PCP/ Hallucinogenic mushrooms
-- -- 2.2% 4.9% -- -- 4.9% 4.8%
Cocaine 0.8% -- -- -- 4.6% 4.8% -- --
Crack cocaine 0.8% -- -- -- 1.5% 1.5% -- --
Cocaine/Crack cocaine -- -- 1.4% 1.2% -- -- 3.5% 2.4%
Methamphetamine 1.2% 1.2% 1.3% 0.8% 2.4% 1.0% 1.0% 1.0%
Depressants 1.7% 2.6% 3.0% 2.5% 8.5% 8.8% 10.3% 6.7%
Heroin 0.6% 0.9% 0.7% 0.6% 0.5% 0.9% 1.1% 1.5%
Prescription pain relievers 3.1% 5.9% 4.0% 4.3% 10.5% 10.9% 11.7% 9.9%
Steroids w/o prescription 0.5% 1.0% 0.7% 0.5% 1.3% 2.0% 0.9% 0.8%
Amphetamines 1.1% 2.0% 2.0% 0.8% 5.9% 5.9% 6.4% 3.9%
Any illicit drug 19.5% 24.6% 21.7% 19.7% 36.6% 39.1% 46.6% 41.6%
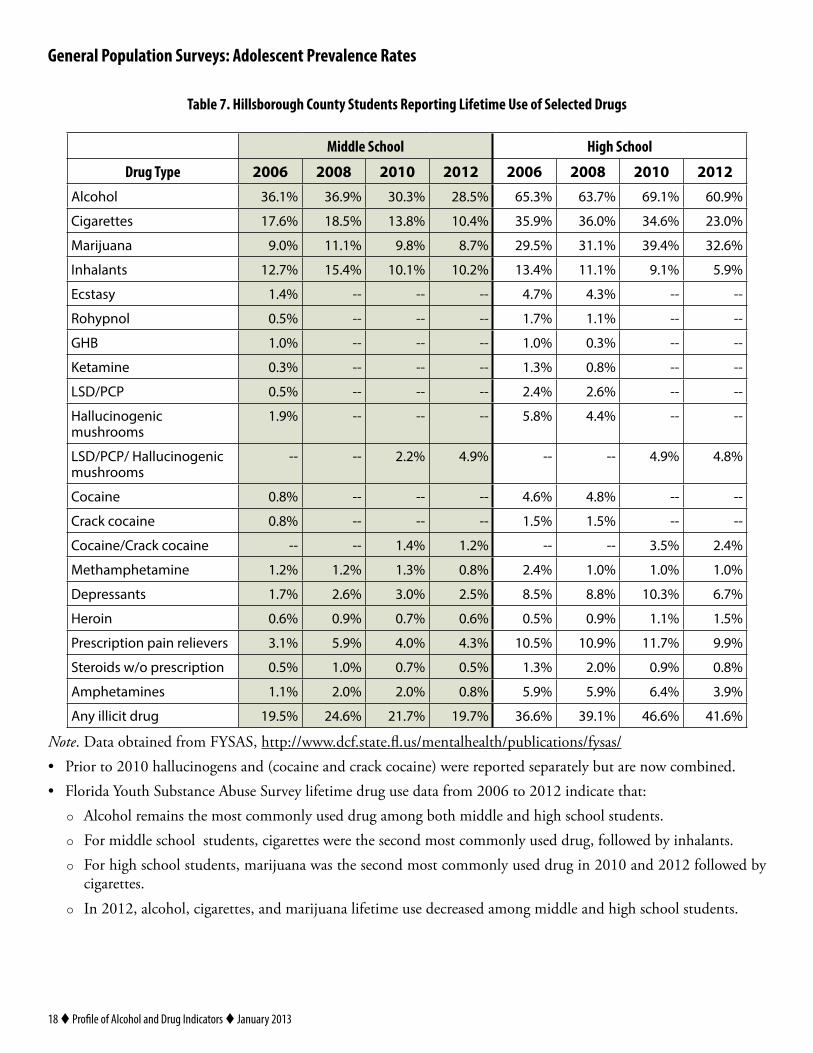
Note. Data obtained from FYSAS, http://www.dcf.state.fl.us/mentalhealth/publications/fysas/• Prior to 2010 hallucinogens and (cocaine and crack cocaine) were reported separately but are now combined.• Florida Youth Substance Abuse Survey lifetime drug use data from 2006 to 2012 indicate that:
{ Alcohol remains the most commonly used drug among both middle and high school students. { For middle school students, cigarettes were the second most commonly used drug, followed by inhalants. { For high school students, marijuana was the second most commonly used drug in 2010 and 2012 followed by
cigarettes. { In 2012, alcohol, cigarettes, and marijuana lifetime use decreased among middle and high school students.
Profile of Alcohol and Drug Indicators t January 2013 t 19
General Population Surveys: Adolescent Prevalence Rates
Table 8. Hillsborough County Students Reporting Past 30-Day Use of Selected Drugs
Drug TypeMiddle School High School
2006 2008 2010 2012 2006 2008 2010 2012Alcohol 15.2% 17.8% 14.1% 12.8% 37.5% 40.2% 41.2% 28.0%
Binge drinking 4.7% 5.2% 6.8% 4.6% 20.2% 20.1% 22.4% 14.1%
Cigarettes 4.2% 5.1% 4.2% 1.9% 12.6% 10.8% 11.4% 8.1%
Marijuana 3.8% 5.4% 5.2% 4.5% 14.5% 18.6% 21.9% 18.2%
Inhalants 4.2% 6.4% 3.9% 5.1% 3.0% 1.6% 2.5% 1.4%
Ecstasy 0.4% -- -- -- 1.6% 0.9% -- --
Rohypnol 0.2% -- -- -- 0.8% 0.3% -- --
GHB 0.4% -- -- -- 0.7% 0.1% -- --
Ketamine 0.2% -- -- -- 0.5% 0.2% -- --
LSD/PCP 0.1% -- -- -- 0.8% 1.1% -- --
Hallucinogen mushrooms 0.7% -- -- -- 1.7% 1.8% -- --
LSD/PCP/Hallucinogen mushrooms -- -- 1.0% 0.7% -- -- 1.8% 0.8%
Cocaine 0.3% -- -- -- 1.2% 1.0% -- --
Crack cocaine 0.2% -- -- -- 0.7% 0.4% -- --
Cocaine/Crack cocaine -- -- 0.8% 0.3% 0.6% 0.5%
Methamphetamine 0.5% 0.5% 0.4% 0.5% 0.9% 0.2% 0.6% 0.5%
Depressants 0.8% 1.5% 1.3% 1.3% 2.7% 3.2% 4.0% 2.8%
Heroin 0.3% 0.5% 0.3% 0.1% 0.2% 0.5% 0.3% 0.4%
Prescription pain relievers 1.5% 4.0% 1.8% 1.6% 2.6% 5.0% 3.6% 3.3%
Steroids w/o prescription 0.5% 0.8% 0.3% 0.2% 1.1% 0.8% 0.3% 0.3%
Amphetamines 0.6% 1.1% 0.6% 0% 1.0% 1.6% 1.9% 1.3%
Any illicit drug 7.8% 13.2% 11.3% 10.5% 17.2% 22.9% 26.5% 24.0%
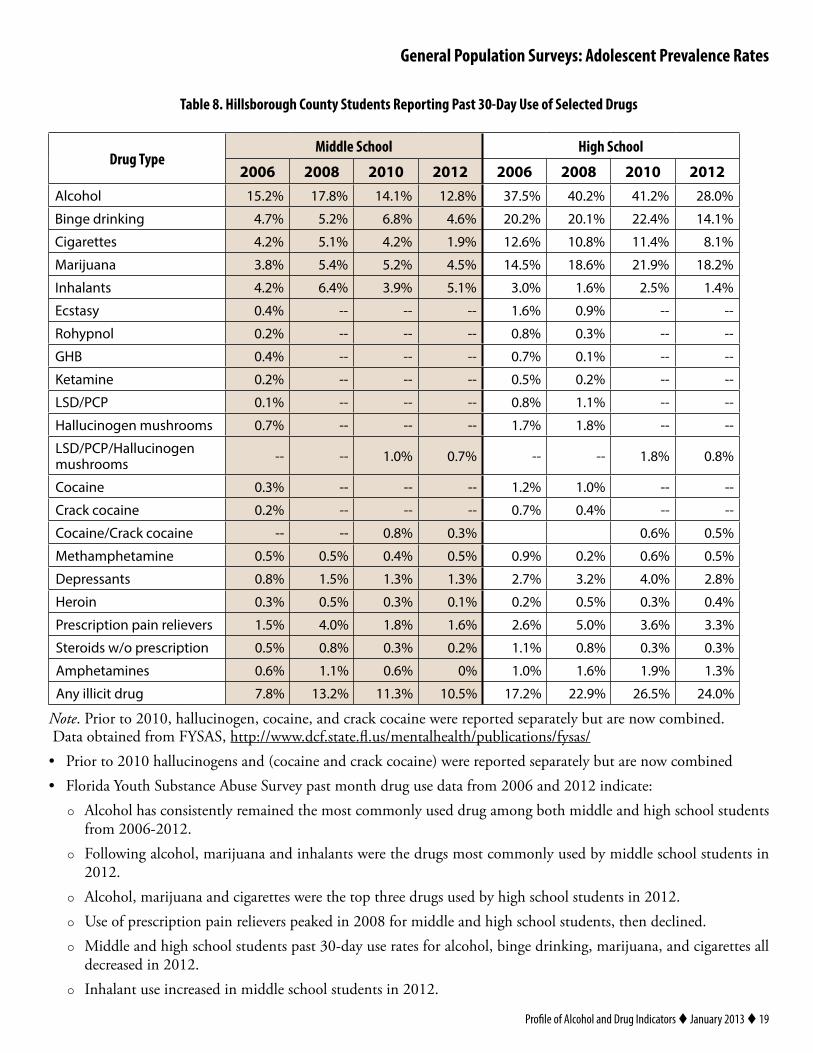
Note. Prior to 2010, hallucinogen, cocaine, and crack cocaine were reported separately but are now combined. Data obtained from FYSAS, http://www.dcf.state.fl.us/mentalhealth/publications/fysas/• Prior to 2010 hallucinogens and (cocaine and crack cocaine) were reported separately but are now combined• Florida Youth Substance Abuse Survey past month drug use data from 2006 and 2012 indicate:
{ Alcohol has consistently remained the most commonly used drug among both middle and high school students from 2006-2012.
{ Following alcohol, marijuana and inhalants were the drugs most commonly used by middle school students in 2012.
{ Alcohol, marijuana and cigarettes were the top three drugs used by high school students in 2012. { Use of prescription pain relievers peaked in 2008 for middle and high school students, then declined. { Middle and high school students past 30-day use rates for alcohol, binge drinking, marijuana, and cigarettes all
decreased in 2012. { Inhalant use increased in middle school students in 2012.
20 t Profile of Alcohol and Drug Indicators t January 2013
General Population Surveys: Adolescent Prevalence Rates
Table 9. Students Reporting Past 30-Day Use of Selected Drugs
Hillsborough County Florida StatewideDrug Type 2006 2008 2010 2012 2006 2008 2010 2012
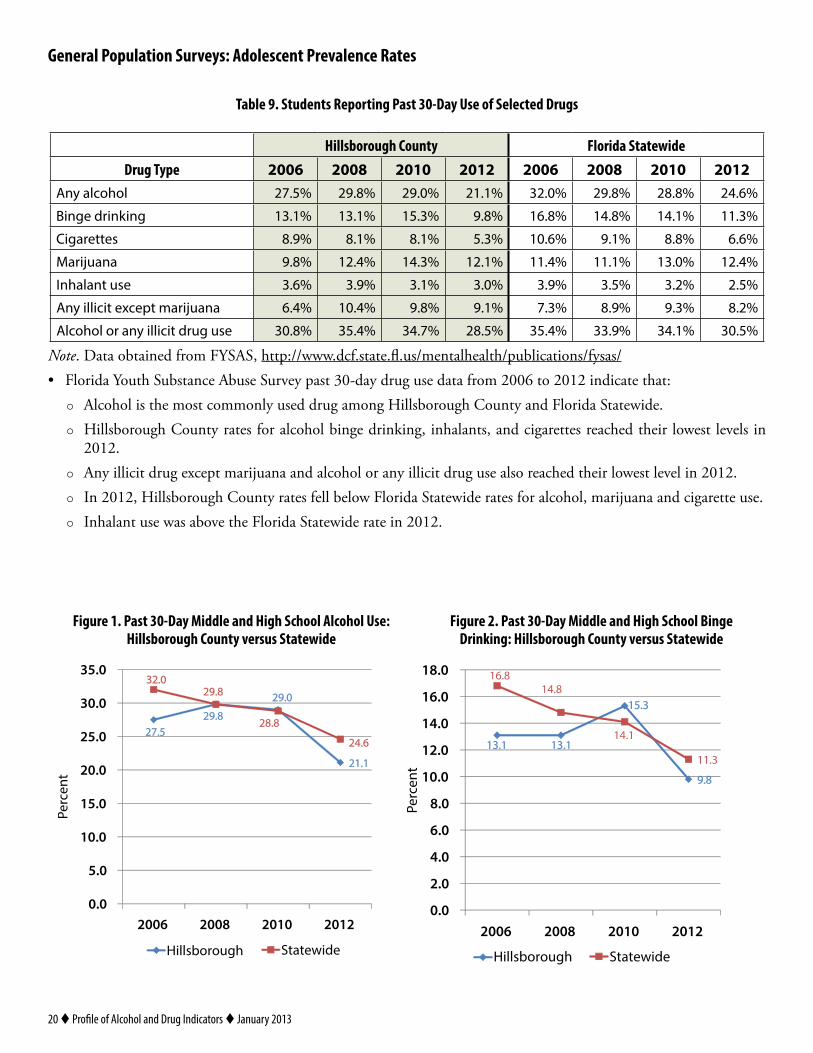
Any alcohol 27.5% 29.8% 29.0% 21.1% 32.0% 29.8% 28.8% 24.6%
Binge drinking 13.1% 13.1% 15.3% 9.8% 16.8% 14.8% 14.1% 11.3%
Cigarettes 8.9% 8.1% 8.1% 5.3% 10.6% 9.1% 8.8% 6.6%
Marijuana 9.8% 12.4% 14.3% 12.1% 11.4% 11.1% 13.0% 12.4%
Inhalant use 3.6% 3.9% 3.1% 3.0% 3.9% 3.5% 3.2% 2.5%
Any illicit except marijuana 6.4% 10.4% 9.8% 9.1% 7.3% 8.9% 9.3% 8.2%
Alcohol or any illicit drug use 30.8% 35.4% 34.7% 28.5% 35.4% 33.9% 34.1% 30.5%
Note. Data obtained from FYSAS, http://www.dcf.state.fl.us/mentalhealth/publications/fysas/• Florida Youth Substance Abuse Survey past 30-day drug use data from 2006 to 2012 indicate that:
{ Alcohol is the most commonly used drug among Hillsborough County and Florida Statewide. { Hillsborough County rates for alcohol binge drinking, inhalants, and cigarettes reached their lowest levels in
2012. { Any illicit drug except marijuana and alcohol or any illicit drug use also reached their lowest level in 2012. { In 2012, Hillsborough County rates fell below Florida Statewide rates for alcohol, marijuana and cigarette use. { Inhalant use was above the Florida Statewide rate in 2012.
Figure 1. Past 30-Day Middle and High School Alcohol Use: Hillsborough County versus Statewide
Figure 2. Past 30-Day Middle and High School Binge Drinking: Hillsborough County versus Statewide
27.5
29.8 29.0
21.1
32.0
28.8
24.6
0.0
5.0
10.0
15.0
20.0
25.0
30.0
35.0
2006 2008 2010 2012
Hillsborough Statewide
29.8
13.1 13.1
15.3
9.8
16.8
14.1
11.3
0.0
2.0
4.0
6.0
8.0
10.0
12.0
14.0
16.0
18.0
2006 2008 2010 2012
Hillsborough Statewide
14.8
Profile of Alcohol and Drug Indicators t January 2013 t 21
General Population Surveys: Adolescent Prevalence Rates
Table 10. Percent of Hillsborough County Students Reporting Drug-Related Behavior
Middle School High SchoolDrug-Related Behavior 2004 2006 2008 2010 2012 2004 2006 2008 2010 2012
Selling drugs 3.9% 2.7% 3.4% 3.7% 2.3% 9.6% 6.6% 9.5% 9.2% 7.4%
Drunk or high at school 7.1% 5.7% 8.8% 6.7% 6.4% 19.2% 18.0% 16.3% 19.6% 14.2%
• Florida Youth Substance Abuse Survey drug-related behavior data from 2004 to 2012 indicate that: { Middle and high school students reported decreased rates of selling drugs and being drunk or high at school
from 2010 to 2012. { Selling drugs and being drunk or high at school were at the lowest rates in 2012.
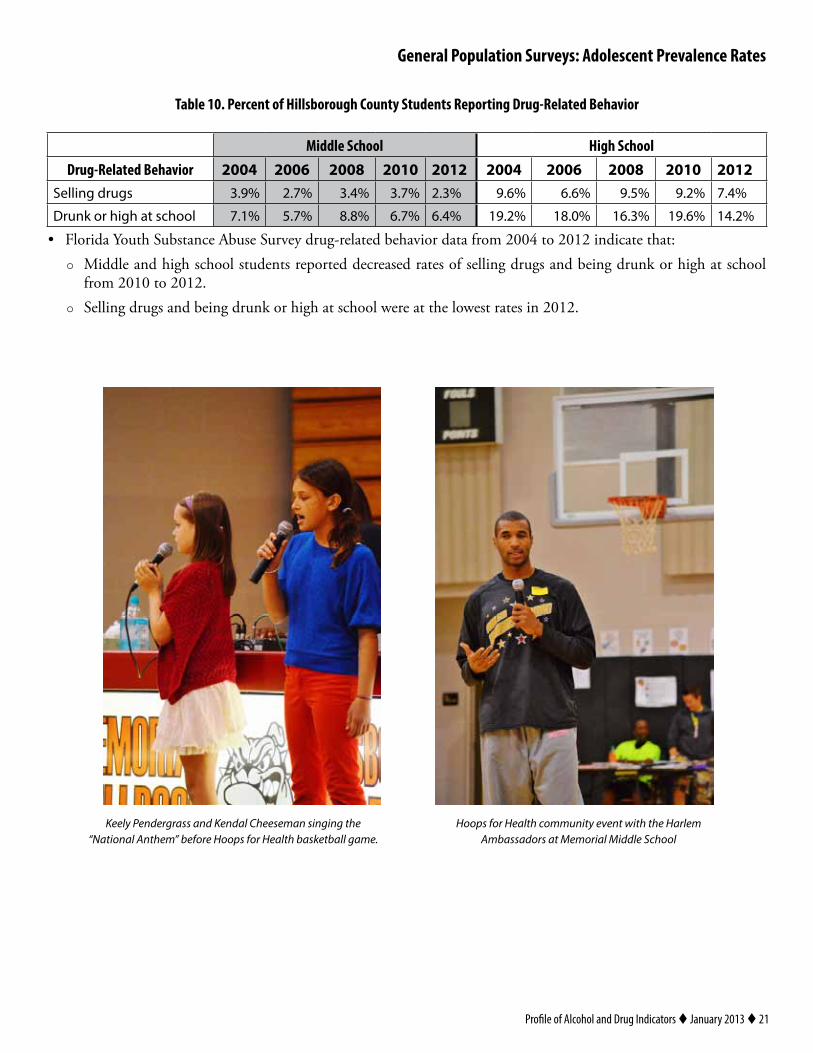
Keely Pendergrass and Kendal Cheeseman singing the “National Anthem” before Hoops for Health basketball game.
Hoops for Health community event with the Harlem Ambassadors at Memorial Middle School
22 t Profile of Alcohol and Drug Indicators t January 2013
Mortality Data
Table 11. Hillsborough County Drug-Related Deaths by Lethal/Non-Lethal Levels
Lethal Levels:Drug Was Cause of Death
Non-Lethal Levels:Drug Was Present
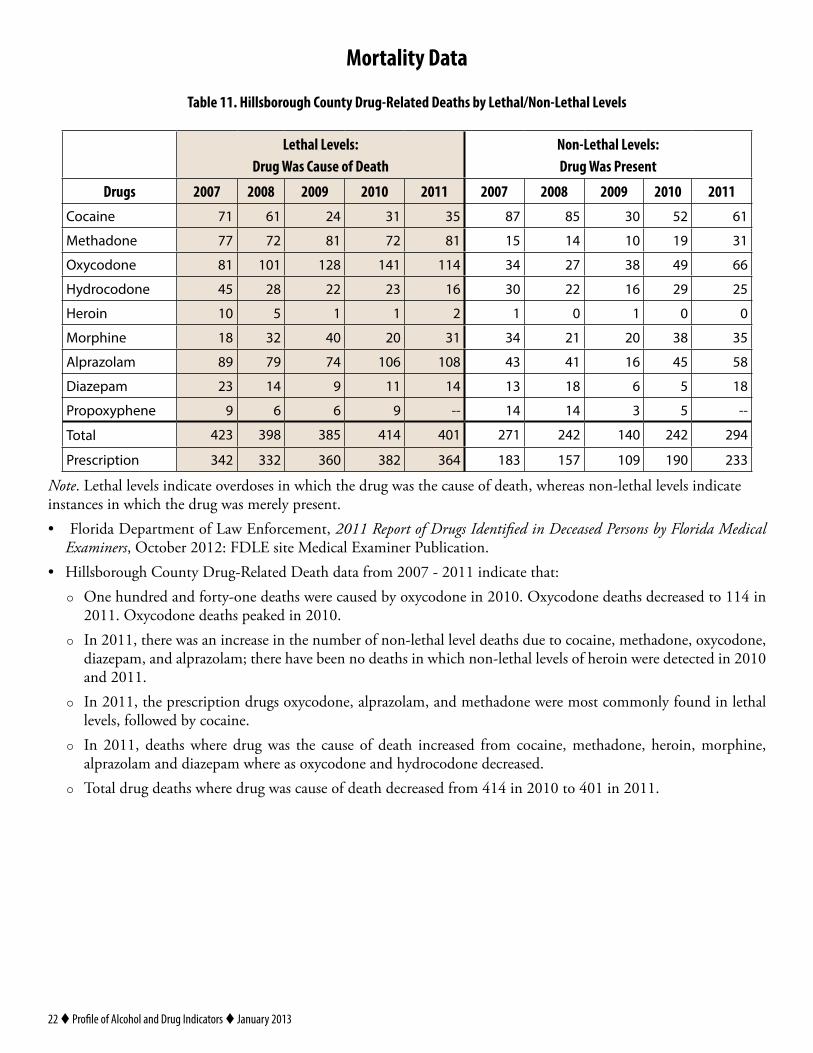
Drugs 2007 2008 2009 2010 2011 2007 2008 2009 2010 2011
Cocaine 71 61 24 31 35 87 85 30 52 61
Methadone 77 72 81 72 81 15 14 10 19 31
Oxycodone 81 101 128 141 114 34 27 38 49 66
Hydrocodone 45 28 22 23 16 30 22 16 29 25
Heroin 10 5 1 1 2 1 0 1 0 0
Morphine 18 32 40 20 31 34 21 20 38 35
Alprazolam 89 79 74 106 108 43 41 16 45 58
Diazepam 23 14 9 11 14 13 18 6 5 18
Propoxyphene 9 6 6 9 -- 14 14 3 5 --
Total 423 398 385 414 401 271 242 140 242 294
Prescription 342 332 360 382 364 183 157 109 190 233
Note. Lethal levels indicate overdoses in which the drug was the cause of death, whereas non-lethal levels indicate instances in which the drug was merely present.• Florida Department of Law Enforcement, 2011 Report of Drugs Identified in Deceased Persons by Florida Medical
Examiners, October 2012: FDLE site Medical Examiner Publication.• Hillsborough County Drug-Related Death data from 2007 - 2011 indicate that:
{ One hundred and forty-one deaths were caused by oxycodone in 2010. Oxycodone deaths decreased to 114 in 2011. Oxycodone deaths peaked in 2010.
{ In 2011, there was an increase in the number of non-lethal level deaths due to cocaine, methadone, oxycodone, diazepam, and alprazolam; there have been no deaths in which non-lethal levels of heroin were detected in 2010 and 2011.
{ In 2011, the prescription drugs oxycodone, alprazolam, and methadone were most commonly found in lethal levels, followed by cocaine.
{ In 2011, deaths where drug was the cause of death increased from cocaine, methadone, heroin, morphine, alprazolam and diazepam where as oxycodone and hydrocodone decreased.
{ Total drug deaths where drug was cause of death decreased from 414 in 2010 to 401 in 2011.
Profile of Alcohol and Drug Indicators t January 2013 t 23
Mortality Data
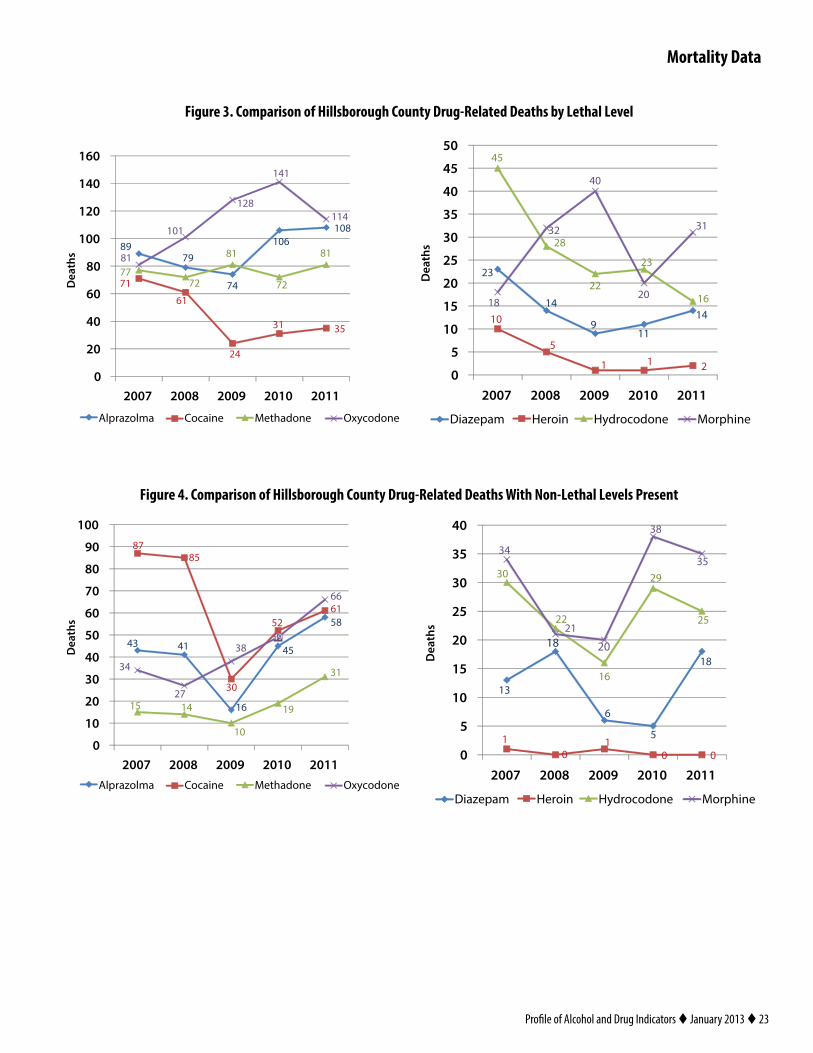
Figure 3. Comparison of Hillsborough County Drug-Related Deaths by Lethal Level
Figure 4. Comparison of Hillsborough County Drug-Related Deaths With Non-Lethal Levels Present
8979
74
106108
71
61
24
31 35
7772
81
72
8181
101
128
141
114
0
20
40
60
80
100
120
140
160
2007 2008 2009 2010 2011
Alprazolma Cocaine Methadone Oxycodone
23
14
911
1410
5
1 1 2
45
28
22
23
1618
32
40
20
31
0
5
10
15
20
25
30
35
40
45
50
2007 2008 2009 2010 2011
Diazepam Heroin Hydrocodone Morphine
Alprazolma Cocaine Methadone Oxycodone
43 41
16
45
58
8785
30
5261
15 14
10
19
3134
27
38
66
0
10
20
30
40
50
60
70
80
90
100
2007 2008 2009 2010 2011
49
Diazepam Heroin Hydrocodone Morphine
13
18
6
5
18
10
10 0
30
22
16
29
25
34
21
20
38
35
0
5
10
15
20
25
30
35
40
2007 2008 2009 2010 2011
24 t Profile of Alcohol and Drug Indicators t January 2013
Mortality Data
Table 12. Alcohol-Related Crashes, Injuries and Fatalities
Hillsborough County Pinellas County Orange County
Indicator 2008 2009 2010 2011 2008 2009 2010 2011 2008 2009 2010 2011
Crashes 1,788 1,422 1,363 1,424 1,390 1,223 1,198 1,114 1,373 1,304 1,091 936
Injuries 1,339 1,031 980 -- 895 747 699 -- 987 900 746 --
Fatalities 77 62 54 67 51 45 42 51 77 66 62 54
Note. Data obtained from Florida Department of Highway Safety and Motor Vehicles, http://www.hsmv.state.fl.us/• Florida Department of Highway Safety and Motor Vehicle data indicate that Hillsborough County has a higher
number of alcohol-related crashes and injuries than the comparably sized Pinellas and Orange Counties.• From 2008 to 2010, Hillsborough County experienced a decrease in alcohol-related crashes, injuries and fatalities
but alcohol crashes and fatalities increased in 2011.• In 2011, alcohol injury data was not available from DHSMV.
Figure 5. Comparison of Alcohol-Related Crashes and Fatalities
1788
1422 1363 14241390
12231198
1114
13731304
1091
936
0
200
400
600
800
1000
1200
1400
1600
1800
2000
2008 2009 2010 2011
Hillsborough County Pinellas County Orange CountyHillsborough County Pinellas County Orange County
77
62 54
67
5145
42
51
77
6662
54
0
10
20
30
40
50
60
70
80
90
2008 2009 2010 2011
Profile of Alcohol and Drug Indicators t January 2013 t 25
Mortality Data
Table 13. 2009 Hillsborough County Medical Examiner Autopsy Data on Persons Aged 15 to 24
Type of Death#
Demographics Alcohol and Drug Use1
% Male % White2
Mean Age
# w/BAC over .01
Mean Alcohol Level3
# Drugs Identified4 Primary Drugs Used
Accidents 29 82.8% 93.1% 21.4 3 .11 (.04 - .20) 45
Alcohol and/or drug abuse
27 85.2% 92.6% 21.5 3 .11 (.04 - .20) 45 Oxycodone (N = 13)Alprazolam (N = 8)Methadone (N = 7)Cocaine (N = 6)Dextromethorphan (N = 2)
Drowning 1 0% 100% 23.0 0 -- 0Fall 1 100% 100% 19.0 0 -- 0Traffic Fatalities 41 80.5% 92.5% 21.1 19 .13 (.02 - .24) 5
Driver 24 91.7% 90.0% 21.6 10 .16 (.09 - .24) 2 Cocaine (N = 1)Oxycodone (N = 1)
Passenger 10 50.0% 94.1% 20.4 4 .11 (.02 - .21) 3 Alprazolam (N = 1)Oxycodone (N = 1)Cocaine (N = 1)
Pedestrian 5 100% 100% 21.0 5 .13 (.06 - .22) 0Bicyclist 2 80.0% 100% 21.5 0 -- 0Suicides 22 81.8% 72.7% 20.4 8 .11 (.07 - .18) 7
Handgun 14 78.6% 78.6% 19.9 5 .10 (.07 - .13) 2 Alprazolam (N = 1)Oxycodone (N = 1)
Hanging 5 80.0% 80.0% 22.0 1 .18 3 Alprazolam (N = 2)Cocaine (N = 1)
Intentional overdose
1 0% 100% 24.0 1 .04 2 MeoprololSertraline
Motor vehicle collision
1 0% 100% 17.0 0 -- 0
Jump from high place
1 0% 100% 19.0 1 .13 0
Homicides 18 94.4% 33.3% 20.8 3 .11 (.09 - .11) 4
Handgun 15 100% 26.7% 20.9 3 .11 (.09 - .11) 4 THC (N = 3)Cocaine (N = 1)
Stabbing 3 66.7% 66.7% 20.0 0 -- 0TOTAL 110 84.9% 70.6% 20.4 34 .115 (.02 - .24) 61
• 1. Toxicology was not complete on all cases because some individuals were hospitalized for days/weeks and the admission blood samples were discarded by the hospital.
• 2. All cases were either white or black.• 3. Calculations based on only the persons testing positive for any alcohol in their system.• 4. Numbers do not add up to 27 cases since many cases were polydrug.• Traffic fatalities were the number one cause of death in the 15 to 24 year old age group. Nineteen out of 41 persons
had alcohol in their system (46%) and 100% of pedestrians who died had alcohol in their system.
26 t Profile of Alcohol and Drug Indicators t January 2013
.11
.16
.11.13
.10
0.18
.04
.11
0
0.05
0.1
0.15
0.2
0.25
Substance abuse (n=27)
Car accident -
driver (n=24)
Car accident -
passenger (n=10)
Car accident -pedestrian
(n=5)
Suicide -gun (n=5)
Suicide -hanging
(n=1)
Suicide -overdose
(n=1)
Homicide -gun (n=15)
BA
C le
vel
Note. Data from Hillsborough County Medical Examiner’s Office (2009)
11%
42%40%
100%
36%
20%
100%
20%
0%
20%
40%
60%
80%
100%
Substance abuse (n=27)
Car accident-
driver (n=24)
Car accident-passenger
(n=10)
Car accident-
pedestrian (n=5)
Suicide-gun (n=14)
Suicide-hanging
(n=5)
Suicide-overdose
(n=1)
Homicide-gun (n=3)
% w
/BA
C L
evel
ove
r .0
1
Note. Data from Hillsborough County Medical Examiner’s Office (2009)
Figure 6. Autopsy Data BAC Level for Youth Ages 15 to 24 Years by Manner of Death
Figure 7. Autopsy Data Indication of Alcohol for Youth Ages 15 to 24 Years by Manner of Death
Mortality Data
HCSO deputies and Sanford Brown students collected many boxes of prescription drugs at a recent DEA Take Back event.
HCADA Chair Sonya Bufe with Florida Attorney General Pam Bondi and Sweetbay officials at a DEA Prescription Drug Take Back event.
Profile of Alcohol and Drug Indicators t January 2013 t 27
Treatment Data
Table 14. Adult Admissions to Hillsborough County Substance Abuse Treatment Providers
# Admissions with drug listed as primary, secondary, or tertiary drug of choice
FY 06/07 FY 07/08 FY 08/09 FY 09/10 FY 10/11Marijuana / Hashish 4711 4755 4812 5338 4998
Alcohol 3169 2898 2829 2739 2985
Crack 1536 1115 882 709 552
Other cocaine 611 630 460 459 409
Heroin 222 121 166 126 62
Methamphetamine 233 121 116 101 93
Other opiates and synthetics 307 351 411 469 486
Oxycodone 115 270 528 742 891
Benzodiazepines 145 183 270 373 312
Alprazolam 44 182 276 361 482
Ecstasy / MDMA 41 33 0 53 110
Note. Data obtained from Central Florida Behavioral Health Network.• Admissions with marijuana as one of the drugs of choice increased from 4,711 in FY06/07 to 4,998 in FY10/11.• Marijuana, alcohol and oxycodone were the top three drug choices in treatment agency admissions in FY10/11.
4
16
8
13
34
39
0
5
10
15
20
25
30
35
40
45
2010 2011 2012
Bath Salts K2/Spice
Figure 8. Number of Calls for Synthetic Drug Use in Hillsborough County 2010-2012
Note. Data obtained from Florida Poison Information Center• From 2010 to 2012, there was an increase in the number of calls for K2/Spice from 13 in 2010 to 39 in 2012.
28 t Profile of Alcohol and Drug Indicators t January 2013
Appendix A: Florida Collegiate Success InitiativeTo address the goals of the Collegiate Success Initiative, we examine “consequences data” that our Florida Mental
Health Institute (FMHI) team at the University of South Florida obtained through exploration of state agency websites, as well as information obtained from Mr. Hal Johnson, State Epidemiologist for the Florida Department of Children and Families’ Substance Abuse and Mental Health (SAMH) Program Office and Director of the State Epidemiology and Outcomes Workgroup (SEOW). All such sources were data in the public domain. Our focus was to collect data relevant to the collaborative in four counties: Alachua, Hillsborough, Leon, and Orange Counties. Within each of those four counties are state universities that have lead roles for implementing prevention efforts on their campuses and coordinating surveys. These are respectively the: University of Florida (UF), University of South Florida (USF), Florida State University (FSU), and University of Central Florida (UCF).
The objective of the CSI: Florida grant is to mobilize campus and community coalitions to change the environment that supports high-risk underage use of alcohol. The state priority goal is to reduce past 30 day alcohol use, including binge drinking, among 18 - 20 year olds in targeted communities. The two-year community intermediate outcome measures are to
1. Increase knowledge and awareness of the problem within targeted communities among students, faculty and staff, and other responsible community adults.
2. Increase, in each targeted community, the perception of wrongfulness of alcohol and other drug use among students, faculty and staff, and other responsible community adults.
3. Increase, in each targeted community, the perception of harm from use of alcohol and other drugs among students, faculty and staff, and other responsible community adults.
Consequences: Alcohol Related Injuries, Fatalities, Hospitalizations, and Arrests
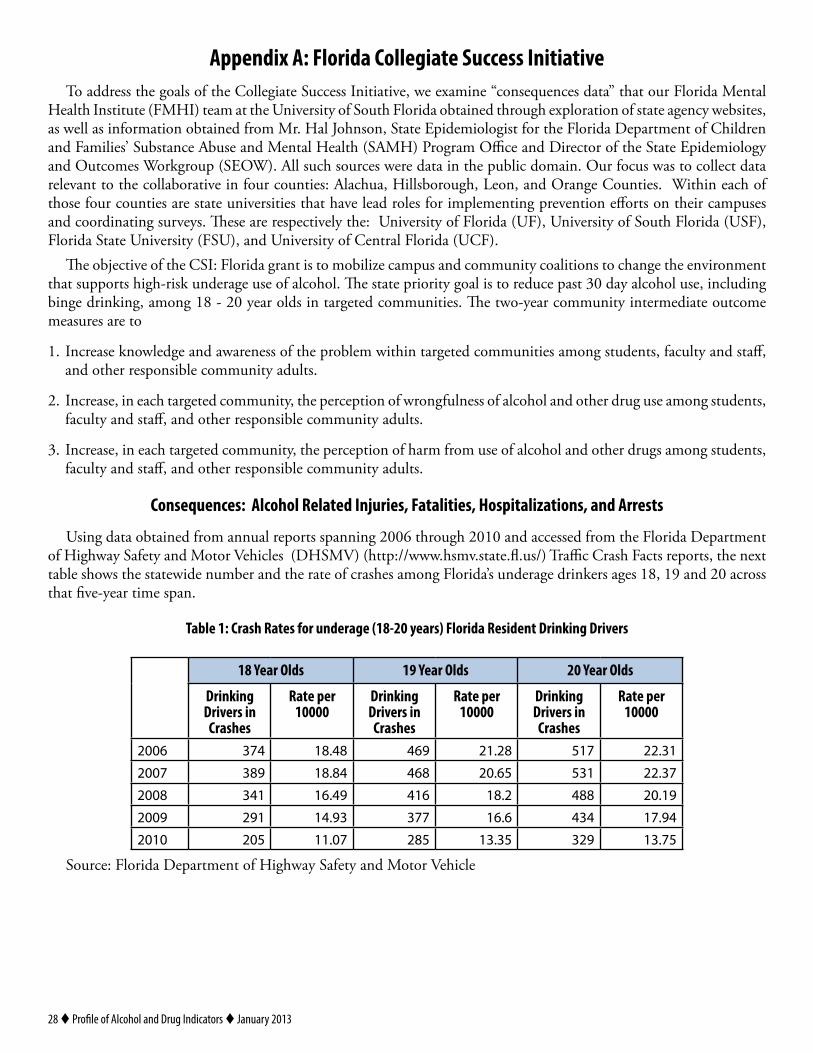
Using data obtained from annual reports spanning 2006 through 2010 and accessed from the Florida Department of Highway Safety and Motor Vehicles (DHSMV) (http://www.hsmv.state.fl.us/) Traffic Crash Facts reports, the next table shows the statewide number and the rate of crashes among Florida’s underage drinkers ages 18, 19 and 20 across that five-year time span.
Table 1: Crash Rates for underage (18-20 years) Florida Resident Drinking Drivers
18 Year Olds 19 Year Olds 20 Year Olds
Drinking Drivers in Crashes
Rate per 10000
Drinking Drivers in Crashes
Rate per 10000
Drinking Drivers in Crashes
Rate per 10000
2006 374 18.48 469 21.28 517 22.31
2007 389 18.84 468 20.65 531 22.37
2008 341 16.49 416 18.2 488 20.19
2009 291 14.93 377 16.6 434 17.94
2010 205 11.07 285 13.35 329 13.75
Source: Florida Department of Highway Safety and Motor Vehicle
Profile of Alcohol and Drug Indicators t January 2013 t 29
Appendix A: Florida Collegiate Success Initiative
The results indicate a steady and substantial decline since 2006 for each of these three age groups in the state of Florida. The Traffic Crash Facts reports are aggregate and do not provide data categorized by both age and county. To accomplish the latter, the raw data from Florida DHSMV will need to be imported into an automated data system, either through the DCF Dashboard operated by the SEOW, or through KIT Solutions’ Performance Based Prevention System, the database tracking software package based on the Center for Substance Abuse Prevention system. This will allow communities to access the most recent data at the geographic level and age-criterion needed for planning purposes.
County Level Data
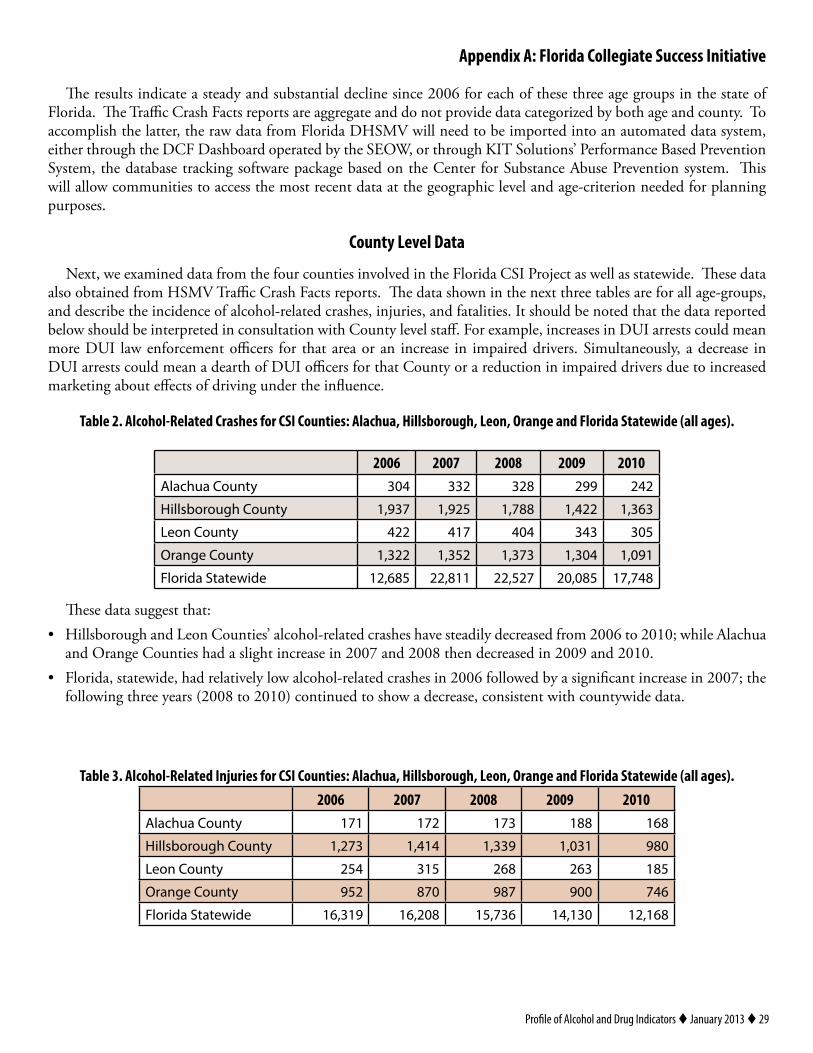
Next, we examined data from the four counties involved in the Florida CSI Project as well as statewide. These data also obtained from HSMV Traffic Crash Facts reports. The data shown in the next three tables are for all age-groups, and describe the incidence of alcohol-related crashes, injuries, and fatalities. It should be noted that the data reported below should be interpreted in consultation with County level staff. For example, increases in DUI arrests could mean more DUI law enforcement officers for that area or an increase in impaired drivers. Simultaneously, a decrease in DUI arrests could mean a dearth of DUI officers for that County or a reduction in impaired drivers due to increased marketing about effects of driving under the influence.
Table 2. Alcohol-Related Crashes for CSI Counties: Alachua, Hillsborough, Leon, Orange and Florida Statewide (all ages).
2006 2007 2008 2009 2010Alachua County 304 332 328 299 242
Hillsborough County 1,937 1,925 1,788 1,422 1,363
Leon County 422 417 404 343 305
Orange County 1,322 1,352 1,373 1,304 1,091
Florida Statewide 12,685 22,811 22,527 20,085 17,748
These data suggest that:• Hillsborough and Leon Counties’ alcohol-related crashes have steadily decreased from 2006 to 2010; while Alachua
and Orange Counties had a slight increase in 2007 and 2008 then decreased in 2009 and 2010.• Florida, statewide, had relatively low alcohol-related crashes in 2006 followed by a significant increase in 2007; the
following three years (2008 to 2010) continued to show a decrease, consistent with countywide data.
Table 3. Alcohol-Related Injuries for CSI Counties: Alachua, Hillsborough, Leon, Orange and Florida Statewide (all ages).2006 2007 2008 2009 2010
Alachua County 171 172 173 188 168
Hillsborough County 1,273 1,414 1,339 1,031 980
Leon County 254 315 268 263 185
Orange County 952 870 987 900 746
Florida Statewide 16,319 16,208 15,736 14,130 12,168
30 t Profile of Alcohol and Drug Indicators t January 2013
Appendix A: Florida Collegiate Success Initiative
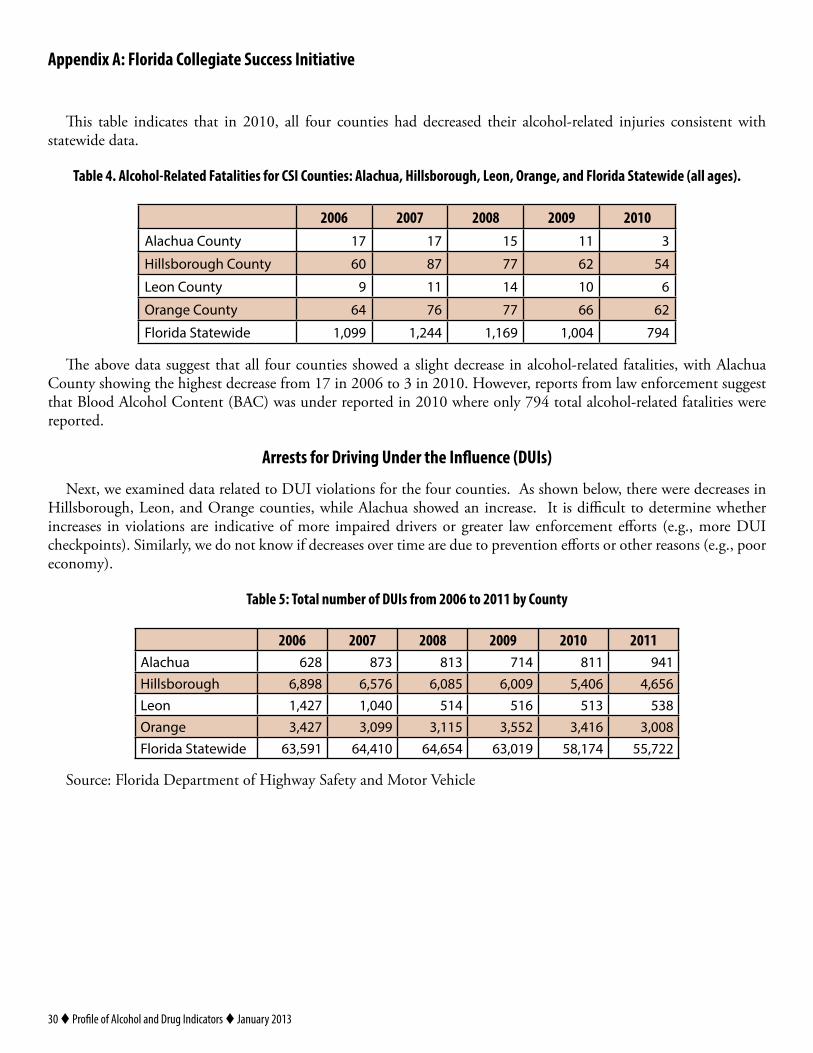
This table indicates that in 2010, all four counties had decreased their alcohol-related injuries consistent with statewide data.
Table 4. Alcohol-Related Fatalities for CSI Counties: Alachua, Hillsborough, Leon, Orange, and Florida Statewide (all ages).
2006 2007 2008 2009 2010Alachua County 17 17 15 11 3
Hillsborough County 60 87 77 62 54
Leon County 9 11 14 10 6
Orange County 64 76 77 66 62
Florida Statewide 1,099 1,244 1,169 1,004 794
The above data suggest that all four counties showed a slight decrease in alcohol-related fatalities, with Alachua County showing the highest decrease from 17 in 2006 to 3 in 2010. However, reports from law enforcement suggest that Blood Alcohol Content (BAC) was under reported in 2010 where only 794 total alcohol-related fatalities were reported.
Arrests for Driving Under the Influence (DUIs)
Next, we examined data related to DUI violations for the four counties. As shown below, there were decreases in Hillsborough, Leon, and Orange counties, while Alachua showed an increase. It is difficult to determine whether increases in violations are indicative of more impaired drivers or greater law enforcement efforts (e.g., more DUI checkpoints). Similarly, we do not know if decreases over time are due to prevention efforts or other reasons (e.g., poor economy).
Table 5: Total number of DUIs from 2006 to 2011 by County
2006 2007 2008 2009 2010 2011Alachua 628 873 813 714 811 941Hillsborough 6,898 6,576 6,085 6,009 5,406 4,656Leon 1,427 1,040 514 516 513 538Orange 3,427 3,099 3,115 3,552 3,416 3,008Florida Statewide 63,591 64,410 64,654 63,019 58,174 55,722
Source: Florida Department of Highway Safety and Motor Vehicle
Profile of Alcohol and Drug Indicators t January 2013 t 31
Appendix A: Florida Collegiate Success Initiative
Consequences: Underage Drinking
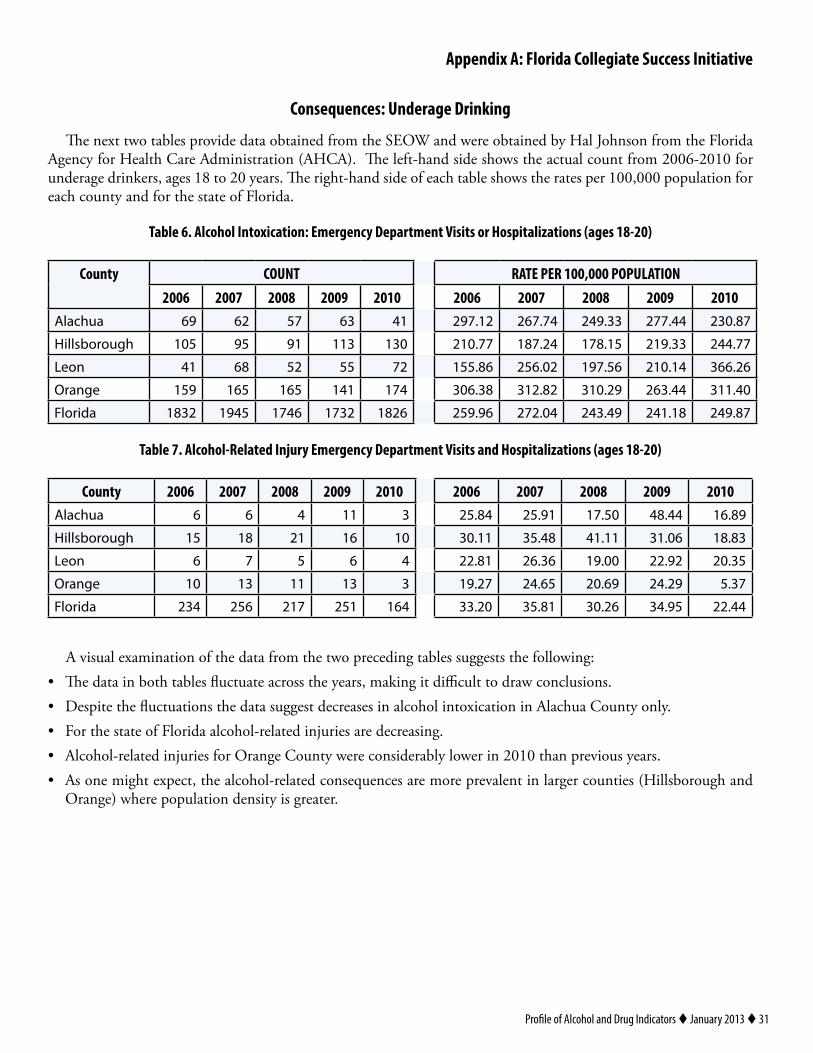
The next two tables provide data obtained from the SEOW and were obtained by Hal Johnson from the Florida Agency for Health Care Administration (AHCA). The left-hand side shows the actual count from 2006-2010 for underage drinkers, ages 18 to 20 years. The right-hand side of each table shows the rates per 100,000 population for each county and for the state of Florida.
Table 6. Alcohol Intoxication: Emergency Department Visits or Hospitalizations (ages 18-20)
County COUNT RATE PER 100,000 POPULATION2006 2007 2008 2009 2010 2006 2007 2008 2009 2010
Alachua 69 62 57 63 41 297.12 267.74 249.33 277.44 230.87
Hillsborough 105 95 91 113 130 210.77 187.24 178.15 219.33 244.77
Leon 41 68 52 55 72 155.86 256.02 197.56 210.14 366.26
Orange 159 165 165 141 174 306.38 312.82 310.29 263.44 311.40
Florida 1832 1945 1746 1732 1826 259.96 272.04 243.49 241.18 249.87
Table 7. Alcohol-Related Injury Emergency Department Visits and Hospitalizations (ages 18-20)
County 2006 2007 2008 2009 2010 2006 2007 2008 2009 2010Alachua 6 6 4 11 3 25.84 25.91 17.50 48.44 16.89
Hillsborough 15 18 21 16 10 30.11 35.48 41.11 31.06 18.83
Leon 6 7 5 6 4 22.81 26.36 19.00 22.92 20.35
Orange 10 13 11 13 3 19.27 24.65 20.69 24.29 5.37
Florida 234 256 217 251 164 33.20 35.81 30.26 34.95 22.44
A visual examination of the data from the two preceding tables suggests the following:• The data in both tables fluctuate across the years, making it difficult to draw conclusions.• Despite the fluctuations the data suggest decreases in alcohol intoxication in Alachua County only.• For the state of Florida alcohol-related injuries are decreasing.• Alcohol-related injuries for Orange County were considerably lower in 2010 than previous years. • As one might expect, the alcohol-related consequences are more prevalent in larger counties (Hillsborough and
Orange) where population density is greater.
32 t Profile of Alcohol and Drug Indicators t January 2013
Appendix A: Florida Collegiate Success Initiative
Liquor Law Violations: County Data
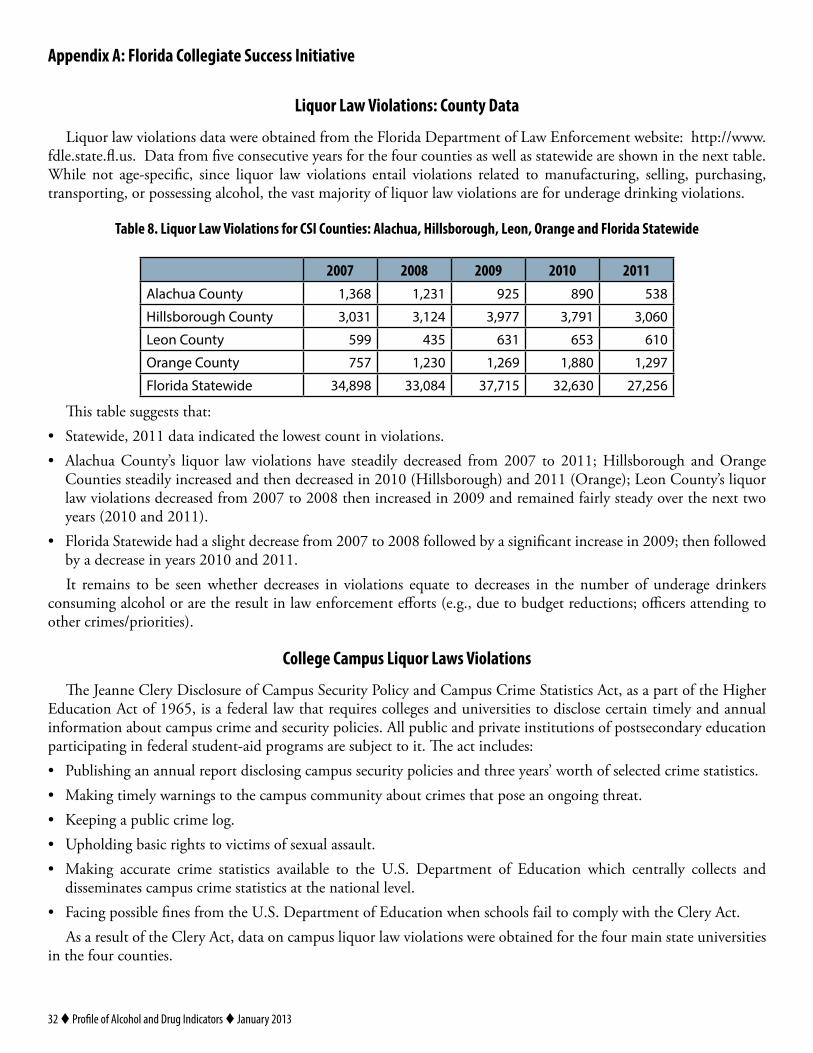
Liquor law violations data were obtained from the Florida Department of Law Enforcement website: http://www.fdle.state.fl.us. Data from five consecutive years for the four counties as well as statewide are shown in the next table. While not age-specific, since liquor law violations entail violations related to manufacturing, selling, purchasing, transporting, or possessing alcohol, the vast majority of liquor law violations are for underage drinking violations.
Table 8. Liquor Law Violations for CSI Counties: Alachua, Hillsborough, Leon, Orange and Florida Statewide
2007 2008 2009 2010 2011Alachua County 1,368 1,231 925 890 538
Hillsborough County 3,031 3,124 3,977 3,791 3,060
Leon County 599 435 631 653 610
Orange County 757 1,230 1,269 1,880 1,297
Florida Statewide 34,898 33,084 37,715 32,630 27,256
This table suggests that:• Statewide, 2011 data indicated the lowest count in violations.• Alachua County’s liquor law violations have steadily decreased from 2007 to 2011; Hillsborough and Orange
Counties steadily increased and then decreased in 2010 (Hillsborough) and 2011 (Orange); Leon County’s liquor law violations decreased from 2007 to 2008 then increased in 2009 and remained fairly steady over the next two years (2010 and 2011).
• Florida Statewide had a slight decrease from 2007 to 2008 followed by a significant increase in 2009; then followed by a decrease in years 2010 and 2011.It remains to be seen whether decreases in violations equate to decreases in the number of underage drinkers
consuming alcohol or are the result in law enforcement efforts (e.g., due to budget reductions; officers attending to other crimes/priorities).
College Campus Liquor Laws Violations
The Jeanne Clery Disclosure of Campus Security Policy and Campus Crime Statistics Act, as a part of the Higher Education Act of 1965, is a federal law that requires colleges and universities to disclose certain timely and annual information about campus crime and security policies. All public and private institutions of postsecondary education participating in federal student-aid programs are subject to it. The act includes:• Publishing an annual report disclosing campus security policies and three years’ worth of selected crime statistics.• Making timely warnings to the campus community about crimes that pose an ongoing threat.• Keeping a public crime log.• Upholding basic rights to victims of sexual assault.• Making accurate crime statistics available to the U.S. Department of Education which centrally collects and
disseminates campus crime statistics at the national level.• Facing possible fines from the U.S. Department of Education when schools fail to comply with the Clery Act.
As a result of the Clery Act, data on campus liquor law violations were obtained for the four main state universities in the four counties.
Profile of Alcohol and Drug Indicators t January 2013 t 33
Appendix A: Florida Collegiate Success Initiative
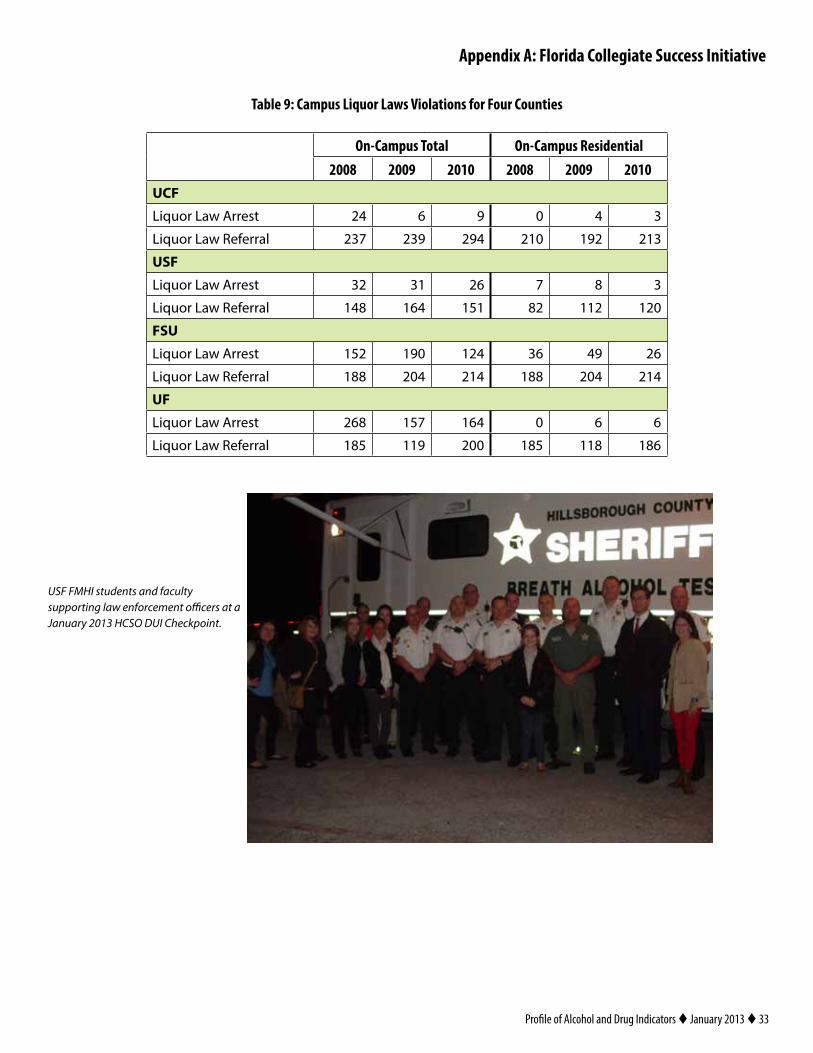
Table 9: Campus Liquor Laws Violations for Four Counties
On-Campus Total On-Campus Residential2008 2009 2010 2008 2009 2010
UCF
Liquor Law Arrest 24 6 9 0 4 3
Liquor Law Referral 237 239 294 210 192 213
USF
Liquor Law Arrest 32 31 26 7 8 3
Liquor Law Referral 148 164 151 82 112 120
FSU
Liquor Law Arrest 152 190 124 36 49 26
Liquor Law Referral 188 204 214 188 204 214
UF
Liquor Law Arrest 268 157 164 0 6 6
Liquor Law Referral 185 119 200 185 118 186
USF FMHI students and faculty supporting law enforcement officers at a January 2013 HCSO DUI Checkpoint.
34 t Profile of Alcohol and Drug Indicators t January 2013
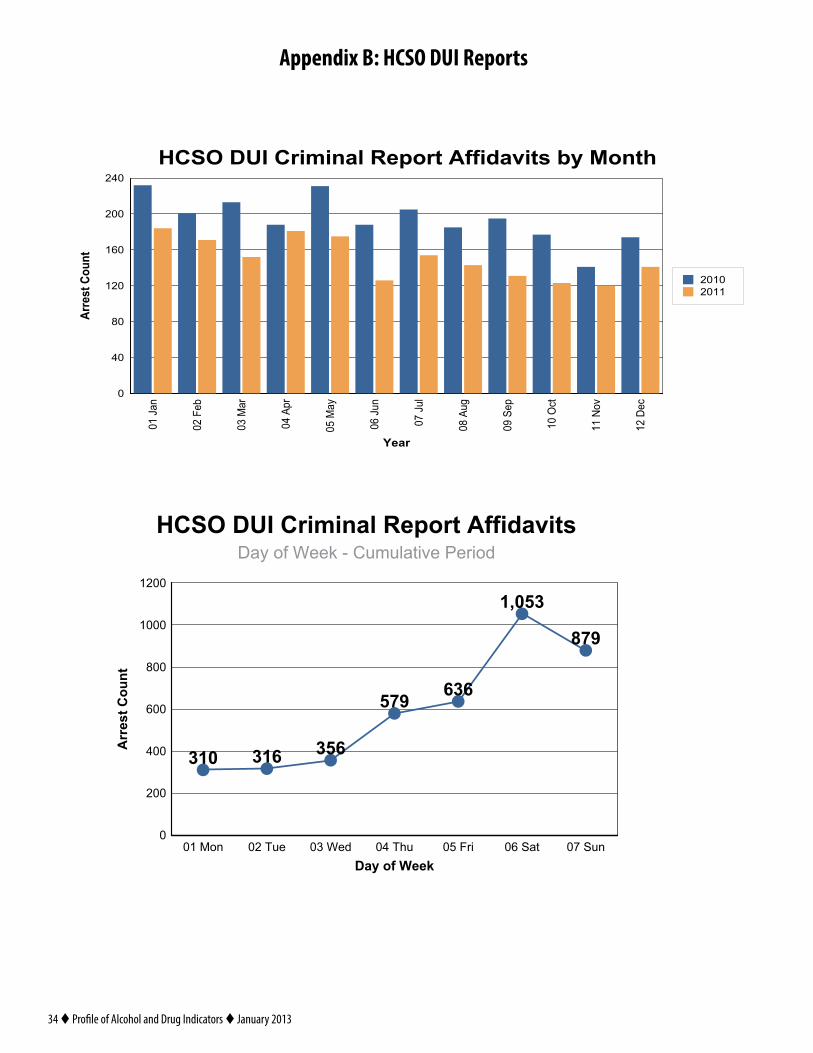
Appendix B: HCSO DUI Reports
0
40
80
120
160
200
240
01 J
an
02 F
eb
03 M
ar
04 A
pr
05 M
ay
06 J
un
07 J
ul
08 A
ug
09 S
ep
10 O
ct
11 N
ov
12 D
ec
20102011
Year
Arre
st C
ount
HCSO DUI Criminal Report Affidavits by Month
s
0
200
400
600
800
1000
1200
01 Mon 02 Tue 03 Wed 04 Thu 05 Fri 06 Sat 07 Sun
310 316 356
579 636
1,053
879
Day of Week
Arr
est C
ount
HCSO DUI Criminal Report AffidavitsDay of Week - Cumulative Period
Profile of Alcohol and Drug Indicators t January 2013 t 35
Appendix B: HCSO DUI Reports
Dade
Broward
Orange
Hillsborough
Duval
Pinellas
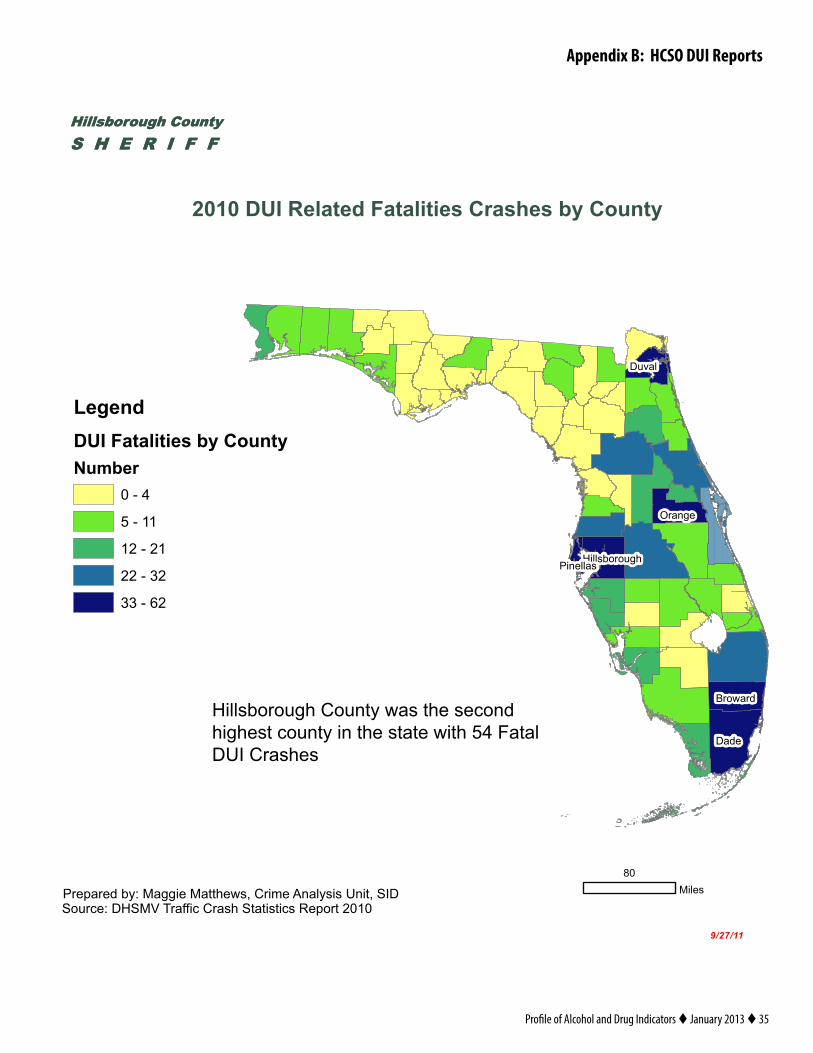
2010 DUI Related Fatalities Crashes by County
9/27/11
Hillsborough CountyS H E R I F FHillsborough CountyS H E R I F F
80MilesPrepared by: Maggie Matthews, Crime Analysis Unit, SID
Source: DHSMV Traffic Crash Statistics Report 2010
LegendDUI Fatalities by CountyNumber
0 - 4
5 - 11
12 - 21
22 - 32
33 - 62
Hillsborough County was the second highest county in the state with 54 Fatal DUI Crashes
36 t Profile of Alcohol and Drug Indicators t January 2013
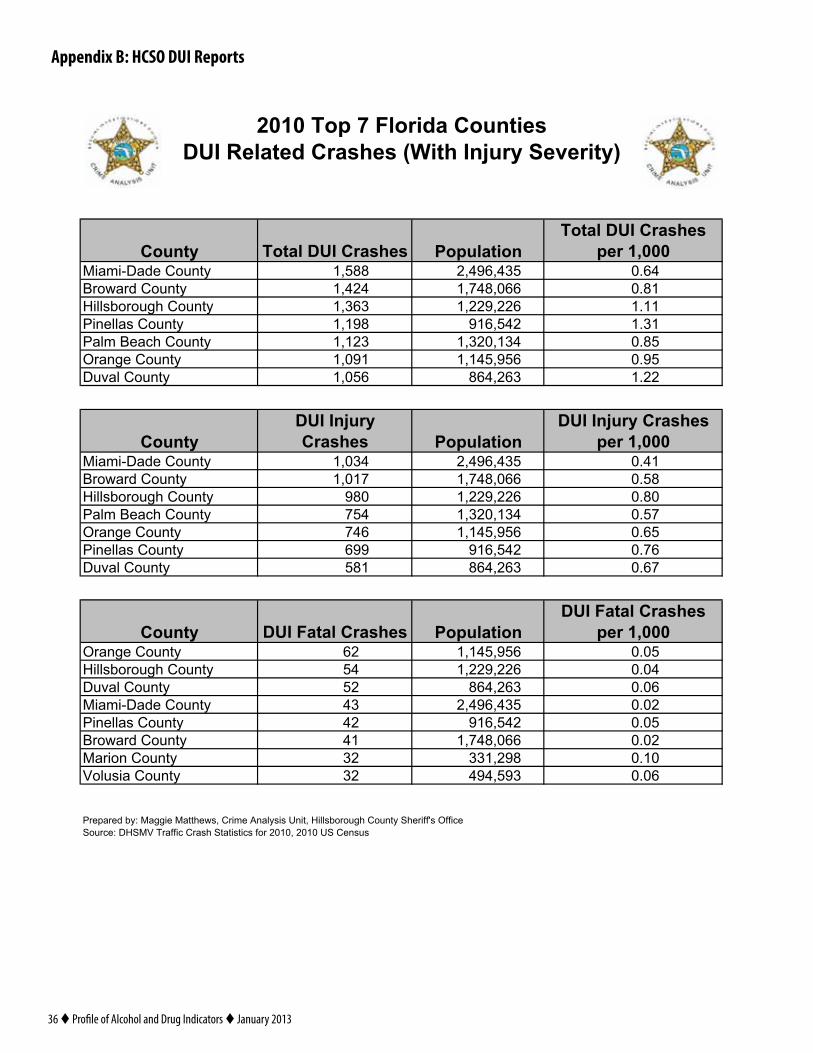
County Total DUI Crashes PopulationTotal DUI Crashes
per 1,000Miami-Dade County 1,588 2,496,435 0.64
18.0660,847,1424,1ytnuoC draworBHillsborough County 1,363 1,229,226 1.11
13.1245,619891,1ytnuoC salleniPPalm Beach County 1,123 1,320,134 0.85
59.0659,541,1190,1ytnuoC egnarO22.1362,468650,1ytnuoC lavuD
CountyDUI Injury Crashes Population
DUI Injury Crashes per 1,000
Miami-Dade County 1,034 2,496,435 0.4185.0660,847,1710,1ytnuoC draworB
Hillsborough County 980 1,229,226 0.80Palm Beach County 754 1,320,134 0.57
56.0659,541,1647ytnuoC egnarO67.0245,619996ytnuoC salleniP76.0362,468185ytnuoC lavuD
County DUI Fatal Crashes PopulationDUI Fatal Crashes
per 1,00050.0659,541,126ytnuoC egnarO
Hillsborough County 54 1,229,226 0.0460.0362,46825ytnuoC lavuD
Miami-Dade County 43 2,496,435 0.0250.0245,61924ytnuoC salleniP20.0660,847,114ytnuoC draworB01.0892,13323ytnuoC noiraM60.0395,49423ytnuoC aisuloV
2010 Top 7 Florida CountiesDUI Related Crashes (With Injury Severity)
Prepared by: Maggie Matthews, Crime Analysis Unit, Hillsborough County Sheriff's OfficeSource: DHSMV Traffic Crash Statistics for 2010, 2010 US Census
Appendix B: HCSO DUI Reports
Profile of Alcohol and Drug Indicators t January 2013 t 37
Appendix C: Tampa Police Department
262
252
260
254253
263 264
261
265
224
221
239242
250
240251
241
247246
244 245
243
223
225226
222
233
230
220
238
235
227236
237
232231
234
135
111
132
134131
147
100
7574
8786
99101
201
876
15
24
2322
3233
62
47 40
55
63
109
97 98
108 110
21
5
13 14
30 31
85
6160
72 73
84
39
46
53 54
107
71
83
96
127 128 129 130
145
142
146
148
45
28 29
38
52
59
43
11
19 20
12
51
37
44
58
70
82
95
106
143
126
116
141140125
144
42
26
35
43
36
27
69
49 50
57
81
94
105
115
155
162161
167
133
17
10
21
9
16 18
137
113 114
122 123
138
124
139
41
25
34
78
91 92
103 104
80
93
171
160
154153
159
166
172
48
56
66
79
197
189188
192 193
198
178 179
182
185
175
158
165
170
90
68
64
65
77
136
102
120 112
121
152150
119
151
156 157
164163
168 169
180
174
177
181
184
199
187
191
196195
173
176
183
186
190
194
200
88
67
117 89
76
117 118
149
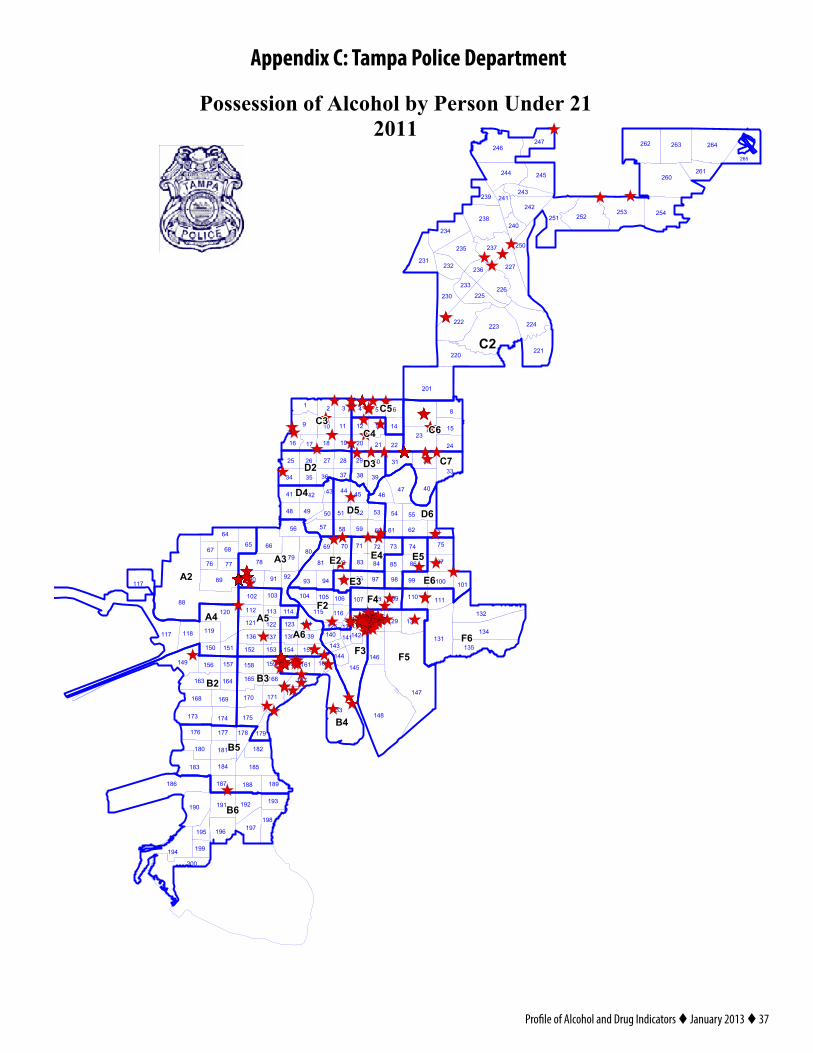
Tampa Police DepartmentPossession of Alcohol by Person Under 21
2011
38 t Profile of Alcohol and Drug Indicators t January 2013
262
252
260
254253
263 264
261
265
224
221
239242
250
240251
241
247246
244 245
243
223
225226
222
233
230
220
238
235
227236
237
232231
234
135
111
132
134131
147
100
7574
8786
99101
201
876
15
24
2322
3233
62
47 40
55
63
109
97 98
108 110
21
5
13 14
30 31
85
6160
72 73
84
39
46
53 54
107
71
83
96
127 128 129 130
145
142
146
148
45
28 29
38
52
59
43
11
19 20
12
51
37
44
58
70
82
95
106
143
126
116
141140125
144
42
26
35
43
36
27
69
49 50
57
81
94
105
115
155
162161
167
133
17
10
21
9
16 18
137
113 114
122 123
138
124
139
41
25
34
78
91 92
103 104
80
93
171
160
154153
159
166
172
48
56
66
79
197
189188
192 193
198
178 179
182
185
175
158
165
170
90
68
64
65
77
136
102
120 112
121
152150
119
151
156 157
164163
168 169
180
174
177
181
184
199
187
191
196195
173
176
183
186
190
194
200
88
67
117 89
76
117 118
149
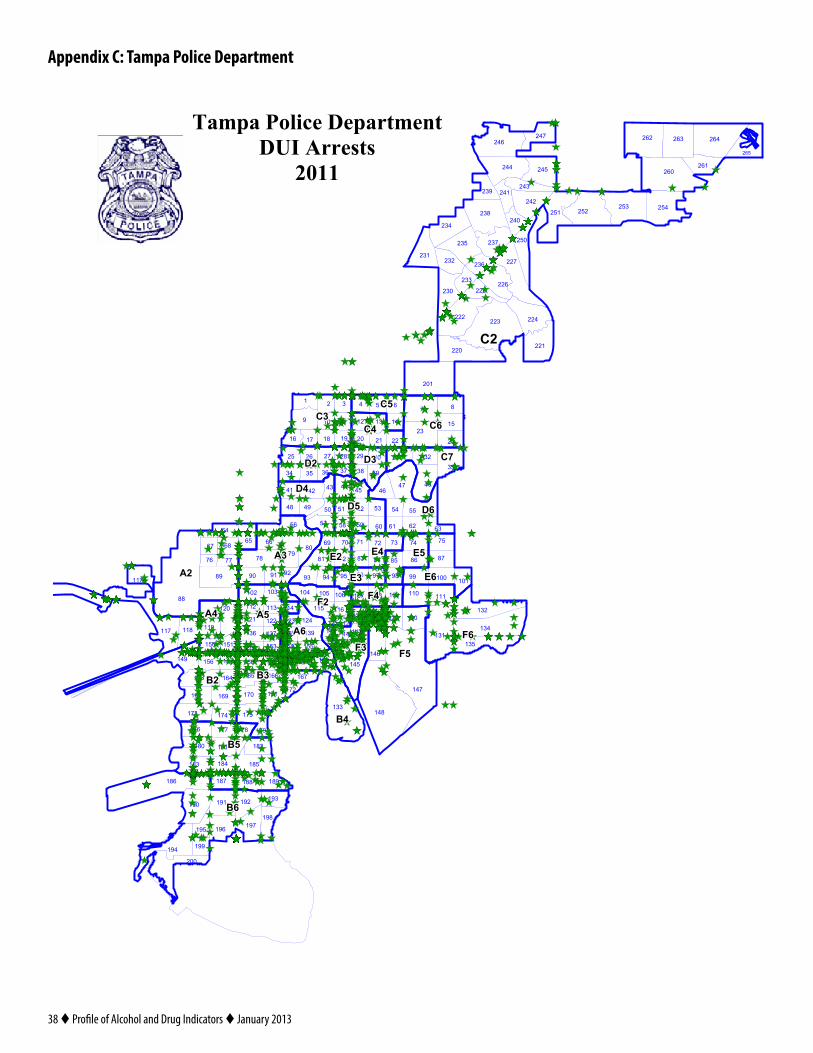
Tampa Police DepartmentDUI Arrests
2011
Appendix C: Tampa Police Department
Profile of Alcohol and Drug Indicators t January 2013 t 39
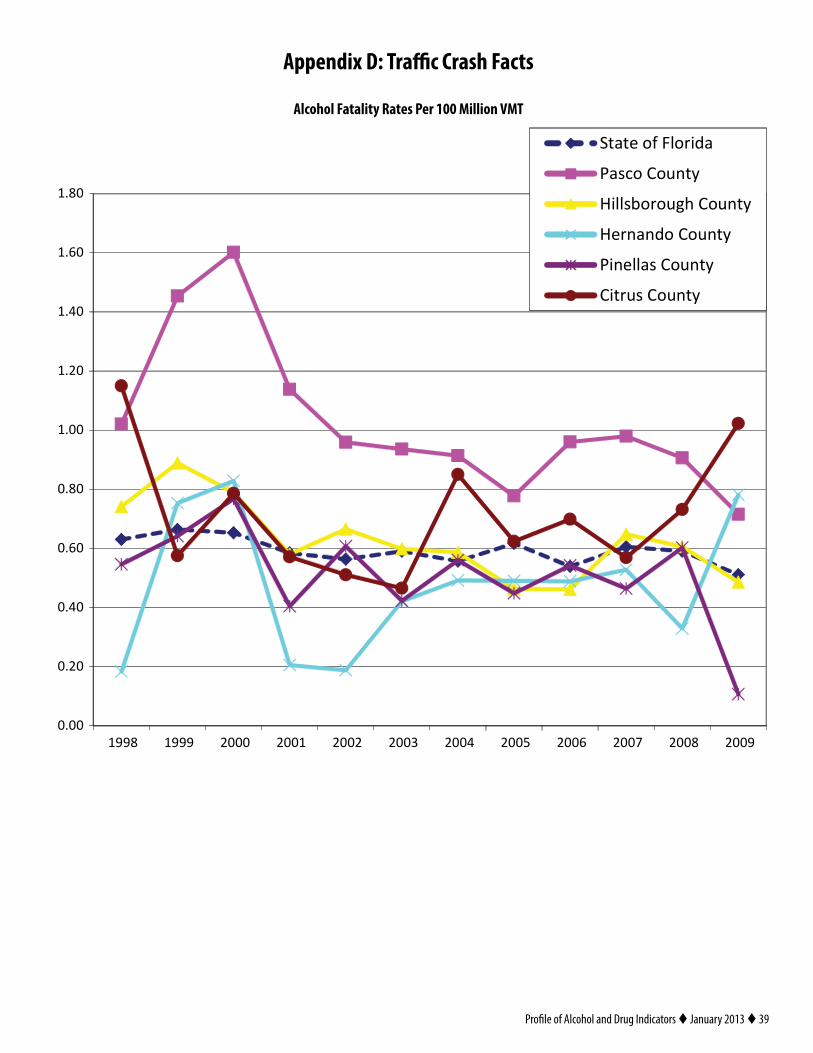
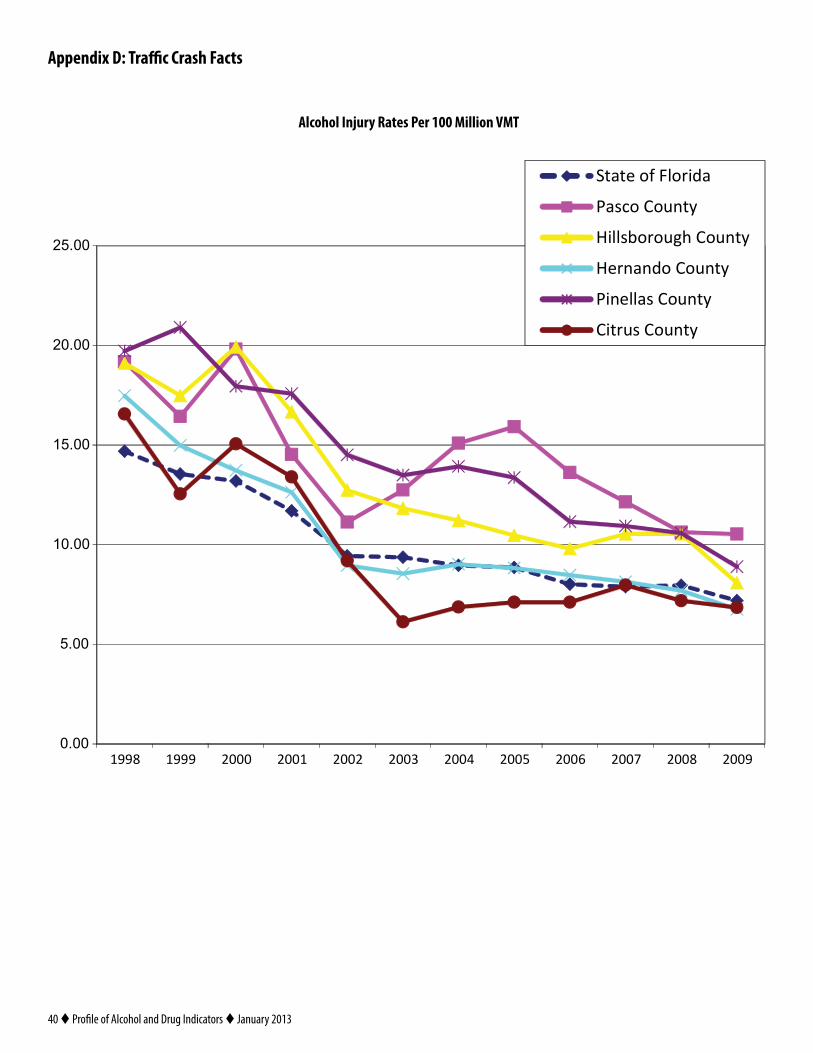
Appendix D: Traffic Crash Facts
0.00
0.20
0.40
0.60
0.80
1.00
1.20
1.40
1.60
1.80
1998 1999 2000 2001 2002 2003 2004 2005 2006 2007 2008 2009
State of Florida
Pasco County
Hillsborough County
Hernando County
Pinellas County
Citrus County
Alcohol Fatality Rates Per 100 Million VMT
40 t Profile of Alcohol and Drug Indicators t January 2013
Appendix D: Traffic Crash Facts
0.00
5.00
10.00
15.00
20.00
25.00
1998 1999 2000 2001 2002 2003 2004 2005 2006 2007 2008 2009
State of Florida
Pasco County
Hillsborough County
Hernando County
Pinellas County
Citrus County
Alcohol Injury Rates Per 100 Million VMT
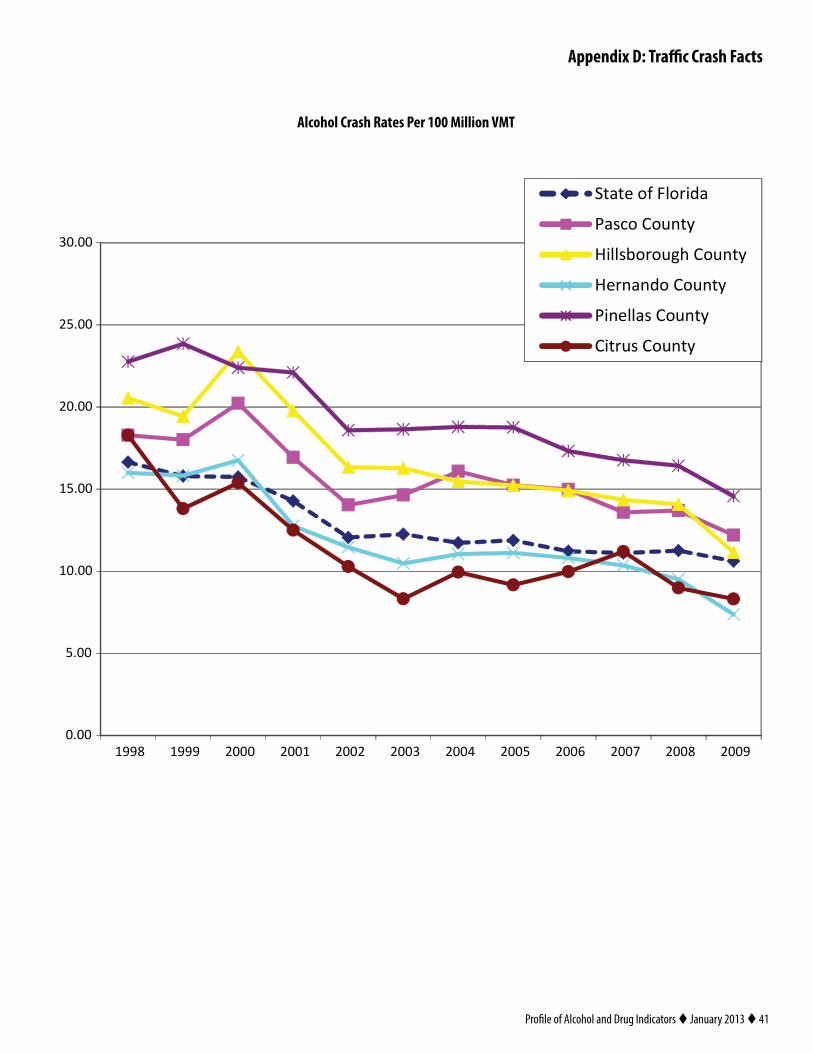
Profile of Alcohol and Drug Indicators t January 2013 t 41
Appendix D: Traffic Crash Facts
0.00
5.00
10.00
15.00
20.00
25.00
30.00
1998 1999 2000 2001 2002 2003 2004 2005 2006 2007 2008 2009
State of Florida
Pasco County
Hillsborough County
Hernando County
Pinellas County
Citrus County
Alcohol Crash Rates Per 100 Million VMT
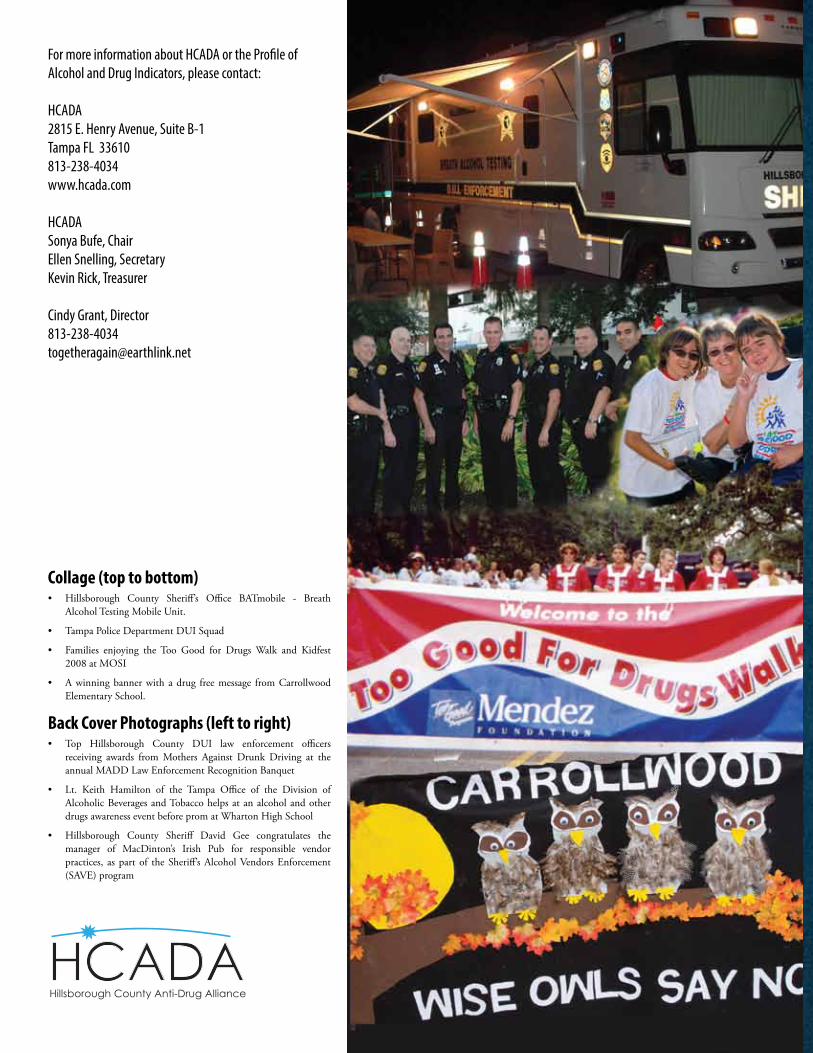
For more information about HCADA or the Profile of Alcohol and Drug Indicators, please contact:
HCADA2815 E. Henry Avenue, Suite B-1Tampa FL 33610813-238-4034www.hcada.com
HCADASonya Bufe, ChairEllen Snelling, SecretaryKevin Rick, Treasurer
Cindy Grant, [email protected]
HCADAHillsborough County Anti-Drug Alliance
Collage (top to bottom)• Hillsborough County Sheriff’s Office BATmobile - Breath
Alcohol Testing Mobile Unit.
• Tampa Police Department DUI Squad
• Families enjoying the Too Good for Drugs Walk and Kidfest 2008 at MOSI
• A winning banner with a drug free message from Carrollwood Elementary School.
Back Cover Photographs (left to right)• Top Hillsborough County DUI law enforcement officers
receiving awards from Mothers Against Drunk Driving at the annual MADD Law Enforcement Recognition Banquet
• Lt. Keith Hamilton of the Tampa Office of the Division of Alcoholic Beverages and Tobacco helps at an alcohol and other drugs awareness event before prom at Wharton High School
• Hillsborough County Sheriff David Gee congratulates the manager of MacDinton’s Irish Pub for responsible vendor practices, as part of the Sheriff’s Alcohol Vendors Enforcement (SAVE) program