productivity spillovers in the russian federation: the ... · international trade productivity...
TRANSCRIPT
Munich Personal RePEc Archive
Productivity Spillovers in the Russian
Federation: The Case of Chemical
Market
Kuzyaeva, Anastasia and Didenko, Alexander
September 2014
Online at https://mpra.ub.uni-muenchen.de/59349/
MPRA Paper No. 59349, posted 21 Oct 2014 07:37 UTC
Electronic copy available at: http://ssrn.com/abstract=2498833
Review of Business and Economics Studies Volume 2, Number 3, 2014
*
Anastasia kuzyAevA
International Finance Faculty, Financial University, Moscow
Alexander DiDenkO, Ph. D.
Deputy Dean, International Finance Faculty, Financial University, Moscow
Over the last decades, much attention has been drawn to the question of productivity variation
across countries. The differences in cross-country productivity could be explained by both foreign and domestic
be considered. Foreign direct investment (FDI) and international trade are suggested to be major conduits
of international technology transfer. The present paper aims to extend the current empirical literature by
determining the effect and the source of productivity spillover in Russia in case of chemical industry. In order
developed by Ericson and Pakes (1995) and Olley and Pakes (1996). The econometric model was tested on
the companies from chemical industry for the period 2007–2012. The empirical results show that FDI and
international trade productivity spillovers are present in Russian chemical industry. The size of FDI spillovers is
economically more important than imports-related spillovers. Based on the empirical results, we may predict
that Russia’s accession to the World Trade Organization in 2012 should result in productivity growth. However,
further research on this topic will be possible when the statistical data becomes available for several years after
accession.
Productivity spillover, FDI, trade liberalisation, Russia.
Electronic copy available at: http://ssrn.com/abstract=2498833
Review of Business and Economics Studies Volume 2, Number 3, 2014
the question of productivity variation across countries.
-
-
-
-
-
-
-
-
-
-
-
-
-
et al�,
-
-
’
firms’ characteristics or host countries’ -
-
-
-
-
-
-
et al�
-
-
allocations of resources away from the least productive
et al�
-
-
diates, skills and machinery investments. Evidence for
et al� -
associated with lower output tariffs. Moreover, they also
-
port-intensive downstream sectors. The overall evidence,
-
-
of research of productivity spillovers. The results of the
-
sideration accession of the Russian Federation to World
-
of productivity spillover in Russia in case of chemical
Review of Business and Economics Studies Volume 2, Number 3, 2014
industry. In order to achieve the stated aim and answer
-
-
-
sults. Finally, conclusions are made.
-
tivity level. Productivity spillovers diffusion is thus a
-
ers to domestic ones. As mentioned previously, there are
two main sources of productivity spillovers, namely FDI
-
and in access to international markets that allow them
-
-
-
-
-
-
as suppliers, consumers or competitors. On the other
-
-
tively affected, with a very small overall positive effect.
-
-
-
tions.
-
-
et al�
-
whereas cheaper imported inputs can raise productivity
-
imported varieties.
-
Review of Business and Economics Studies Volume 2, Number 3, 2014
-
-
zontal and vertical spillovers. On the one hand, technol-
-
-
earliest empirical industry-level analyses found posi-
’
et al�, -
policy implications. More recently, some cross-section-
-
-
’ pro-
et al
-
et al�
-
-
On the other hand, other studies have reported incon-
Most empirical studies have mainly focused on the
-
-
-
to local upstream firms. Positive horizontal spillover
-
-
of the market.
-
fect the productivity performance of domestic firms
-
-
ferent empirical studies have analyzed the correlation
-
et al�
conditional effects of intra-industry FDI spillovers on
-
Review of Business and Economics Studies Volume 2, Number 3, 2014
-
tion and skill level in the sector.
International trade is one of the primary avenues for
-
wide. This is particularly true and important for devel-
several mechanisms. Firstly, the competitive pressure
-
-
-
-
-
-
-
-
incentives when it reduces the plant’s market share. Fi-
reallocation of output to more productive plants, con-
-
concluded that there are no systematic differences
-
-
et al�
-
-
in their review of various studies conclude that there
-
-
alization than in the previous decade. A study conducted
-
-
trical machinery, non-electrical machinery, electronics
-
ment sector.
FDI and international trade on the host-country pro-
and discussion of the results, it is important to make
-
part of daily life in today’s world. There is hardly any
industry where chemicals are not used and there is no
Review of Business and Economics Studies Volume 2, Number 3, 2014
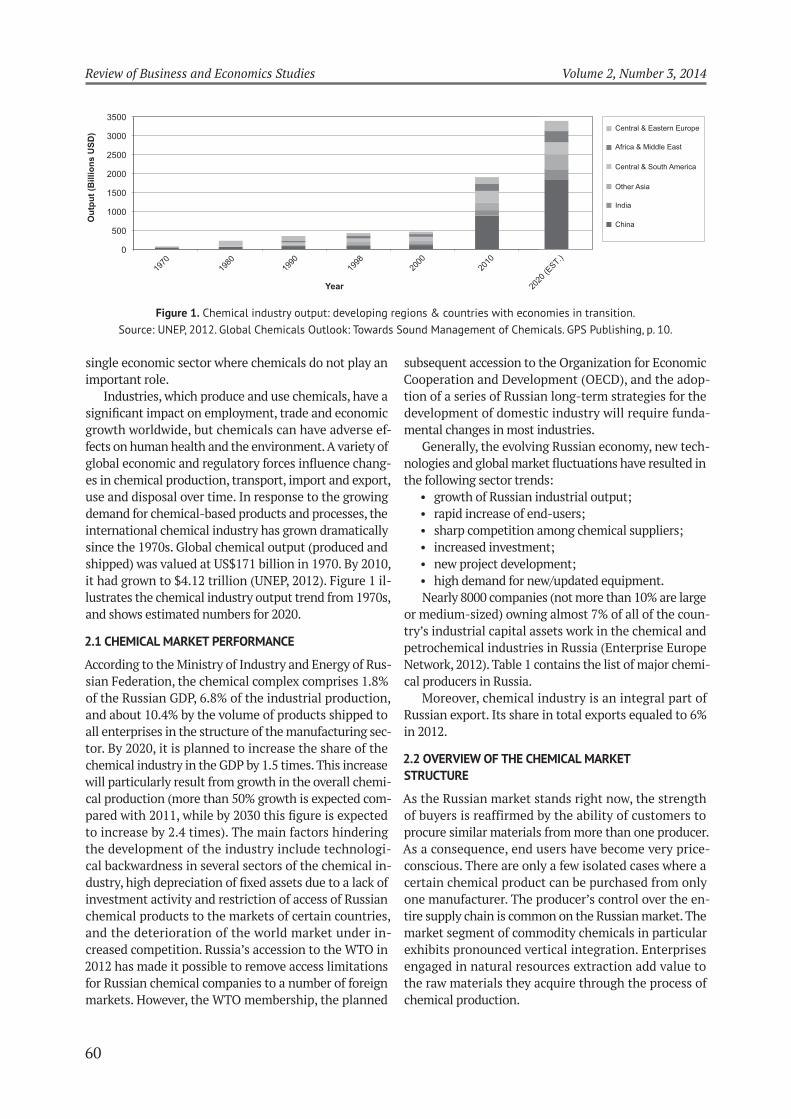
important role.
Industries, which produce and use chemicals, have a
-
fects on human health and the environment. A variety of
-
-
-
-
-
-
-
-
investment activity and restriction of access of Russian
chemical products to the markets of certain countries,
and the deterioration of the world market under in-
creased competition. Russia’s accession to the WTO in
-
development of domestic industry will require funda-
-
rapid increase of end-users;
increased investment;
new project development;
-
try’s industrial capital assets work in the chemical and
petrochemical industries in Russia (Enterprise Europe
-
cal producers in Russia.
procure similar materials from more than one producer.
conscious. There are only a few isolated cases where a
one manufacturer. The producer’s control over the en-
tire supply chain is common on the Russian market. The
chemical production.
0
500
1000
1500
2000
2500
3000
3500
Ou
tpu
t (B
illio
ns U
SD
)
Central & Eastern Europe
Africa & Middle East
Central & South America
Other Asia
India
China
1970
1980
1990
1998
2000
2010
2020
(EST.)
Year
Review of Business and Economics Studies Volume 2, Number 3, 2014
-
-
-
unlikely to occur, as consumers need to purchase prod-
pharmaceutical products, and chemicals for use in the
manufacturers of plastic products, pharmaceuticals,
consumer chemical manufacturers, as well as utility
-
tions with respect to key producers.
Chemical products are traditionally divided into two
-
composition. At the same time, in view of the myriad
-
versity of product application, in turn, can work to cur-
Specialty chemicals constitute one more set of chem-
icals industry products that have a diverse application
-
-
compound can do, not what chemicals it contains. The
versatility of application of specialty chemicals means
that these products are easy to sell, or to transform for
-
the producers enjoy.
The chemicals industry is heavily reliant on the oil and
-
centralized.
-
-
industry have chemical and petrochemical manufac-
chemical producers that do not have their own natural
The power of suppliers, on the other hand, is con-
strained due to the lack of differentiation in raw materi-
als supplies. The materials a particular chemical manu-
-
There also are chemicals that are not dependent on
then used to create other sodium compounds. Another
chemical producers to reduce output volumes. These
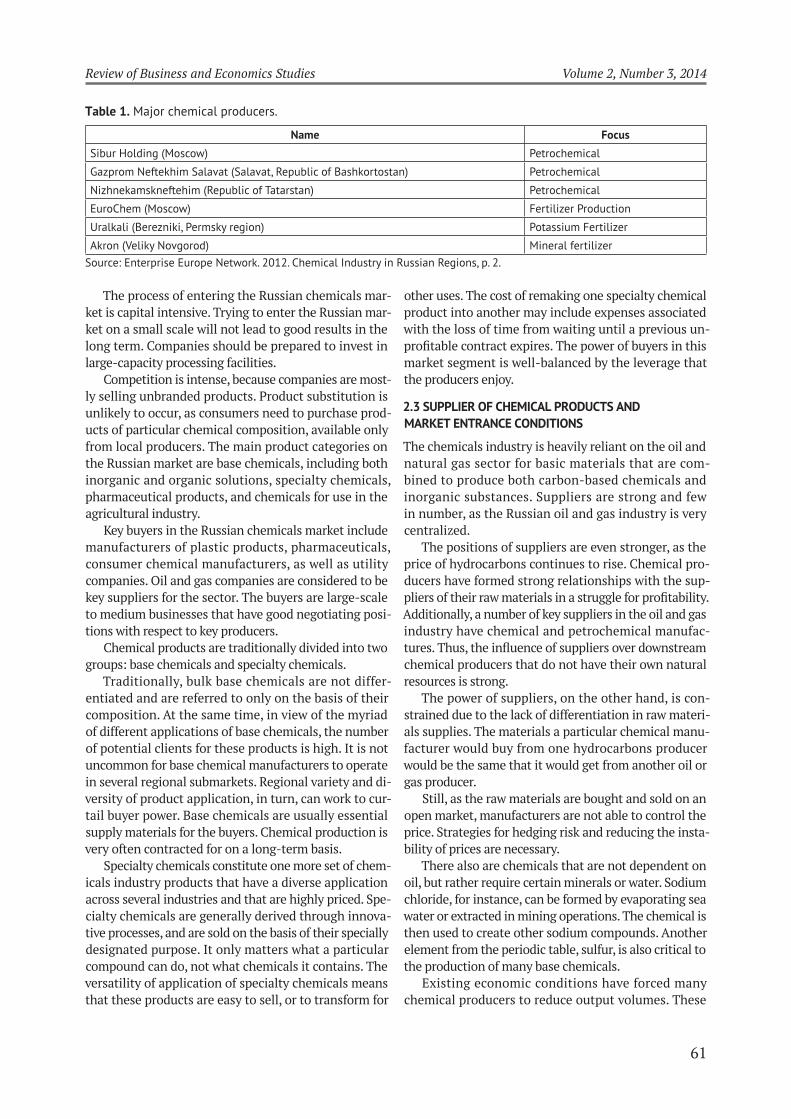
Major chemical producers.
Petrochemical
Petrochemical
Nizhnekamskneftehim (Republic of Tatarstan) Petrochemical
Fertilizer Production
Potassium Fertilizer
Akron (Veliky Novgorod) Mineral fertilizer
Review of Business and Economics Studies Volume 2, Number 3, 2014
-
terials.
While chemicals do have inherent value and may
-
intensity of investment and the size of most chemical
operations in Russia narrow the class of companies that
-
ket attractive. The products of the chemical industry are
producer. The processes and formulas used to manufac-
around for decades, in many cases without intellectual
property restrictions.
on the Russian chemicals market. Because producers
of chemicals sell commodities, it is not easy for market
investment. The dominant players on the Russian mar-
-
-
section.
terms of FDI and imports. Based on the previous research
These authors develop a framework for
-
timally choose sales and investment, as well as entry
-
-
-
y l m k uit l it m it k it it
0
where yit
it, m
it, and k
it
it,
parts,
uit it it
Consider the case when neither it and
it-
it it. The term
it
it
it is known
function of it
E u lit it
0 . If the term
it is constant over time,
-
approach.
-
-
with it than capital, then OLS will tend to overestimate
l and
underestimate k.
Review of Business and Economics Studies Volume 2, Number 3, 2014
it i
lead to consistent parameter estimates. But in our framework, it
-
it it allows us to
it, which is assumed to evolve ac-
of it
t.
-
t
realizations of it
it and k
it
-
it, whereas capital k
it
choice at time t. Provided that it t
for any kt.
t t t t
h i k ( , )
y l m i kt l t m t t t t t ,
with t t t k t t t t
i k k h i k, ( , ) 0
. Because t
t = h
t
l and
m on the
-
tion t
With consistent estimates of l and
m k,
that kt is uncorrelated with the innovation in
t,
t t t
1 or,
t is a random walk4
y l m k kt l t m t k t t k t t t
ˆ ˆ ˆ
1 1
where t1
t k tk
1 1 is an estimate of .
and
on a fourth-order polynomial
4 A random walk is a mathematical formalization of a path that consists of a succession of random steps.
Review of Business and Economics Studies Volume 2, Number 3, 2014
Pt
step is to estimate k
y l m k g k Pt l t m t k t t k t t t t
ˆ ˆ ˆ ˆ( , )
1 1
t k t
k
1 1 and P
t ; k is
then estimated non-linearly across all terms that contain it.
tfp y l m kit it l it m it k it ˆ ˆ ˆ ’ TFP, it is tfp
it-
itFI
it
tfp X IM FI eit it it it it '
1 2
where Xit' e
itIM
it , it FIit , and
Xit'
’ annual reports.
-
-
industry.
Y L K M FM IM FI Inv uit it it it it it it it it
0 1 2 3 4 5 6 7
uit
-
Review of Business and Economics Studies Volume 2, Number 3, 2014
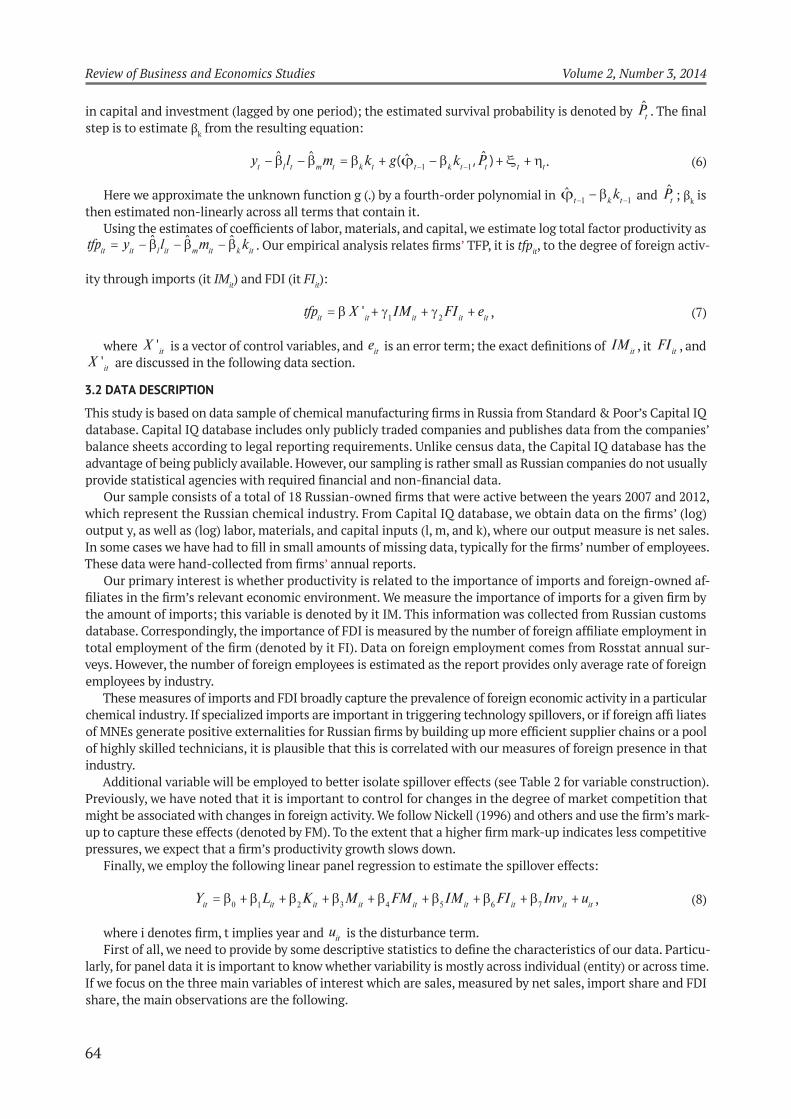
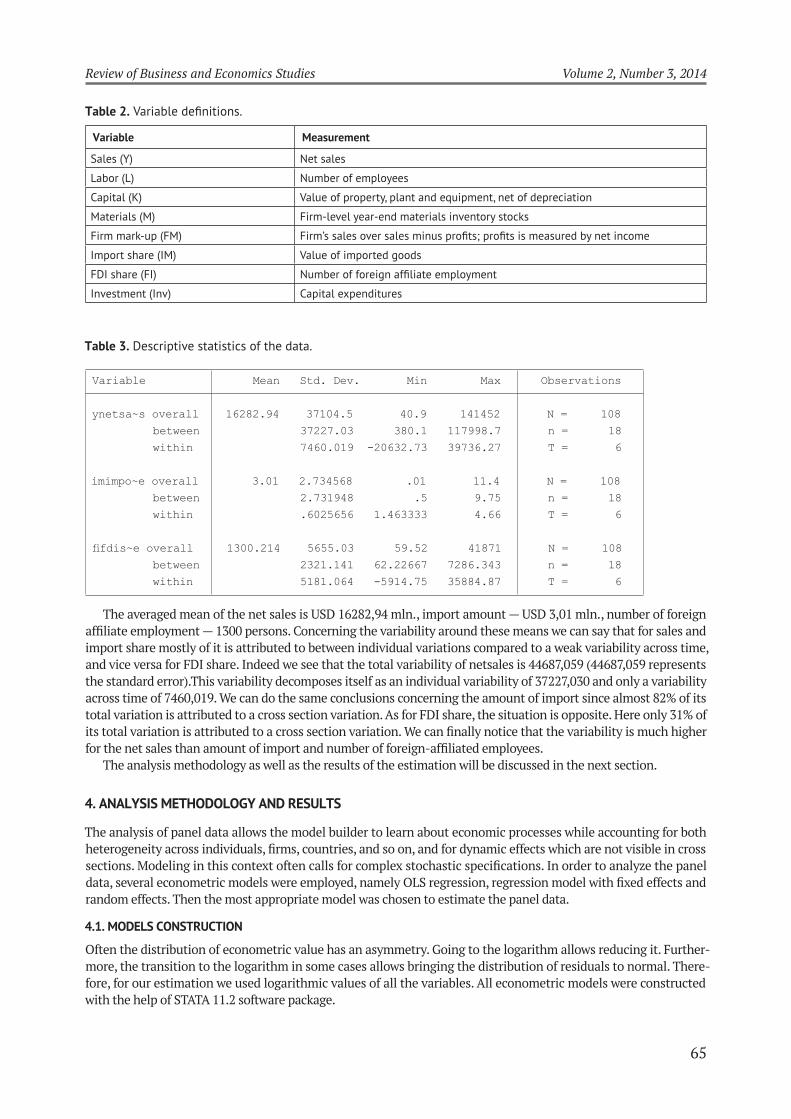
Descriptive statistics of the data.
Variable Mean Std. Dev. Min Max Observations
ynetsa~s overall 16282.94 37104.5 40.9 141452 N = 108
between 37227.03 380.1 117998.7 n = 18
within 7460.019 -20632.73 39736.27 T = 6
imimpo~e overall 3.01 2.734568 .01 11.4 N = 108
between 2.731948 .5 9.75 n = 18
within .6025656 1.463333 4.66 T = 6
between 2321.141 62.22667 7286.343 n = 18
within 5181.064 -5914.75 35884.87 T = 6
random effects. Then the most appropriate model was chosen to estimate the panel data.
-
-
Net sales
Number of employees
Value of property, plant and equipment, net of depreciation
Materials (M) Firm-level year-end materials inventory stocks
Firm mark-up (FM)
Import share (IM) Value of imported goods
FDI share (FI)
Investment (Inv)
Review of Business and Economics Studies Volume 2, Number 3, 2014
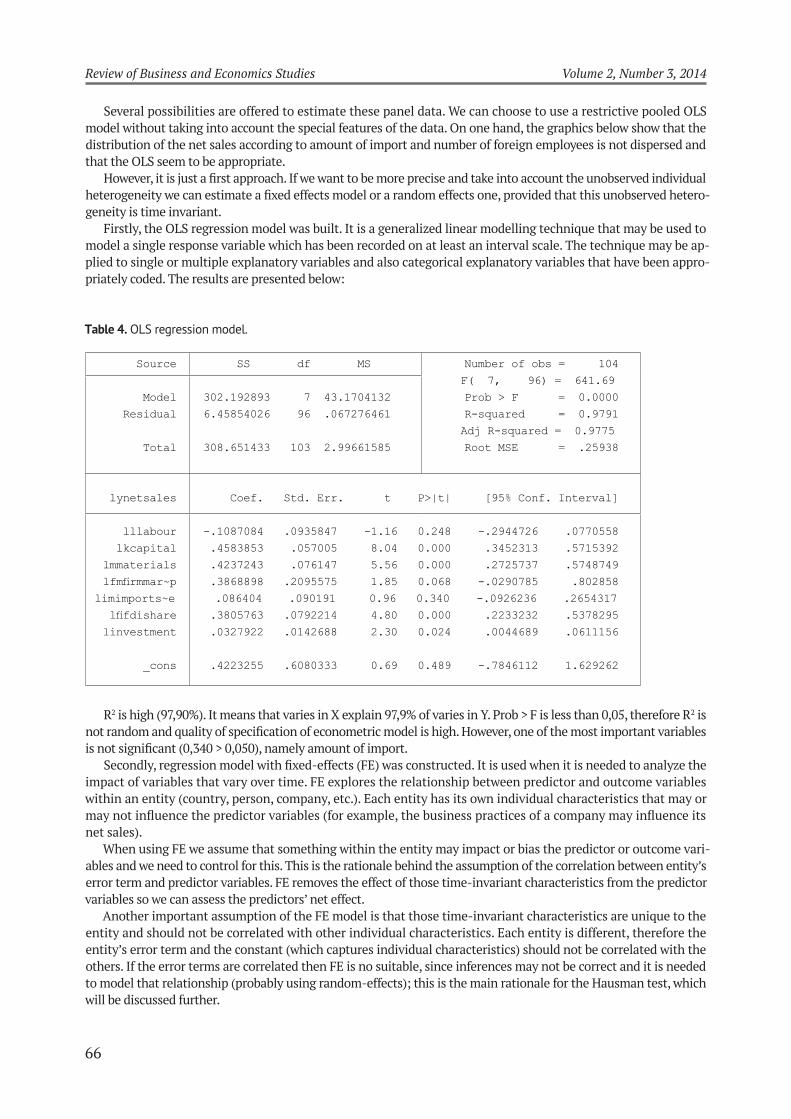
-
-
-
F( 7, 96) = 641.69
Model 302.192893 7 43.1704132 Prob > F = 0.0000
Residual 6.45854026 96 .067276461 R-squared = 0.9791
Adj R-squared = 0.9775
Total 308.651433 103 2.99661585 Root MSE = .25938
lllabour -.1087084 .0935847 -1.16 0.248 -.2944726 .0770558
lkcapital .4583853 .057005 8.04 0.000 .3452313 .5715392
lmmaterials .4237243 .076147 5.56 0.000 .2725737 .5748749
limimports~e .086404 .090191 0.96 0.340 -.0926236 .2654317
linvestment .0327922 .0142688 2.30 0.024 .0044689 .0611156
_cons .4223255 .6080333 0.69 0.489 -.7846112 1.629262
R is
-
Another important assumption of the FE model is that those time-invariant characteristics are unique to the
Review of Business and Economics Studies Volume 2, Number 3, 2014
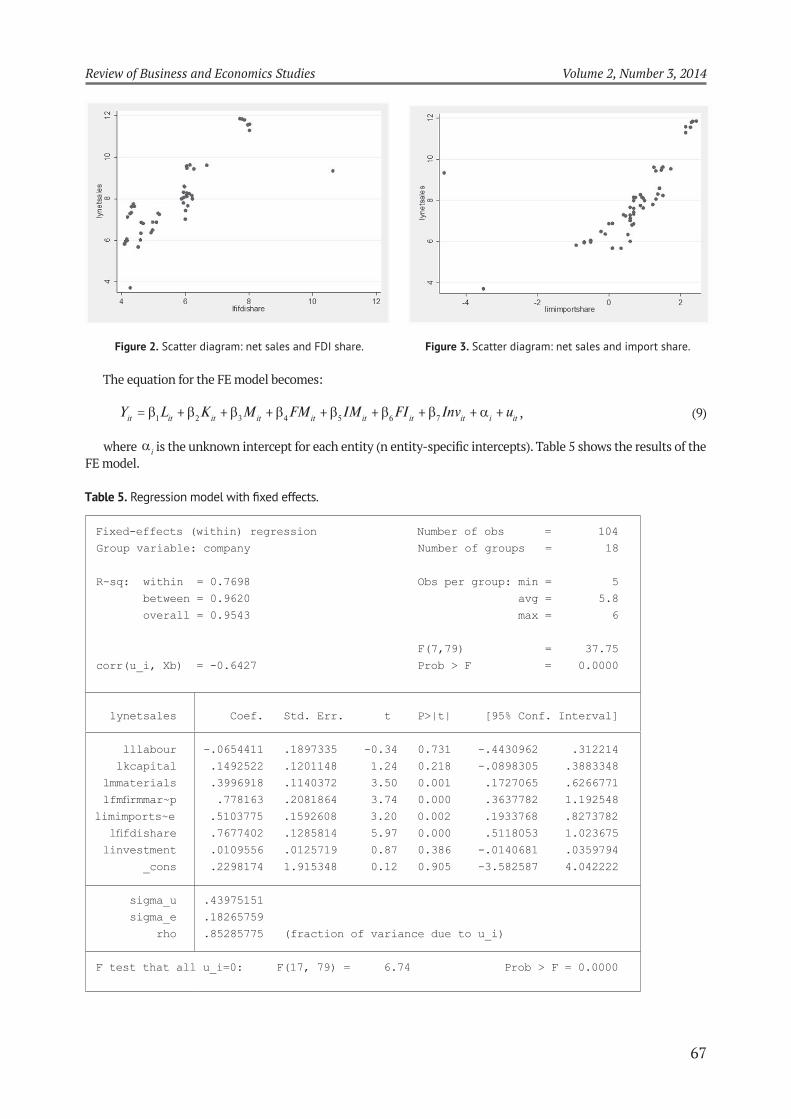
Y L K M FM IM FI Inv uit it it it it it it it i it
1 2 3 4 5 6 7
where i
FE model.
overall = 0.9543 max = 6
F(7,79) = 37.75
corr(u_i, Xb) = -0.6427 Prob > F = 0.0000
lllabour -.0654411 .1897335 -0.34 0.731 -.4430962 .312214
lkcapital .1492522 .1201148 1.24 0.218 -.0898305 .3883348
lmmaterials .3996918 .1140372 3.50 0.001 .1727065 .6266771
limimports~e .5103775 .1592608 3.20 0.002 .1933768 .8273782
linvestment .0109556 .0125719 0.87 0.386 -.0140681 .0359794
_cons .2298174 1.915348 0.12 0.905 -3.582587 4.042222
F test that all u_i=0: F(17, 79) = 6.74 Prob > F = 0.0000
Review of Business and Economics Studies Volume 2, Number 3, 2014
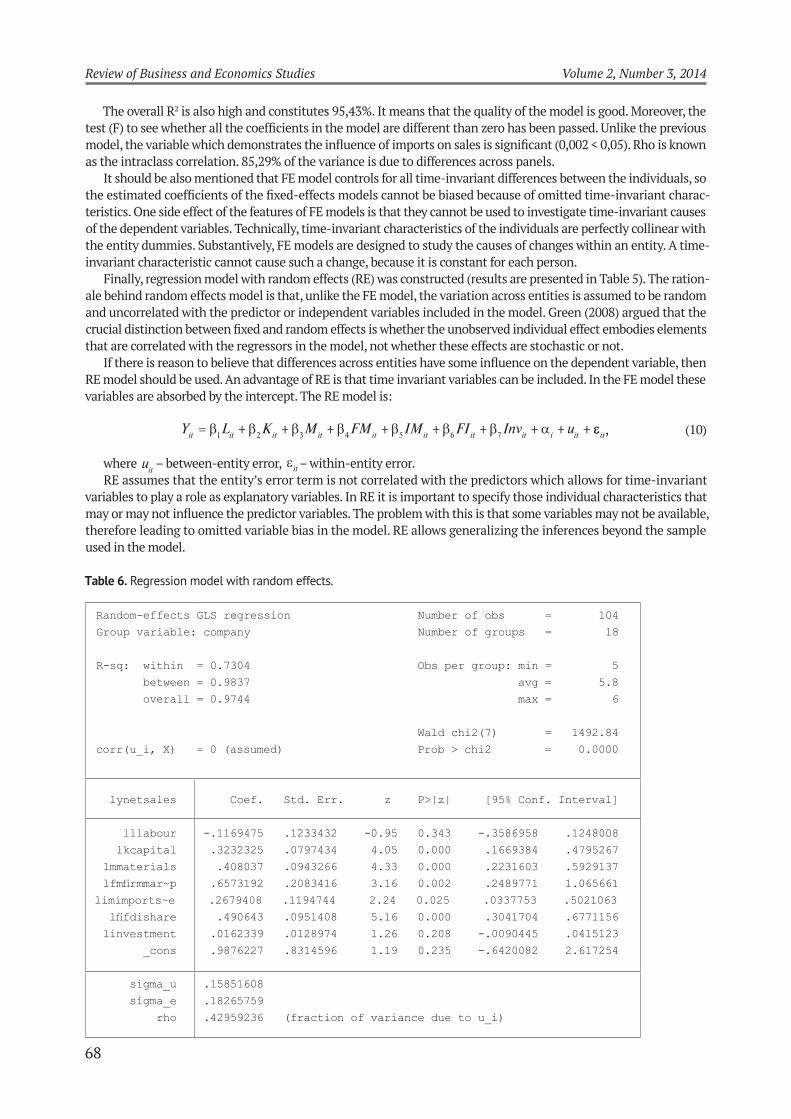
The overall R
-
-
Y L K M FM IM FI Inv uit it it it it it it it i it
1 2 3 4 5 6 7
it
where uit
it
RE assumes that the entity’s error term is not correlated with the predictors which allows for time-invariant
used in the model.
Regression model with random effects.
overall = 0.9744 max = 6
Wald chi2(7) = 1492.84
corr(u_i, X) = 0 (assumed) Prob > chi2 = 0.0000
lllabour -.1169475 .1233432 -0.95 0.343 -.3586958 .1248008
lkcapital .3232325 .0797434 4.05 0.000 .1669384 .4795267
lmmaterials .408037 .0943266 4.33 0.000 .2231603 .5929137
limimports~e .2679408 .1194744 2.24 0.025 .0337753 .5021063
linvestment .0162339 .0128974 1.26 0.208 -.0090445 .0415123
_cons .9876227 .8314596 1.19 0.235 -.6420082 2.617254
Review of Business and Economics Studies Volume 2, Number 3, 2014
The overall R
-
ferences across panels.
and international trade spillovers on Russian chemical market.
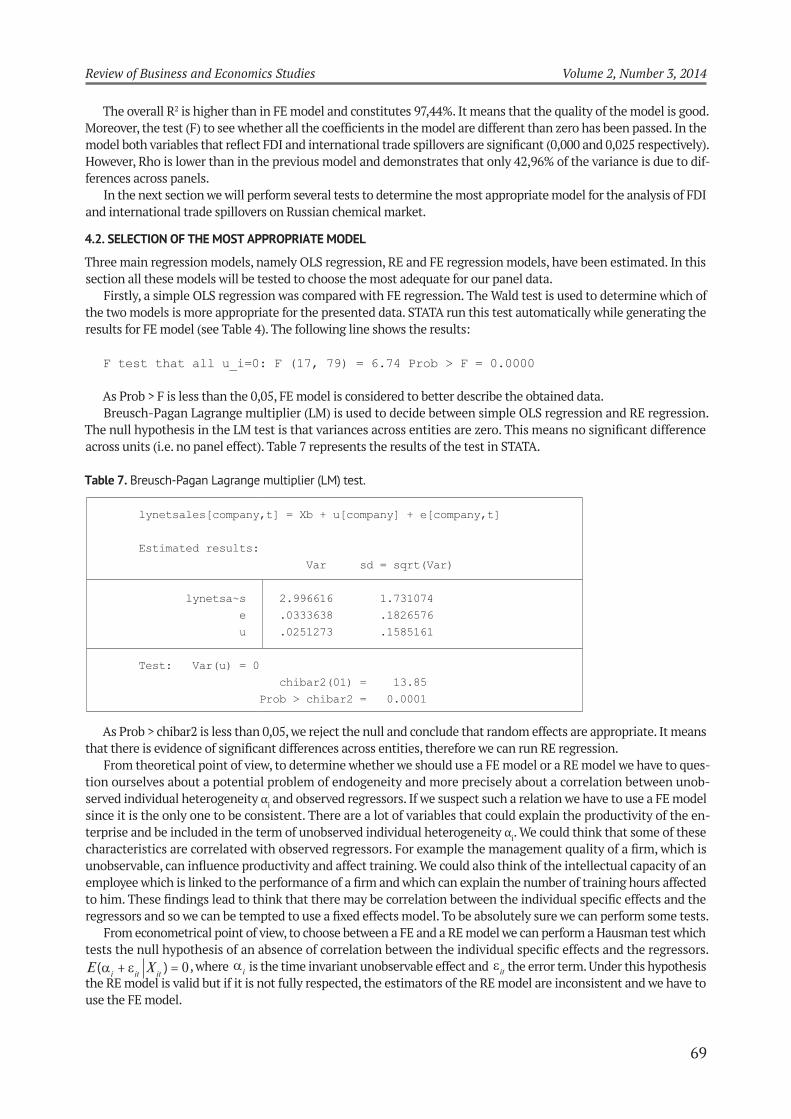
F test that all u_i=0: F (17, 79) = 6.74 Prob > F = 0.0000
Estimated results:
Var sd = sqrt(Var)
lynetsa~s 2.996616 1.731074
e .0333638 .1826576
u .0251273 .1585161
Test: Var(u) = 0
chibar2(01) = 13.85
Prob > chibar2 = 0.0001
From theoretical point of view, to determine whether we should use a FE model or a RE model we have to ques-
-
i
-
i. We could think that some of these
E Xi it it
( ) 0 , where i
itthe error term. Under this hypothesis
use the FE model.
Review of Business and Economics Studies Volume 2, Number 3, 2014
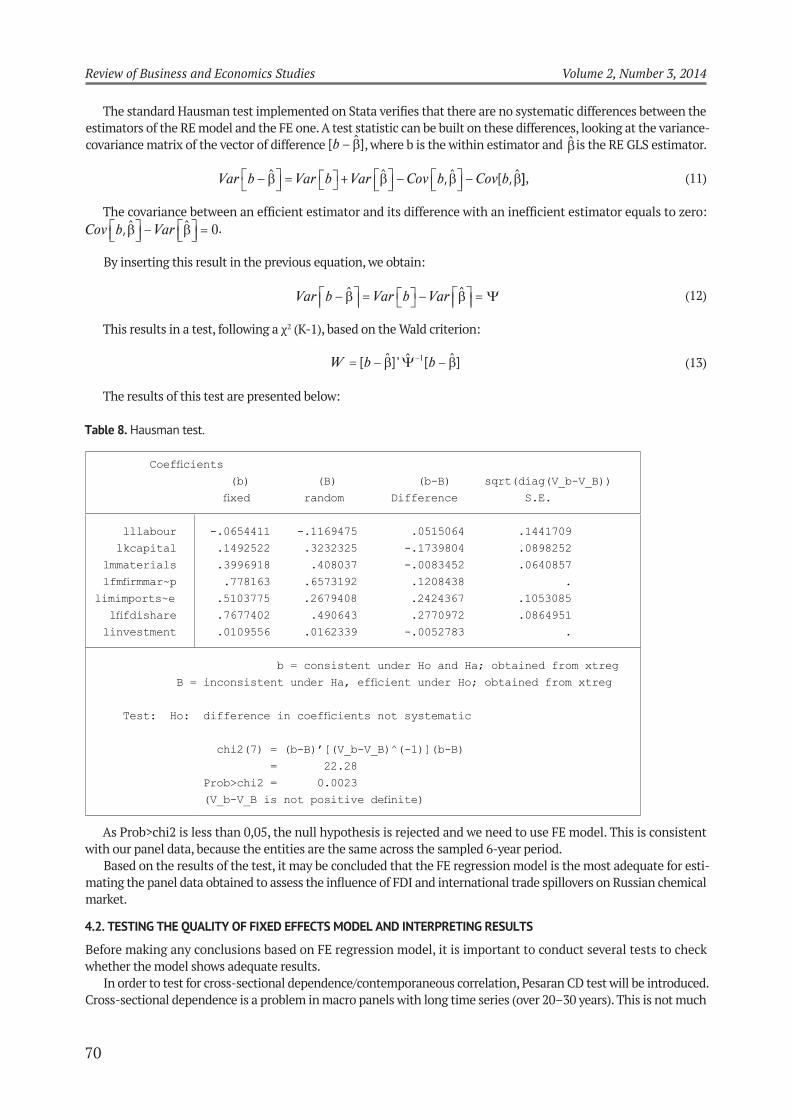
[ ]ˆb
Var b Var b Var Cov b Cov b
ˆ ˆ ˆ ˆ, [ , ]]
Cov b Var, ˆ ˆ
0.
Var b Var b Var
ˆ ˆ
W b b [ ]' [ ]ˆ ˆ ˆ 1
Hausman test.
lllabour -.0654411 -.1169475 .0515064 .1441709
lkcapital .1492522 .3232325 -.1739804 .0898252
lmmaterials .3996918 .408037 -.0083452 .0640857
limimports~e .5103775 .2679408 .2424367 .1053085
linvestment .0109556 .0162339 -.0052783 .
= 22.28
Prob>chi2 = 0.0023
-
market.
whether the model shows adequate results.
Review of Business and Economics Studies Volume 2, Number 3, 2014
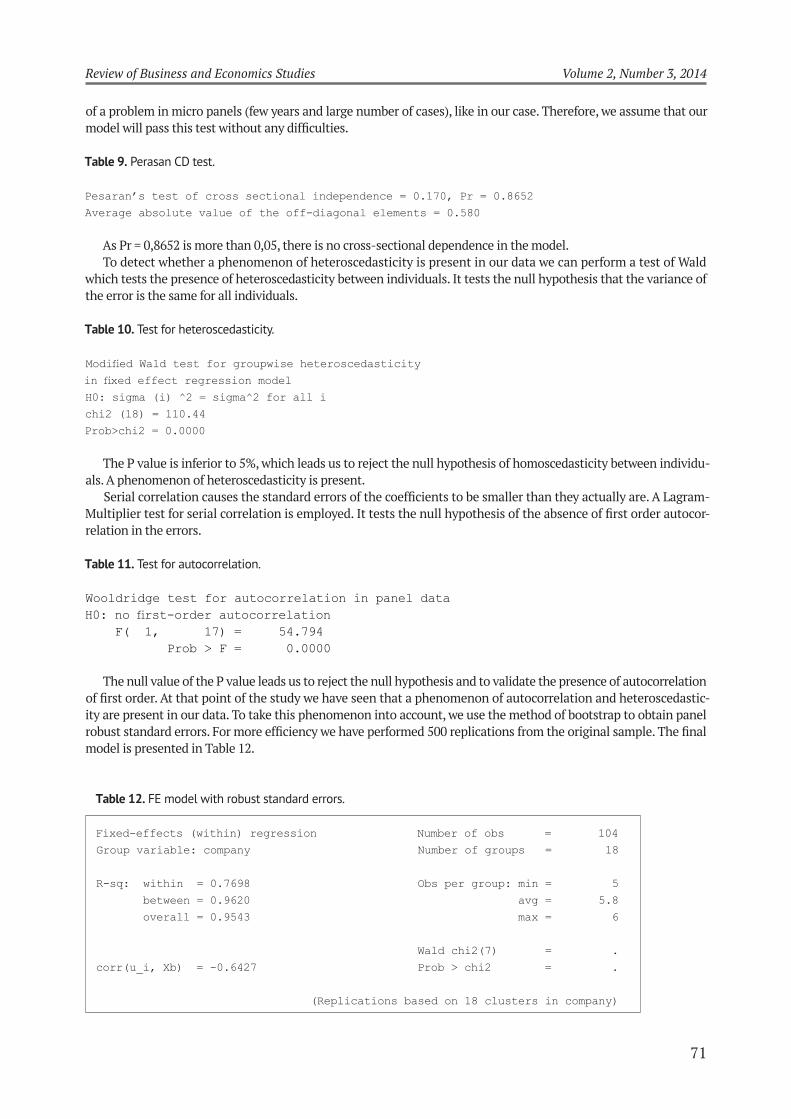
To detect whether a phenomenon of heteroscedasticity is present in our data we can perform a test of Wald
the error is the same for all individuals.
Test for heteroscedasticity.
chi2 (18) = 110.44
Prob>chi2 = 0.0000
-
als. A phenomenon of heteroscedasticity is present.
-
relation in the errors.
Test for autocorrelation.
F( 1, 17) = 54.794
Prob > F = 0.0000
The null value of the P value leads us to reject the null hypothesis and to validate the presence of autocorrelation
-
FE model with robust standard errors.
overall = 0.9543 max = 6
Wald chi2(7) = .
corr(u_i, Xb) = -0.6427 Prob > chi2 = .
(Replications based on 18 clusters in company)
Review of Business and Economics Studies Volume 2, Number 3, 2014
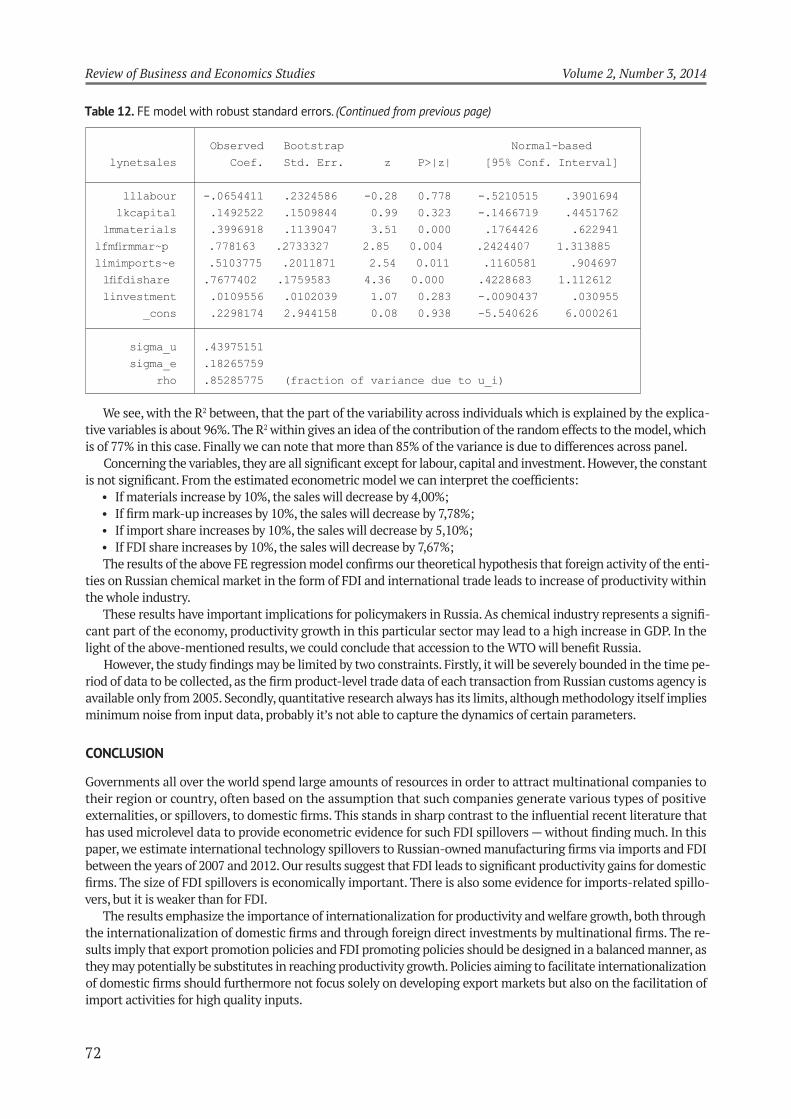
FE model with robust standard errors.
Observed Bootstrap Normal-based
lllabour -.0654411 .2324586 -0.28 0.778 -.5210515 .3901694
lkcapital .1492522 .1509844 0.99 0.323 -.1466719 .4451762
lmmaterials .3996918 .1139047 3.51 0.000 .1764426 .622941
limimports~e .5103775 .2011871 2.54 0.011 .1160581 .904697
linvestment .0109556 .0102039 1.07 0.283 -.0090437 .030955
_cons .2298174 2.944158 0.08 0.938 -5.540626 6.000261
We see, with the R -
-
ties on Russian chemical market in the form of FDI and international trade leads to increase of productivity within
the whole industry.
-
-
-
-
Review of Business and Economics Studies Volume 2, Number 3, 2014
-
Based on the empirical results, we may predict that
-
-
-
-
other issue is whether the literature so far has taken
’ en-
-
tors.
-
-
fare. Another important question, of course, is whether
the political-economic realities of local electoral com-
petition.
-
The American
Economic Review, 89
The American
Economic Review
-
Economic and
political weekly
Weltwirtschaftliches Archiv, 138
-
International Journal of the Eco-
nomics of Business, 12
-
World Development, 35
London
Routledge.
Economica, 41
World devel-
opment, 36
The economic journal
Journal of Econometrics, 46
-
Journal of Industrial
Organization, 22
Oxford Economic Papers
54
-
The World Bank Economic Review,
14
, 69
International Economic Review, 40
-
Review of Economic Studies, 62,
-
-
Journal of Development
Economics, 75
-
Journal of Inter-
national Economics, 71
The Quar-
terly Journal of Economics
74
Review of Business and Economics Studies Volume 2, Number 3, 2014
Scottish Journal of Political
Economy, 48
Review of Economics and Statistics, 57
Journal of Development Economics, 62
-
Journal of Pro-
ductivity Analysis, 6
-
The
World Bank Research Observer, 19
-
The economic journal, 111
The Scandinavian
journal of economics, 107
MA, March.
The Review of Economic Studies, 58
-
, 47
-
-
The American Economic Review, 94
-
Journal of
Development Economics, 87
American Economic Review, 92
-
Economic Research.
Journal of Devel-
opment Economics, 56
Journal of Development Economics, 80
-
The Review of Economic
Studies, 70
-
Econometrica, 71
Econometrica, 64, pp.
-
sterdam.
-
The Review of Economic
Studies, 69
Economic and Political Weekly,
-
Bank.
-
The Quarterly Journal of Economics, 106
Econometrica, 55
-
-
Journal of Development Studies, 44
-
The World Bank Research Observer, 23
Delhi.
Herald of the Rus-
sian Academy of Sciences, 83
-
Journal of International Economics, 31
European Economic Review, 48
European Economic Review, 38