productivity improvement and economic growth...1 productivity improvement and economic growth* koji...
TRANSCRIPT

Productivity Improvement and
Economic Growth
Koji Nakamura* [email protected]
Sohei Kaihatsu** [email protected]
Tomoyuki Yagi*** [email protected]
No.18-E-10 May 2018
Bank of Japan 2-1-1 Nihonbashi-Hongokucho, Chuo-ku, Tokyo 103-0021, Japan
* Research and Statistics Department (currently Matsumoto Branch)
*** Research and Statistics Department
*** Research and Statistics Department (currently Monetary Affairs Department)
Papers in the Bank of Japan Working Paper Series are circulated in order to stimulate discussion
and comments. Views expressed are those of authors and do not necessarily reflect those of
the Bank.
If you have any comment or question on the working paper series, please contact each author.
When making a copy or reproduction of the content for commercial purposes, please contact the
Public Relations Department ([email protected]) at the Bank in advance to request
permission. When making a copy or reproduction, the source, Bank of Japan Working Paper
Series, should explicitly be credited.
Bank of Japan Working Paper Series

1
Productivity Improvement and Economic Growth*
Koji Nakamura† Sohei Kaihatsu
‡ Tomoyuki Yagi
§
May 2018
Abstract
This paper summarizes recent discussion on labor productivity which is the source of
medium- to long-term economic growth and observes the characteristics of recent
productivity developments using relevant statistical data. Furthermore, the paper
examines the background of recent Japan's low labor productivity growth and analyzes
issues regarding Japan's sustainable growth.
Labor productivity in major advanced countries has been experiencing a
slowdown in recent years. This is mainly affected by the slowdown of Total Factor
Productivity (TFP). In Japan, there are two reasons behind the slowdown: first,
technology and ideas accumulated by research and development (R&D) and
management resources such as capital and labor are not utilized efficiently; and second,
these resources are not efficiently reallocated among corporations.
In order to improve Japan's productivity in the medium to long-term, it is
desirable to encourage the flexible reallocation of management resources such as capital
and labor by changing working process at the corporate level in accordance with
changes in the socio-economic environment and the advent of new technologies, as well
as by improving efficiency in the labor and capital markets.
JEL Classification: E20, O30, O47
Keywords: Productivity, Potential growth, Intangible assets, Resource reallocation
* We would like to thank Kosuke Aoki, Hibiki Ichiue, Seisaku Kameda, Ryo Kato, Nobuyuki
Kinoshita, Yoichi Matsubayashi, Toshitaka Sekine, Tomohiro Sugo, and Toshinao Yoshiba as well as
the staff of the Bank of Japan for their helpful comments. We also thank Wakako Kaku for assisting
the data compilation as well as Chikako Wakasa and Lisa Uemae for helping with English translation.
The opinions expressed here, as well as any remaining errors, are those of the authors and should not
be ascribed to the Bank of Japan. †
Research and Statistics Department (currently Matsumoto Branch), Bank of Japan (E-mail:
Research and Statistics Department, Bank of Japan (E-mail: [email protected]) §
Research and Statistics Department (currently Monetary Affairs Department), Bank of Japan
(E-mail: [email protected])

2
1. Introduction
Japan's rapid aging and shrinking population has and will continue to contribute to a
decrease in labor input and a slowdown in the economic growth rate. Based on these
demographics, in order to encourage Japan's sustainable growth, it is necessary to
increase the labor participation rate and labor productivity. In terms of the labor
participation rate, it is possible to raise the rate to a certain extent by enhancing
incentives for women and seniors to work, but there is a limit to any increase through
this method alone. Considering the limitations, labor productivity will play an essential
role for medium- to long-term growth in Japan.
This paper summarizes recent discussion on labor productivity and examines the
challenges of its sustainable improvement for medium- to long-term growth in Japan
based on empirical analysis. Specifically, we analyze several factors which affect the
sustainable growth of labor productivity after confirming that labor productivity has an
effect on the nation's medium- to long-term economic growth. Based on these factors,
we then examine the issues of sustainable growth at the Japanese company level, which
leads to issues at the national level.
We touch upon the relationship between the theme of this paper and discussions
of "secular stagnation," a phenomenon recently observed in advanced countries. It has
become clear that economic growth rates not only in Japan but also in many other
advanced countries are on downward trends, and there have been many discussions on
the causes of these trends (Chart 1).1 The series of discussions on secular stagnation
can be roughly divided into two streams, by focusing on either the demand-side or
supply-side. Summers (2013), providing a representative discussion on the demand-side,
insists that traditional monetary policy cannot provide economic stimulus sufficiently
facing the zero lower bound on nominal interest rates under the negative natural rate of
interest, and thus, as total demand continues to be below total supply, the economy falls
into secular stagnation. On the other hand, Gordon (2015), providing a representative
discussion on the supply-side, mentions that secular stagnation is caused by the lack of
innovative technologies which are the source of the economic growth. These arguments
are not exclusive, but rather interact with each other, each exerting a negative influence
on the national economy over differing time horizons. Labor productivity, as analyzed
in this paper, shows the concept of output efficiency and thus is directly related to
1 See, for example, Coen and Baldwin (2014) and Nakano and Kato (2017) who summarize the
discussions on secular stagnation.

3
Gordon's supply-side discussion. Meanwhile, the natural rate of interest which plays a
vital role for the demand-side discussion, under certain conditions, is the concept that
corresponds to a potential growth rate — the growth rate of potential GDP indicating
aggregate supply — hence discussions of both demand-side and supply-side are closely
tied to each other in the medium to long-run.2,3
From this perspective, any analysis of
changes in labor productivity and the determinants of its movement supplements the
series of discussions regarding secular stagnation over recent years.
The rest of the paper proceeds as follows. In Section 2, we observe the trends of
labor productivity and related indicators in each country. Section 3 gives an overview of
the arguments regarding the global slowdown in the growth rate of labor productivity. In
Section 4, we focus on Japan's labor productivity in recent years and examine the
background of its sluggishness. Section 5 is the conclusion.
2. Labor Productivity in Major Advanced Countries
Labor productivity provides a measure of the efficiency with which one unit of labor
input can produce goods and services and can be measured in various ways.4 It is
calculated by dividing output by total employment (head count), giving 'output per
worker,' and is also calculated by the total number of hours worked, giving 'output per
hour worked.' Recent growth rates in major advanced countries (Japan, the U.S.
Germany) — calculated with either of these measurements — have declined (Chart 2).
From the view point of producers, labor productivity is the measurement of value
created by one worker. In order to consider how much value is distributed to an
individual person, it is appropriate to use the value calculated by dividing output by
total population, output per capita. This gives the 'standard of living per person,' the
growth rates of which have declined in major advanced countries in recent years, in the
same trend as other labor productivity measures, as mentioned above (Chart 3). This
result is obvious since total population and the number of workers move almost
proportionally in the long-term.
2 See Oda and Muranaga (2003) for the relationship between natural rate of interest and potential
growth rate.
3 Aoki and Yoshikawa (2002, 2007) point out that demand and supply are closely associated as
demand will be in shortfall unless suppliers create new good or service successively, with a reason
that demand for an individual good or service eventually faces saturation.
4 Kameda (2009) conducts comprehensive analysis on Japan's productivity developments after the
2000s.

4
Real GDP expresses the total output of the nation and the growth rate of real GDP
can be decomposed into two determinants: labor productivity growth and changes in the
number of workers. According to this decomposition, the main reason for the recent
decline in growth rates of real GDP in Japan and Germany is the decrease in the growth
rate of labor productivity, while the impact of the number of workers are small (Chart 4).
The U.S. growth rate of output, in contrast, is affected by both labor productivity and
number of workers. While there are slight differences in the background of output
fluctuation in each country, this paper focuses on labor productivity which is the
common factor in major advanced countries.
The growth accounting framework is useful to analyze factors affecting the
growth rate of labor productivity. This growth accounting framework can be expressed
with the following simple equation. We assume the following production function in
macroeconomics considering capital and labor as production factors.
𝑌𝑡 = 𝐴𝑡𝐾𝑡𝑎𝐿𝑡
1−𝛼 (1)
where 𝑌𝑡, 𝐾𝑡 and 𝐿𝑡 are output (real GDP), capital input, and labor input, respectively.
𝐴𝑡 denotes the efficiency of capital and labor, namely total factor productivity (TFP).
𝛼 and 1 − 𝛼, which express the elasticity of output to capital input and labor input
respectively, are known to be equal to the capital share and labor share in the steady
state. This is called the "Cobb–Douglas production function," which is the most general
formularization of the production function in macroeconomics. This production function
expresses that the output of goods and services can be obtained from production activity
through the input of capital and labor, and at the same time implies that the TFP
captures the efficiency with which labor and capital are combined to generate output.
Taking the logarithm of both sides of the equation provides the following relationship:
𝑦𝑡 = 𝑎𝑡 + 𝛼𝑘𝑡 + (1 − 𝛼)𝑙𝑡
where 𝑦𝑡, 𝑎𝑡, 𝑘𝑡, 𝑙𝑡 show the logarithm of 𝑌𝑡, 𝐴𝑡, 𝐾𝑡, 𝐿𝑡, respectively, the difference of
which expresses growth rates. Setting ∆ as the difference of each variable, we arrive at
∆𝑦𝑡 (output growth rate of 𝑌𝑡) as follows:
∆𝑦𝑡 = ∆𝑎𝑡 + 𝛼∆𝑘𝑡 + (1 − 𝛼)∆𝑙𝑡 (2)
here labor productivity 𝐺𝑡 , output per labor input, can be written as follows:
𝐺𝑡=𝑌𝑡/𝐿𝑡
Taking the logarithm and differences of the above equation gives

5
∆𝑔𝑡 = ∆𝑦𝑡 − ∆𝑙𝑡 (3)
where 𝑔𝑡 is the logarithm of 𝐺𝑡.
Summarizing the relationship of the above equations, we arrive at the growth rate
of labor productivity ∆𝑔𝑡, as follows:
∆𝑔𝑡 = 𝛼(∆𝑘𝑡 − ∆𝑙𝑡) + ∆𝑎𝑡 (4)
here, (∆𝑘𝑡 − ∆𝑙𝑡) in the first term on right hand side of the above equation indicates
growth rate of 'capital input per worker (𝐾𝑡/𝐿𝑡),' namely the growth rate of the capital
equipment ratio. ∆𝑎𝑡 in the second term is the TFP growth rate.
As expressed above, using the growth accounting framework, the growth rate of
labor productivity can be decomposed into the growth rate of the capital equipment ratio
and of TFP. The capital equipment ratio indicates how much capital stock, such as
buildings, machinery, and software, are used for production activity per worker, and an
increase in this ratio is called capital deepening. While the capital equipment ratio
captures the change in relative relationship between capital and labor inputs that affects
labor productivity, the TFP captures the factor to affect output not attributable to the
inputs of capital and labor, and as discussed later, can be interpreted as innovation in a
broad sense.5
While the capital equipment ratio indicates how much capital is accumulated
relative to the number of workers, we should bear in mind that average levels of the
capital equipment ratio differ across industries. For example, the capital equipment ratio
in a capital-intensive industry, such as the steel industry, which needs large-scale
production facilities like blast furnaces, tends to be higher than that in the service
industry which is labor-intensive. Therefore, it is appropriate to compare industries of
differing capital intensity with TFP rather than with labor productivity, as TFP is not
affected by the capital equipment ratio.6 However, in the case of comparing national
levels' productivity in advanced countries with similar industrial structures, labor
productivity and TFP should generally show the same trend.
5 TFP based on more general production functions, such as the one including human capital as a
production factor, is obviously different from that based on the standard production function.
Through this paper, we assume the standard production function because it is difficult to measure
intangible capital such as human capital, and to determine how much this affects production.
6 TFP measured in this paper includes the business cycle component as changes in the utilization
rate of production factor and the effect of economies of scale are not taken into account. See Fueki
and Kawamoto (2009) for measuring the productivity by controlling business cycle factors.

6
It is important to note that the growth rate of the capital equipment ratio is
affected by TFP growth in the long-run. Theoretically, there is a balanced growth path
(∆𝑦𝑡 = ∆𝑘𝑡), where output and capital input grow at the same speed in a steady state. In
this steady state, the balanced growth path equation together with equation (2) provides
the following equation.
(∆𝑘𝑡 − ∆𝑙𝑡) = ∆𝑎𝑡/(1 − 𝛼) (5)
Equation (5) shows that the growth rate of the capital equipment ratio (∆𝑘𝑡 −
∆𝑙𝑡) depends on TFP growth ∆𝑎𝑡 in a steady state. Combining this equation with
equation (4) gives the following equation.
∆𝑔𝑡 = ∆𝑎𝑡/(1 − 𝛼) (6)
As shown in the above equation (6), labor productivity growth, ∆𝑔𝑡, is affected
by TFP growth, ∆𝑎𝑡, in a steady state. Note that equation (5) and (6) only hold in a
steady state and neither will hold in transition processes toward a steady state.
Chart 5 decomposes the growth rate of labor productivity which is actually
observed using the growth accounting framework. The chart shows that TFP has
contributed to the recent slowdown in labor productivity of major advanced countries
although the magnitudes vary by country.7 In Germany, the capital equipment ratio has
impacted on the slowdown in labor productivity as well as TFP growth to a certain
extent. As mentioned above, the growth rate of the capital equipment ratio is affected by
TFP growth in the long-run, and therefore the recent slowdown of capital equipment
ratio in Germany could reflect the deceleration of TFP growth.
To sum up, first, the growth rate of output at a national level can be explained
mainly by the growth rate of labor productivity, or the growth rate of the standard of
living per capita, while the impact of population factors such as the number of workers,
total population, or that of worked hours is relatively small. Second, the growth rate of
labor productivity in advanced countries has been declining in the medium- to long-run.
Third, stagnation of TFP has affected the recent slowdown in labor productivity in
advanced countries.
7 Measured TFP differs depending on the specifications of production function, and therefore the
capital equipment ratio and TFP measured in this paper are subject to a considerable margin of error.
See Kameda (2009) for the discussion on the measurement of labor productivity and TFP.

7
3. The Global Slowdown in Labor Productivity
As mentioned in Section 2, the stagnation of TFP is a main cause of the slowdown in
labor productivity in major advanced countries. This section examines the background
of the slowdown in the growth rate of TFP focusing on technological progress.
3.1 Has Technological Progress Stopped?
As explained in the framework of growth accounting above, TFP is a factor of output
growth neither explained by capital accumulation nor labor input. TFP can be thought of
as technological progresses (innovation), which affects economic growth, in a broad
sense.8 Innovation in this paper means not only the introduction of new technologies,
such as the invention of the internal combustion engine and electricity, but also business
improvements, such as new business models and the introduction of new schemes of
business. This section summarizes two discussions on the causes of the recent
slowdown in TFP in this broad sense via the technological stagnation hypothesis, as
proposed by economist Robert Gordon: Gordon's hypothesis that innovative technology
as the source of economic growth is no longer created in any way; and the critical
debates arguing against this hypothesis.
The Technological Stagnation Hypothesis
Cowen (2011) argues that the chance for innovation is now depleted, because "we ate all
the low-hanging fruit." Gordon (2012, 2016), taking the same position, insists that the
lack of innovative technology affecting the entire economy has led to the slowdown in
productivity. Long-term productivity growth was at its highest from the end of the 19th
to the late 20th
century, as production technologies and the living environment changed
dramatically as a result of the explosive spread of the internal combustion engine,
electricity, and new communication tools. This widespread creation of new technologies
triggered the supply system to expand total production. At the same time, demand for
new goods and services spread, resulting in the improvement of productivity and the
standard of living. However, Gordon concludes that by 2005, the positive impact of the
information and communication technology (ICT) revolution (the third industrial
revolution), which began in the late 20th
century, had almost been exhausted and its
contribution to productivity improvement since then has been limited. In addition, he is
pessimistic regarding future productivity improvement in the U.S. society citing the Six
8 As mentioned before, the growth rate of the capital equipment ratio depends on TFP growth in the
long-run.

8
Headwinds: a decline in educational standards; a decline in labor force population;
rising inequality; globalization (outsourcing to emerging nations with lower wages);
environmental issues; and household and government deficits.
Critical Debates against the Technological Stagnation Hypothesis
There are various arguments against Gordon's technological stagnation hypothesis.
Brynjolfsson and McAfee (2011, 2014) stress that ICT such as computers and the
internet are "General Purpose Technology (GPT)," in the same way as electricity and
the internal combustion engine, and their benefits extend not only to specific fields and
industries but across the entire economy. As Jorgenson (2001) points out, the expansion
of ICT investment enhances productivity in all industries, through labor savings and the
improvement of working efficiency, as they all use ICT. Fueki and Kawamoto (2009)
suggest that this GPT view can be applied to Japan as well as the U.S. as the utilization
of ICT has raised Japan's overall TFP growth since 2000 across the entire economy.
Brynjolfsson and McAfee also take an optimistic stance that growth will continue
into the future. They argue that the goods and services utilizing ICT such as
smartphones and GPS systems are generally easy to combine and tend to lead to new
innovations. Schumpeter (1926), in his celebrated book on the effect of corporate
activities on economic development, The Theory of Economic Development (Theorie
der wirtschaftlichen Entwicklung), argues that improvements occur by changing the
combinations of existing technologies and ideas, namely in new combinations.
According to these arguments, it is natural to think that innovation is increasingly likely
to be created with the improvement of ICT which makes it easier to combine existing
technologies.
Taking a look at efforts on the corporate side, a number of companies have
strategically increased their expenditure on ICT in order to create new business models.
Many companies in the U.S. particularly have appointed a chief information officer
(CIO) to develop their ICT strategy (Chart 6). There is also movement to create new
products and services utilizing ICT. Purdy and Daugherty (2016) imply that artificial
intelligence (AI) would change our way of working, and improve productivity and
economic growth. Moreover, it has also been pointed out that the technological progress
of ICT leads to the improvement of productivity in the medical and nursing care
industries, particularly in the fields of genetic analysis, treatment of intractable diseases,
practical skill improvements in regenerative medicine and through the introduction of
nursing care robots (e.g. Institute for International Socio-Economic Studies (2012) and

9
Himoro (2017)). The number of global patent applications — often used as an indicator
to measure technology level — is continuously increasing, a fact that seems inconsistent
with the technological stagnation hypothesis (Chart 7).
According to these arguments above, we can infer the following: the assertion of
Gordon et al., that productivity and economic growth have plateaued due to the limits of
innovation being reached, is unduly pessimistic considering that new innovations are
generated constantly nowadays in ICT and the medical industries. It cannot be denied
that recent upward impact of ICT on economic growth is smaller than that of the
industrial revolution, which originated with the invention of the internal combustion
engine and electricity during the 18th
and 19th
centuries. However, technological
innovation, mainly in ICT, will likely raise productivity and economic growth in the
future, as Brynjolfsson et al. claim.
3.2 Do Innovations Fail to Lead to Progress in Productivity?
If technological innovation as a source of economic growth has not come to an end,
why has recent labor productivity experienced a slowdown in the major advanced
countries? In this section, we examine the possibility that innovation has not necessarily
led to the improvement of productivity in an efficient way; in other words, from the
perspective of intangible assets and the reallocation of resources, new technologies have
been created but not utilized.
The Role of Intangible Assets
Reforming ways of working and organizations of companies is necessary in order to
utilize new technologies which are combined with existing technology and ideas. As
Gordon points out, the invention of steam power improved productivity in factories
significantly. Productivity would have not have been improved, however, if manpower
was simply replaced with steam power, because the factory layout was optimized for
manual labor. It is said that productivity improved dramatically after the factory layout
was changed completely to function together with the mechanical properties of steam
power and when workers became accustomed to the new labor environment. This
episode shows that, in order to utilize tangible assets such as the steam engine and the
production facilities driven by the engine, it is necessary to efficiently combine tangible
assets with enhancements in the skill of workers.9 There are other factors that enable
9 Allen (2009) points out that a new technology will lead to improvement in productivity only when
there is an environment where such a new technology can create economic profit.

10
the efficient use of tangible assets, such as, (1) the ways of working and the
organizations of companies which facilitates the utilization of management resources
such as capital and labor; (2) the technical skills of the labor; and (3) ideas and
technologies developed by R&D. These are all examples of 'intangible assets.' An
intangible asset is an asset that is not physical in nature and includes the following:
intellectual property such as patents and trademarks; human capital such as the skill and
ability of labor; and corporate property such as business culture and models.10
Intangible assets enhance corporate performance, as complementing investment into
tangible assets such as production facilities and computers as well as labor input, and
then an increase in intangible assets leads to an increase in TFP.
Common sense tells us that it takes considerable time to change ways of working
drastically through changes in the socio-economic environment or technological
innovation. In other words, it takes a long time to accumulate the intangible assets
which would contribute to improving productivity. In fact, Brynjolfsson et al. show that
it took thirty years to reorganize factories in accordance with the Second Industrial
Revolution which introduced electric power. While new systems utilizing ICT for
inventory control and e-commerce have been developed after the ICT revolution, ICT
introduction alone will not improve productivity if companies simply stick to the same
way of business prior to its introduction. If recent technological innovation represented
by ICT has not improved productivity, it is because factors such as ways of working, the
organizations of companies and the skills of the labor have not adapted to the
technological innovation sufficiently.
The Role of Resource Reallocation
Another reason that productivity improvement has not been achieved through
innovation is that the potential of innovation cannot be fully taken up because of the
insufficient reallocation of management resources such as capital and labor. Aggregate
TFP should be enhanced by the market entry of companies with high technology or
advanced business models, or by the market exit of companies whose productivity
declines because of technology obsolescence (e.g. Baily et al. (1992) and Forster et al.
(2001)). However, in the case where there is inadequate reallocation of management
resources, the rise in TFP and labor productivity is limited. An inefficient financial
intermediation function in the banking sector and financial markets prevents capital
flow and new investment. Moreover, labor mobility is hindered in a rigid labor market
10
Corrado, et al. (2005, 2009) present the seminal work on the definition of intangible capital.

11
and workers are fixed at low productivity companies, thus preventing companies from
creating innovative technology and business models for growth.
Furthermore, interest groups who are afraid of the loss of vested rights through
intensified competition and changes in the socio-economic environment, namely rent
seekers, increase political pressure and as a result, technological innovation leading to
productivity increases are limited as the reallocation of resources is prevented. For
example, if a regulation preventing the new market entry of companies remains even
after the essential roles of the regulation come to end, the reallocation of resources
through the turnover of enterprises cannot occur. In any case, innovation cannot
improve productivity if certain factors, which limit new efforts of companies and
workers, remain in factor markets.
4. Reasons for the Decline in Japan's Productivity
This section focuses on Japan and examines reasons for its decline in productivity based
on relevant statistical data and empirical studies. As pointed out in previous sections,
slowdown in TFP growth rate is the main reason for the decline in productivity growth
in Japan and hence we focus on TFP movements (Chart 5). The previous section
demonstrated the following: the importance of innovation for productivity
improvement; the importance of changes in ways of working, in organizations of
companies and labor skills in parallel with innovation; and the importance of the
flexible reallocation of management resources such as capital and labor. Based on these
points, how should we evaluate Japan's productivity? Here we examine the productivity
of individual firms in addition to that of the macro level as discussed in Section 2 in
order to deepen the discussion of Japan's productivity.
4.1 Distribution of Firm's Productivity
First, we measure the productivity of individual firms using data of listed manufacturing
companies in OECD countries.11
Using individual firm data at a micro level allows
analysis of the cross-sectional heterogeneity of individual firms, which cannot be
examined with the macro level data.12
Following Andrews et al. (2015) and Berlingieri
11
Note that TFP is used as a concept of productivity, unless otherwise noted (for the calculation
details see Appendix). As discussed in Section 2, to compare the productivity between different
capital intensity firms it is desirable to evaluate by TFP excluding the effect of capital equipment
ratio.
12 Kameda and Takagawa (2003) also provide an analysis using firm-level data. They compare the
company distribution of ROAs in Japan with those in the U.S. using a histogram and conclude that

12
et al. (2017), we define the companies in OECD countries with the top 5% of
productivity, as 'frontier firms'. Frontier firms achieving high productivity from a global
standpoint can be viewed as relatively superior firms in terms of their utilization
efficiency of capital and labor. This section focuses on the differences between Japanese
and the U.S. companies through the comparison of frontier firms.13
Taking a look at the average TFP in the sample period, though obvious from their
definition, the productivity of frontier firms is the highest, and productivity of Japanese
companies is lower than that of the U.S. companies on average (left-hand side of Chart
8).14
The distribution of firm productivity varies considerably and is flatter for the U.S.
(right-hand side of Chart 8). While the share of low productivity companies (left tail of
the distribution) in the U.S. is higher than that of Japan, frontier firms or those with
similar productivity (right tail of the distribution) are fueling all of the U.S.'s
productivity. On the other hand, the tail of Japan's distributions is narrow showing that
many companies are concentrated around the average level of productivity. This means
that while there are few companies with extremely low productivity, there are also few
companies which raise the aggregate productivity.
Second, we focus on time-series variations of average productivity for frontier
and other companies in each country. After the productivity of frontier firms increased
significantly from 2000 to 2006 compared with the average productivity in advanced
countries, it has plateaued since 2007 (left-hand side of Chart 9). With this setting as the
frontier firms' benchmark, the deviation of average productivity in each country
expanded from this benchmark from 2000 to 2006 (right-hand side of Chart 9). Whereas
this productivity disparity between the frontier firms and the U.S. companies has shrunk
since 2006, when the productivity of frontier firms began to slowdown, the productivity
Japanese companies are concentrated around the average profit rate, and Japan's company
distribution has a smaller standard deviation and remarkably larger kurtosis. Furthermore, the profit
ratios have a shorter tail distribution for deficit, which means there are few companies with
significantly bad profitability.
13 The properties of frontier firms in this paper are as follows: the majority of frontier firms are from
the U.S. and followed by the Japanese firms. About seven percent of the total U.S. companies are
categorized as frontier firms and so are about four percent of the total Japanese companies. GE
(2016) points out that the U.S. and Japanese companies are mainly creating innovations in the world.
By industry, about half of the frontier firms are in the electric appliance industry. Many frontier
electric appliance companies are thought to be engaged in further upgrading their efficient
production system by, for example, outsourcing some of their production operations. In terms of
company size, the sales volume of frontier firms is significantly large compared with those of the
total population. The ages of frontier firms are significantly young compared with those of the total
population.
14 In our samples, the average of lnTFP is 0.13 and the standard deviation is 0.94.

13
disparity between the frontier firms and the Japanese companies has not shrunk. In other
words, while the U.S. companies on average have been able to follow frontier firms,
Japanese firms have pulled away from the frontier firms and have not be able to close
the gap.
Now, we calculate deviations from the frontier firms in terms of productivity in
Japan and the U.S. of the following three groups: the top 5%, the middle 90%; and the
bottom 5%, respectively (Chart 10). The top 5% companies in both Japan and the U.S.
do not greatly deviate from the frontier firms. This means that the top 5% companies in
both Japan and the U.S. are mostly included in the frontier firms. Regarding the bottom
5% firms, on the contrary, although both Japanese and the U.S. companies have distance
from the frontier firms in common, the distance of the U.S. companies is larger than that
of the Japanese companies. This is consistent with the fact that distribution of the U.S.
firm productivity has a wider variance and is flatter as we showed in the right-hand side
of Chart 8. We see significant differences between Japan and the U.S. across the middle
90% companies. While the productivity of the middle 90% in Japan is close to that of
the bottom 5%, it is inversed in the U.S., i.e., the middle is close to the top 5%. The
productivity disparity between Japan and the U.S. on average seems to reflect the
difference of the middle 90%.
With the above discussion in mind, characteristics regarding Japan's productivity
can be summarized as follows. Although some Japanese companies have achieved high
productivity from a global standpoint, low productivity companies account for a large
percentage as a whole and the nation's productivity at the macro level is left behind the
productivity of the U.S. The following sections discuss the cause of low productivity in
many Japanese companies in terms of intangible assets and reallocation of resources as
introduced in the previous section.
4.2 Japan's Productivity and Intangible Assets
As discussed in Section 3, in order to utilize the technological progress leading to
productivity growth, it is necessary to combine accumulated technologies and ideas
appropriately mainly through R&D and to change working styles and organizations of
companies. This section examines Japan's productivity from the perspective of
companies' intangible assets.
It is difficult to measure intangible assets due to considerable constraints on data
availability except for some items such as R&D expenditure and software investment.
In this section, we try to compare intangible assets in Japan and the U.S. based on the

14
results of Corrado et al. (2012) and Fukao et al. (2009) in their comprehensive
measurements of intangible assets in advanced countries under certain assumptions.
Although nominal intangible investment against nominal GDP both in Japan and the
U.S. tends to increase, the pace in Japan is significantly lower than that of the U.S.
(Chart 11). This result implies that Japan's productivity growth has slowed down
because there has not been sufficient investment in software, human and organizational
capital, though it is necessary to consider this from a wider perspective due to
differences in definition of data regarding industry structure and intangible assets.
Let us turn to the R&D expenditure which is a breakdown item of intangible
assets. As Romer (1990) points out, R&D activity is one of the main factors affecting
productivity.15
Taking a look at the ratio of R&D expenditure to nominal GDP, Japan is
higher than other advanced countries (Chart 12). An increase in R&D expenditure
should encourage the discovery of new technologies or the development of applied
technologies and also allow the exploitation of new areas of demand or the
enhancement of efficiency in the production process. Therefore, governments often
target R&D expenditure to GDP ratio and provide financial support with the
understanding that expanding R&D expenditure is important so as to advance a nation's
growth (Japan sets the target at least 4%16
, and the U.S. and Europe at 3%17
). Japan
especially has a large share of global patents which can be viewed as the achievement of
R&D investment (Chart 13).
Does R&D lead to higher productivity growth? Taking a look at the relationship
between TFP and the ratio of R&D expenditure to sales at the individual company level,
the more U.S. companies spend on R&D expenditure, the bigger their productivity
growth is. However, such an obvious relationship between R&D and productivity
growth cannot be observed in Japan (Chart 14), implying that Japan's R&D does not
enhance productivity growth. The reasons for this can be thought of as follows: first,
although Japanese companies spend a lot on R&D expenditure, this does not necessarily
15
R&D expenditure which is a type of intangible asset has been treated as capital stock since the
2008 SNA (System of National Accounts) in the same way as software investment. However, data
analyzed in this paper are based on 1993 SNA and are not treated as capital stock.
16 The Japanese government set the targets in the 5th Science and Technology Basic Plan (FY2016
to FY2020, endorsed by a Cabinet Decision in 2016) as combined public and private sector R&D
investment of at least 4% of GDP (government R&D investment of at least 1% of GDP).
17 The target used here for the U.S. is drawn from President Obama's R&D budget, and the one for
Europe is decided by the European Commission (in a survey of the Japan Science and Technology
Agency).

15
lead to the development of products which appropriately meet consumers' needs18
;
second, R&D in Japan tends to be oriented toward gradual improvement rather than
creating innovative products (Chart 15); third, Japanese firms adhere to internal R&D,
and do not cooperate on technological innovation with other companies and universities
as well as do not utilize open source (Chart 16).19
Regarding the third point, in contrast
to firms in other advanced countries, Japanese companies seldom raise funds from
abroad or from the government (Chart 17). In addition, technologies and ideas which
have not been commercialized are often left to gather dust and are not utilized in other
institutions, another reason for the inefficiency of R&D in Japan (Chart 18).
Next, we examine intangible asset in detail; the investment in human capital,
which has strong ties to the skill level of labor. Considering the difference in company
stances on investment in human capital in Japan, non-manufacturing companies
continuously make relatively less investment (Chart 19). Moreover, the ratio of
on-the-job training is higher than off-the-job formal training in Japan (Chart 20). It is
likely that productivity has not improved due to the insufficient skill accumulation of
labor, mainly in nonmanufacturing sector, although this is not always the case as the
appropriate training differs according to industry and type of occupation. Furthermore,
Kato and Naganuma (2013) point out that the main reasons for stagnation in human
capital investments were (1) a reduction in off-the-job training expenditure of firms
during the recent recession periods and (2) less internal training opportunities for
employees on the premise of simultaneous hiring of new graduates and the life-time
employment system, along with a declining trend of the 'regular worker' share especially
in manufacturing sector.
4.3 Japan's Productivity and Capital Reallocation
This section discusses the possibility of slowdown in the productivity growth of
Japanese companies due to inappropriate reallocation of management resources such as
capital and labor. The productivity growth of companies which cannot sufficiently adapt
18
For example, Otsuka (2010) adduces an oft-cited reason for Japan's declining R&D efficiency as
"Japanese high-function devices, which have developed to stellar standards but in such an
idiosyncratic way, are referred to with a touch of mockery as 'Galapagos-ized'. Even though these
products may possess competitiveness in the Japanese market, they do not fit the needs of general
consumers in overseas markets."
19 The Japanese government mentions in the report of Basic Concept of Japan Revitalization
Strategy 2016, "the keys to realizing the fourth industrial revolution are open innovation and human
resources. Under the difficulties of foreseeing future new technologies, it is clear that there is a
limit for a company which makes products only by its own technology."
16
to demand change or cannot guard against skill obsolescence is likely to decline in the
medium to long-term. Where the resources in these companies are not appropriately
reallocated to companies which can achieve high productivity growth with new
technologies and ideas, the result is a decline in the average aggregate productivity. This
section focuses on the differences in productivity growth of individual firms and
examines the influence of resource reallocation based on Hogen et al. (2017).
Analyzing the influence of the entry and exit of publicly listed companies using
firm-level data for Japan and the U.S. as well as employing the Dynamic Olley-Pakes
decomposition proposed by Melitz and Polanec (2015), Hogen et al. (2017) decompose
labor productivity into three factors: surviving firms, entrants and exiters (Chart 21).
The surviving firms factor is defined as a factor of the productivity change of firms
publicly listed before the previous period. While the entry factor is defined as a factor of
the productivity change of firms publicly listed in the previous period, and the exit
factor as a factor of the productivity change of firms left the market in the current period.
This chart shows that labor productivity growth at the macro level, i.e., on the GDP base,
can mostly be captured by aggregating the change in productivity of publicly listed
individual firms. Although the trends in productivity growth rate in both of Japan and
the U.S. are mainly driven by the surviving firm factor, factors of entry and exit also
exert a considerable effect on productivity growth at the macro level.20
Taking a closer
look at this chart indicates the following three points.
First, the contribution of entrants to the growth rate of productivity in the U.S. is
bigger on the whole than that of Japan. This is caused by the number of new entries in
Japan and the U.S. As is widely known, the entry rate of companies in Japan is lower
than that of the U.S. (Chart 22). According to the number of publicly listed firms in
Japan and the U.S., while firms which have been listed since the 1990s in the U.S. have
considerable presence in the market, those from before the 1980s account for the
majority in Japan (Chart 23). The fact that there are fewer new entry firms in Japan than
abroad can be attributed to the extremely low levels of entrepreneurship and animal
spirits, the fear of failure and low status given to successful entrepreneurs (Chart 24).
20
Empirical studies show that the contribution of specific large-scale companies to the national's
productivity growth is considerable. For example, Lewis (2004) finds that in the second half the
1990s, Wal-Mart accounted for 4% of the productivity jump in the U.S.. Many studies provide
analyses that this is because utilization of ICT contributes to productivity improvement (e.g. Doms
(2004)). Gabaix (2011) states that the sales of the top 50 firms accounts for 24% of GDP in the U.S..
Canals et al. (2007) conduct an analysis and find that the top 10 Japanese firms account for around
30% of total Japanese exports.
17
One reason behind these negative attitudes may be the fact that little consideration has
been given to enhancing entrepreneurial mind and skills in the Japanese education
system to date (Chart 25). In addition, financial barriers may form other obstacles to
undertaking entrepreneurial activities in Japan. People have limited experience from
their education in how to raise the necessary funds for start-ups and there are few
experienced entrepreneurs in the Japanese market who can act as role models (Chart
26).
Second, low productivity firms are likely to exit from the U.S. market at an early
stage. As shown in Chart 21, exiter firms in the U.S. have a negative contribution,
meaning they have a higher productivity with positive values than that of surviving
firms.21
Firms with positive productivity exit from the stock market because it is those
firms that tend to become the target of M&A, and they opt for a smooth exit from the
stock market before deterioration in sales and profits as well as productivity
deteriorating below that of surviving firms. The figures in Chart 27 show survival rates
of low productivity firms over time in Japan and the U.S. Accordingly, survival rates of
low productivity firms in both countries decreases as time elapses (i.e., they either exit
from the market or improve their productivity), especially in the U.S., where it declines
quickly. This may be because firms in the U.S. tend to exit from the market or improve
business management quickly due to pressure from shareholders such as financial
institutions and institutional investors when their productivities are on the decline. On
the other hand, in Japan, even though a firm's earnings or productivity may be
deteriorating, financial institutions continue to support the business for a time and allow
them to remain in the market, and the business conditions of the firm could deteriorate
further.
Inactive exit behavior of firms means that capital and labor is fixed in firms with
low productivity growth. In this case, aggregate productivity growth slows down in the
medium to long-term due to insufficient reallocation of resources into new entrants. In
the case of the U.S. as shown in Chart 21, although exiters have a negative impact on
labor productivity at the point of exit, there is a positive effect on productivity at the
macro level if capital and labor is reallocated from exiters to surviving firms and new
entrants with high productivity growth.
21
In the analysis of Hogen et al. (2017), firms which are listed in year t-1 and exits from the market
in year t, are calculated by taking the change in their productivity weighted by their sales. Therefore,
if firms with positive (negative) productivity exit the market, the factor of exiters is calculated as
negative (positive) value, if the sales in year t is not zero.

18
Third, growth rates in the productivity of surviving firms in the U.S. are generally
higher than those of Japan, and surviving firms in Japan have had a downward pressure
on macro level growth rate of productivity in recent years. The age of surviving firms is
generally higher in Japan than that of the U.S., reflecting the inactive entry and exit of
firms (Chart 23). Note that productivity growth of new entrants is higher and tends to
decline with age (Chart 28). Newly established firms are thought to have new
technologies and ideas as a source of productivity improvement, and firms with a longer
history are more likely to find it difficult to adjust their ways of working and their
organizations to respond to the emergence of new technology and changes in demand.
As discussed in the previous sections, this is one of the reasons that Japanese companies
cannot utilize intangible assets effectively. It can also be presumed that the contribution
of surviving firms to the productivity growth is small in Japan — as firms which would
have been exited from the market under the U.S. circumstances and environment —
remain as survivors. Aside from this, in a corporate acquisition of a high productivity
company, while exit of the target company would contribute to a decrease in aggregate
productivity, the productivity of the acquirer (the surviving firm) improves. The
difference between the two countries is due to much fewer M&As taking place in Japan
than in the U.S. (Chart 29).
As has been discussed, productivity growth of Japanese companies has been
sluggish compared to that of U.S. firms; one reason behind this may be that entry and
exit are not conducted as smoothly depending on the profitability and productivity of
firms, resulting in the inefficient allocation of management resources such as capital and
labor. The inactive entry and exit of firms in Japan results in a higher age of surviving
firms, which may lead to an acceleration of sluggishness in productivity growth.
It has been pointed out that the German legal framework prompts the entry and
exit of firms (Kinoshita (2014)). In Germany, when corporate managers continue to
operate firms knowing that the firms have a negative capital position, they can be
prosecuted in criminal or civil action. Therefore, firms must be dissolved or acquired by
other firms when their corporate managers become aware of the possibility of negative
capital and are unable to raise additional capital. Due to this pressure from the legal
framework, low productivity firms are forced to exit from market, and capital and labor
are reallocated to more productive firms. In addition, the European Commission
prompts member countries to amend legislation so that firms facing financial and
business difficulties can start to restructure their businesses promptly (European
Commission (2014)).

19
4.4 Labor Market, Financial and Capital Market, and Productivity
Based on the discussion above, the following issues are important to enhance
productivity at the macro level in Japan: enabling the ease of entry into the market for
firms with potentially high productivity; encouraging firms with low productivity to exit
the market and reallocating capital and labor to those with high productivity smoothly;
and improving the productivity of surviving firms. Next, we focus on the labor market
and financial/capital markets and consider the optimal policy settings and systems to
achieve sustainable growth of Japanese companies and the economy.
Labor Market and Productivity
Here we examine the influence of the labor market on productivity. This paper focuses
on 'labor market flexibility' which expresses the extent of labor mobility for
re-employment via unemployment, and is one of the indexes of labor market's structural
conditions.22
Taking a look at the relationship between labor market flexibility and the
growth rate of productivity in OECD countries, there is a tendency that higher rates of
productivity growth are observed in the countries with higher labor market flexibility
(Chart 30). Whereas both labor market flexibility and the productivity growth rate of the
U.S. are high, the situation in Japan is completely opposite, that is, both indexes are low.
Based on the relationship of entry and exit discussed in Section 4.3, this can be
interpreted as follows. Companies with declining profits and productivity are driven
into exit or bankruptcy, and employees of those companies are let go, ending up
unemployed. However, when labor market flexibility is sufficiently high, it is possible
that these unemployed workers are then employed by high productivity firms or
establish their own business. This leads to an improvement of aggregate productivity at
the macro level.23
On the other hand, when labor market flexibility is low, long-term
unemployment tends to linger and continues to hurt human capital, and low productivity
businesses tend to be operated in such a way as to avoid letting employees go. These
factors could slow down productivity in the medium to long-term at the macro-level.
Facing a low flexibility in the labor market, a company might be more averse to taking
the risk of implementing a new business plan. The company which finds a good
22
Labor mobility is measured by the ratio of the sum of flows in and out of short-term
unemployment (unemployed less than one month) for population aged 15-64.
23 It is highly possible that average productivity at the macro-level declines in the case of a shift in
industrial structure when employees move from high productivity industries to low productivity
industries. Fukao and Kim (2008) analyze Japan's productivity and find that the impact of the shift in
industrial structure to TFP is smaller than changes in TFP of individual enterprises and offices. Hsieh
and Klenow (2017) also point out the same issue exists in the U.S..

20
opportunity for a new business may not invest and expand its number of employees
because the company fears that it cannot promptly exit from the business even after the
business failure is revealed. This could be one reason that the productivity of Japanese
companies tends to concentrate around zero (Chart 8).
Case studies of Sweden are often cited when discussing the relationship between
labor market and productivity growth. Yamada (2016) explains the importance of
enhancing flexibility in the labor market, a key feature of the labor market in that
country, by emphasizing that the labor force shifts smoothly from sectors with low
productivity to those with high productivity due to income compensation and enhanced
vocational training for employees. Letting employees go, on the other hand, is relatively
easy for companies, and this point also lead to improve flexibility in the labor market.
It has been said that high productivity of Japanese companies were attributable to
several intrinsic factors such as stable labor-management relations, the system of
lifetime employment and the seniority-based wage system (e.g. Abegglen (1958) and
Koike (1991, 1994)). Recent studies, however, question the effectiveness of lifetime
employment and the seniority-based wage system because they may hinder labor
mobility, meaning workers do not have a chance to demonstrate their potential
productivity (e.g. Yanagawa (2009)). Why has the assessment of these same systems
changed over just a few decades? Yamada (2016) concludes that lifetime employment
and the seniority-based wage system functioned effectively for the training of human
capital, the succession of industry-specific techniques and the development of loyalty to
firms during the era of high economic growth. The system worked very well while the
population was on the increase and when there was a clear target for the individual
standard of living and the technological level of society in the era. However, by the time
the era ended and the economy had matured, it was clear that Japanese companies had
been forced to set the direction of technological development and the target of
technology level by themselves without referring to other countries as a benchmark.
Moreover, Japanese companies now have to face the shrinking domestic market as the
population declines. It is therefore possible that the well-functioning employment
practices and systems of the high growth era have depressed productivity recently.
Aoki et al. (2017) examine the reasons for lower productivity in Japan compared
to that of the U.S. based on an endogenous growth model focusing on the distance to the
U.S. as the world technology frontier. They find that Japan could not switch its path
from being a catch-up regime — where companies enhanced productivity by copying
the innovative technology of the U.S. firms — to an innovation regime — where

21
companies grow productivity through their own R&D activities — and thus Japan fell
into a "low productivity trap" (Chart 31). On that basis, for Japan to return to a
growth-maximizing path they advocate for firms to choose an appropriate innovation
strategy and for the government to implement structural reforms in order to enhance
labor mobility.
Financial/Capital Markets and Productivity
In addition to labor, capital is also an important input factor. As has been discussed, if
inefficiency in the financial and capital markets is high, firms with potentially high
productivity cannot meet their financial needs and as a result both capital accumulation
and TFP are slowed down. Productivity growth at the macro-level will increase if
capital reallocation proceeds effectively and the sales share of profitable and productive
firms increase.
However, in Japan, it has been pointed out that capital is not always reallocated to
high productivity firms or industries smoothly due to a firm's stance or government
policy which attempts to restrict employment adjustments and bankruptcies in order to
secure job security (e.g. Ohtake (2000)24
). This could result in the protection of low
productivity firms and low productivity could spread across the whole market.
Nakajima et al. (2016) point out two mechanisms where the deterioration of the
financial intermediation function leads to the stagnation of productivity growth based on
the previous studies in recent advanced countries. First, insufficient financial regulation
before the Financial Crisis in 2008 and large scale financial accommodation after the
Crisis lowered the costs of funding for financial institutions and investors, lowering
incentives for the thorough examinations of loans and credits, and as a result hindering
credit provisions for productive investments. Second, the deterioration of financial
institutions' balance sheet quality after the Crisis caused a decrease in loan provision,
leading to a reduction of firms' capital expenditures and the decrease in capital
equipment ratios of firms. However, there is no consensus on how much these factors
affected productivity growth from a quantitative standpoint.
Nakajima et al. (2016) introduce several empirical analyses which illustrate that
the deterioration of the financial intermediary function put downward pressure on
24
Ohtake (2000) points out that if employment adjustment subsidies have tended to be provided to
industries facing the highest rates of job loss, namely those structurally depressed industries, the
speed of employment adjustment may be slow and appropriate inter-sectorial labor allocation could
be also distorted in Japan.

22
productivity growth due to the accumulation of inefficient capital formation. Levine and
Warusawitharana (2014) point out the possibility that productivity growth at the
macro-level decreased because severe financial situation caused by the Financial Crisis
prevents the implementation of risky projects that may have had the potential to create
significant profits. Ferrando and Ruggieri (2015) find that the restrictions on fundraising
tend to reduce labor productivity and such tendencies are observed more severely in
small and medium sized firms rather than in large firms based on empirical analysis
using the euro area data set. Sekine et al. (2003) and Caballero et al. (2008) examine
Japan's financial crisis and point out that one of the reasons for slowdown of
productivity growth since 1990s is inefficient capital allocation due to the malfunction
of the financial market and financial intermediaries. This is a problem of forbearance
lending and zombie firms.
5. Conclusion
This paper summarizes recent discussion on labor productivity as the source of
medium- to long-term economic growth and observed the current situation using
relevant statistical data. Furthermore, we examined the background of Japan's low labor
productivity growth in recent years and analyzed issues for Japan's sustainable growth.
Labor productivity in major advanced countries has decelerated over recent years.
Using the growth accounting framework to decompose, we find that this is affected
mainly by a slowdown in TFP.
One reason for the slowdown in TFP — which can be thought of as innovation in
a broad sense — is explained by the technological stagnation hypothesis which
attributes the slowdown to a lack of innovative technology creation as a source of
economic growth. However, considering that technological innovation is constantly
being generated nowadays in ICT and the medical industries, this may be unduly
pessimistic. When it is taken into consideration that technological innovation as a
source of economic growth has not petered out, the main reason that it has not led to
productivity growth can be attributed to issues related to intangible assets and resource
reallocation.
An 'intangible asset' is a general concept which includes ways of working in order
to utilize management resources such as capital and labor, the labor force's skills and
intellectual property accumulated by R&D. Intangible assets investment is thought to
enhance corporate performance and productivity growth by complementing both

23
tangible assets such as production facilities and labor input. In order to lead
technological innovation to productivity improvement, intangible assets investment is
necessary so that corporate organizations and working processes change flexibly in
accordance with the emergence of new technologies. Japan's productivity has recently
decelerated because there may not have been sufficient investment in these intangible
assets. Moreover, Japanese firms adhere to internal R&D and do not cooperate across
companies and this has also contributed to a slowdown in R&D efficiency.
The productivity of companies which cannot sufficiently adapt to the change in
demand structure or cannot guard against skill obsolescence is likely to decline in the
medium to long-term. If the management resources of these companies are not
appropriately reallocated to companies with high productivity growth, the aggregate
productivity growth at the macro level declines. A slowdown of productivity growth in
Japan is likely to reflect inactive entry and exit of firms, resulting in inefficient
reallocation of management resources such as capital and labor.
As has been discussed, in order to enhance Japan's productivity in the medium- to
long-term, reallocation of management resources by improving the efficiency of the
labor market as well as financial markets should be reinforced, allowing the effective
use and accumulation of intangible assets. Note that various systems and business
customs in the labor and financial markets as well as in firms are mutually dependent.
Aoki (2001) points out the possibility that inefficient systems tend to be robust and
long-lasting even under rapid environmental changes if systems and business customs
are mutually dependent. In order to improve productivity, we need to change those
systems and business customs as a whole in a consistent manner.

24
References
Abegglen, J. C. (1958), The Japanese Factory: Aspects of Its Social Organization, The
Free Press.
Allen, R. C. (2009), The British Industrial Revolution in Global Perspective, Cambridge
University Press.
Andrews, D., C. Criscuolo, and P. N. Gal (2015), "Frontier Firms, Technology Diffusion
and Public Policy: Micro Evidence from OECD Countries," OECD
Productivity Working Papers, No. 2.
Aoki, K., N. Hara, and M. Koga (2017), "Structural Reforms, Innovation and Economic
Growth," Bank of Japan Working Paper Series, No. 17-E-2.
Aoki, M. (2001), Toward a Comparative Institutional Analysis, The MIT Press.
Aoki, M. and H. Yoshikawa (2002), "Demand Saturation-Creation and Economic
Growth," Journal of Economic Behavior & Organization, Vol. 48. pp.
127-154.
――― and ――― (2007), Reconstructing Macroeconomics: A Perspective from
Statistical Physics and combinatorial Stochastic Processes, Cambridge
University Press.
Baily, M., C. Hulten, and D. Campbell (1992), "Productivity Dynamics in
Manufacturing Plants," Brookings Papers: Microeconomics, 4, pp. 187–267.
Berlingieri, G., P. Blanchenay, and C. Criscuolo (2017), "The great divergence(s),"
OECD Science, Technology and Innovation Policy Papers, No. 39.
Brynjolfsson and A. McAfee (2011), Race Against the Machine, Digital Frontier Press.
――― and ――― (2014), The Second Machine Age, W. W. Norton & Co. Inc.
Caballero, R. J., T. Hoshi, and A. K. Kashyap (2008), "Zombie Lending and Depressed
Restructuring in Japan," American Economic Review, Vol. 98 (5), pp.
1943-1977.
Canals, C., X. Gabaix, J. M. Vilarrubia, and D. E. Weinstein (2007), "Trade Patterns,
Trade Balances and Idiosyncratic Shocks," Columbia University Working
Paper.

25
Coen, T. and R. Baldwin (2014), Secular Stagnation: Facts, Causes and Cures, CEPR
Press.
Corrado, C., J. Haskel, C. Jona-Lasinio, and M. Iommi (2012), "Intangible Capital and
Growth in Advanced Economies: Measurement Methods and Comparative
Results," INTAN Investment Working Paper.
―――, C. Hulten, and D. Sichel (2005), "Measuring Capital and Technology: An
Expanded Framework," NBER chapters, in: Measuring Capital in the New
Economy, pp. 11-46, National Bureau of Economic Research, Inc.
―――, ―――, and ――― (2009), "Intangible Capital and US Economic Growth," The
Review of Income and Wealth, Vol. 55 (3), pp. 661-685.
Cowen, T. (2011), The Great Stagnation, Dutton.
Doms, M. (2004), "Productivity Growth and the Retail Sector," FRBSF Economic
Letter.
European Commission (2014), "Commission Recommendation of 12.3.2014 on a New
Approach to Business Failure and Insolvency."
Fernald, J. (2014), "Productivity and Potential Output before, during, and after the Great
Recession," NBER Macroeconomics Annual, Vol. 29 (1), pp. 1-51.
Ferrando, A. and A. Ruggieri (2015), "Financial Constraints and Productivity: Evidence
from Euro Area Companies," Working Paper Series 1823, European Central
Bank.
Foster, L., J. Haltiwanger, and C. Krizan (2001), "Aggregate Productivity Growth:
Lessons from Microeconomic Evidence," NBER Chapters, in: New
Developments in Productivity Analysis, pp. 303-372
Fueki, T. and T. Kawamoto (2009), "Does Information Technology Raise Japan's
Productivity?," Japan and the World Economy, Vol. 21 (4), pp. 325-336.
Fukao, K., and Y. Kim (2008), "Productivity, Resource Allocation, and Economic
Growth in Japan," Global COE Hi-Stat Discussion Paper Series 014, Hi-Stat,
Institute of Economic Research, Hitotsubashi University (available in
Japanese only).

26
――― and H. U. Kwon (2006), "Why Did Japan's TFP Growth Slow Down in the Lost
Decade? An Empirical Analysis Based on Firm-Level Data of Manufacturing
Firms," Japanese Economic Review, Vol. 57 (2), pp. 195-228.
―――, T. Miyagawa, K. Mukai, Y. Shinoda, and K. Tonogi (2009), "Intangible
Investment in Japan: Measurement and Contribution to Economic Growth,"
Review of Income and Wealth, Vol. 55 (3), pp. 717-736.
Gabaix, X. (2011), "The Granular Origins of Aggregate Fluctuations," Econometrica,
Vol. 79 (3), pp. 733-772.
GE (2016), 2016 GE Global Innovation Barometer, GE Reports.
Gordon, R. J. (2012), "Is U.S. Economic Growth Over? Faltering Innovation Confronts
the Six Headwinds," NBER Working Papers 18315, National Bureau of
Economic Research, Inc.
――― (2015), "Secular Stagnation: A Supply-Side View," American Economic Review,
Vol. 105 (5), pp. 54-59.
――― (2016), The Rise and Fall of American Growth, Princeton University Press.
Himoro, E (2017), "Using and application for ICT in the field of medical, nursing care
and health care," Mizuho Information & Research Institution Report, Vol.13
(available in Japanese only).
Hogen, Y., K. Miura, and K. Takahashi (2017), "Large Firm Dynamics and Secular
Stagnation: Evidence from Japan and the U.S.," Bank of Japan Working Paper
Series, No. 17-E-8.
Hsieh, C. and P. Klenow (2017), "The Reallocation Myth," Economic Policy
Symposium - Jackson Hole, Federal Reserve Bank of Kansas City.
Institute for International Socio-Economic Studies (2012), "Research and Study on
Further Aging and Smart Aging," Institute for International Socio-Economic
Studies (available in Japanese only).
Jorgenson, D. (2001), "Information Technology and the U.S. Economy," American
Economic Review, Vol. 91 (1), pp. 1-32.

27
Kameda, S. (2009), "Issues on Japan's Productivity: How Do We Evaluate Productivity
Developments Since 2000?" Bank of Japan Working Paper Series, No.
09-J-11 (available in Japanese only).
――― and I. Takagawa (2003), "International Comparison of ROA- Return on capital
of Japanese companies," Bank of Japan Working Paper Series, No. 03-11
(available in Japanese only).
Kato, R. and S. Naganuma (2013), "Globalization and Japan's Economy," Bank of Japan
Working Paper Series, No. 13-J-13 (available in Japanese only).
Kinoshita, N. (2014), "Environmental Improvement to Enhance the Growth Potential of
Japanese Companies - International comparisons and lessons from German
structural reforms," Shoken Review (Securities Review), Vol. 54 (8), Japan
Securities Research Institute (available in Japanese only), pp. 1-31.
Koike, K. (1991), "Economics of Work," Toyo Keizai (available in Japanese only).
――― (1994), "Benefit and Universality of Japanese Employment System," Toyo
Keizai (available in Japanese only).
Levine, O. and M. Warusawitharana (2014), "Finance and Productivity Growth:
Firm-Level Evidence," Finance and Economics Discussion Series, No.
2014-17, Federal Reserve Board.
Lewis, W. W. (2004), The Power of Productivity: Wealth, Poverty, and the Threat to
Global Stability, University of Chicago Press.
Melitz, J. M. and S. Polanec (2015), "Dynamic Olley-Pakes Productivity
Decomposition with Entry and Exit," RAND Journal of Economics, Vol. 46
(2), pp. 362-375.
Nakajima, J., K. Nishizaki, and M. Hisamitsu (2016), "Slowdown of Labor Productivity
in Advanced Countries," BOJ Reports & Research Papers (available in
Japanese only).
Nakano, A. and R. Kato (2017), "The Recent Debate on 'Long-Term Stagnation':
Focusing on the 'Hysteresis Effect'," Bank of Japan Review, No. 2017-J-2
(available in Japanese only).
Nishimura, K. G., T. Nakajima, and K. Kiyota (2005), "Does the Natural Selection
Mechanism Still Work in Severe Recessions? Examination of the Japanese

28
Economy in the 1990s," Journal of Economic Behavior & Organization, Vol.
58 (1), pp. 53-78.
Oda, N. and J. Muranaga (2003), "On the Natural Rate of Interest: Theory and
Estimates," Bank of Japan Working Paper Series, No. 03-J-5 (available in
Japanese only).
Ohtake, F. (2000), "Time for Turning Point of Employment Stimulation: from
Aggregate Demand Control to Structural Policy," Economics & Policy,
Feature issue on job mobility, Spring edition, Toyo Keizai (available in
Japanese only).
Otsuka, T. (2010), "What Causes the Declining Competitiveness of Japanese
Companies? - Issues from the Viewpoint of Research and Development,"
Mizuho Report (available in Japanese only).
Prime Minister of Japan and His Cabinet (2016), "Japan Revitalization Strategy 2016-
The fourth industrial revolution," Prime Minister of Japan and His Cabinet.
Purdy, M. and P. Daugherty (2016), "Why Artificial Intelligence is the Future of
Growth," Accenture.
Romer, P. M. (1990), "Endogenous Technological Change," Journal of political
Economy, Vol. 98 (5), pp. 71-102.
Schumpeter, J. A. (1926), Theorie der wirtschaftlichen Entwicklung, 2.
Sekine, T., K. Kobayashi, and Y. Saita (2003), "Forbearance Lending: The Case of
Japanese Firms," Monetary and Economic Studies, Vol. 22 (1), Institute for
Monetary and Economic Studies, Bank of Japan, pp. 129-156.
Summers, L. H. (2013), Remarks at the IMF Fourteenth Annual Research Conference in
Honor of Stanley Fischer, Washington DC.
Yamada, H. (2016), Job Mobility without Unemployment - New Labor Market Reforms
for Growth, Keio University Press (available in Japanese only).
Yanagawa, N. (2009), "Abandoning the Illusion of Lifetime Employment: Towards a
System of Employment Tailored to Changes in the Industrial Structure,"
NIRA, (available in Japanese only).

29
Appendix: Calculation Method for TFP of Each Company
Countries: Belgium, Germany, Denmark, Estonia, Finland, France, Greece, Italy,
Japan, the U.S.
Companies: About 2,900 per year (Manufacturing)
Sample period: CY1998 - 200925
Data Source: Thomson Reuters, "Data Stream"; OECD, "STAN database"; IMF,
"World Economic Outlook"; Cabinet Office, National Accounts of Japan.
Calculation method26
:
𝑙𝑛 𝑇𝐹𝑃𝑖,𝑡
= (ln 𝑌𝑖,𝑡 − ln 𝑌𝑡 ) −
1
2(𝑆𝐿𝑗,𝑡 + 𝑆𝐿𝑡
)(ln 𝐿𝑖,𝑡 − ln 𝐿𝑡 ) −
1
2(𝑆𝐾𝑗,𝑡 + 𝑆𝐾𝑡
)(ln 𝐾𝑖,𝑡 − ln 𝐾𝑡 )
+ (ln 𝑌𝑡 − ln 𝑌𝑇
) −1
2(𝑆𝐿𝑡 + 𝑆𝐿𝑇
)(ln 𝐿𝑡 − ln 𝐿𝑇
) −1
2(𝑆𝐾𝑡 + 𝑆𝐾𝑇
)(ln 𝐾𝑡 − ln 𝐾𝑇
)
where T, j, i shows the base year (CY2000), industry, and companies, respectively
and all values are based on PPP. The upper-bars in the equation indicate the
average of all samples in each year. The following factors are deflated using the
industry-level data classified with the industry classification benchmark (icb).
Y (Net Sales): deflated using GDP deflators by industry
K (Tangible Fixed Capital): deflated using investment deflator by industry
L (Man-hours): Number of employees × Labor hours per person by industry
SL (Cost share of labor): employee income by industry / GDP
SK (Cost share of capital): 1- SL
The definition of frontier firms27
: upper 5% companies out of all samples in
estimated TFP in each year.
25
Due to data constraints, the sample period is until CY2009.
26 Fukao et al. (2006) and Nishimura et al. (2005) also use the same methodology to calculate
corporate TFP.
27 Andrews et al. (2015) analyze productivity of OECD firms and they define frontier firms as top
five or top ten percent of the sample, or top 100 companies.

30
Chart 1. Real GDP
Japan U.S. Germany
Note: Dotted lines are trends extracted by the HP filter.
Source: Conference Board.
-4
-2
0
2
4
6
8
51 61 71 81 91 01 11CY
y/y % chg.
-6
-4
-2
0
2
4
6
8
10
12
14
51 61 71 81 91 01 11CY
y/y % chg.
-6
-4
-2
0
2
4
6
8
10
12
51 61 71 81 91 01 11CY
y/y % chg.

31
Chart 2. Labor Productivity
(1) Output per worker
Japan U.S. Germany
(2) Output per hour worked
Japan U.S. Germany
Note: Dotted lines are trends extracted by the HP filter.
Source: Conference Board.
-3
-2
-1
0
1
2
3
4
5
6
51 61 71 81 91 01 11CY
y/y % chg.
-4
-2
0
2
4
6
8
10
12
51 61 71 81 91 01 11CY
y/y % chg.
-6
-4
-2
0
2
4
6
8
51 61 71 81 91 01 11CY
y/y % chg.
-1
0
1
2
3
4
51 61 71 81 91 01 11CY
y/y % chg.
-2
0
2
4
6
8
10
12
14
51 61 71 81 91 01 11CY
y/y % chg.
-4
-2
0
2
4
6
8
10
51 61 71 81 91 01 11CY
y/y % chg.

32
Chart 3. Output Per Capita
Japan U.S. Germany
Note: Dotted lines are trends extracted by the HP filter.
Source: Conference Board.
-4
-2
0
2
4
6
8
51 61 71 81 91 01 11CY
y/y % chg.
-6
-4
-2
0
2
4
6
8
10
12
14
51 61 71 81 91 01 11CY
y/y % chg.
-6
-4
-2
0
2
4
6
8
10
12
51 61 71 81 91 01 11CY
y/y % chg.
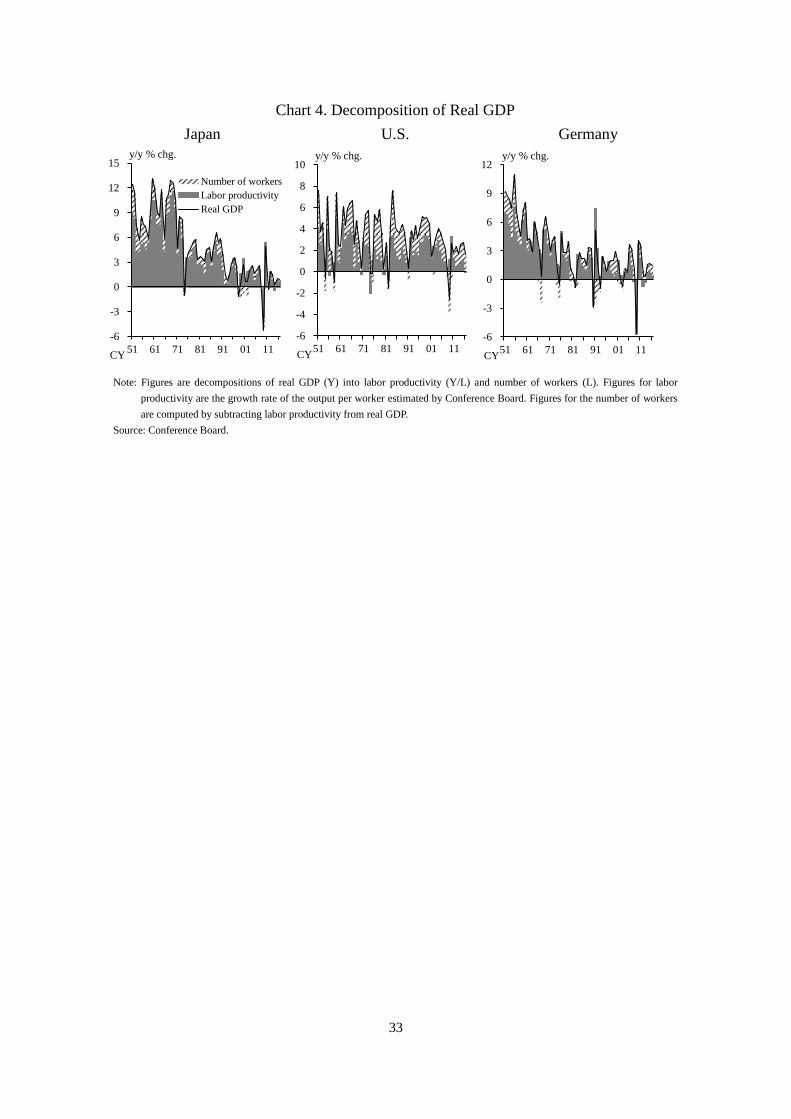
33
Chart 4. Decomposition of Real GDP
Japan U.S. Germany
Note: Figures are decompositions of real GDP (Y) into labor productivity (Y/L) and number of workers (L). Figures for labor
productivity are the growth rate of the output per worker estimated by Conference Board. Figures for the number of workers
are computed by subtracting labor productivity from real GDP.
Source: Conference Board.
-6
-4
-2
0
2
4
6
8
10
51 61 71 81 91 01 11CY
y/y % chg.
-6
-3
0
3
6
9
12
15
51 61 71 81 91 01 11CY
y/y % chg.
Number of workers
Labor productivity
Real GDP
-6
-3
0
3
6
9
12
51 61 71 81 91 01 11CY
y/y % chg.

34
Chart 5. Decomposition of Labor Productivity
Japan U.S. Germany
Note: Figures are 5-year backward moving averages. Figures for labor productivity are the growth rate of the output per worker
estimated by Conference Board. TFPs in U.S., Japan and Germany are calculated by Fernald (2014), RIETI, EU KLEMS,
respectively. Figures for capital equipment ratio are computed by subtracting TFP from labor productivity.
Sources: Conference Board, RIETI, Fernald (2014), EU KLEMS.
-1
0
1
2
3
4
5
6
75 80 85 90 95 00 05 10CY
y/y % chg.
-1
0
1
2
3
4
5
6
75 80 85 90 95 00 05 10CY
y/y % chg.
Capital equipment ratio
TFP
Labor productivity
-1
0
1
2
3
4
5
6
75 80 85 90 95 00 05 10CY
y/y % chg.

35
Chart 6. Corporate IT Strategy
Assignment of CIO (chief information
officer) position
Uses of the IT budget
Japan U.S.
Note: In 2013 survey. The chart on the right-hand side shows the increase of uses of the IT budget in firms which raise the IT budget
(the items extracted are those which had relatively many responses).
Source: JEITA "Comparative Analysis of IT Management between Japanese and U.S. Firms."
Chart 7. Global Patent Applications
Note: Figures are the aggregated number of patent families from the Ministry of Education, Culture, Sports, Science and
Technology (when the same patent is applied to multiple countries, duplications are removed). For the calculation method,
see the source below.
Source: National Institute of Science and Technology Policy "Japanese Science and Technology Indicators 2016" (although the
digest version of the paper in English is available, the data for this chart is available in Japanese only).
Assignment of dedicated staff
Assignment of concurrent staff
The top of IT department is not a board member
Others
0
10
20
30
40
50
60
Rei
nfo
rcin
g p
rod
uct
&
serv
ice
dev
elo
pm
ent
Chan
gin
g b
usi
nes
s
mo
del
Rei
nfo
rcin
g a
nal
ysi
s
for
cust
om
er b
ehav
ior
& m
ark
et
Impro
vin
g e
ffic
iency
of
op
erat
ion
s
multiple responses, %
Japan U.S.
0
50
100
150
200
250
81 86 91 96 01 06 11CY
number of cases, thousands

36
Chart 8. Listed Companies' TFP
TFP (average in each country firms) TFP distribution
Notes: 1. Each of the listed manufacturing company TFPs in OECD are estimated. The upper 5% of all sample firms are defined as
'frontier firms' and the figure of 'frontier firms' on the left-hand side shows the 5th percentile value (hereinafter the same).
For details of the calculation methods, see Appendix.
2. Figures are as from 2007 to 2009.
3. Japanese, U.S. and OECD TFPs in the left chart are calculated by taking the average of firms' TFP weighted by sales. The
right chart is calculated with Kernel density estimation.
Sources: Cabinet Office "National Accounts of Japan," Thomson Reuters "Datastream," OECD "STAN database," IMF "World
Economic Outlook."
0
1
2
3
4
5
6
7
8
-7 -6 -5 -4 -3 -2 -1 0 1 2 3 4 5 6 7
lnTFP
%
Japan
U.S.
Frontier firms
TFP Upper 5%
average during
CY2007~2009
0
1
2
3
4
5
6
7
8
9
OECD
average
Japan U.S. Frontier
firms
lnTFP, Japan=1

37
Chart 9. Listed Companies' TFP
TFP Discrepancies from frontier firms
Note: Figures are for manufacturing companies. For each definition, source and calculation method, see the notes of Chart 8 and
Appendix. The graph on the right-hand side shows distances between frontier firms and the average in each country firms.
Chart 10. Listed Companies' TFP Classified into Top, Median, Bottom
Japan U.S.
Note: Figures are for manufacturing companies. For each definition, source and calculation method, see the notes in Chart 8 and
Appendix. Figures in the left graph are calculated by taking the average of TFP classified into 3 groups (Top 5%, Median
90%, Bottom 5%) weighted by sales. Figures in the right graph (U.S. firms) are calculated in the same way as Japan.
-1.4
-1.2
-1.0
-0.8
-0.6
-0.4
-0.2
0.0
0.2
0.4
98 99 00 01 02 03 04 05 06 07 08 09CY
Top 5%
Median 90%
Bottom 5%
discrepancies from frontier firm,
ln, CY1998=0
-1.4
-1.2
-1.0
-0.8
-0.6
-0.4
-0.2
0.0
0.2
0.4
98 99 00 01 02 03 04 05 06 07 08 09CY
discrepancies from frontier firm,
ln, CY1998=0
-1.8
-1.7
-1.6
-1.5
-1.4
-1.3
98 99 00 01 02 03 04 05 06 07 08 09CY
U.S.
Japan
OECD average
discrepancies from frontier firms, ln
-0.1
0.0
0.1
0.2
0.3
0.4
0.5
0.6
0.7
1.3
1.4
1.5
1.6
1.7
1.8
1.9
2.0
2.1
98 99 00 01 02 03 04 05 06 07 08 09CY
Frontire firms
U.S. (rhs)
OECD average (rhs)
Japan (rhs)
ln ln

38
Chart 11. Investment in Intangible Capital Chart 12. Research and Development
(R&D) Expenses
Note: Figures for Japan are measured by the JIP database.
Figures for U.S. are sum of the data of INTAN-invest
(market sector) and SPINTAN (public sector).
Sources: JIP, INTAN-invest, SPINTAN, IMF.
Source: OECD "OECD Main Science and Technology
Indicators."
Chart 13. Share in Patent Application of Selected Countries
Note: For sources and the calculation methods, see the note in Chart 7.
0.5
1.0
1.5
2.0
2.5
3.0
3.5
4.0
4.5
00 02 04 06 08 10 12 14CY
ratio of nominal GDP, %
Japan U.S.
Germany China
Korea
6
7
8
9
10
11
12
13
14
15
95 96 97 98 99 00 01 02 03 04 05 06 07 08 09 10CY
ratio of nominal GDP, %
U.S. Japan
0
5
10
15
20
25
30
35
82 86 90 94 98 02 06 10CY
%
Japan
U.S.
Germany
France
U.K.
China
Korea

39
Chart 14. R&D and Productivity
Japan U.S.
Notes: 1. Figures are for manufacturing companies. For definitions, sources and calculation method, see the notes in Chart 8.
2. The TFP growth rate leads 3- to 5-year ahead (R&D investment (R&D/ Sales ratio) lags behind). The solid line represents
its average and the shaded area indicates ±1 standard error.
-10
0
10
20
30
40
0-4
8-1
2
16-2
0
24-2
8
32-3
6
40-4
4
48-5
2
56-6
0
64-6
8
72-7
6
80-8
4
88-9
2
96-1
00
TFP growth rate, %
percentile of R&D investment amount
← Companies spending less on R&D More→
-10
0
10
20
30
40
0-4
8-1
2
16-2
0
24-2
8
32-3
6
40-4
4
48-5
2
56-6
0
64-6
8
72-7
6
80-8
4
88-9
2
96-1
00
TFP growth rate, %
← Companies spending less on R&D More→
percentile of R&D investment amount

40
Chart 15. Preference for Incremental Innovation Chart 16. Methods for R&D
Note: Survey for business executives. Figures show the ratio of
companies which prefer incremental innovation rather
than breakthrough innovation.
Source: GE "2016 GE Global Innovation Barometer."
Note: Survey for Japanese companies.
Source: Japan Open Innovation Council "White paper on Open
Innovation."
Chart 17. Source of Funds for R&D Expenditure Chart 18. Uncommercialized Technologies
Note: The main source of funds other than those in the above
chart is in-house funding.
Source: Ministry of Education, Culture, Sports, Science and
Technology "Indicators of Science and Technology
2015."
Note: Survey for Japanese companies. The chart shows
treatments of technologies and ideas for new business
after they had decided not to commercialize in-house.
Source: Japan Open Innovation Council "White paper on Open
Innovation."
0
5
10
15
20
25
Jap
an
U.S
.
Ger
man
y
Fra
nce
U.K
.
Ch
ina
Kore
a
From foreign countries
From government
funding ratio, %
0
20
40
60
80
Dis
app
ear
Co
nti
nu
e to
co
nsi
der
beh
ind
th
e sc
enes
Spin
-off
Uti
lize
in
oth
er
com
pan
ies
Uti
lize
in
gro
up
com
pan
ies
%
40
50
60
70
80S
wed
en
Japan
Kore
a
Ger
man
y
U.S
.
Fra
nce
Global average across 23 countries%
0
20
40
60
80
In-h
ouse
dev
elo
pm
ent
Coo
per
atio
n w
ith
oth
er f
irm
s
Co
op
erat
ion
wit
h
un
iver
siti
es a
nd
pu
bli
c re
sear
ch
inst
itu
tio
ns
Com
mis
sioned
from
oth
er f
irm
s
%

41
Chart 19. Human Capital Investment by Industry
Manufacturing Non-Manufacturing
Note: Figures are from 2011 to 2012. Selected countries.
Source: OECD "OECD Science, Technology and Industry Scoreboard 2015."
Chart 20. Human Capital Investment by Type
Note: Figures are from 2011 to 2012. Selected countries.
Source: OECD "OECD Science, Technology and Industry Scoreboard 2015."
0
2
4
6
8
10
U.K
.
U.S
.
No
rway
Sw
eden
Ger
man
y
Ko
rea
Jap
an
Fra
nce
Ital
y
As a percentage of value added
Formal and on-the-job
On-the-job only
Formal only
0
2
4
6
8
10N
orw
ay
U.K
.
U.S
.
Fra
nce
Japan
Ger
man
y
Kore
a
Sw
eden
Ital
y
As a percentage of value added
Average across 22
countries
0
2
4
6
8
10
Norw
ay
U.K
.
Sw
eden
U.S
.
Kore
a
Ger
man
y
Japan
Fra
nce
Ital
y
As a percentage of value added
Average across 22
countries

42
Chart 21. Decomposition of Labor Productivity
Japan U.S.
Note: Figures are 5-year backward moving averages.
Source: Created on the basis of Hogen et al. (2017).
Chart 22. Entry Rates Chart 23. Listed Year of Large Firms
Source: The Small and Medium-sized Enterprise Agency, "2014
White Paper on Small and Medium Enterprises in
Japan."
Note: Figures are calculated by summing up the number of
companies, whose market capitalizations are more than
10 billion US dollars (as of February 2016 and excluding
Financial sector), by the IPO timing. Nationalities are
based on headquarters.
Source: Bloomberg.
0
50
100
150
200
250
300
350
Japan U.S.
number of firms
Before 1980
The 1980s
The 1990s
The 2000s
The 2010s
0
2
4
6
8
10
12
14
01 02 03 04 05 06 07 08 09 10 11 12CY
%
U.S.
Japan
-4
-3
-2
-1
0
1
2
3
4
-10
-8
-6
-4
-2
0
2
4
6
8
10
90 92 94 96 98 00 02 04 06 08 10 12 14
y/y % chg.
CY
y/y % chg.
-4
-3
-2
-1
0
1
2
3
4
-10
-8
-6
-4
-2
0
2
4
6
8
10
90 92 94 96 98 00 02 04 06 08 10 12 14
y/y % chg.
CY
y/y % chg.
Surviving firms
Exit firms
Entry firms
Labor productivity (listed firms)
Labor productivity (GDP base, rhs)

43
Chart 24. Animal Spirits
(1) Perceived opportunities (2) Perceived capabilities
(3) Fear of failure (4) High status to successful entrepreneurs
Notes: 1. Survey for individual attributes of potential entrepreneurs in 2014.
2. Perceived opportunities reflects the percentage of individuals who believe there is an opportunity to start a venture in the
next six months in their immediate environment. Perceived capabilities reflects the percentage of individuals who believe
they have the required skills, knowledge and experience to start a new venture. The measure of fear of failure (when it
comes to starting own venture) only applies to those who perceive opportunities.
Source: Global Entrepreneurship Monitor "2014 Global Report."
Chart 25. School Helped to Develop a
Sense of Initiative and Entrepreneurial
Attitude
Chart 26. Obstacles at Entry in Japan
Note: Figures are as of 2012 and in selected countries.
Source: OECD "Entrepreneurship at a Glance 2013."
Note: Survey for companies which have already started their
business.
Source: Japan Finance Corporation "2015 Survey on Business
Startups in Japan."
0
10
20
30
40
50
Fun
din
g
Acq
uir
ing c
ust
om
ers
Lac
k o
f know
ledge
of
finan
ce, ta
x, an
d l
aw
Ensu
ring
em
plo
yee
s
multiple responses, %
0
10
20
30
40
50
60
U.S. U.K. Germany Japan
Average across 28 countries
%
0
10
20
30
40
50
60
U.S. U.K. Germany Japan
%
Average across 28 countries
50
60
70
80
90
U.S. U.K. Germany Japan
%
Average across 26 countries
20
30
40
50
60
U.S. U.K. Germany Japan
%
Average across 28 countries
0
20
40
60
80
100
Norw
ay
U.S
.
Ger
man
y
Kore
a
Sw
eden
Fra
nce
Ital
y
U.K
.
Japan
%
Don't know / No answer Largely disagree Largely agree

44
Note: Figures are calculated as follows by using TFPs of individual listed manufacturing firms in Japan (1998 - 2009). For source
and calculation methods of firms' TFPs, see the note in Chart 8 and Appendix.
Chart 28. Firm Age and Productivity Chart 29. M&A
Note: Figures are calculated by using TFPs of individual listed
manufacturing companies in Japan and the U.S. (1998 -
2009). For source and calculation methods, see the note
in Chart 8 and Appendix.
Note: Figures are as of 2016 and based on public
announcement.
Source: Thomson Reuters "Mergers & acquisitions review."
Chart 27. Survival Rates of Low Productivity Firms
0
2,000
4,000
6,000
8,000
10,000
12,000
Japan U.S.
Number of M&A
10
20
30
40
50
60
70
80
90
100
0 1 2 3 4 5 6 7 8T (years)
Japan
U.S.
survival rates, %
0
1
2
3
4
5
shorter than 5
years
5 years or
longer but
shorter than
15 years
15 years or
longer but
shorter than
25 years
25 years or
longer
firm age
TFP growth rate, %
Survival rates of low productivity firms
=number of low productivity firms (under 20 percentile from T = 0 to T = t)
number of low productivity firms (under 20 percentile at T = 0)∙ 100

45
Chart 30. Labor Market and Productivity
Source: OECD "OECD. Stat."
AUSAUT
BEL CAN
DNK
FINFRA
DEU
IRL
ITA
JPNNLD
NZL
PRTESP
SWE
CHE
GBR
USA
-1.0
-0.5
0.0
0.5
1.0
1.5
0.0 0.5 1.0 1.5 2.0 2.5
TFP growth rate (average during 2001- 2009), %
flows of people into and out of unemployment pool/employment
(average during 2001- 2009), %

46
Chart 31. Growth Path
Source: Created on the basis of Aoki et al. (2017).
-2
-1
0
1
2
3
4
5
6
7
8
9
10
0.2 0.3 0.4 0.5 0.6 0.7 0.8 0.9 1.0
Labor productivity (U.S.=1)
Annual growth rate of labor productivity, %
Catch-up line
Innovation line
Growth-maximizing path
Japan
the distance from U.S.: Short
Creating innovation is the most appropriate
the distance from U.S.: Long
Imitating innovative technologies of
frontier countries is the most appropriate
1960s
1970s1980s
1990s
2000s
2010s
Switching point
from catch-up
to innovation path
Low productivity
trapFalling into growth stagnation just by imitating other countries'
technologies
How to return to desirable growing path
-- Improving efficiency for goods and labor market --
・active engagement for technology innovation
・high labor mobility by labor market reform