productivity and cost of biomass harvesting for energy production in coppice natural stands of...
TRANSCRIPT
ww.sciencedirect.com
b i om a s s a n d b i o e n e r g y 5 6 ( 2 0 1 3 ) 2 2 1e2 2 9
Available online at w
http: / /www.elsevier .com/locate/biombioe
Productivity and cost of biomass harvesting forenergy production in coppice natural stands ofQuercus pyrenaica Willd. in central Spain
Ruben Laina a,*, Eduardo Tolosana a, Yolanda Ambrosio b
aUniversidad Politecnica de Madrid, ETSI Montes, Ciudad Universitaria, 28040 Madrid, SpainbUniversidad Politecnica de Madrid, EUIT Forestales, Ciudad Universitaria, 29040 Madrid, Spain
a r t i c l e i n f o
Article history:
Received 5 July 2011
Received in revised form
12 March 2013
Accepted 26 April 2013
Available online 5 June 2013
Keywords:
Quercus pyrenaica
Whole tree harvesting
Cut to length
Time study
Biomass
Diameter-based equation
* Corresponding author. Tel.: þ34 913367128;E-mail address: [email protected] (R. L
0961-9534/$ e see front matter ª 2013 Elsevhttp://dx.doi.org/10.1016/j.biombioe.2013.04.
a b s t r a c t
Biomass growing stocks, harvesting productivity and costs of energy production, were
studied in thinnings of Quercus pyrenaica. Eleven forest sites were selected in coppices
located in Castilla y Leon (Spain). Three systems were employed for harvesting: a mech-
anised whole tree harvesting (WTH) system, which included chipping at landing; a fully
mechanised cut-to-length (CTL) harvesting system for firewood; and a semi-mechanised
CTL system with manual felling and bunching. Three WTH trials had a hauling off 34.7
e44.1 oven-dried tonnes (odt) ha�1. In contrast, only 11.6e30.0 odt ha�1 were obtained in
the other eight CTL trials. Biomass weight equations for stems and whole trees were fitted.
Worker operations were time-studied using software designed by the authors. The WTH
system reached maximum productivity rates of 3.9 oven-dried tonnes per productive hour
(odt h�1) for the felling and bunching operation and 6.9 odt h�1 for the forwarding opera-
tion. The mechanised CTL harvesting method achieved a productivity range of 1.3
e0.5 odt h�1 for the harvesting operation. Furthermore, the average forwarding produc-
tivity was 7.3 odt h�1. Motor-manual felling and crosscutting in the CTL system accom-
plished a productivity range of 0.7e1.9 odt h�1. Manual bunching resulted in similar values.
The lowest firewood unit cost for trees with 10 cm of diameter at breast height (DBH) was
62.0 V odt�1 using a semi-mechanised CTL system. Under similar conditions, this cost was
85.2 V odt�1 for the mechanised CTL system. Finally, the cost corresponding to chips at
landing from WTH sites (average DBH ¼ 10 cm) was 65.3 V odt�1.
ª 2013 Elsevier Ltd. All rights reserved.
1. Introduction
The Spanish Renewable Energy Plan (2005e2010) [1] has
finished. This plan tried to increase renewable energy (RE)
production rate of total primary energy production
(4.77 � 1012 MJ) from 6.3% in 2005 to 30% in 2010. Bioenergy
was an important part of the plan’s goal. Currently, there are
only 648 MW generating capacity installed [2] in biomass
fax: þ34 913366386.aina).ier Ltd. All rights reserved016
power plants; however, the plan had aimed to reach 1317 MW
by 2010. The objective remained unaccomplished despite
government subsidies for electricity production from forest
residuals (0.11 V kWh�1) and from forest woody crops
(0.16 V kWh�1) [3]. According to the RE National Action Plan
2011e2020 [4], renewable energies accounted for 9.4% of pri-
mary energy consumption in 2010, 132,000 Mtep, whereas the
goal for 2020 is 20.1%. Regarding electricity production, RE
.
b i om a s s an d b i o e n e r g y 5 6 ( 2 0 1 3 ) 2 2 1e2 2 9222
accounted for 24% of total Spanish electricity (21,410 Mtep)
production in 2010, whereas the objective for 2020 is to reach a
36% contribution. Similarly, biomass and biogas are intended
to grow at a yearly rate between 7.0% and 12.6% during the
period 2009e2020. Measures fostering the energy use of forest
and agricultural products or residues, in addition to woody
crops, are aimed at producing an additional consumption of
5.5 � 106 tonnes of biomass per year. To achieve this aim
would require tremendous efforts to mobilise all biomass
sources, including woody biomass. In particular, the govern-
ment of Castile and Leon approved a regional bioenergy plan
in 2010 [5] with the goal of collecting 1.5 � 106 tonnes of
biomass per year from biomass harvested in 60,000 ha of
regional forests in the next 10 years. This Plan predicts 1.300
new employs will be generated [5].
Coppice areas of Quercus pyrenaica represent 64% of the
total area covered by this species, which is 659,000 ha in Spain;
moreover, half of this total surface lieswithin Castile and Leon
[6]. In addition, the management of these coppices is one of
the greatest problems faced in forestry research in Spain. In
the past, the only silvicultural treatment, and forest man-
agement, was the traditional firewood harvesting. Stands
were divided in parts and each 20e30 years a clear-cuttingwas
performed in each part to obtain wood for combustion or
making charcoal. After clear-cutting a subsequent shoot or
root regeneration occurred. Over the last 50 years this activity
was progressively abandoned because of rural emigration to
the cities and the introduction of fuel heating in household [7].
The budget for forest administration is insufficient to perform
an alternative forest management in high density coppices
needed to avoid diseases, reduce forest fire risk or promote the
health and growth of stands. New markets that increase the
demand for forest biomass would enhance the development
of new forest management systems or, alternatively, would
update traditional treatments with new technologies and/or
systems.
Here, we present the results of a time study of three
different biomass harvesting systems: a mechanised whole
tree harvesting (WTH) system followed by chipping at landing;
a mechanised cut-to-length (CTL) harvesting system to
Table 1 e Experimental design. Summary of stands, systems a
Sites Work System
Fell
bunchin
process
WTH1WTH2WTH3
Whole tree harvesting system
TimbeharvestiAccumu
CTL1CTL2CTL3CTL4
Fully mechanised cut-to-length system
TimberHarvestin
CTL5CTL6CTL7CTL8
Motor-manual felling and processing cut-
to-length system
Husqva372 c
produce firewood; and a motor-manual option for felling and
manual bunching CTL. The hauling off was performed in
every case by forest forwarders (Table 1). There are few ref-
erences about the productivity of forest harvesting in Spain,
and none of them focuses on this kind of forest [8e10].
In practice, WTH is a rarely used system for roundwood or
biomass harvesting in Spain. However, it is widely used for
harvesting biomass from small trees in selective thinning;
mainly multi-tree harvesters followed by forwarders are used
in Nordic countries [11,12] andNorth America [13]. In southern
European countries, only a few articles in the local literature
mention WTH applied to coppices [14]. Spinelli et al. [15]
studied WTH followed by forest cable crane hauling off
applied to beeches (Fagus sylvatica) with 15e30 cm of diameter
at breast height (DBH). This study was conducted in moun-
tainous stands and compared motor-manual versus mecha-
nised processing. For Quercus or other natural coppices, the
application of WTH has not yet been investigated, with some
exception, for example a study on Italian Robinia and Platanus
spp. with a different typology, i.e., linear coppices [16].
The CTL system is often adopted by local companies in
Spain that mainly use short log lengths (2.0e2.5 m) of Euca-
lyptus pulpwood and young pine artificial stands; however, it
is also used for firewood from Quercus or other hardwood
forests. However, there are no published local references
regarding the application of CTL systems to coppices.
Several articles explore non-conventional harvesting sys-
tems for collecting firewood in themountainous conditions of
southern European countries. In northern Italy, the hauling
off firewood and the productivity of manual CTL system op-
erations were measured in several silvicultural interventions
with different methods [17]: sliding on terrain, using poly-
ethylene chutes, skidding with winch-equipped farm tractors
and hauling off with light to medium-sized cable cranes. The
costs ranged from 111 to 143 V per green tonne.
Gallis [18] summarised the result of hauling off unevenly
aged beech stands using mules compared with extracting
trees with a mini-skidder (“iron-horse” type). A CTL system
was chosen for small diameters from 10 to 20 cm. The results
of that study always favoured the use of mules because they
nd machinery.
ing and
g (and also
ing in CTL)
Forwarding Chipping
rjack 1070 ng head 745lating arms
Timberjack 1410
forwarder
Pezzolato 900/1000
truck mounted drum chipper
jack 1270 C g head H270
Valmet 910 forest
forwarder
No chipping (firewood)
rna 359 and hainsaws
Valmet 860.3 forest forwarder
No chipping (firewood)
b i om a s s a n d b i o e n e r g y 5 6 ( 2 0 1 3 ) 2 2 1e2 2 9 223
cost an average of 26% less. The productivity ratio between
mule and iron horse was 3.5e2.5 odt h�1. Dissimilar results
were found by Magagnotti et al [19]. They reported more cost-
effectiveness using tractor for logging instead of mule pack in
Turkey oak stands.
In Italy, cable yarding have been used to haul firewood off
from coppices of Quercus cerris, oak, holm oak and beech
stands [20,21]. The productivity was greater than what could
be considered, varied between 1.4 and 2.6 m3 per scheduled
time. This logging system reached competitive operating cost
compared to other logging system [21].
To support the increasing wood energy production and
considering the scarcity of scientific studies conducted locally,
this study had three main goals:
� Estimate the biomass growing stock of Q. pyrenaica coppices
by fitting aboveground biomass equations.
� Set up a productivity reference for biomass of whole tree
harvesting systems followed by chipping at landing and cut-
to-length harvesting systems. Similarly, we aimed to
develop, when possible, productivity equations to evaluate
the effects of the main explanatory factors (e.g., tree size
and forwarding distance).
� Evaluate chip supply costs, including transport costs, indi-
rect costs and contractor profits, under the studied condi-
tions and the influence of the main identified variables.
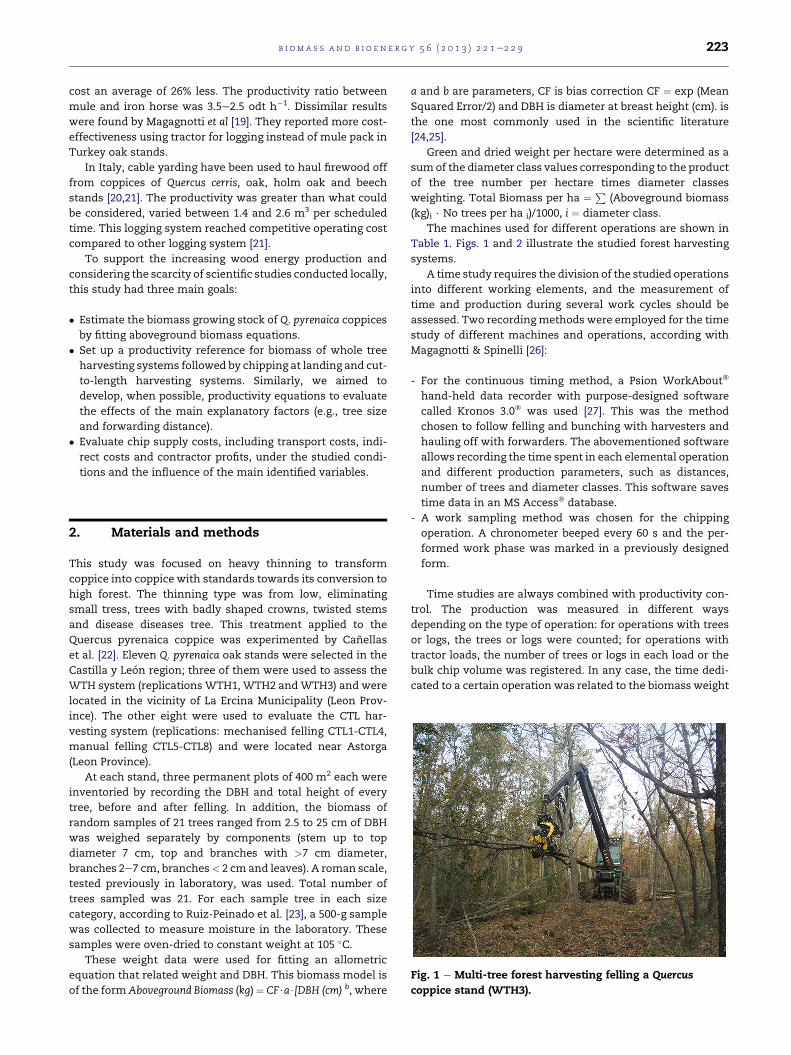
Fig. 1 e Multi-tree forest harvesting felling a Quercus
coppice stand (WTH3).
2. Materials and methods
This study was focused on heavy thinning to transform
coppice into coppice with standards towards its conversion to
high forest. The thinning type was from low, eliminating
small tress, trees with badly shaped crowns, twisted stems
and disease diseases tree. This treatment applied to the
Quercus pyrenaica coppice was experimented by Canellas
et al. [22]. Eleven Q. pyrenaica oak stands were selected in the
Castilla y Leon region; three of them were used to assess the
WTH system (replications WTH1, WTH2 andWTH3) and were
located in the vicinity of La Ercina Municipality (Leon Prov-
ince). The other eight were used to evaluate the CTL har-
vesting system (replications: mechanised felling CTL1-CTL4,
manual felling CTL5-CTL8) and were located near Astorga
(Leon Province).
At each stand, three permanent plots of 400 m2 each were
inventoried by recording the DBH and total height of every
tree, before and after felling. In addition, the biomass of
random samples of 21 trees ranged from 2.5 to 25 cm of DBH
was weighed separately by components (stem up to top
diameter 7 cm, top and branches with >7 cm diameter,
branches 2e7 cm, branches< 2 cm and leaves). A roman scale,
tested previously in laboratory, was used. Total number of
trees sampled was 21. For each sample tree in each size
category, according to Ruiz-Peinado et al. [23], a 500-g sample
was collected to measure moisture in the laboratory. These
samples were oven-dried to constant weight at 105 �C.These weight data were used for fitting an allometric
equation that related weight and DBH. This biomass model is
of the formAboveground Biomass (kg)¼ CF$a$[DBH (cm) b, where
a and b are parameters, CF is bias correction CF ¼ exp (Mean
Squared Error/2) and DBH is diameter at breast height (cm). is
the one most commonly used in the scientific literature
[24,25].
Green and dried weight per hectare were determined as a
sumof the diameter class values corresponding to the product
of the tree number per hectare times diameter classes
weighting. Total Biomass per ha ¼ P(Aboveground biomass
(kg)i $ No trees per ha i)/1000, i ¼ diameter class.
The machines used for different operations are shown in
Table 1. Figs. 1 and 2 illustrate the studied forest harvesting
systems.
A time study requires the division of the studied operations
into different working elements, and the measurement of
time and production during several work cycles should be
assessed. Two recordingmethods were employed for the time
study of different machines and operations, according with
Magagnotti & Spinelli [26]:
- For the continuous timing method, a Psion WorkAbout�
hand-held data recorder with purpose-designed software
called Kronos 3.0� was used [27]. This was the method
chosen to follow felling and bunching with harvesters and
hauling off with forwarders. The abovementioned software
allows recording the time spent in each elemental operation
and different production parameters, such as distances,
number of trees and diameter classes. This software saves
time data in an MS Access� database.
- A work sampling method was chosen for the chipping
operation. A chronometer beeped every 60 s and the per-
formed work phase was marked in a previously designed
form.
Time studies are always combined with productivity con-
trol. The production was measured in different ways
depending on the type of operation: for operations with trees
or logs, the trees or logs were counted; for operations with
tractor loads, the number of trees or logs in each load or the
bulk chip volume was registered. In any case, the time dedi-
cated to a certain operation was related to the biomass weight
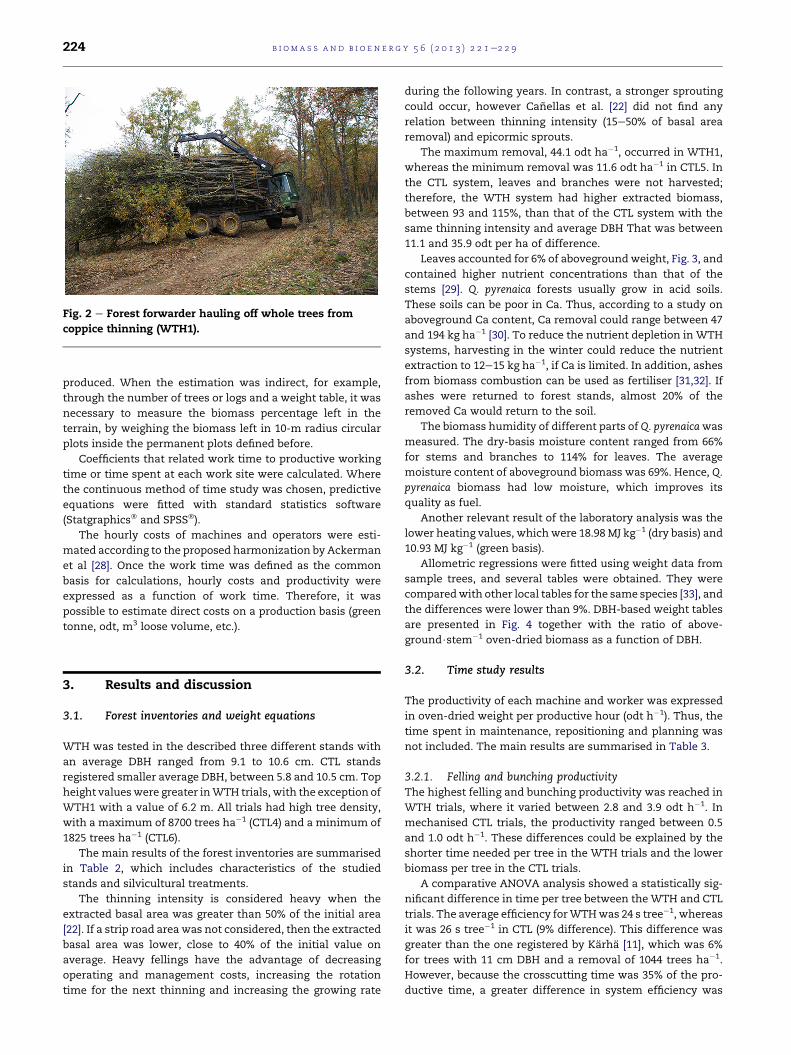
Fig. 2 e Forest forwarder hauling off whole trees from
coppice thinning (WTH1).
b i om a s s an d b i o e n e r g y 5 6 ( 2 0 1 3 ) 2 2 1e2 2 9224
produced. When the estimation was indirect, for example,
through the number of trees or logs and a weight table, it was
necessary to measure the biomass percentage left in the
terrain, by weighing the biomass left in 10-m radius circular
plots inside the permanent plots defined before.
Coefficients that related work time to productive working
time or time spent at each work site were calculated. Where
the continuous method of time study was chosen, predictive
equations were fitted with standard statistics software
(Statgraphics� and SPSS�).
The hourly costs of machines and operators were esti-
mated according to the proposed harmonization by Ackerman
et al [28]. Once the work time was defined as the common
basis for calculations, hourly costs and productivity were
expressed as a function of work time. Therefore, it was
possible to estimate direct costs on a production basis (green
tonne, odt, m3 loose volume, etc.).
3. Results and discussion
3.1. Forest inventories and weight equations
WTH was tested in the described three different stands with
an average DBH ranged from 9.1 to 10.6 cm. CTL stands
registered smaller average DBH, between 5.8 and 10.5 cm. Top
height valueswere greater inWTH trials, with the exception of
WTH1 with a value of 6.2 m. All trials had high tree density,
with a maximum of 8700 trees ha�1 (CTL4) and a minimum of
1825 trees ha�1 (CTL6).
The main results of the forest inventories are summarised
in Table 2, which includes characteristics of the studied
stands and silvicultural treatments.
The thinning intensity is considered heavy when the
extracted basal area was greater than 50% of the initial area
[22]. If a strip road area was not considered, then the extracted
basal area was lower, close to 40% of the initial value on
average. Heavy fellings have the advantage of decreasing
operating and management costs, increasing the rotation
time for the next thinning and increasing the growing rate
during the following years. In contrast, a stronger sprouting
could occur, however Canellas et al. [22] did not find any
relation between thinning intensity (15e50% of basal area
removal) and epicormic sprouts.
The maximum removal, 44.1 odt ha�1, occurred in WTH1,
whereas the minimum removal was 11.6 odt ha�1 in CTL5. In
the CTL system, leaves and branches were not harvested;
therefore, the WTH system had higher extracted biomass,
between 93 and 115%, than that of the CTL system with the
same thinning intensity and average DBH That was between
11.1 and 35.9 odt per ha of difference.
Leaves accounted for 6% of abovegroundweight, Fig. 3, and
contained higher nutrient concentrations than that of the
stems [29]. Q. pyrenaica forests usually grow in acid soils.
These soils can be poor in Ca. Thus, according to a study on
aboveground Ca content, Ca removal could range between 47
and 194 kg ha�1 [30]. To reduce the nutrient depletion in WTH
systems, harvesting in the winter could reduce the nutrient
extraction to 12e15 kg ha�1, if Ca is limited. In addition, ashes
from biomass combustion can be used as fertiliser [31,32]. If
ashes were returned to forest stands, almost 20% of the
removed Ca would return to the soil.
The biomass humidity of different parts of Q. pyrenaicawas
measured. The dry-basis moisture content ranged from 66%
for stems and branches to 114% for leaves. The average
moisture content of aboveground biomass was 69%. Hence, Q.
pyrenaica biomass had low moisture, which improves its
quality as fuel.
Another relevant result of the laboratory analysis was the
lower heating values, which were 18.98 MJ kg�1 (dry basis) and
10.93 MJ kg�1 (green basis).
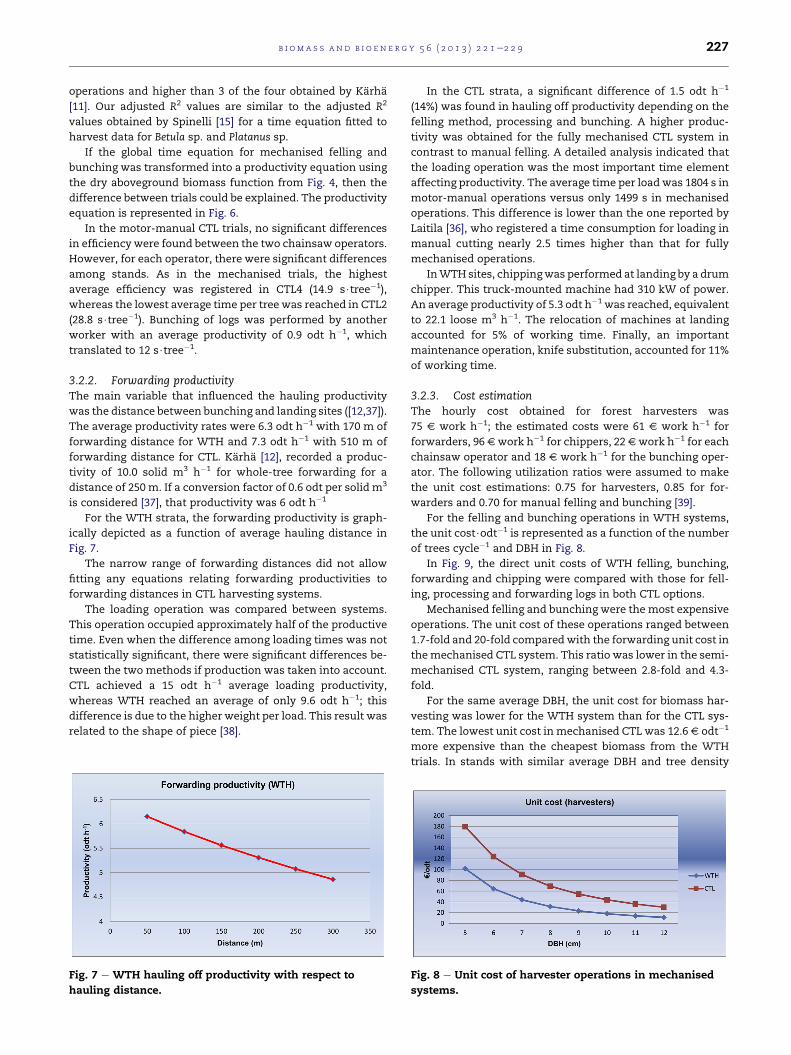
Allometric regressions were fitted using weight data from
sample trees, and several tables were obtained. They were
comparedwith other local tables for the same species [33], and
the differences were lower than 9%. DBH-based weight tables
are presented in Fig. 4 together with the ratio of above-
ground$stem�1 oven-dried biomass as a function of DBH.
3.2. Time study results
The productivity of each machine and worker was expressed
in oven-dried weight per productive hour (odt h�1). Thus, the
time spent in maintenance, repositioning and planning was
not included. The main results are summarised in Table 3.
3.2.1. Felling and bunching productivityThe highest felling and bunching productivity was reached in
WTH trials, where it varied between 2.8 and 3.9 odt h�1. In
mechanised CTL trials, the productivity ranged between 0.5
and 1.0 odt h�1. These differences could be explained by the
shorter time needed per tree in the WTH trials and the lower
biomass per tree in the CTL trials.
A comparative ANOVA analysis showed a statistically sig-
nificant difference in time per tree between theWTH and CTL
trials. The average efficiency forWTHwas 24 s tree�1, whereas
it was 26 s tree�1 in CTL (9% difference). This difference was
greater than the one registered by Karha [11], which was 6%
for trees with 11 cm DBH and a removal of 1044 trees ha�1.
However, because the crosscutting time was 35% of the pro-
ductive time, a greater difference in system efficiency was
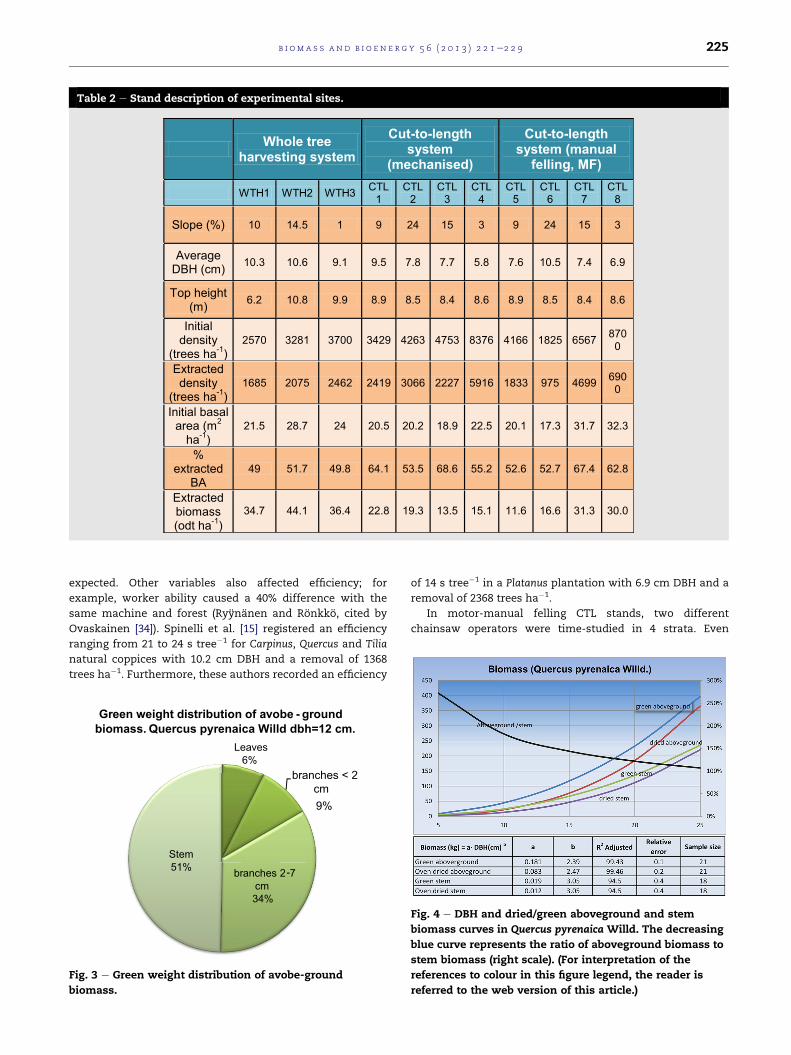
Table 2 e Stand description of experimental sites.
Whole tree
harvesting system
Cut-to-length
system
(mechanised)
Cut-to-length
system (manual
felling, MF)
WTH1 WTH2 WTH3 CTL1
CTL2
CTL3
CTL4
CTL5
CTL6
CTL7
CTL8
Slope (%) 10 14.5 1 9 24 15 3 9 24 15 3
Average DBH (cm) 10.3 10.6 9.1 9.5 7.8 7.7 5.8 7.6 10.5 7.4 6.9
Top height (m) 6.2 10.8 9.9 8.9 8.5 8.4 8.6 8.9 8.5 8.4 8.6
Initial density
(trees ha-1)2570 3281 3700 3429 4263 4753 8376 4166 1825 6567 870
0
Extracted density
(trees ha-1)1685 2075 2462 2419 3066 2227 5916 1833 975 4699 690
0
Initial basal area (m2
ha-1)21.5 28.7 24 20.5 20.2 18.9 22.5 20.1 17.3 31.7 32.3
% extracted
BA 49 51.7 49.8 64.1 53.5 68.6 55.2 52.6 52.7 67.4 62.8
Extracted biomass (odt ha-1)
34.7 44.1 36.4 22.8 19.3 13.5 15.1 11.6 16.6 31.3 30.0
b i om a s s a n d b i o e n e r g y 5 6 ( 2 0 1 3 ) 2 2 1e2 2 9 225
expected. Other variables also affected efficiency; for
example, worker ability caused a 40% difference with the
same machine and forest (Ryynanen and Ronkko, cited by
Ovaskainen [34]). Spinelli et al. [15] registered an efficiency
ranging from 21 to 24 s tree�1 for Carpinus, Quercus and Tilia
natural coppices with 10.2 cm DBH and a removal of 1368
trees ha�1. Furthermore, these authors recorded an efficiency
Leaves6%
branches < 2 cm
9%
branches 2-7 cm34%
Stem51%
Green weight distribution of avobe - ground
biomass. Quercus pyrenaica Willd dbh=12 cm.
Fig. 3 e Green weight distribution of avobe-ground
biomass.
of 14 s tree�1 in a Platanus plantation with 6.9 cm DBH and a
removal of 2368 trees ha�1.
In motor-manual felling CTL stands, two different
chainsaw operators were time-studied in 4 strata. Even
Fig. 4 e DBH and dried/green aboveground and stem
biomass curves in Quercus pyrenaica Willd. The decreasing
blue curve represents the ratio of aboveground biomass to
stem biomass (right scale). (For interpretation of the
references to colour in this figure legend, the reader is
referred to the web version of this article.)
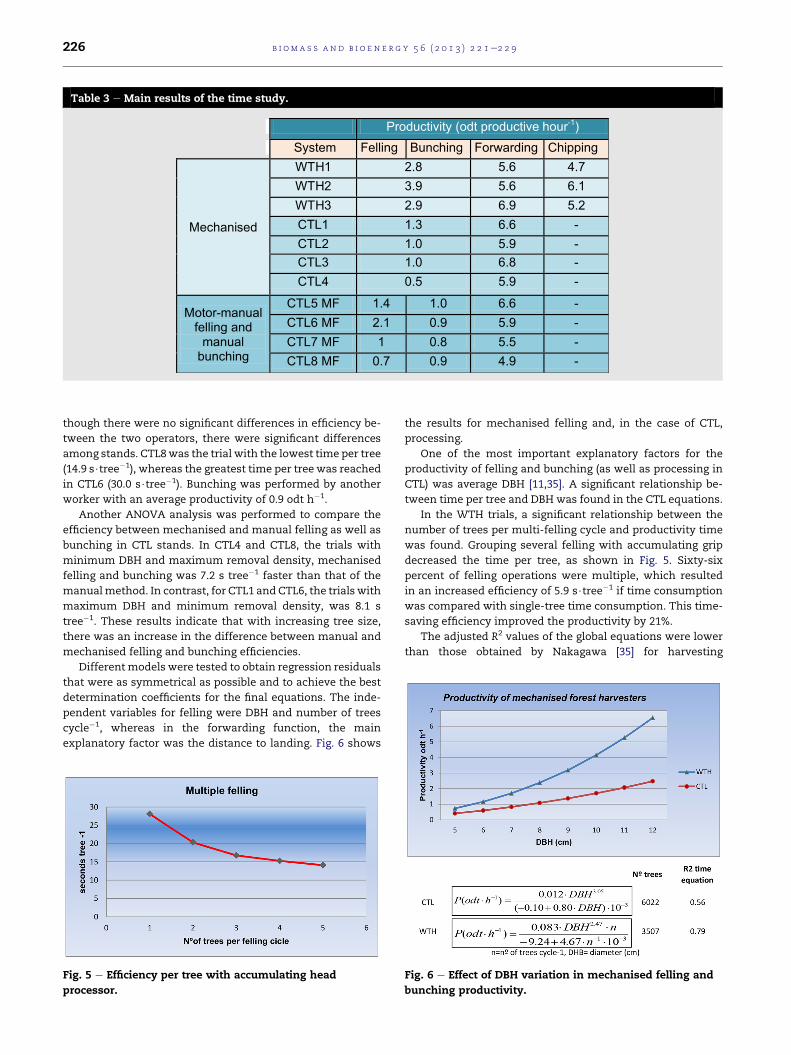
Table 3 e Main results of the time study.
Productivity (odt productive hour-1)System Felling Bunching Forwarding Chipping
Mechanised
WTH1 2.8 5.6 4.7WTH2 3.9 5.6 6.1WTH3 2.9 6.9 5.2CTL1 1.3 6.6 -CTL2 1.0 5.9 -CTL3 1.0 6.8 -CTL4 0.5 5.9 -
Motor-manual felling and
manual bunching
CTL5 MF 1.4 1.0 6.6 -CTL6 MF 2.1 0.9 5.9 -CTL7 MF 1 0.8 5.5 -CTL8 MF 0.7 0.9 4.9 -
b i om a s s an d b i o e n e r g y 5 6 ( 2 0 1 3 ) 2 2 1e2 2 9226
though there were no significant differences in efficiency be-
tween the two operators, there were significant differences
among stands. CTL8was the trial with the lowest time per tree
(14.9 s$tree�1), whereas the greatest time per tree was reached
in CTL6 (30.0 s$tree�1). Bunching was performed by another
worker with an average productivity of 0.9 odt h�1.
Another ANOVA analysis was performed to compare the
efficiency between mechanised and manual felling as well as
bunching in CTL stands. In CTL4 and CTL8, the trials with
minimum DBH and maximum removal density, mechanised
felling and bunching was 7.2 s tree�1 faster than that of the
manualmethod. In contrast, for CTL1 and CTL6, the trials with
maximum DBH and minimum removal density, was 8.1 s
tree�1. These results indicate that with increasing tree size,
there was an increase in the difference between manual and
mechanised felling and bunching efficiencies.
Differentmodels were tested to obtain regression residuals
that were as symmetrical as possible and to achieve the best
determination coefficients for the final equations. The inde-
pendent variables for felling were DBH and number of trees
cycle�1, whereas in the forwarding function, the main
explanatory factor was the distance to landing. Fig. 6 shows
Fig. 5 e Efficiency per tree with accumulating head
processor.
the results for mechanised felling and, in the case of CTL,
processing.
One of the most important explanatory factors for the
productivity of felling and bunching (as well as processing in
CTL) was average DBH [11,35]. A significant relationship be-
tween time per tree and DBH was found in the CTL equations.
In the WTH trials, a significant relationship between the
number of trees per multi-felling cycle and productivity time
was found. Grouping several felling with accumulating grip
decreased the time per tree, as shown in Fig. 5. Sixty-six
percent of felling operations were multiple, which resulted
in an increased efficiency of 5.9 s$tree�1 if time consumption
was compared with single-tree time consumption. This time-
saving efficiency improved the productivity by 21%.
The adjusted R2 values of the global equations were lower
than those obtained by Nakagawa [35] for harvesting
Fig. 6 e Effect of DBH variation in mechanised felling and
bunching productivity.
b i om a s s a n d b i o e n e r g y 5 6 ( 2 0 1 3 ) 2 2 1e2 2 9 227
operations and higher than 3 of the four obtained by Karha
[11]. Our adjusted R2 values are similar to the adjusted R2
values obtained by Spinelli [15] for a time equation fitted to
harvest data for Betula sp. and Platanus sp.
If the global time equation for mechanised felling and
bunching was transformed into a productivity equation using
the dry aboveground biomass function from Fig. 4, then the
difference between trials could be explained. The productivity
equation is represented in Fig. 6.
In the motor-manual CTL trials, no significant differences
in efficiencywere found between the two chainsaw operators.
However, for each operator, there were significant differences
among stands. As in the mechanised trials, the highest
average efficiency was registered in CTL4 (14.9 s$tree�1),
whereas the lowest average time per tree was reached in CTL2
(28.8 s$tree�1). Bunching of logs was performed by another
worker with an average productivity of 0.9 odt h�1, which
translated to 12 s$tree�1.
3.2.2. Forwarding productivityThe main variable that influenced the hauling productivity
was the distance between bunching and landing sites ([12,37]).
The average productivity rates were 6.3 odt h�1 with 170 m of
forwarding distance for WTH and 7.3 odt h�1 with 510 m of
forwarding distance for CTL. Karha [12], recorded a produc-
tivity of 10.0 solid m3 h�1 for whole-tree forwarding for a
distance of 250 m. If a conversion factor of 0.6 odt per solid m3
is considered [37], that productivity was 6 odt h�1
For the WTH strata, the forwarding productivity is graph-
ically depicted as a function of average hauling distance in
Fig. 7.
The narrow range of forwarding distances did not allow
fitting any equations relating forwarding productivities to
forwarding distances in CTL harvesting systems.
The loading operation was compared between systems.
This operation occupied approximately half of the productive
time. Even when the difference among loading times was not
statistically significant, there were significant differences be-
tween the two methods if production was taken into account.
CTL achieved a 15 odt h�1 average loading productivity,
whereas WTH reached an average of only 9.6 odt h�1; this
difference is due to the higher weight per load. This result was
related to the shape of piece [38].
Fig. 7 e WTH hauling off productivity with respect to
hauling distance.
In the CTL strata, a significant difference of 1.5 odt h�1
(14%) was found in hauling off productivity depending on the
felling method, processing and bunching. A higher produc-
tivity was obtained for the fully mechanised CTL system in
contrast to manual felling. A detailed analysis indicated that
the loading operation was the most important time element
affecting productivity. The average time per load was 1804 s in
motor-manual operations versus only 1499 s in mechanised
operations. This difference is lower than the one reported by
Laitila [36], who registered a time consumption for loading in
manual cutting nearly 2.5 times higher than that for fully
mechanised operations.
InWTH sites, chippingwas performed at landing by a drum
chipper. This truck-mounted machine had 310 kW of power.
An average productivity of 5.3 odt h�1 was reached, equivalent
to 22.1 loose m3 h�1. The relocation of machines at landing
accounted for 5% of working time. Finally, an important
maintenance operation, knife substitution, accounted for 11%
of working time.
3.2.3. Cost estimationThe hourly cost obtained for forest harvesters was
75 V work h�1; the estimated costs were 61 V work h�1 for
forwarders, 96Vwork h�1 for chippers, 22 Vwork h�1 for each
chainsaw operator and 18 V work h�1 for the bunching oper-
ator. The following utilization ratios were assumed to make
the unit cost estimations: 0.75 for harvesters, 0.85 for for-
warders and 0.70 for manual felling and bunching [39].
For the felling and bunching operations in WTH systems,
the unit cost$odt�1 is represented as a function of the number
of trees cycle�1 and DBH in Fig. 8.
In Fig. 9, the direct unit costs of WTH felling, bunching,
forwarding and chipping were compared with those for fell-
ing, processing and forwarding logs in both CTL options.
Mechanised felling and bunching were the most expensive
operations. The unit cost of these operations ranged between
1.7-fold and 20-fold comparedwith the forwarding unit cost in
themechanised CTL system. This ratio was lower in the semi-
mechanised CTL system, ranging between 2.8-fold and 4.3-
fold.
For the same average DBH, the unit cost for biomass har-
vesting was lower for the WTH system than for the CTL sys-
tem. The lowest unit cost in mechanised CTL was 12.6 V odt�1
more expensive than the cheapest biomass from the WTH
trials. In stands with similar average DBH and tree density
Fig. 8 e Unit cost of harvester operations in mechanised
systems.
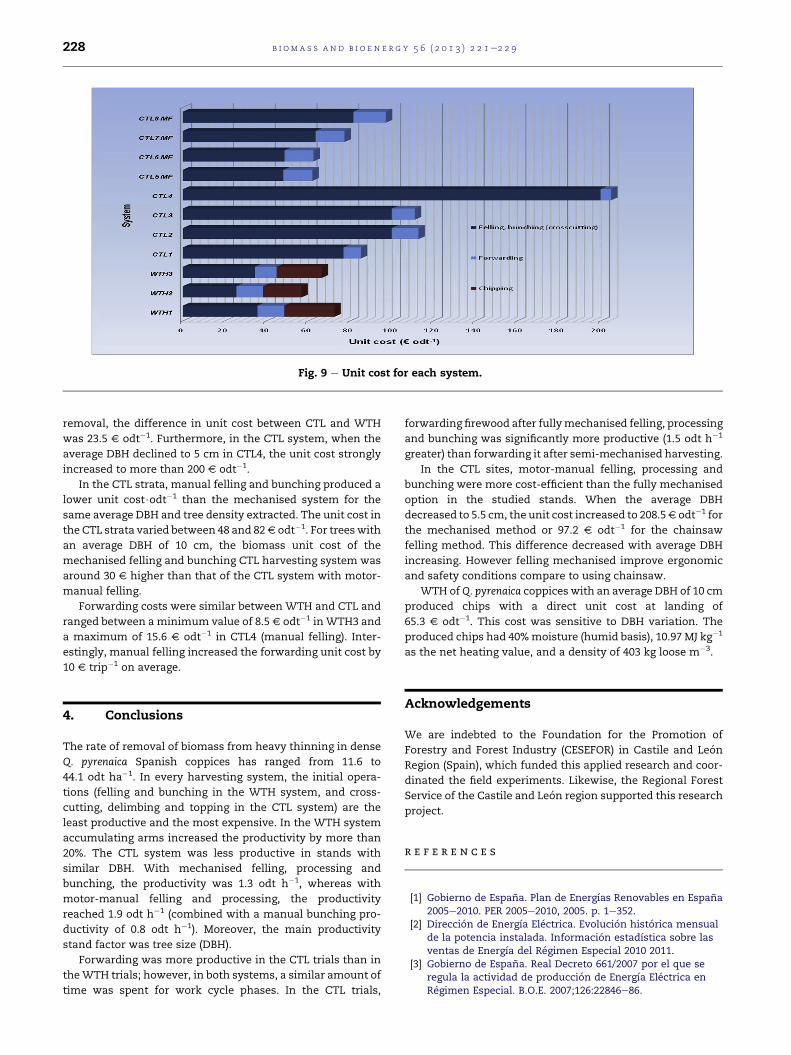
Fig. 9 e Unit cost for each system.
b i om a s s an d b i o e n e r g y 5 6 ( 2 0 1 3 ) 2 2 1e2 2 9228
removal, the difference in unit cost between CTL and WTH
was 23.5 V odt�1. Furthermore, in the CTL system, when the
average DBH declined to 5 cm in CTL4, the unit cost strongly
increased to more than 200 V odt�1.
In the CTL strata, manual felling and bunching produced a
lower unit cost$odt�1 than the mechanised system for the
same average DBH and tree density extracted. The unit cost in
the CTL strata varied between 48 and 82V odt�1. For treeswith
an average DBH of 10 cm, the biomass unit cost of the
mechanised felling and bunching CTL harvesting system was
around 30 V higher than that of the CTL system with motor-
manual felling.
Forwarding costs were similar between WTH and CTL and
ranged between a minimum value of 8.5 V odt�1 in WTH3 and
a maximum of 15.6 V odt�1 in CTL4 (manual felling). Inter-
estingly, manual felling increased the forwarding unit cost by
10 V trip�1 on average.
4. Conclusions
The rate of removal of biomass from heavy thinning in dense
Q. pyrenaica Spanish coppices has ranged from 11.6 to
44.1 odt ha�1. In every harvesting system, the initial opera-
tions (felling and bunching in the WTH system, and cross-
cutting, delimbing and topping in the CTL system) are the
least productive and the most expensive. In the WTH system
accumulating arms increased the productivity by more than
20%. The CTL system was less productive in stands with
similar DBH. With mechanised felling, processing and
bunching, the productivity was 1.3 odt h�1, whereas with
motor-manual felling and processing, the productivity
reached 1.9 odt h�1 (combined with a manual bunching pro-
ductivity of 0.8 odt h�1). Moreover, the main productivity
stand factor was tree size (DBH).
Forwarding was more productive in the CTL trials than in
theWTH trials; however, in both systems, a similar amount of
time was spent for work cycle phases. In the CTL trials,
forwarding firewood after fullymechanised felling, processing
and bunching was significantly more productive (1.5 odt h�1
greater) than forwarding it after semi-mechanised harvesting.
In the CTL sites, motor-manual felling, processing and
bunching were more cost-efficient than the fully mechanised
option in the studied stands. When the average DBH
decreased to 5.5 cm, the unit cost increased to 208.5V odt�1 for
the mechanised method or 97.2 V odt�1 for the chainsaw
felling method. This difference decreased with average DBH
increasing. However felling mechanised improve ergonomic
and safety conditions compare to using chainsaw.
WTH of Q. pyrenaica coppices with an average DBH of 10 cm
produced chips with a direct unit cost at landing of
65.3 V odt�1. This cost was sensitive to DBH variation. The
produced chips had 40%moisture (humid basis), 10.97 MJ kg�1
as the net heating value, and a density of 403 kg loose m�3.
Acknowledgements
We are indebted to the Foundation for the Promotion of
Forestry and Forest Industry (CESEFOR) in Castile and Leon
Region (Spain), which funded this applied research and coor-
dinated the field experiments. Likewise, the Regional Forest
Service of the Castile and Leon region supported this research
project.
r e f e r e n c e s
[1] Gobierno de Espana. Plan de Energıas Renovables en Espana2005e2010. PER 2005e2010, 2005. p. 1e352.
[2] Direccion de Energıa Electrica. Evolucion historica mensualde la potencia instalada. Informacion estadıstica sobre lasventas de Energıa del Regimen Especial 2010 2011.
[3] Gobierno de Espana. Real Decreto 661/2007 por el que seregula la actividad de produccion de Energıa Electrica enRegimen Especial. B.O.E. 2007;126:22846e86.
b i om a s s a n d b i o e n e r g y 5 6 ( 2 0 1 3 ) 2 2 1e2 2 9 229
[4] Gobierno de Espana. Plan de Accion Nacional de EnergıasRenovables de Espana 2011e2020 2010. p. 1e173.
[5] Junta de Castilla y Leon. Plan Regional de ambito sectorial dela bioenergıa de Castilla y Leon 2011. BOCyL no. 17.
[6] Junta de Castilla y Leon. Castilla y Leon crece con el bosque2005. p. 48.
[7] Adame P, Canellas I, Roig S, Del Rio M. Modelling dominantheight growth and site index curves for rebollo oak (Quercuspyrenaica Willd.). Ann For Sci 2006;63:929e40.
[8] Canga E, Prada M, Majada J. Modelizacion de la biomasaarborea y evaluacion de rendimientos y costes en una clarade Pinus pinaster para la obtencion de biomasa en Asturias.5 � Congreso Forestal Espanol 2009. p. 2e16.
[9] Canga E, Vivas A, Sanchez S. Estudio comparativo de dosempacadoras de residuos forestales en el norte de Espana.Progreso Forestal 2009;19:36e43.
[10] Sanz Infante F, Pineiro Veiras G. Aprovechamiento de labiomasa forestal producida por la cadena monte-industria.Parte I. Revista CIS Madera 2003:6e25.
[11] Karha K. Integrated harvesting of energy wood andpulpwood in first thinnings using the two-pile cuttingmethod. Biomass Bioenerg 2011;35:3397e403.
[12] Karha K. Whole-tree harvesting in young stands in Finland.For Stud 2006;45:118e34.
[13] Adebayo A, Han H, Johnson L. Productivity and cost of cut-to-length and whole-tree harvesting in a mixed-conifer stand.For Prod J 2007;57:59e69.
[14] Tolosana E, Laina R, Martınez F, Martin M, Ambrosio Y.Manual tecnico para el aprovechamiento y elaboracion debiomasa forestal. Madrid: Fucovasa; 2009.
[15] Spinelli R, Magagnotti N, Nati C. Options for the mechanizedprocession of hardwood trees in Mediterraean Forest. Int JFor Eng 2009;20:39e44.
[16] Magagnotti N, Pari L, Picchi G, Spinelli R. Energy biomassfrom the low-investment fully mechanized thinning ofhardwood plantations. Biomass Bioenerg 2012;47:195e200.
[17] Cavalli R, Confalonier M, Zamboni R. Approvvigionamento didendromassa per usi energetici. Sherwood 2003;87:11e6.
[18] Gallis C. Comparative cost estimation for forwarding small-sized beech wood with horses and mini-skidder in northernGreece. For Prod J 2004;54:84.
[19] Magagnotti N. Re-engineering firewood extraction intraditional Mediterranean coppice stands. Ecol Eng2012;38:45e50.
[20] Zimbalatti G, Proto AR. Cable logging opportunities forfirewood in Calabrian forests. Biosyst Eng 2009;102:63e8.
[21] Spinelli R, Magagnotti N, Lombardini C. Performance,capability and costs of small-scale cable yarding technology.Small-scale For 2010;9:123e35.
[22] Canellas I. Growth response to thinning in Quercus pyrenaicaWilld. coppice stands in Spanish central mountain. Ann ForSci 2004;61:243e50.
[23] Ruiz-PeinadoGertrudix R. Biomassmodels to estimate carbonstocks for hardwood tree species. For Syst 2012;21:42e52.
[24] Ter-Mikaelian MT, Korzukhin MD. Biomass equations forsixty-five North American tree species. For Ecol Manage1997;97:1e24.
[25] Jenkins J, Jennifer C, Chojnacky D, Heath L, Birdsey A.Comprehensive database of diameter-based biomassregressions for North American tree species 2004. NE-319: 45.
[26] Magagnotti N, Spinelli R. Good practice guidelines forbiomass production studies. Cost Action FP0902 2012;1:52.
[27] Ambrosio Y, Tolosana E. Estudios de tiempos y rendimientosen los trabajos forestales. El programa Kronos. RevistaMontes 2007;87:14e6.
[28] Ackerman P, Lyons J, Eliasson L, George H, Grulois S, Jong A.Equipment costing model. A business model 2011. p. 1e24.Cost Action FP0902.
[29] Rapp M, Santa Regina I, Rico M, Gallego HA. Biomass,nutrient content, litterfall and nutrient return to the soil inMediterranean oak forests. For Ecol Manage 1999;119:39e49.
[30] Santa Regina I. Biomass estimation and nutrient pools infour Quercus pyrenaica in Sierra de Gata Mountains,Salamanca, Spain. For Ecol Manage 2000;132:127e41.
[31] Ozolin�cius R, Buo�zyt _e R, Varnagiryt _e-Kaba�sinskien _e I. Woodash and nitrogen influence on ground vegetation cover andchemical composition. Biomass Bioenerg 2007;31:710e6.
[32] Solla-Gullon F, Taboada M, Rodrıguez-Soalleiro R,Merino A. Respuesta inicial del aporte de cenizas debiomasa arborea en el estado nutricional de unaplantacion joven de Pinus radiata D. Don. Invest Agrar: SistRecur For 2004;13:281e93.
[33] Gonzalez I. Tablas ponderales para la estimacion de labiomasa de rebollo (Quercus pyrenaica Willd.) en la provinciade Leon 1988. p. 56.
[34] Ovaskainen H, Palander T, Jauhiainen M, Lehtimaki J,Tikkanen L, Nurmi J. Productivity of Energywood harvestingChain in different stand conditions of Early thinnings. BalticFor 2008;14:149e54.
[35] Nakagawa M, Hayashi N, Narushima T. Effect of tree size ontime of each work element and processing productivity usingan excavator-based single-grip harvester or processor at alanding. J For Res 2010;15:226e33.
[36] Laitila J, Asikainen A, Nuutinen J. Forwarding of whole treesafter manual and mechanized felling bunching in pre-commercial thinnings. Int J For Eng 2007;18:29e39.
[37] Lindblad J, Aijala O, Koistinen A. Woodfuel measuring-guidebook to Finnish practical applications 2010. p. 1e10.
[38] Spinelli R, Magagnotti N. A tool for productivity and costforecasting of decentralised wood chipping. For Pol Econ2010;12:194e8.
[39] Ambrosio Y. Modelos de tiempos, rendimientos y costes delas operaciones semimecanizadas de aprovechamientos declaras de masas de Pinus sylvestris L; 2003.