product recognition using label and barcodes · barcode image is analyzed and the barcode number is...
TRANSCRIPT
International Research Journal of Engineering and Technology (IRJET) e-ISSN: 2395 -0056
Volume: 04 Issue: 03 | Mar -2017 www.irjet.net p-ISSN: 2395-0072
© 2017, IRJET | Impact Factor value: 5.181 | ISO 9001:2008 Certified Journal | Page 2576
PRODUCT RECOGNITION USING LABEL AND BARCODES
Rakshandaa.K1, Ragaveni.S2, Sudha Lakshmi.S3
1Student, Department of ECE, Prince Shri Venkateshwara Padmavathy Engineering College, Tamil Nadu, India 2Student, Department of ECE, Prince Shri Venkateshwara Padmavathy Engineering College, Tamil Nadu, India 3Assistant Professor, Department of ECE, Prince Shri Venkateshwara Padmavathy Engineering College, Tamil
Nadu, India
---------------------------------------------------------------------***---------------------------------------------------------------------Abstract - The process deals with product recognition for the blind, using label text as well as barcode of the same. The implementation is done using MATLAB. First, the Maximally Stable Extremal Region (MSER) algorithm is used to identify the Region of Interest (ROI) from the given input image, which would consist of the product label part. Using the background subtraction technique, the foreground is alone extracted and the remaining parts are neglected. After extracting the foreground, canny edge detection algorithm is used to find the boundaries of objects in ROI and those boundaries are enhanced using edge grow up algorithm. Optical Character Recognition (OCR) is the key algorithm which is used for extracting the label text from the given input image, irrespective of the font style of the label and no matter however complex the background maybe. Once the product name is extracted, the output is given in the form of speech using voice board and is also displayed using LCD by interfacing both with a microcontroller. Using the histogram equalization technique, the given barcode image is analyzed and the barcode number is alone extracted from the entire input. Once the number is extracted, it is searched through the database and the corresponding product details are identified and announced.
Key Words: Maximally Stable Extremal Region (MSER), Region of Interest, Canny edge detection, Background subtraction, Optical Character Recognition (OCR), Histogram equalization.
1. INTRODUCTION There are 314 million visually impaired people worldwide, of those 45 million are blind according to a report released by “World Health Organization” in 10 facts regarding blindness. Reading is obviously essential in today’s society. Developments in computer vision technologies are focusing on assisting these individuals. So the basic idea is to develop a camera based device which combines computer vision technology, to help the blind identify and understand the
products they buy and use in their day to day life. The focus revolves around designing a portable camera based assistive text and product label reading along with barcode recognition from hand held objects for blind person. In the currently available systems, portable bar code readers are designed to help blind people to identify different products in an extensive product database, which helps the blind users to access information about these products through speech. This system has a limitation that it is very hard for the blind users to find the position of the bar code and to correctly point the bar code reader at the bar code. Some reading assistive systems such as pen scanners might be employed in these and similar situations. Such systems integrate OCR software to offer the function of scanning and recognition of text and some have integrated voice output. However, these systems can be performed only for the document images with simple backgrounds, standard fonts, a small range of font sizes, and well-organized characters rather than with multiple decorative patterns. A number of portable reading assistants have been designed specifically for the visually impaired “K-Reader Mobile” runs on a cell phone and allows the user to read mail, receipts, fliers, and many other documents. However, the document to be read; must be nearly flat, placed on a clear, dark surface and contain mostly text. In addition, “K-Reader Mobile” accurately reads black print on a white background, but has problems recognizing colored text or text on a colored and complex background. Furthermore, these systems require a blind user to manually localize areas of interest and text regions on the objects in most cases. Even though a number of reading assistants have been designed specifically for the visually impaired, no existing reading assistant can read text from the kinds of challenging patterns and backgrounds found on many everyday commercial products such as text information can appear in various scales, fonts, colors, and orientations. There are various drawbacks of these existing systems like, the texts from non-uniform or complex backgrounds cannot be identified, the algorithms cannot process text strings fewer than three characters and for the barcode recognition, only the barcode number is read and the product details cannot be identified.
International Research Journal of Engineering and Technology (IRJET) e-ISSN: 2395 -0056
Volume: 04 Issue: 03 | Mar -2017 www.irjet.net p-ISSN: 2395-0072
© 2017, IRJET | Impact Factor value: 5.181 | ISO 9001:2008 Certified Journal | Page 2577
1.1 LABEL TEXT Reading is obviously essential in today’s society. Printed texts are everywhere in the form of reports, receipts, bank statements, restaurant menus, classroom handouts, product packages, instructions on medicine bottles, etc. And while optical aids, video magnifiers, and screen readers can help blind users and those with low vision to access documents, there are a few devices that can provide good access to common hand-held objects such as product packages and objects printed with text such as prescription medication bottles. The ability of people who are blind or having significant visual impairments to read printed labels and product packages will enhance independent living and foster economic and social self-sufficiency. So a system is proposed that will be useful to blind people for the aforementioned. The system framework consists of three functional components they are:
Scene Capture
Data Processing
Audio Output
The scene capture component collects scenes
containing objects of interest in the form of images; it
corresponds to a camera attached to a pair of
sunglasses or anywhere as per the requirement.
The data processing component is used for deploying the proposed algorithms, including following processes
Object-of-interest detection to carefully extract the image of the object held by the blind user from the clustered background or other neutral objects in the camera view.
Text localization is to obtain text containing image regions, then text recognition to transform image-based text information into readable codes.
The audio output component is to inform the blind user of the recognized text codes in the form of speech or audio. A Bluetooth earpiece with mini microphone or earpiece is employed for speech output. Thus blind persons will be well navigated if a system can tell them what the nearby text signage says. Blind persons will also encounter trouble in distinguishing objects when shopping. They can receive limited hints of an object from its shape and material by touch and smell, but miss descriptive labels printed on the object. Some reading-assistive systems, such as voice pen, might be employed in this situation.
1.2 BARCODE A barcode is an optical machine-readable representation of data relating to the object to which it is attached. Originally barcodes systematically represents data by varying the widths and spacing’s of parallel lines, and may be referred to as linear or one-dimensional (1D). Later they evolved into rectangles, dots, hexagons and other geometric patterns in two dimensions (2D). A barcode has several distinctive characteristics that can be used to distinguish it from the rest of an image, the first of which is that it contains black bars against a white background. Occasionally, a barcode may be printed in other colors than black and white, but the pattern of dark bars on a light background is roughly equivalent after the image has been converted to grayscale. Barcodes initially were scanned by special optical scanners called barcode readers. Generally, a simple barcode has five sections. They are-number system character, three guard bars, manufacturer code, product code, check digit. Number system character specifies the barcode type. Three guard bars indicate the start and end of the barcode, difference between manufacturer code and product code. Manufacturer code has a five digit number which is assigned to the manufacturer of the product. These codes are assigned and maintained by the Uniform Code Council (UCC). The product code is a five digit number that the manufacturer assigns for a particular product. Check Digit is also called as "self-check" digits. The check digit is used to recognize whether the other digits are read correctly.
Barcodes provide a convenient, cost-efficient, and accurate medium for data representation and are ubiquitous in modern society. However, barcodes are not human-readable and traditional devices for reading barcodes have not been widely adopted for personal use. This prohibits individuals from taking advantage of the information stored in barcodes. Image processing provides possibilities for resolving the discrepancy between the availability of barcodes and the capability to read them by enabling barcodes to be identified and read by software on general imaging devices. Barcodes may appear in an image at any orientation or size and multiple barcodes may be present. Additionally, complex backgrounds make picking out true barcodes from false positives a challenging process.
2. PROPOSED SYSTEM To overcome the problems in the existing system and also to assist blind persons to read text from those kinds of challenging patterns and backgrounds found on many everyday commercial products of Hand-held objects, a camera based assistive text reading technology is used in this project. In the proposed system the product can be identified by label reading and it can also be identified
International Research Journal of Engineering and Technology (IRJET) e-ISSN: 2395 -0056
Volume: 04 Issue: 03 | Mar -2017 www.irjet.net p-ISSN: 2395-0072
© 2017, IRJET | Impact Factor value: 5.181 | ISO 9001:2008 Certified Journal | Page 2578
through barcode recognition. The input image is captured using the web camera and processed using MATLAB for both label reading and bar code recognition. A region of interest is taken and a mixture of Gaussian based background subtraction techniques is used. Here in the region of interest, a novel text localization method is used to identify the texts. To get over the problems described in explanations and also to assist sightless individuals to read written text from those kinds of complicated styles and background scenes found on many day to day professional products of hand-held things, to draw out written text information and brand from complicated background scenes with several and varying written text styles, a written text localization criteria is suggested. In the proposed system adaptive threshold and histogram equalization are used for the recognition of barcode of the product. The recognizable barcode will be conformed, once it is conformed then the particular barcode details will be displayed.
The extracted output component is used to inform the
blind user of recognized text codes in the form of
speech or audio.
3. BLOCK DIAGRAMS
The proposed system involves two sections, one is reading of label text and the other is the recognition of barcodes. The sections are two separate entities and hence involve two different setups with different blocks. The label reading part comprises of software interfaced with hardware, while the barcode sections consists only of the software part. Both of the sections are predominantly based on MATLAB where all the image processing operations occur. Image is given as the input to both the sections and the image processing operations are carried out in the software part. The audio output of the label reading section is given through the hardware and for the barcode recognition, the audio output is obtained from the PC, directly as the software output. The block diagrams of both the sections are as shown below.
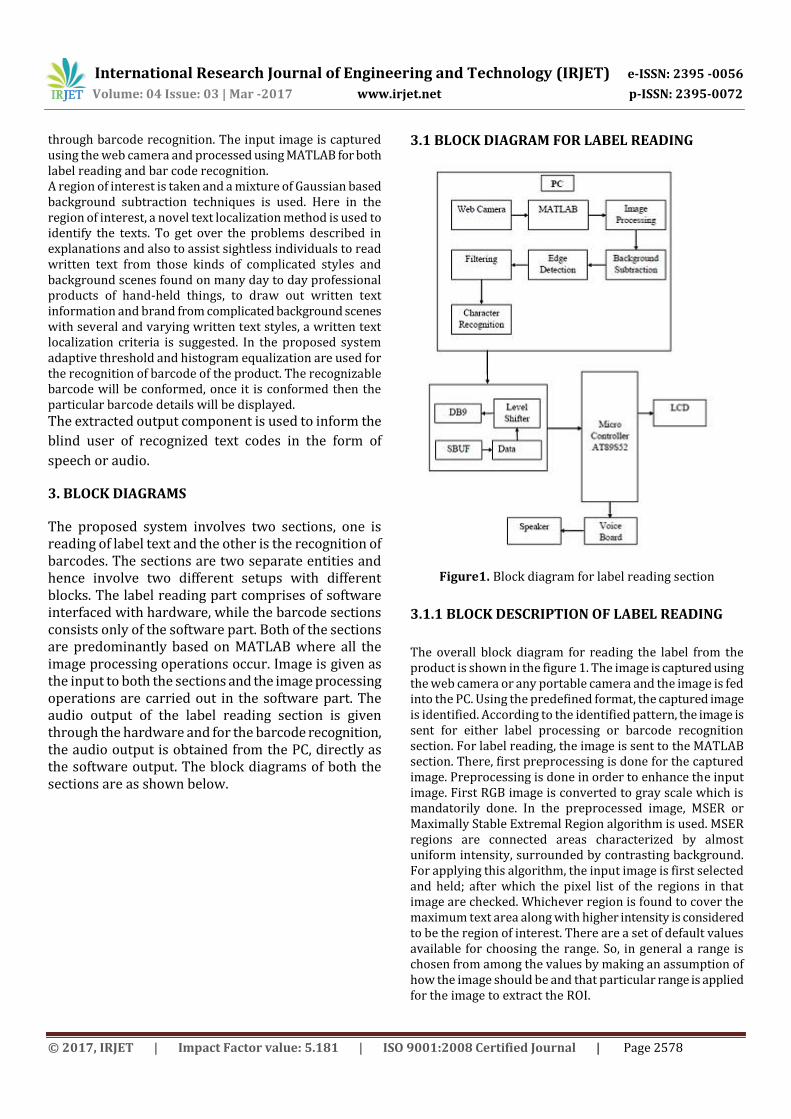
3.1 BLOCK DIAGRAM FOR LABEL READING
Figure1. Block diagram for label reading section
3.1.1 BLOCK DESCRIPTION OF LABEL READING
The overall block diagram for reading the label from the product is shown in the figure 1. The image is captured using the web camera or any portable camera and the image is fed into the PC. Using the predefined format, the captured image is identified. According to the identified pattern, the image is sent for either label processing or barcode recognition section. For label reading, the image is sent to the MATLAB section. There, first preprocessing is done for the captured image. Preprocessing is done in order to enhance the input image. First RGB image is converted to gray scale which is mandatorily done. In the preprocessed image, MSER or Maximally Stable Extremal Region algorithm is used. MSER regions are connected areas characterized by almost uniform intensity, surrounded by contrasting background. For applying this algorithm, the input image is first selected and held; after which the pixel list of the regions in that image are checked. Whichever region is found to cover the maximum text area along with higher intensity is considered to be the region of interest. There are a set of default values available for choosing the range. So, in general a range is chosen from among the values by making an assumption of how the image should be and that particular range is applied for the image to extract the ROI.
International Research Journal of Engineering and Technology (IRJET) e-ISSN: 2395 -0056
Volume: 04 Issue: 03 | Mar -2017 www.irjet.net p-ISSN: 2395-0072
© 2017, IRJET | Impact Factor value: 5.181 | ISO 9001:2008 Certified Journal | Page 2579
Background subtraction is a computational vision process of extracting foreground objects in a particular scene. A foreground object can be described as an object of attention which helps in reducing the amount of data to be processed as well as provide important information to the task under consideration. Here the background is removed or subtracted in which the label text is present. For this, the indices value or the value obtained using the MSER algorithm is taken. With the obtained indices value, the intensity values of the entire region are compared. If the values match with the indices value, then it is considered as true value, else it is taken as false value and the search resumes. Thus the foreground portion is alone extracted from the given ROI. Edge detection is the name for a set of mathematical methods which aim at identifying points in a digital image at which the image brightness changes sharply or, more formally, has discontinuities. The points at which image brightness changes sharply are typically organized into a set of curved line segments termed edges. Using this method, only the boundary of the label text or the region to be extracted is obtained. There are 3 types of edge detection techniques that are preferred in practice namely-Canny edge detection, Sobel edge detection and Prewitt. Of the three, canny edge detection is commonly used because here only the boundary region has to be processed unlike the other techniques where the inner details have to be processed in addition to the boundary. Once the skeleton of the ROI is obtained, edge grow up algorithm is used to check the correctness of the boundaries. In the edge grow up algorithm we use gradient method. Gradient is defined as the slope between the high and low contrast. By studying the growth of the gradient curves, the boundary perfection is verified. Filtering is used to remove any kind of unwanted information or noise from the given image. Here median filter is used for that purpose. The output from this section is a text box with the required label text in it. Morphological processes such as smoothening is done on the filtered image. The obtained text region is taken to apply OCR or optimal character recognition algorithm. It is an algorithm to read out printed texts using any photoelectric device or camera. The OCR comprises of many kinds of fonts and styles in its function which makes the identification of text strings easier. The text box is segmented and each segment is compared in the function database and the matched alphabet is considered as the output. Thus the required text is extracted using OCR. The result of OCR is a text string, which consists of the name of the product label as separate alphabets. The obtained output from the MATLAB section is to be sent to the hardware part or the Microcontroller part, for which serial data transfer mechanism, is made use of. For the serial data transfer, the obtained text string is first sent to the SBUF or the Serial Buffer which is used as a temporary storage for the data. The data in the SBUF is the transmitted in the form of frames using the data-frame section. In the data-frame part, the frame consists of 8 bits each with a corresponding start bit and a stop bit for each frame. Then the frames are transferred to the
microcontroller using DB9, which in turn acts as a connection establisher. Here a level shifter is used in addition to all these; since the PC and the wires have different operating voltages (The PC works at a voltage of 0 to +5v and the wires work at -12 to +12v).
The required data is thus sent to the microcontroller (PIC 16F877A) which displays the data through the corresponding output units like LCD, voice board etc. which are interfaced to the microcontroller using the respective codes. The LCD output is directly viewed while the voice output is received with an additional speaker unit.
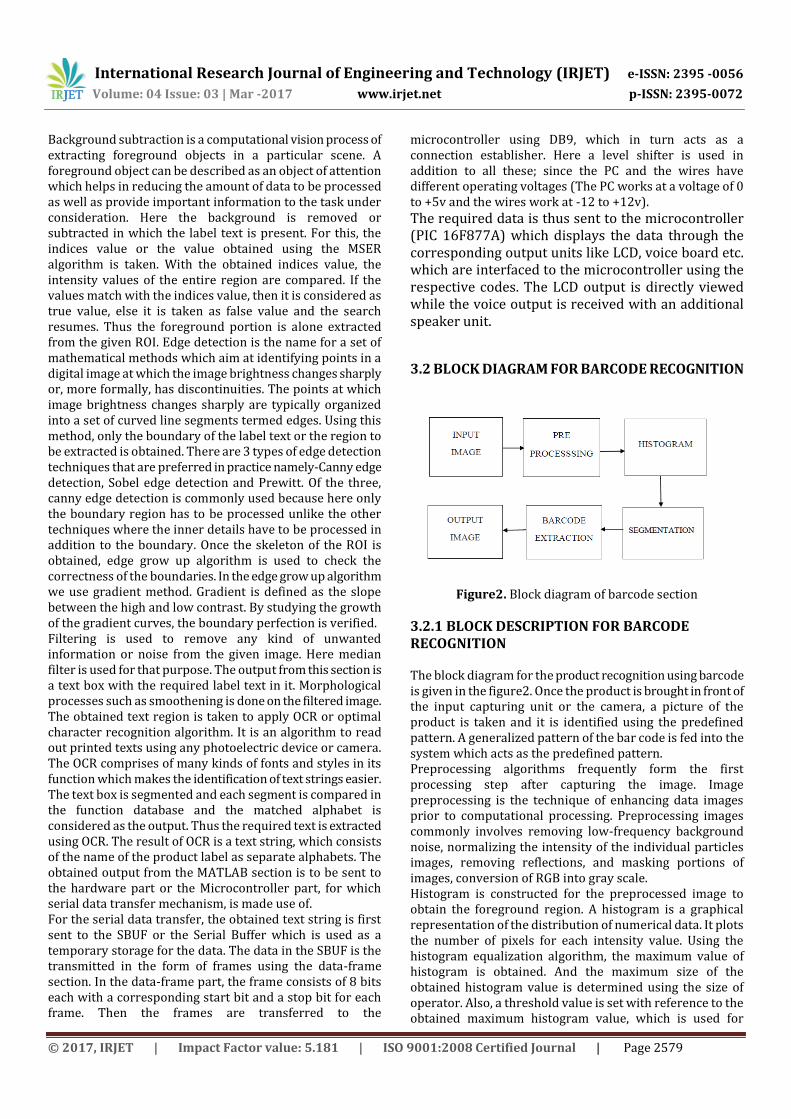
3.2 BLOCK DIAGRAM FOR BARCODE RECOGNITION
Figure2. Block diagram of barcode section
3.2.1 BLOCK DESCRIPTION FOR BARCODE RECOGNITION The block diagram for the product recognition using barcode is given in the figure2. Once the product is brought in front of the input capturing unit or the camera, a picture of the product is taken and it is identified using the predefined pattern. A generalized pattern of the bar code is fed into the system which acts as the predefined pattern. Preprocessing algorithms frequently form the first processing step after capturing the image. Image preprocessing is the technique of enhancing data images prior to computational processing. Preprocessing images commonly involves removing low-frequency background noise, normalizing the intensity of the individual particles images, removing reflections, and masking portions of images, conversion of RGB into gray scale. Histogram is constructed for the preprocessed image to obtain the foreground region. A histogram is a graphical representation of the distribution of numerical data. It plots the number of pixels for each intensity value. Using the histogram equalization algorithm, the maximum value of histogram is obtained. And the maximum size of the obtained histogram value is determined using the size of operator. Also, a threshold value is set with reference to the obtained maximum histogram value, which is used for
International Research Journal of Engineering and Technology (IRJET) e-ISSN: 2395 -0056
Volume: 04 Issue: 03 | Mar -2017 www.irjet.net p-ISSN: 2395-0072
© 2017, IRJET | Impact Factor value: 5.181 | ISO 9001:2008 Certified Journal | Page 2580
further segmentation processes. Image segmentation is the process of partitioning a digital image into multiple segments. Image segmentation is typically used to locate objects and boundaries (lines, curves, etc.) in images. Here, we define black as 0 and white as 1 in order to identify the text region alone from the background. But we know that both the lines as well as the barcode number are given in black. For eliminating the lines, we check the continuity of the detected black areas. If the value is 0 for a continuous range, then it is identified as lines and it is changed into white using the complementing function. Thus the barcode number is alone obtained as a string at the end of segmentation process.
Using the histogram value, the image is separated into left and right structures after segmentation. An array of numbers is introduced and then it is compared with the obtained string. Wherever the numbers of the array and the obtained strings match, those numbers are alone taken and concatenated. The resultant string of numbers is the required product barcode number. The obtained result is then run through the database which consists of preloaded information of products along with the corresponding barcodes. When the search results match, the product is identified and its details are read out in the PC.
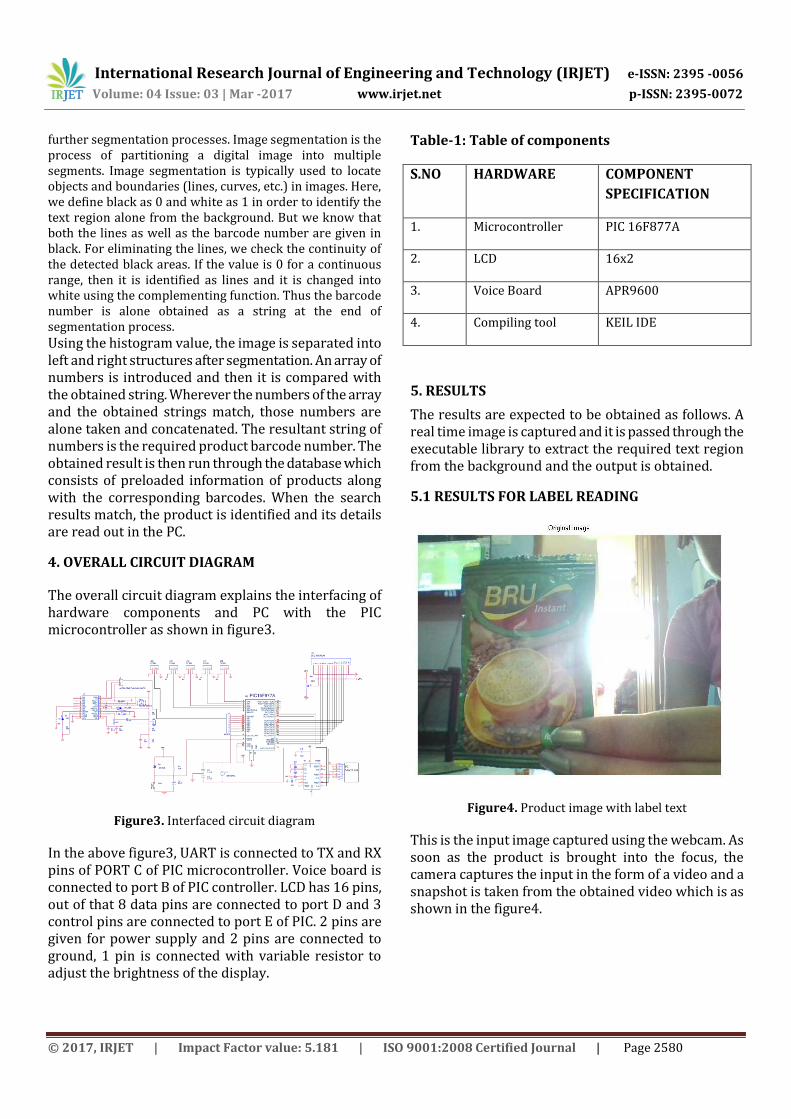
4. OVERALL CIRCUIT DIAGRAM
The overall circuit diagram explains the interfacing of hardware components and PC with the PIC microcontroller as shown in figure3.
Figure3. Interfaced circuit diagram
In the above figure3, UART is connected to TX and RX pins of PORT C of PIC microcontroller. Voice board is connected to port B of PIC controller. LCD has 16 pins, out of that 8 data pins are connected to port D and 3 control pins are connected to port E of PIC. 2 pins are given for power supply and 2 pins are connected to ground, 1 pin is connected with variable resistor to adjust the brightness of the display.
Table-1: Table of components
S.NO HARDWARE COMPONENT
SPECIFICATION
1. Microcontroller PIC 16F877A
2. LCD 16x2
3. Voice Board APR9600
4. Compiling tool KEIL IDE
5. RESULTS
The results are expected to be obtained as follows. A real time image is captured and it is passed through the executable library to extract the required text region from the background and the output is obtained.
5.1 RESULTS FOR LABEL READING
Figure4. Product image with label text
This is the input image captured using the webcam. As soon as the product is brought into the focus, the camera captures the input in the form of a video and a snapshot is taken from the obtained video which is as shown in the figure4.
International Research Journal of Engineering and Technology (IRJET) e-ISSN: 2395 -0056
Volume: 04 Issue: 03 | Mar -2017 www.irjet.net p-ISSN: 2395-0072
© 2017, IRJET | Impact Factor value: 5.181 | ISO 9001:2008 Certified Journal | Page 2581
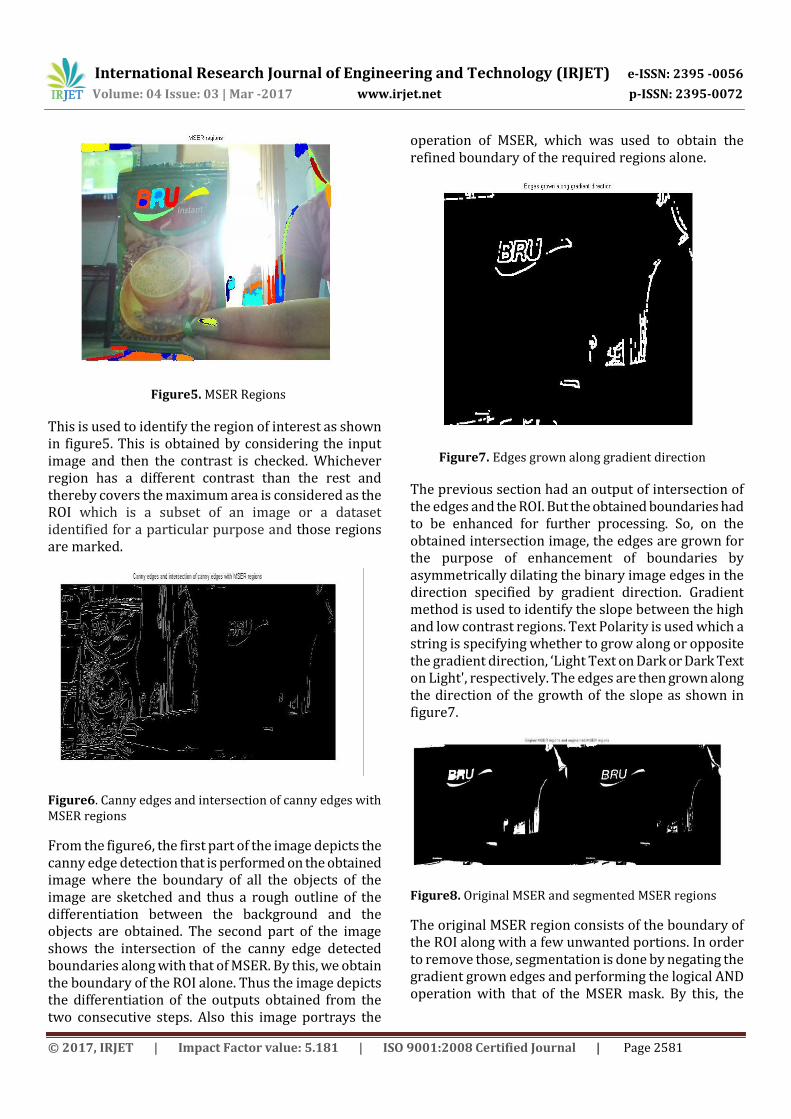
Figure5. MSER Regions
This is used to identify the region of interest as shown in figure5. This is obtained by considering the input image and then the contrast is checked. Whichever region has a different contrast than the rest and thereby covers the maximum area is considered as the ROI which is a subset of an image or a dataset identified for a particular purpose and those regions are marked.
Figure6. Canny edges and intersection of canny edges with MSER regions
From the figure6, the first part of the image depicts the canny edge detection that is performed on the obtained image where the boundary of all the objects of the image are sketched and thus a rough outline of the differentiation between the background and the objects are obtained. The second part of the image shows the intersection of the canny edge detected boundaries along with that of MSER. By this, we obtain the boundary of the ROI alone. Thus the image depicts the differentiation of the outputs obtained from the two consecutive steps. Also this image portrays the
operation of MSER, which was used to obtain the refined boundary of the required regions alone.
Figure7. Edges grown along gradient direction
The previous section had an output of intersection of the edges and the ROI. But the obtained boundaries had to be enhanced for further processing. So, on the obtained intersection image, the edges are grown for the purpose of enhancement of boundaries by asymmetrically dilating the binary image edges in the direction specified by gradient direction. Gradient method is used to identify the slope between the high and low contrast regions. Text Polarity is used which a string is specifying whether to grow along or opposite the gradient direction, ‘Light Text on Dark or Dark Text on Light', respectively. The edges are then grown along the direction of the growth of the slope as shown in figure7.
Figure8. Original MSER and segmented MSER regions
The original MSER region consists of the boundary of the ROI along with a few unwanted portions. In order to remove those, segmentation is done by negating the gradient grown edges and performing the logical AND operation with that of the MSER mask. By this, the
International Research Journal of Engineering and Technology (IRJET) e-ISSN: 2395 -0056
Volume: 04 Issue: 03 | Mar -2017 www.irjet.net p-ISSN: 2395-0072
© 2017, IRJET | Impact Factor value: 5.181 | ISO 9001:2008 Certified Journal | Page 2582
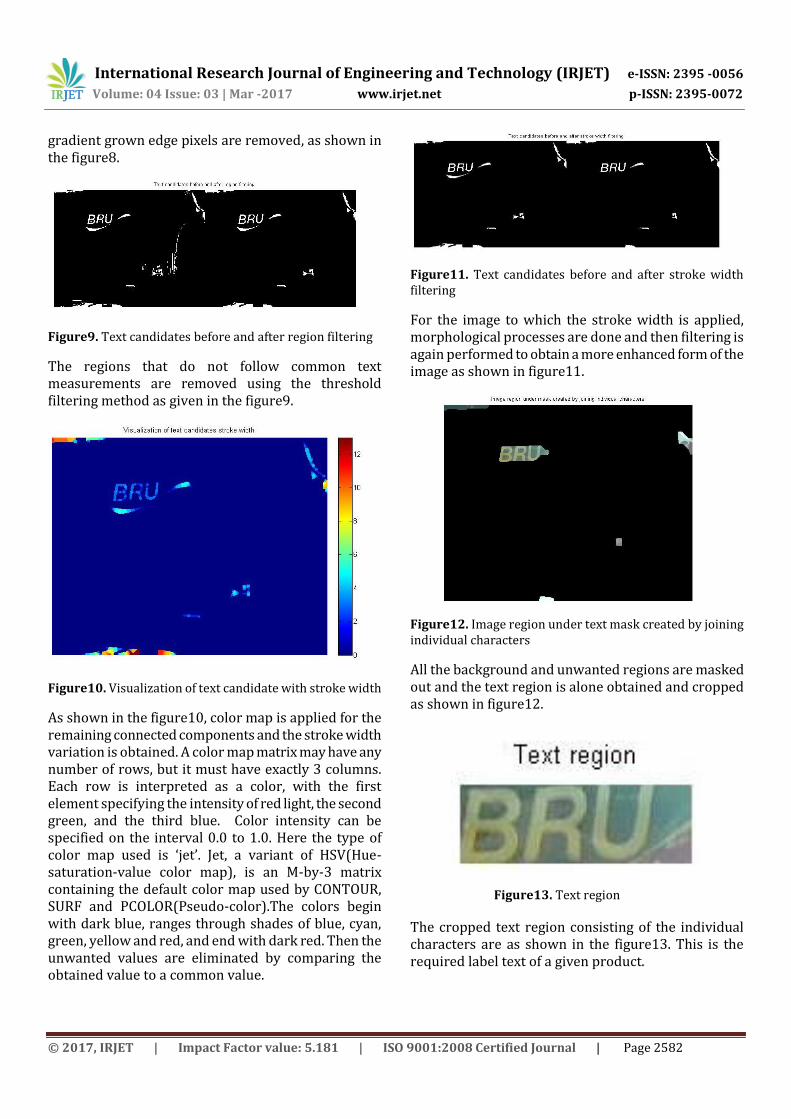
gradient grown edge pixels are removed, as shown in the figure8.
Figure9. Text candidates before and after region filtering
The regions that do not follow common text measurements are removed using the threshold filtering method as given in the figure9.
Figure10. Visualization of text candidate with stroke width
As shown in the figure10, color map is applied for the remaining connected components and the stroke width variation is obtained. A color map matrix may have any number of rows, but it must have exactly 3 columns. Each row is interpreted as a color, with the first element specifying the intensity of red light, the second green, and the third blue. Color intensity can be specified on the interval 0.0 to 1.0. Here the type of color map used is ‘jet’. Jet, a variant of HSV(Hue-saturation-value color map), is an M-by-3 matrix containing the default color map used by CONTOUR, SURF and PCOLOR(Pseudo-color).The colors begin with dark blue, ranges through shades of blue, cyan, green, yellow and red, and end with dark red. Then the unwanted values are eliminated by comparing the obtained value to a common value.
Figure11. Text candidates before and after stroke width filtering
For the image to which the stroke width is applied, morphological processes are done and then filtering is again performed to obtain a more enhanced form of the image as shown in figure11.
Figure12. Image region under text mask created by joining individual characters
All the background and unwanted regions are masked out and the text region is alone obtained and cropped as shown in figure12.
Figure13. Text region
The cropped text region consisting of the individual characters are as shown in the figure13. This is the required label text of a given product.
International Research Journal of Engineering and Technology (IRJET) e-ISSN: 2395 -0056
Volume: 04 Issue: 03 | Mar -2017 www.irjet.net p-ISSN: 2395-0072
© 2017, IRJET | Impact Factor value: 5.181 | ISO 9001:2008 Certified Journal | Page 2583
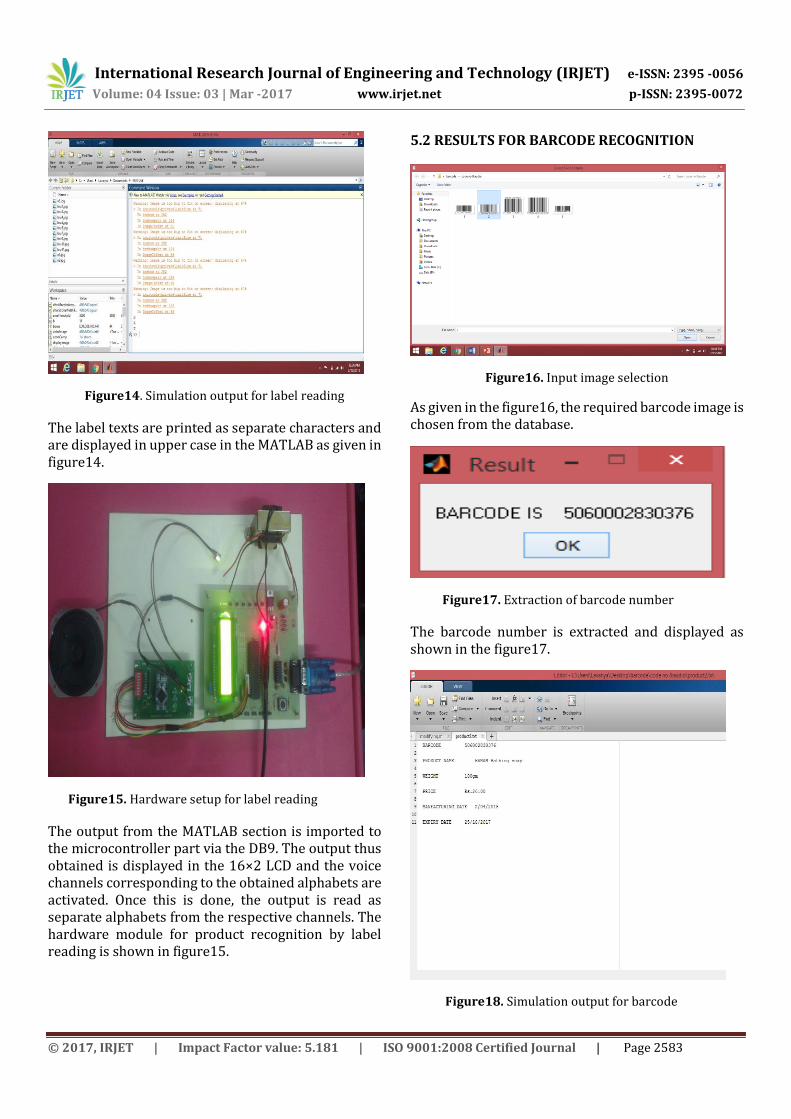
Figure14. Simulation output for label reading
The label texts are printed as separate characters and are displayed in upper case in the MATLAB as given in figure14.
Figure15. Hardware setup for label reading
The output from the MATLAB section is imported to the microcontroller part via the DB9. The output thus obtained is displayed in the 16×2 LCD and the voice channels corresponding to the obtained alphabets are activated. Once this is done, the output is read as separate alphabets from the respective channels. The hardware module for product recognition by label reading is shown in figure15.
5.2 RESULTS FOR BARCODE RECOGNITION
Figure16. Input image selection
As given in the figure16, the required barcode image is chosen from the database.
Figure17. Extraction of barcode number
The barcode number is extracted and displayed as shown in the figure17.
Figure18. Simulation output for barcode
International Research Journal of Engineering and Technology (IRJET) e-ISSN: 2395 -0056
Volume: 04 Issue: 03 | Mar -2017 www.irjet.net p-ISSN: 2395-0072
© 2017, IRJET | Impact Factor value: 5.181 | ISO 9001:2008 Certified Journal | Page 2584
All the product details such as barcode number, name of the product, weight, price, manufacturing date and the expiry date are displayed from the database as shown in the figure18 and audio output is also given.
6. CONCLUSIONS A novel method has been presented to aid the blind people to recognize the products they buy and use in their day to day life. The simplicity of the proposed system itself makes it more advantageous as it is handy and reliable. Unlike the earlier versions of the device, this proposed system has additional add-on features that include ability to read from complex backgrounds, processing text strings that have fewer than 3 characters, identifying correct characters irrespective of the style of fonts used. All these features give an immense distinguishing and more efficiency than the previous systems. In the barcode recognition section also, many improvisations of the existing models are implemented. In addition to the barcode number, the other product details are also identified and announced. More efficient techniques are employed to read the barcode number from the given image. This additional feature of identifying all the product details using the extracted barcode is of immense use to the blind people. This can be used in real-time for shopping, in homes as well as schools for the blind. This can be enhanced by integrating both the sections in a same hardware.
REFERENCES [1] Chucai Yi and Yingli Tian (2011) ‘Assistive text reading
from complex background for blind persons’, in Proc. Int. Workshop Camera-Based Document Anal. Recognit, Vol. LNCS-7139, pp. 15–28.
[2] Chucai Yi and Yingli Tian (2011) ‘Text string detection from natural scenes by structure based partition and grouping’, IEEE Trans. Image Process., Vol. 20, No. 9, pp. 2594–2605.
[3] Chucai Yi and Yingli Tian (2012) ‘Localizing Text in Scene Images by Boundary Clustering, Stroke Segmentation, and String Fragment Classification’, IEEE.
[4] Daniel Ratna Raju, P. and Neelima, G. (2012) ‘Image Segmentation by using Histogram Thresholding’, IJCSET Vol 2, Issue 1,776-779.
[5] Dridi, N., Delignon, Y., Sawaya, W. and Septier, F. (2010) ‘Blind detection of severely blurred 1D barcode’, in Proc. GLOBECOM, pp.1-5.
[6] Liang, J.,Doermann, D. and Li, H. (2005) ‘Camera-based analysis of text and documents: A survey’, Int. J. Document Anal. Recognit, Vol. 7, Nos. 2–3, pp84–104.
[7] Rajkumar, N., Anand, M.G., Barathiraja, N. (2014) ‘Portable Camera-Based Product Label Reading For Blind People’, IJETT Vol.10, No. 11.
[8] Sree Dhurga, K. and Logisvary, V. (2015) ‘An Image Blur Estimation Scheme For Severe Out Of Focus Images While Scanning Linear Barcodes’, IEEE.