product design and distance measurement using rssi and lqimahlert/rssi/rssi2distance.pdf · rssi...
TRANSCRIPT

Product Design and Distance Measurement Using RSSI and LQI
A Product Design and Implementation with a Study of RSSI and LQI over Distance
Tom Mahler – 204639926
Ido Bayda - 204687404
Tel-Aviv University
2
Table of Contents
Abstract ............................................................................................................................................6
1 Introduction ..........................................................................................................................7
1.1 Document structure ........................................................................................................7
2 The Lost Dog Problem .........................................................................................................8
2.1 Challenges for Our Product ...........................................................................................8
2.1.1 The Technical Challenges We Aim to be Capable of Solving: .......................................... 9
2.1.2 The Costumer QoS challenges We Aim to be Capable of Solving: ................................... 9
2.2 Theoretical Solutions ...................................................................................................10
2.2.1 Suggested Solution for Technical Challenges: ................................................................. 10
3 Evaluating Distance from RSSI and LQI Experiment .......................................................11
3.1 Theoretical Background ...............................................................................................11
3.1.1 RSSI and LQI .................................................................................................................... 11
3.1.2 Measuring RSSI with the CC2420 .................................................................................... 13
3.1.3 Measuring LQI with the CC2420 ..................................................................................... 14
3.2 Setup, Logging and Analysis .......................................................................................14
3.2.1 Setting up the Experiment ................................................................................................. 14
3.2.2 Logging the Experiment ................................................................................................... 15
3.2.3 Analysis Methods.............................................................................................................. 15
3.3 Experiments and Results ..............................................................................................17
3.3.1 Scenario............................................................................................................................. 17
3.3.2 Data collection and results ................................................................................................ 19
3.4 Conclusions ..................................................................................................................20
4 Product design ....................................................................................................................21
3
4.1 Software Design ...........................................................................................................21
4.2 Hardware Design .........................................................................................................23
5 Implementation ..................................................................................................................24
5.1 Software Implementation .............................................................................................24
5.1.1 Measuring Distance .......................................................................................................... 25
5.1.2 User interface .................................................................................................................... 26
5.2 Hardware implementation ............................................................................................27
6 Conclusion .........................................................................................................................29
7 Biography ...........................................................................................................................30
4
Table of Figures
Figure 3.1: RSSI Coverage [dBm] .................................................................................................12
Figure 3.2: Engineer's faculty LOS ................................................................................................12
Figure 3.3: Computer's setup .........................................................................................................12
Figure 3.4: RSSI vs. Distance.. ......................................................................................................19
Figure 3.5: LQI vs. Distance.. ........................................................................................................02
Figure 5.1: Schematics for the 10-pin expansion connector. .........................................................20
Figure 5.2: The receiver with the buzzer connection. ....................................................................20
Figure 5.3: Partial schematics for the microcontroller ...................................................................28
Figure 5.4: Schematics for the microcontroller .............................................................................28
5
Table of Equations
Eq. 3.1……………………………………………………………………………………13
Eq. 3.2……………………………………………………………………………………16
Eq. 3.3…………………………………………………………………………………....16
Eq. 5.1…………………………………………………………………………………....25
Eq. 5.2…………………………………………………………………………………....25
Abstract 2014 Tom Mahler and Ido Bayda
6
Abstract
In today's world many devices, such as the Moteiv’s TelosB/Tmote Sky device, support
wireless connectivity. We want to enable these devices the ability to estimate distance without
need of additional hardware.
This paper presents a design and implementation of a product aimed for commercial
purposes, based on TelosB device. This design can be implemented immediately, however more
research could significantly improve performance.
Moreover, this paper presents our research on the relationship between RSSI and LQI
values and distance. Our findings show that there is indeed a connection, however is subjected to
strong assumption on the environment. Therefore we believe that more research can lead to a
stronger connection for a general environment.
Introduction 2014 Tom Mahler and Ido Bayda
7
1 Introduction
This paper, together with the implementation of it on the Moteiv’s TelosB/Tmote Sky, is
presented as final project for the course “Embedded Computing Course”, taught by Prof. Sivan
Toledo at Tel Aviv University in the winter semester of 2014.
We began our project with an idea based on an everyday challenge that dog owners have:
losing the pet in an off-leash park while being distracted. We then tried to solve this problem
using the TelosB device, specifically the RSSI and LQI produced by the Chipcon CC2420
[CC07] radio for wireless communications features, in order to measure the distance between the
dog and the owner.
For that we conducted a research in which we found out a connection between the
distance, the RSSI value and the LQI value. After solving the problem theoretically, we designed
a product aimed to fill costumer needs. Our software design includes both implementation of our
research results and costumer's quality of service (QoS) in order to give a good costumer
experience. Our hardware design includes mainly adding features to the TelosB sky.
1.1 Document structure
The paper is roughly divided into 5 major parts. The first part of the paper describes the
basic idea and problem we want to solve in of our project. The second part describes the research
we conducted in order to evaluate distance from the RSSI and the LQI. The third part describes
our software and hardware design of our product. The forth part describes our software and
hardware implementation. Finally our last part discusses our conclusions.
The Lost Dog Problem 2014 Tom Mahler and Ido Bayda
8
2 The Lost Dog Problem
We first define the problem: a dog owner walks with her dog in an off-leash park and
release the dog from the leash. For some reason (maybe a phone call or a random day-dream) the
owner is distracted for a short time and when she looks for the dog she can't find him. Our
product aims to give a solution for that problem both in alerting the owner that the dog is
faraway and in finding it.
2.1 Challenges for Our Product
We begin by examining some technical difficulties in the Lost Dog problem, regarding
the environment and terrain that we predict to have, the physical boundaries and capabilities of
the Tmote sky device, the distance measuring technique etc. Then we examine some costumer
QoS challenges we wish to achieve including customizing features that support different
costumer needs.
We now list the most challenging problems we want to solve (Note that even though
solving the problems listed below is our goal, we do not give a full implemented solution to all
of them and leave it to possible future work).

The Lost Dog Problem 2014 Tom Mahler and Ido Bayda
9
2.1.1 The Technical Challenges We Aim to be Capable of Solving:
1. Measuring distance between devices: the Tmote Sky device does not include a
designated hardware for conveniently measure distance between devices such as
GPS. The Chipcon CC2420 can produce RSSI and LQI values that might
theoretically be converted into distance. The problem is that they are not always
stable so samples could sometime be very far from the predicted results. This is a
major problem that does not yet have a solution. There have been several works done
regarding this topic, however not enough.
2. An environment challenge: The product is meant for outdoor use in large1 parks and
gardens. Such environment is challenging since on the one hand, the environment
consists of static obstacles such as trees, bushes, parking cars, benches etc. And on
the other hand, moving obstacles such as people, other animals, driving cars and so
on. This causes the RSSI and LQI to be unstable, hence challenging.
2.1.2 The Costumer QoS challenges We Aim to be Capable of Solving:
1. Hardware properties and limitations: The device has limited features. For example,
there is no speaker/buzzer which is necessary in order to alert the owner of the dog
being lost. Another example is that there is only one user button which is very small
and not easy to press. Moreover, the device is completely exposed. This makes the
product very vulnerable and not appealing for a costumer to buy.
1 Large enough for a dog to be lost in.
The Lost Dog Problem 2014 Tom Mahler and Ido Bayda
10
2. Software challenges: Low level programing makes it difficult to intuitively write
codes in general and high-level codes consisting of costumer QoS and advanced
features in particular. Therefore, it is hard to make this product an open source in
order to let developers add additional features such as apps and to release software
updates after the products release.
2.2 Theoretical Solutions
We now present our suggestions for solutions to the challenges we face. We then try to
implement some of them and show how we managed to do so.
2.2.1 Suggested Solution for Technical Challenges:
1. Evaluating distance from the RSSI and LQI: We conduct a research to study the
connection between LQI, RSSI and distance. Though not much previous work was
done regarding this topic, we hope that some would be helpful to our research.
2. RSSI and LQI instability: Taking the average of several samples may increase
stability.
3. A challenging environment2: We develop a simple model aiming to solve the problem
assuming ideal environment conditions, meaning an open environment with a clear
LOS3. This will provide a good basis for researchers to later on develop a more
complex model for general environment.
2 See section 2.1.1 challenge number 2
3 Line of Sight.
Evaluation Distance from
RSSI and LQI Experimnent 2014 Tom Mahler and Ido Bayda
11
3 Evaluating Distance from RSSI and LQI Experiment
In this chapter we explain about the research that we did in order to evaluate distance
from RSSI and LQI. We begin by going over some basic theoretical background and explaining
the technical specifications of our experiment's setup. We then show what we did in the
experiment and the results we found. Finally we present our research conclusions.
3.1 Theoretical Background
We now give background about information that we think is important in order to
understand what we did. We assume that the reader is familiar with computer networks,
operating systems and of course with our device and in particular with the Chipcon CC2420
radio for wireless communications.
3.1.1 RSSI and LQI
RSSI stands for Radio Signal Strength Indicator is a measurement of the total power in a
received radio signal in milliwatts. The RSSI value is measured in dBm (logarithmic scale),
typically ranges between -50 dBm for a very strong signal level and -110 dBm for a very low
signal level [SA10]. Quantization noise and circuit usually limits the lower bound.
Evaluation Distance from
RSSI and LQI Experimnent 2014 Tom Mahler and Ido Bayda
12
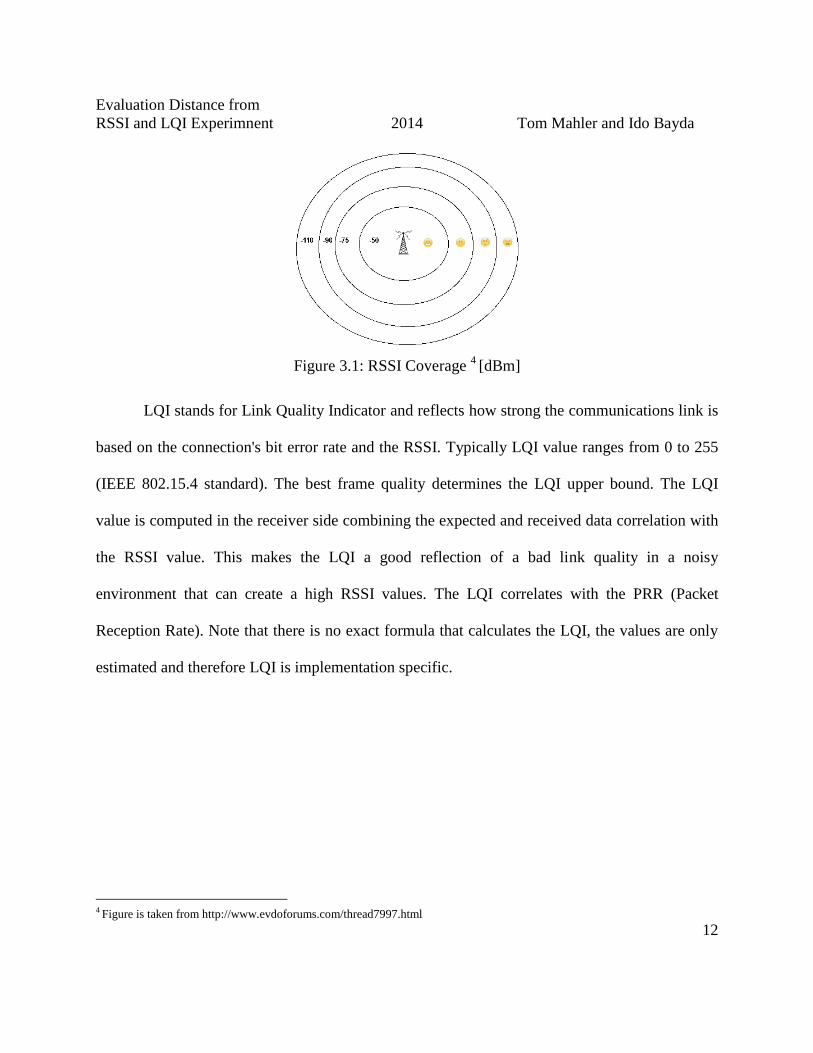
Figure 3.1: RSSI Coverage 4
[dBm]
LQI stands for Link Quality Indicator and reflects how strong the communications link is
based on the connection's bit error rate and the RSSI. Typically LQI value ranges from 0 to 255
(IEEE 802.15.4 standard). The best frame quality determines the LQI upper bound. The LQI
value is computed in the receiver side combining the expected and received data correlation with
the RSSI value. This makes the LQI a good reflection of a bad link quality in a noisy
environment that can create a high RSSI values. The LQI correlates with the PRR (Packet
Reception Rate). Note that there is no exact formula that calculates the LQI, the values are only
estimated and therefore LQI is implementation specific.
4 Figure is taken from http://www.evdoforums.com/thread7997.html
Evaluation Distance from
RSSI and LQI Experimnent 2014 Tom Mahler and Ido Bayda
13
RSSI and LQI are mostly used to measure wireless link quality and correlate to some
extent. In our experiment we assume ideal environment which implies that we assume no
interference from obstacles in the way, other media transmissions or reflections. In such
environment the LQI should remain stable in “happy” range of Figure 3.1 so we predict it to be
ineffective for our estimations. Note that in a non-ideal environment, as the RSSI drops to the
“not-so-happy” range, packet loss start occurring so we expect the LQI to also drop. This implies
that LQI can be used to provide better estimations in a non-ideal environment. Such cases do not
concern us for now and we leave this to further research.
3.1.2 Measuring RSSI with the CC2420
Throughout our experiment we used the TelosB device's CC2420 2.4GHz RF transceiver
IC from Texas Instruments [TE10] to calculate the RSSI over 8 symbol periods and store the
result on its RSSI.RSSI_VAL register. The following formula, specified in [BM00], is used to
compute the received signal power (𝑃) in dBm:
Eq. 3.1
𝑷 = 𝑹𝑺𝑺𝑰_𝑽𝑨𝑳 + 𝑹𝑺𝑺𝑰_𝑶𝑭𝑭𝑺𝑬𝑻 [𝒅𝑩𝒎]
During system development, the RSSI_OFFSET of the CC2420 was found empirically to
be approximately -45 dBm [CC07]. This approximation is dependent on the RF front-end
characteristics and the receiver sensitivity variations. Calibration may need to be done before use
if the power 𝑃 is to be used directly.
Evaluation Distance from
RSSI and LQI Experimnent 2014 Tom Mahler and Ido Bayda
14
3.1.3 Measuring LQI with the CC2420
The LQI in the CC2420 is calculated over 8 bits following the SFD (Start Frame
Delimiter). It is based partially on the RSSI value and is calculated in the MAC layer. The
CC2420 provides a “chip error rate” that it uses in conjunction with the RSSI value and the CRC
OK/not OK, to estimate the LQI value. 110 indicate the maximum link quality and the lowest
detectable value of the CC2420 is indicated by 50 [CC07].
3.2 Setup, Logging and Analysis
We now explain how we built our experiment, how we collected the RSSI and LQI values
from the motes and how we analyzed the results.
3.2.1 Setting up the Experiment
We used two types of devices in the setup, one Receiver device and one Sender device.
The Receiver device is connected to a computer and is responsible for collecting data from the
Sender device. The Sender device simply sends "hello world" messages, with room for RSSI and
LQI values, with an interval of 0.25 seconds.
We set the transmission power to default CC2420_DEF_RFPOWER = 31, so it
corresponds to maximum power [CC07].

Evaluation Distance from
RSSI and LQI Experimnent 2014 Tom Mahler and Ido Bayda
15
3.2.2 Logging the Experiment
The computer connected to the Receiver device runs a simple program that prints the
RSSI and LQI values on reception. We then copy the data to a table for further analysis of the
results.
3.2.3 Analysis Methods
The experiment is performed in an ideal environment outside the Faculty of Engineering
in Tel Aviv University with a clear LOS5. The Receiver device is static during the measuring
while the Sender is moving at intervals of 5 meters for each measure in a straight line from the
Receiver device. Each measure collects 15 values of both RSSI and LQI.
We use the output file with the results in order to calculate the average for each point and
plot the data. Furthermore, we develop a model using the pass loss equation. We also used the
WAF (Wall Attenuation Factor) from [BP00] which is described by
5 Line of sight.

Evaluation Distance from
RSSI and LQI Experimnent 2014 Tom Mahler and Ido Bayda
16
Eq. 3.1
𝑷(𝒅)[𝒅𝑩𝒎] = 𝑷(𝒅𝟎)[𝒅𝑩𝒎] − 𝟏𝟎𝒏𝒍𝒐𝒈 (𝒅
𝒅𝟎) − {
𝒏𝑾 ∙ 𝑾𝑨𝑭 𝒏𝑾 < 𝑪𝑪 ∙ 𝑾𝑨𝑭 𝒏𝑾 ≥ 𝑪
Where 𝑛 indicates the rate at which the path loss increases with distance, 𝑃(𝑑0) is the
signal power at some reference distance 𝑑0 and 𝑑 is the transmitter-receiver (T-R)
separation distance. 𝐶 Is the maximum number of obstructions (walls) up to which the
attenuation factor makes a difference, 𝑛𝑊 is the number of obstructions (walls) between
the transmitter and the receiver, and 𝑊𝐴𝐹 is the Wall Attenuation Factor. The value of
𝑃(𝑑0) can either be derived empirically or obtained from the wireless network hardware
specifications.
This equation helps us study the fit for our results. Note that the WAF is usually used in
order to take into account the number of walls in the way from sender to receive, however, since
we assume ideal environment we can set the maximum number of obstructions to 𝐶 = 0. We
also merge 𝑃(𝑑0) and 10𝑛𝑙𝑜𝑔(𝑑0) and derive the following equation to use for a logarithmic fit
to our results:
Eq. 3.2
𝑷(𝒅)[𝒅𝑩𝒎] = 𝑨[𝒅𝑩𝒎] − 𝟏𝟎𝒏𝒍𝒐𝒈(𝒅)
For 𝐴 = 𝑃(𝑑0) + 10𝑛𝑙𝑜𝑔(𝑑0). 𝑛 and 𝐴 will be decided by our logarithmic fit.
Evaluation Distance from
RSSI and LQI Experimnent 2014 Tom Mahler and Ido Bayda
17
3.3 Experiments and Results
We now explain what we did in our experiment and present our results.
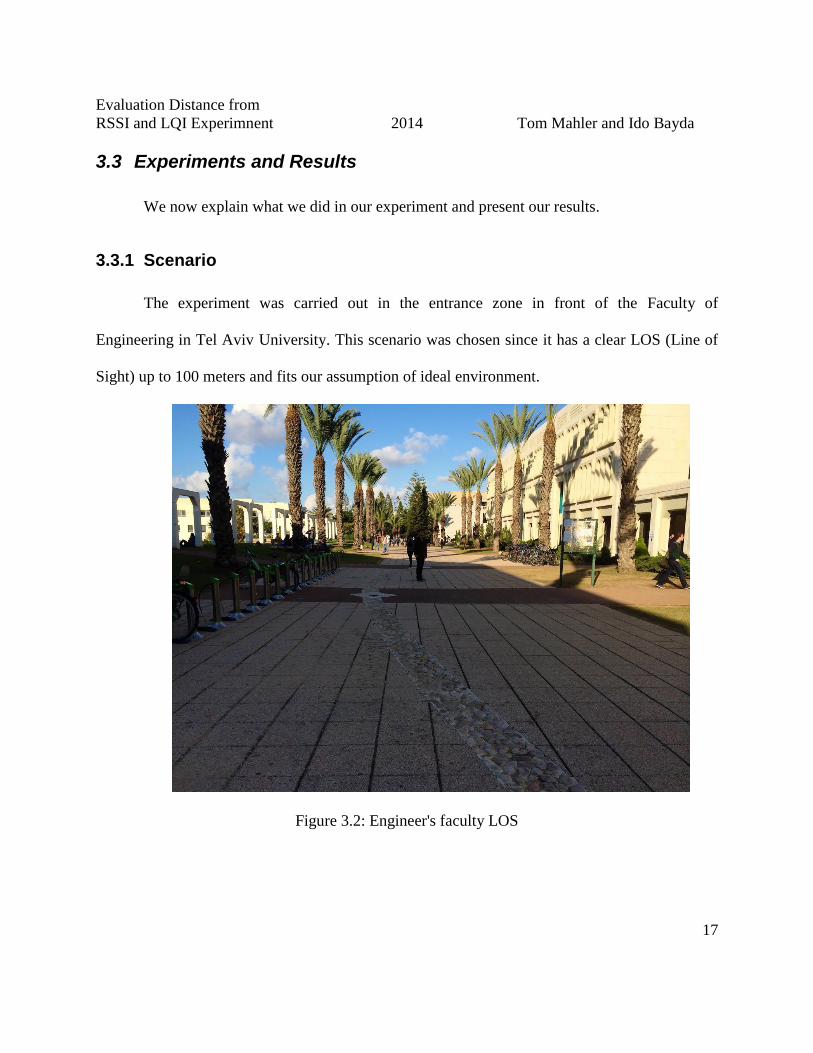
3.3.1 Scenario
The experiment was carried out in the entrance zone in front of the Faculty of
Engineering in Tel Aviv University. This scenario was chosen since it has a clear LOS (Line of
Sight) up to 100 meters and fits our assumption of ideal environment.
Figure 3.2: Engineer's faculty LOS

Evaluation Distance from
RSSI and LQI Experimnent 2014 Tom Mahler and Ido Bayda
18
The Receiver station, consists of both the Receiver device and a computer, was lifted
using a small box, and remained at a fixed position during the whole experiment. This method
ensured that the antenna orientation was fixed in place, pointing with the frontal layer to the
moving Sender device. This is important for our experiment in order to satisfy our ideal
environment assumption since the antenna is not omnidirectional6. The setup can be seen in
figure 3.3. The moving Sender device was held by a human at waist height of approximately 1
meter above ground, with the antenna layer orientated to the Receiver station.
Figure 3.3: Computer's setup
6 Omnidirectional antenna radiates radio wave power uniformly in all directions in one plane.
Evaluation Distance from
RSSI and LQI Experimnent 2014 Tom Mahler and Ido Bayda
19
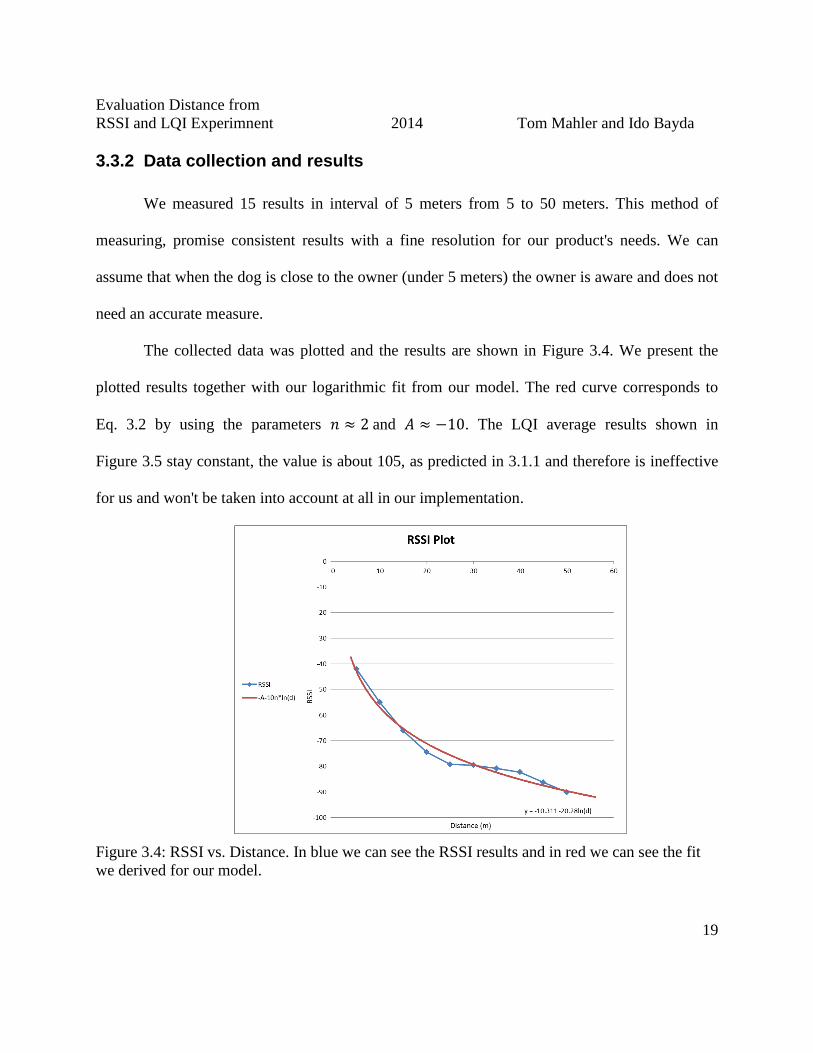
3.3.2 Data collection and results
We measured 15 results in interval of 5 meters from 5 to 50 meters. This method of
measuring, promise consistent results with a fine resolution for our product's needs. We can
assume that when the dog is close to the owner (under 5 meters) the owner is aware and does not
need an accurate measure.
The collected data was plotted and the results are shown in Figure 3.4. We present the
plotted results together with our logarithmic fit from our model. The red curve corresponds to
Eq. 3.2 by using the parameters 𝑛 ≈ 2 and 𝐴 ≈ −10. The LQI average results shown in
Figure 3.5 stay constant, the value is about 105, as predicted in 3.1.1 and therefore is ineffective
for us and won't be taken into account at all in our implementation.
Figure 3.4: RSSI vs. Distance. In blue we can see the RSSI results and in red we can see the fit
we derived for our model.
Evaluation Distance from
RSSI and LQI Experimnent 2014 Tom Mahler and Ido Bayda
20
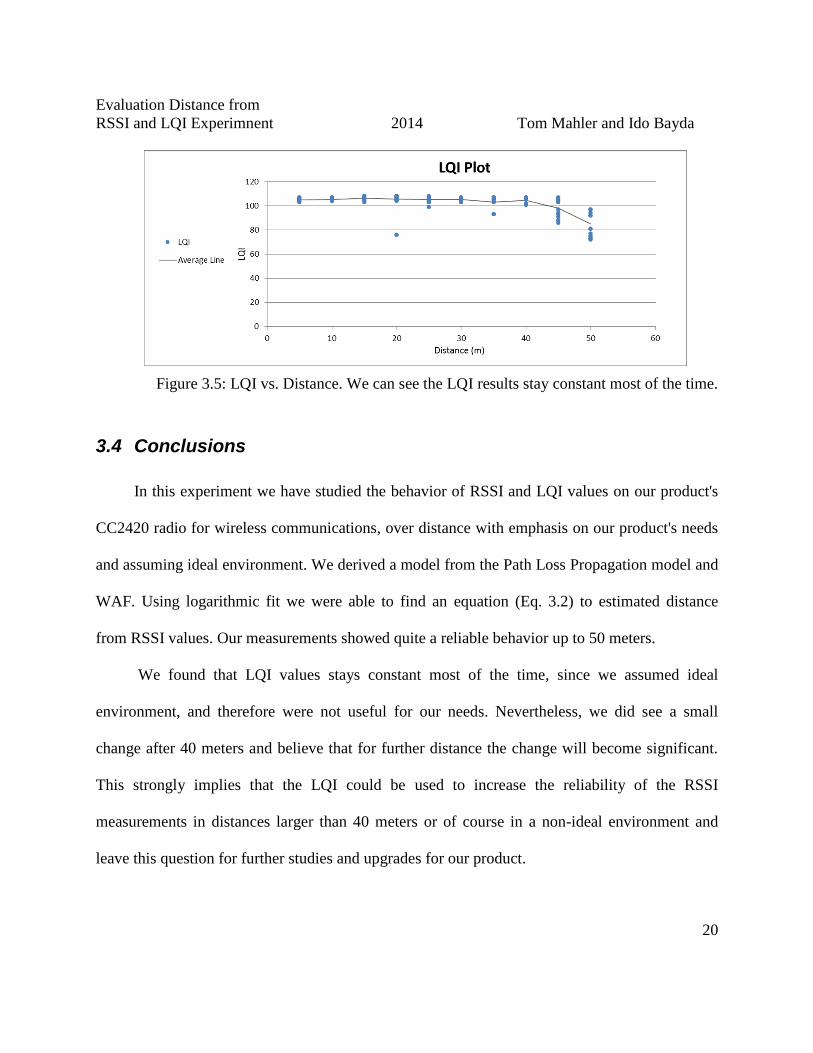
Figure 3.5: LQI vs. Distance. We can see the LQI results stay constant most of the time.
3.4 Conclusions
In this experiment we have studied the behavior of RSSI and LQI values on our product's
CC2420 radio for wireless communications, over distance with emphasis on our product's needs
and assuming ideal environment. We derived a model from the Path Loss Propagation model and
WAF. Using logarithmic fit we were able to find an equation (Eq. 3.2) to estimated distance
from RSSI values. Our measurements showed quite a reliable behavior up to 50 meters.
We found that LQI values stays constant most of the time, since we assumed ideal
environment, and therefore were not useful for our needs. Nevertheless, we did see a small
change after 40 meters and believe that for further distance the change will become significant.
This strongly implies that the LQI could be used to increase the reliability of the RSSI
measurements in distances larger than 40 meters or of course in a non-ideal environment and
leave this question for further studies and upgrades for our product.
Product Design 2014 Tom Mahler and Ido Bayda
21
4 Product Design
We need to implement our solutions (12.2) both in software design and hardware design.
We will mostly work on the software design part since we want to use the TelosB device as a
black-box, however some features require us to also modify the hardware.
4.1 Software Design
Our software is divided into two basic parts and one user interface part. The first basic part
aims to implement our research findings in evaluating distance from the RSSI and the second
basic part aims to implement features for costumer use such as alerts about the lost dog and a
feature to find him. Our user interface part is simply responsible for feedback and actions done
directly by the costumer
We first examine our findings. We have found a good fit that can evaluate distance
according to RSSI with a coefficient of determination of 𝑅2 = 0.979, which means that the data
fits well to the graph. We will use this fit in our software in order to measure the distance. We
also saw that the RSSI signal is unstable, therefore we can't base our results on one measure. For
this reason we will save measures and calculate the average.
The second basic part of our software design is the user interface. This part is the most
important part of our software. We will implement an alert system based on two modes: Normal
mode and Lost mode.

Product Design 2014 Tom Mahler and Ido Bayda
22
In Normal mode the product monitors the distance from the dog, however remains silent. If
the distance is larger than some predetermined distance, the product alert the user by beeping
faster as the distance increases and slower as the distance decreases. The user should be able to
adjust the threshold distance of the alerts according to personal demands.
In Lost mode, the dog is assumed missing and out of sight and that the costumer wants to
find the dog. The next idea is based on the children's game "Hot-Cold" in which children need to
find a hidden object that one of the parents hid, given clues from the parents. The parents will
say "HOT!" when they are getting closer to the object and "COLD…" if they are getting farther.
Our software works the same way: since we assume the costumer is looking for the dog, our
product will beep faster as she gets closer to the dog and slower when she gets farther away. In
other words, the product will beep faster as the distance between the two devices decreases and
slower as the distance increases. Note that we decided to let the costumer choose when and if to
enter this mode.
In the user interface part we will implement a feedback system that will give the
costumer information and provide the ability to perform different actions. Our feedback system
is based on the 3 built in LED lights and should indicate the current threshold and the current
mode. We will also use the built in button to let the user change the current threshold and current
mode.
Product Design 2014 Tom Mahler and Ido Bayda
23
4.2 Hardware Design
We now briefly go over our hardware design. Our software design supplies an alert system
to the costumer. The TelosB device is not equipped with any feedback hardware except for LED
lights. We want to provide an audio feedback as well, therefore we need to add a buzzer to our
product. Our buzzer should be small and with low power consumption so that two AA size 1.5V
batteries will be sufficient.
Implementation 2014 Tom Mahler and Ido Bayda
24
5 Implementation
Our product consists of two TelosB devices. One device is held by the costumer and we call
it "The Receiver". It is also the only one that will have a buzzer. The second device is connected
to the dog's collar and we call it "The Sender". We now present our software and hardware
implementation.
5.1 Software Implementation
We have two different programs, one for each device. The sender simply sends messages to
the receiver. The receiver is the main program, therefore we will mainly discuss its
implementation. We will show a brief description of the process in each program and then show
in details how the receiver is implemented in our design.
The sender program uses one process that sends message every 250 millisecond, using
UART communication, to the receiver. The message contains the RSSI value, and can be read by
the receiver using the CC2420 component.
The receiver program uses two processes. The user interface process handles the user's
actions. It is waiting for a button press event by the user, and interprets what is the action. The
buzzer rate process handles the actual audio alert. When the distance crosses the threshold the
process awakes and it "BUZZ" according to the mode and the distance threshold.
Implementation 2014 Tom Mahler and Ido Bayda
25
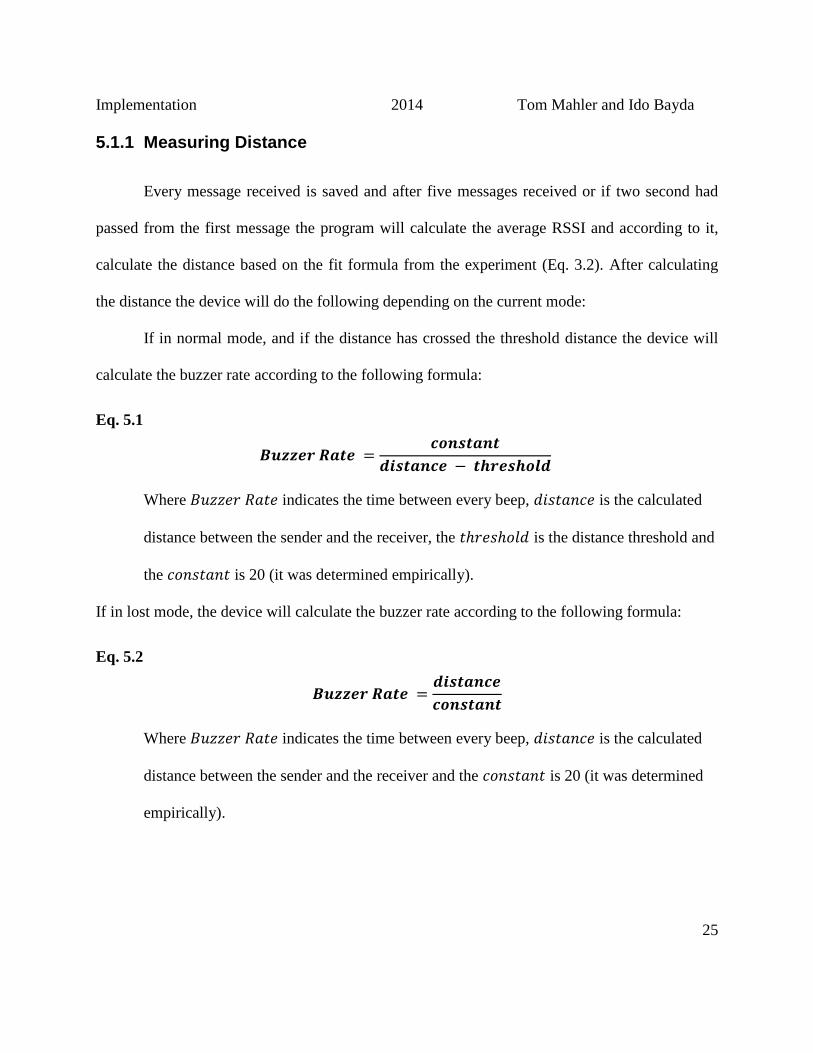
5.1.1 Measuring Distance
Every message received is saved and after five messages received or if two second had
passed from the first message the program will calculate the average RSSI and according to it,
calculate the distance based on the fit formula from the experiment (Eq. 3.2). After calculating
the distance the device will do the following depending on the current mode:
If in normal mode, and if the distance has crossed the threshold distance the device will
calculate the buzzer rate according to the following formula:
Eq. 5.1
𝑩𝒖𝒛𝒛𝒆𝒓 𝑹𝒂𝒕𝒆 =𝒄𝒐𝒏𝒔𝒕𝒂𝒏𝒕
𝒅𝒊𝒔𝒕𝒂𝒏𝒄𝒆 − 𝒕𝒉𝒓𝒆𝒔𝒉𝒐𝒍𝒅
Where 𝐵𝑢𝑧𝑧𝑒𝑟 𝑅𝑎𝑡𝑒 indicates the time between every beep, 𝑑𝑖𝑠𝑡𝑎𝑛𝑐𝑒 is the calculated
distance between the sender and the receiver, the 𝑡ℎ𝑟𝑒𝑠ℎ𝑜𝑙𝑑 is the distance threshold and
the 𝑐𝑜𝑛𝑠𝑡𝑎𝑛𝑡 is 20 (it was determined empirically).
If in lost mode, the device will calculate the buzzer rate according to the following formula:
Eq. 5.2
𝑩𝒖𝒛𝒛𝒆𝒓 𝑹𝒂𝒕𝒆 =𝒅𝒊𝒔𝒕𝒂𝒏𝒄𝒆
𝒄𝒐𝒏𝒔𝒕𝒂𝒏𝒕
Where 𝐵𝑢𝑧𝑧𝑒𝑟 𝑅𝑎𝑡𝑒 indicates the time between every beep, 𝑑𝑖𝑠𝑡𝑎𝑛𝑐𝑒 is the calculated
distance between the sender and the receiver and the 𝑐𝑜𝑛𝑠𝑡𝑎𝑛𝑡 is 20 (it was determined
empirically).
Implementation 2014 Tom Mahler and Ido Bayda
26
In both modes after calculating the 𝐵𝑢𝑧𝑧𝑒𝑟 𝑅𝑎𝑡𝑒, the device will start the buzzer rate
process (in normal mode, only if the distance crossed the threshold), which buzz according to the
calculated 𝐵𝑢𝑧𝑧𝑒𝑟 𝑅𝑎𝑡𝑒.
5.1.2 User interface
The TelosB device includes only one button, therefore all the user inputs is based on one
button. There are four states that determine the distance threshold which is 10𝑚, 20𝑚 and 30𝑚
depending on the state. The user can adjust the distance threshold by pressing short presses
according to the desired one. The forth state is lost mode to which the user can switch by
pressing a long press on the button.
Implementation of long and short presses on TelosB was difficult, because the current
implementation of Contiki is based on interrupt-driven events, more precisely on a falling
detection edge. We had to look into the Contiki driver of the button-sensor to understand exactly
how it works. We discovered that in the driver the sensor is configured to detect the change from
high-to-low, meaning that the interrupt occurs when the button is pressed. We came up with a
solution to manually change the IRQ (interrupt request) every time the button is pressed or
released. Therefore after a button's push is detected, we configure the interrupt to occur when the
button's release will happen (from low-to-high) and vice versa. In this way we can detect
efficiently short and long presses and define exactly how much time is a short or a long press.

Implementation 2014 Tom Mahler and Ido Bayda
27
The user can distinguish between the states according to the turn on LEDs. In normal
mode one LED is turned on in according to the current distance threshold, for the 10𝑚 the red
LED is on, for the 20𝑚 the green LED is on and the blue LED is on for the 30𝑚 threshold. In
lost mode all the above LEDs are turn on.
5.2 Hardware implementation
The buzzer connection to the TelosB: we connected the positive (long) leg of the buzzer to
ADC0 (Analog to Digital Converter pin 3) pin and the negative (short) leg to the ground (pin 9).
This is can be seen in Figure 5.1 and Figure 5.0.
Figure 5.1: Schematics for the 10-pin expansion connector.
Figure 5.2: The receiver with the buzzer connection.
The positive leg's pin
The negative leg's ground
Implementation 2014 Tom Mahler and Ido Bayda
28
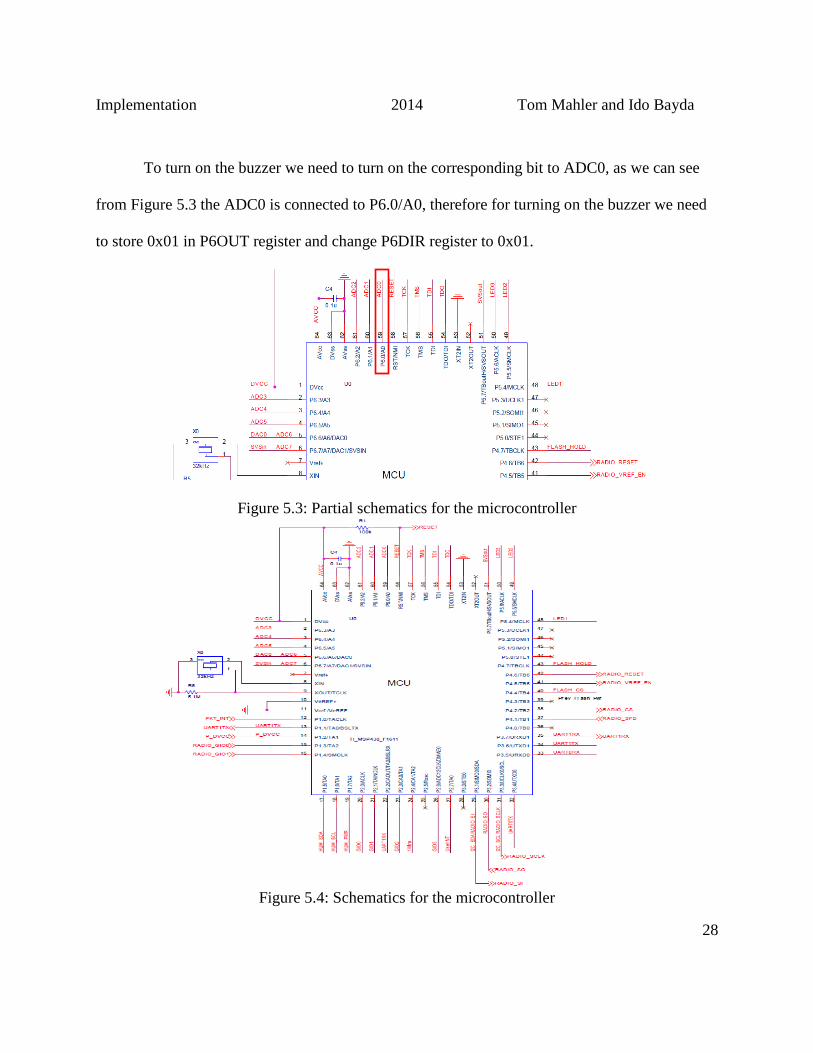
To turn on the buzzer we need to turn on the corresponding bit to ADC0, as we can see
from Figure 5.3 the ADC0 is connected to P6.0/A0, therefore for turning on the buzzer we need
to store 0x01 in P6OUT register and change P6DIR register to 0x01.
Figure 5.3: Partial schematics for the microcontroller
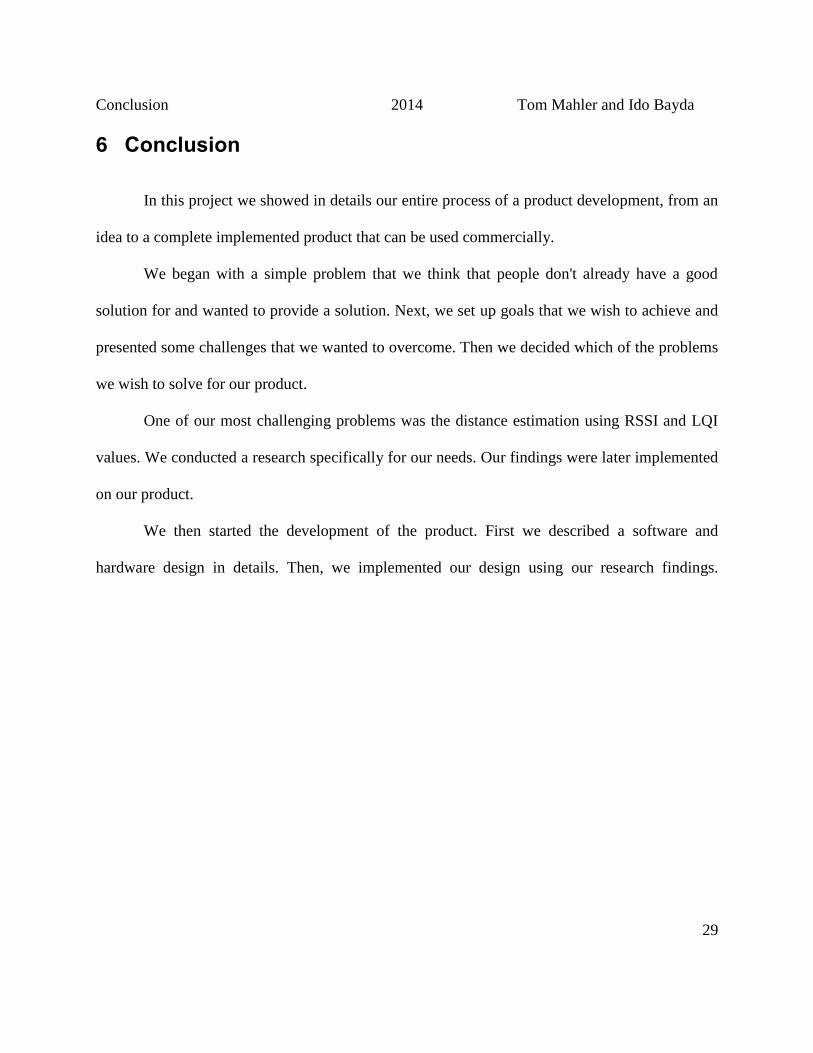
Figure 5.4: Schematics for the microcontroller
Conclusion 2014 Tom Mahler and Ido Bayda
29
6 Conclusion
In this project we showed in details our entire process of a product development, from an
idea to a complete implemented product that can be used commercially.
We began with a simple problem that we think that people don't already have a good
solution for and wanted to provide a solution. Next, we set up goals that we wish to achieve and
presented some challenges that we wanted to overcome. Then we decided which of the problems
we wish to solve for our product.
One of our most challenging problems was the distance estimation using RSSI and LQI
values. We conducted a research specifically for our needs. Our findings were later implemented
on our product.
We then started the development of the product. First we described a software and
hardware design in details. Then, we implemented our design using our research findings.
Bibliography 2014 Tom Mahler and Ido Bayda
30
7 Bibliography
[BM00] K. Benkič, M. M. (2000). Using RSSI value for distance estimation in Wireless
sensor networks based on ZigBee.
[BP00] Bahl, P., & Padmanabhan, N. V. (2000). RADAR: An In-Building RF-based User
Location and Tracking System. Microsoft Research, 775–784.
[CC07] Chipcon CC2420 Datasheet. (2007). Retrieved 2014, from Texas Instruments:
http://www.ti.com/lit/ds/symlink/cc2420.pdf
[SA10] Sauter, M. (2010). From GSM to LTE: An Introduction to Mobile Networks and
Mobile Broadband.
[TE10] TelosB. (2010). Retrieved 2014, from TinyOS Wiki:
http://docs.tinyos.net/index.php/TelosB