product-based workflow designhreijers/h.a. reijers bestanden/pbdjmis.pdf · cess thinking” and...
TRANSCRIPT

PRODUCT-BASED WORKFLOW DESIGN 229
Journal of Management Information Systems Summer 2003 Vol 20 No 1 pp 229ndash262
copy 2003 ME Sharpe Inc
0742ndash1222 2003 $950 + 000
Product-Based Workflow Design
HAJO A REIJERS SELMA LIMAM ANDWIL MP VAN DER AALST
HAJO A REIJERS is an Assistant Professor of Business Process Management at theFaculty of Technology Management of Eindhoven University of Technology He holdsa PhD in Computing Science from the same university During the past eight yearshe has worked for several management consultancy firms most recently as a man-ager within the Deloitte amp Touche consultancy practice His main interests are busi-ness process redesign workflow management systems Petri nets and simulation
SELMA LIMAM is an Assistant Professor of Information Systems at the Faculty ofTechnology Management of Eindhoven University of Technology She obtained herPhD in industrial engineering in 1999 at the National Polytechnic Institute ofGrenoble Her current research interests are business process redesign workflowmanagement systems Petri nets and simulation
WIL MP VAN DER AALST is a Full Professor of Information Systems and head of theDepartment of Information and Technology of the Faculty of Technology Manage-ment of Eindhoven University of Technology He is also a part-time full professor inthe Computing Science department of the same university and has been a consultantfor Deloitte amp Touche for several years His research interests are simulation Petrinets process models workflow management systems verification techniques enter-prise resource planning systems computer-supported cooperative work and inter-organizational business processes
ABSTRACT In manufacturing the interaction between the design of a product and theprocess to manufacture this product is studied in detail Consider for example mate-rial requirements planning (MRP) as part of current enterprise resource planning (ERP)systems which is mainly driven by the bill of material (BOM) For information-intensive products such as insurances and many other services the workflow processtypically evolves or is redesigned without careful consideration of the structure andcharacteristics of the product In this paper we present a method named product-based workflow design (PBWD) PBWD takes the product specification and threedesign criteria as a starting point after which formal models and techniques are usedto derive a favorable new design of the workflow process The ExSpect tool is used tosupport PBWD Finally using a real case study we demonstrate that a full evaluationof the search space for a workflow design may be feasible depending on the chosendesign criteria and the specific nature of the product specifications
KEY WORDS AND PHRASES business process redesign formal methods process de-sign workflows workflow systems
230 REIJERS LIMAM AND VAN DER AALST
ATTENTION FOR THE SUBJECT OF REDESIGNING business processes emerged duringthe early 1990s (see eg [9 13]) At the beginning of the twenty-first century ldquopro-cess thinkingrdquo and business process redesign (BPR) have become mainstream think-ing for business people and systems people alike [28] This paper presents a methodto design or redesign administrative business processesmdashalso known as workflowprocesses or workflows for shortmdashinspired on manufacturing principles In the manu-facturing world the bill of material (BOM) is used to derive the production process[23] Consider for example material requirements planning (MRP) often referred toas MRP-I which determines the production schedule based on the ordered quantitiescurrent stock and the composition of a product as specified in the BOM Contempo-rary enterprise resource planning (ERP) systems such as SAP also take resource avail-ability into account and use more refined algorithms Nevertheless production isdriven by the structure of the product
In contrast to manufacturing the product and the process have often diverged inactual workflows Workflows found in banks and insurance companies for productslike credit savings and mortgages damage and life insurance and so on may wellexist for decades Since their first release those processes have undergone an organicevolution For example historical problems in performing certain computations haveresulted in the addition of checks Another example is the effect that a historical caseof fraud may have on a process The case of fraud may result in the addition of anadditional check enforcing a rather restrictive type of control Aside from the evolu-tionary changes of the process the state of technology of some decades ago has con-siderably influenced the structure of these workflows permanently For example itused to be laborious to make a copy of a client file Therefore in many actual workflowsa highly sequential structure of tasks can be distinguished where at most one personat a time works on such a file So the structure of an actual workflow may not berelated to the product characteristics any more
Concerning the design of a process there are principally two important choices onehas to make before a redesign can start (1) the starting point and (2) the designmethod With respect to the starting point one can take the existing process as astarting point take a clean sheet approach that is the process is designed from scratchor use a reference model as a template for the new process The latter can be seen as amix between the first two There is considerable discussion in the literature on thechoice between taking the existing process and a clean-sheet approach (for an over-view see [22]) with clear advocates of the clean-sheet in Hammer and Champy [14]The design method that is chosen is by nature either dominantly participative or ana-lytical Participative approaches aim to develop a process design within the settingsof workshops where small groups of consultants managers and specialists worktogether An analytical approach aims at using formal theory and techniques to modeland derive the process design
Prevailing practice for the design of business processes is a participative approachthat takes the existing process as a starting point (eg [7]) The method we propose inthis paper on the other hand is analytical and clean-sheet It is explicitly presented tocounter the problems of prevailing practice In our opinion workshops much too
PRODUCT-BASED WORKFLOW DESIGN 231
often generate high-level designs of which the expected gains cannot be quantifiedSuch designs incorporate enough uncertainty to satisfy all workshop members butthey are too vague to implement ldquothe devil is in the detailsrdquo Taking the existingprocess as a starting point also introduces the danger of analyzing the existing pro-cesses in too great a depth and becoming constrained by it when trying to think ofnew ways of working (eg [25]) The organic evolution of workflows we identifiedearlier only intensifies this danger With this paper we hope to stimulate more rationaland quantitative ways of process design However the positive effects of participativedesign methods (eg [17 29]) may very well be used to enhance the application ofthe method we propose In fact de Crom and Reijers [8] describe how prototypingthat involves end users may help to validate a new process design that results fromour approach
To our knowledge the only known analytical design methods are described in vander Aalst [3] Aldowaisan and Gaafer [7] Herrmann and Walter [17] Hofacker andVetschera [18] and Orman [24] All authors introduce formal models of the businessprocess design problem All their approaches however suppose a preexisting notionof the process tasks which should be ordered in the final design The method de-scribed in Aldowaisan and Gaafer [7] even explicitly takes the existing process as astarting point The method we propose in this paper is truly clean-sheet as it uses theproduct specification to derive a minimal number of required tasks to produce theproduct in question Principles of optimally ordering the tasks that are applied inOrman [24] and van der Aalst [3] can be integrated in our approach as illustrated bythe case study in this paper A particular difference with the method as presented inHerrmann and Walter [17] is that we (1) allow for multiple optimization criteria to beincluded simultaneously in ordering the tasks in a design and (2) the evaluation of theprocess design may incorporate the structure of the processmdashnot only the particulartask occurrences
The method presented is named product-based workflow design (PBWD) It hasbeen introduced in van der Aalst et al [5] and was inspired on earlier work [2] Themethod distinguishes four phases
1 Scope In this initial phase the workflow that will be subject to the redesign (ordesign) is selected The redesign objectives for this workflow are identified aswell as the limitations to be taken into consideration for the final design
2 Analysis A study of the product specification leads to its decomposition intodata elements and their logical dependencies The existing workflowmdashif anymdashis studied to retrieve data that is both significant for designing the new workflowand for the sake of evaluation
3 Design Based on the redesign (or design) objectives the product specifica-tion decomposition and some estimated performance figures one or severalalternative workflow structures are derived A workflow structure consists oftasks that retrieve or process data elements
4 Evaluation The alternative workflow structures are verified validated withend users and their estimated performance is analyzed in more detail Themost promising designs are presented to the commissioning management to
232 REIJERS LIMAM AND VAN DER AALST
assess the degree in which objectives can be realized and to select the designto be implemented
These phases are proposed to be executed in a sequential order but in practice it isvery plausible and sometimes desirable that iterations will take place For examplethe evaluation phase explicitly aims at identifying design errors which may result inrework on the design
In order to support the PBWD method we have used ExSpect (see [6 10 11]) Thistool allowed us to implement the automated part of the analysis phase using the func-tional language of ExSpect (see the seventh section) and to design a prototype for theevaluation phase using the simulation capabilities of ExSpect (see the eighth section)
The Scope Phase
Workflow Selection
AN IMPORTANT AIM FOR THE SCOPE PHASE is to select the workflow that is to bedesigned or redesigned More specifically it aims at identifying the product of whichthe corresponding workflow is to be designed The selection of a productndashworkflowcombination can be made on various grounds [14 19] Sharp and McDermott [28]list the criteria that are used in practice If for example there is a new product devel-oped by a companyrsquos marketing department then the motivation for designing thecorresponding workflow is clear If an existing workflow is taken to be redesignedselection criteria may be the following
Dysfunctionality of the workflow Typically clear indicators of dysfunctionalworkflows are extensive information exchange data redundancy long through-put times high ratio of controls and iterations many procedures for exceptionhandling and special cases poor service quality and customer satisfaction andconflicts across departments
Importance of the workflow A workflow may contribute more or less to thecritical success factors of a company its profitability customer satisfactionmarket share and so on
Feasibility of redesign A redesign effort is more likely to succeed when theworkflow is directly linked to the needs of customers when the scope of theworkflow becomes smaller (but then the payoff drops) when expected redesigncosts become less and when knowledge about the product design approachand the existing workflow are available in larger quantities
In practice the various criteria for selecting a workflow to be redesigned are differ-ent for each company and even for each BPR effort
Workflow Boundaries
After selecting the proper productndashworkflow combination it is important to fix theboundaries of the workflow to be redesigned Important for these boundaries are the
PRODUCT-BASED WORKFLOW DESIGN 233
logical location and customer-centered viewpoints We will shortly discuss each ofthese Note that in actual settings other criteria may be more relevant
In practice what may be seen by different departments as the logical start and endof a workflow may differ From a salespersonrsquos perspective the workflow for mort-gage applications ends when a signed contract is returned by the customer Howevervarious operations in the back-office may still be required to fulfill the mortgageoffering A logical start state and end state should be determined for the workflowthat is to be redesigned prior to the design itself
The second viewpoint for the boundaries concerns the location of the workflowSimilar existing workflows may be executed at different locations such as in differ-ent offices or countries The question should be answered for which locations theredesign will be effectuated This issue will determine the types of systems that areincorporated which kind of regulations are in effect which performance is desirableand which people are involved
The last important viewpoint for the boundaries of a workflow concerns the cus-tomer Seemingly similar products may be offered to very different types of custom-ers A typical distinction within a banking environment is to distinguish betweenwell-to-do and other clients Depending on the type of customer different proceduresor product characteristics can be relevant
Redesign Objectives
An important and often neglected activity during the scope phase of a redesign initia-tive is to explicitly formulate the redesign objectives (see [4]) Aside from the perfor-mance targets such as throughput time operational cost and required labor hours thatshould be met by the newly designed workflow the redesign initiative itself may haveto be executed within a certain time quality and budget framework Something thatis even less frequently executed is the null measurement (see [4]) A null measure-ment establishes the score of the performance targets just before the redesign is car-ried out It establishes for example the average speed with which a company handlescustomer complaints by observation data analysis and so on Such a measurementenables the formulation of sensible target values and makes an ex post evaluationpossible by measuring the relevant entities again
Feasibility
The discussed elements of the scope phase so far are rather general and applicable forall kinds of redesign efforts To determine the feasibility of the PBWD approach todesign a particular workflow it is of the utmost importance that there is a well-de-fined notion of the product to be delivered by this workflow Actual manifestations ofsuch a product notion are handbooks internal regulations procedure codificationslegislations commercial brochures and so on It is inevitable for a proper assessmentof the feasibility of a redesign of PDWD that during the scope phase a collectiontakes place of the materials that define the product specification
234 REIJERS LIMAM AND VAN DER AALST
Even if there is no physical manifestation of a product specification it may verywell be that the concept of a product does exist with marketers product managers orgeneral management It is important to check the maturity and concreteness of thesenotions If they are sufficiently mature it is required before the next phase of analysisstarts that an explicit product specification is defined
In summary the deliverables of the scope phase are
a precisely demarcated workflow process to be designed the performance targets for the new design and a product specification
The Analysis Phase ProductData Structures forWorkflow Processes
IN THE ANALYSIS PHASE all distinguished material that classifies as product specifica-tion is analyzed to identify the data elements their dependencies and the logic in-volved We use a structure for administrative products that is somewhat similar to theBOM we discussed in the introduction The BOM used in manufacturing is a tree-likestructure with the end product as root and raw materials and purchased products asleafs In the resulting graph the nodes correspond to products that is end productsraw materials purchased products and subassemblies The edges are used to specifycomposition relations (ie is-part-of relations) The edges have a cardinality to indi-cate the number of products needed Figure 1 shows the simplified BOM of a car thatis composed of an engine and a subassembly The subassembly consists of four wheelsand one chassis
For information-intensive processes the traditional BOM is not very useful Firstmaking a copy of information in electronic form is trivial from the process perspec-tive since it takes hardly any time or resources to do this Therefore cardinalitiesmake no sense to express that exactly the same information is required multiple timesSecond the same piece of information may be used to manufacture various kinds ofnew information Therefore also non-tree-like structures are possible For examplethe age of an applicant for life insurance may be used to estimate both the health risksand the risks of work-related accidents Finally there are no physical constraints andtherefore there are typically multiple ways to derive a piece of information For ex-ample health risks may be estimated using a questionnaire or a full medical examina-tion These observations lead to the following productdata model
ProductData Model
A productdata model is a tuple (D C pre F constr cst flow prob)
D a set of data elements with a special top element
top Icirc D
PRODUCT-BASED WORKFLOW DESIGN 235
C set of constraints a constraint can be any Boolean function the function thatalways yields truemdashdenoted truemdashis part of C
true Icirc C
the function pre gives for each information element the various ways of deter-mining a value for it on basis of the values of different sets of other informationelements
pre D reg ( (D)) such that
there are no ldquodanglingrdquo data elements and a value of a data element does notdepend on itself
( )( )es pre p
R p c D D c es | is connected and acyclicIcirc
= Icirc acute Icirc
the top element cannot be used for determining the value of any other dataelement
( )p c R c top Icirc sup1
if there is a data element that does not require any other data element wedenote for ease of analysis the set of required data elements as the empty set
( ) ( ) e D pre e pre e Icirc AElig Icirc = AElig
F a set of production rules based on the definition of pre F consists of allordered pairs of data elements between which a dependency may exist
F = (p cs) Icirc D (D) | cs Icirc pre(p)
the function constr that associates a constraint to each production rule
constr F reg C such that
Figure 1 The BOM of a Car
236 REIJERS LIMAM AND VAN DER AALST
there are no constraining conditions on the production of data element valuesthat does not require the values of other data elements
( ) ( )e D pre e constr e true Icirc = AElig AElig =
a function cst which gives the cost of using a production rule
cst F reg
a function flow which gives the time it takes to use a production rule
flow F reg
a function prob which gives the probability that a production rule will yield anacceptable result when used
( ]prob F 01 such thatreg
if there are no constraints on using the production rule or no other data elementsare required then it will always lead to an acceptable result
( ) ( )( ) ( ) ( )e D pre e prob e
p cs F constr p cs true prob p cs
1
1
Icirc = AElig AElig =
Icirc = =
The productdata model expresses relations between data elements These relationscan be used to produce a value for the data element top The pre function yields foreach data element d zero or more ways to determine a value for d If we suppose fordata elements d e f Icirc D that e f Icirc pre(d) then a value of d may be determined onbasis of values of e and f We say that (d e f) is a production rule for d The rule canonly be applied if constr(de f) evaluates to true A constraint specifies the circum-stances when the production rule is applicable Such a constraint typically dependson the values of information elements that are used to produce another value Theexpected probability that a production rule yields an acceptable result for d when it isindeed applicable is given by prob(de f) In other words there is a probability of 1ndash prob(de f) that the production rule either does not lead to a result at all or that theresult is unacceptable for further processing The cost of producing a value for d withthis rule is specified by cst(de f) Likewise its flow time (throughput time) isspecified by flow(d e f) Note that a data element d for which holds that pre(d) =AElig is special it is called a leaf No other data elements are required to determine thevalue of a leaf There are also no constraints to determine the value of a leaf theprobability to determine a leafrsquos value is one Note that there may be costs associatedwith obtaining the value of a leafmdashjust as is the case for any other data element Alsonote that for any data element the probability that a value can be determined is one ifthere are no constraints to determine its value (ie true)
Note that the probabilities given in a productdata model are assumed to be inde-pendent This is infused rather by on-the-job experience with PBWD than by the
flow
PRODUCT-BASED WORKFLOW DESIGN 237
belief that this is generally a realistic assumption In actual applications of PBWD(see eg [8 26 27]) we found that probabilities are hard to determinemdashlet alonethat their relations are well understood In this sense the productdata model is reallya best effort to grasp the stochastic nature of business process execution which ismostly ignored in more intuitive redesign approaches However it is possible to adaptthe productmodel to incorporate a dependency notion This will make the design andanalysis of workflows (see the sixth and eighth sections) more complex but it leavesthe idea behind PBWD intact Note also that because probability values can be lessthan one it is generally not ensured that the data element top can be determined for agiven set of data element values For example suppose in a real-life situation thatthere are two alternative data elements that can be used to construct a value for sometop both with a probability of 09 Even if the values of both elements are availablethere is still a (1 ndash 09) (1 ndash 09) = 001 probability that no value for the top elementcan be determined
The applicability of the PBWD method in practice relies heavily on the ability tocollect the type of data that is part of the productdata model In our experience withapplying PBWD within the financial services and governmental agencies the neededeffort to collect this type of date differs from company to company Some companiesmaintain a very detailed administration of time durations and flow fractions For ex-ample a Dutch health insurance company we know uses this data for capacity plan-ning purposes and has therefore implemented procedures to manually record the dataOther companies obtain this information almost for free because it is stored auto-matically by their workflow management system that supports existing processes Onthe other hand this type of data may be totally absent too Then constructing a prod-uctdata model requires an intensive preceding trajectory of collecting such dataObservations interviews and expert estimations are instruments that may be of usewithin this context Note that in the prevailing design practice this type of informationis for the most part ignored This clearly eliminates the possibilities of any quantita-tive support for the design
The Helicopter Pilot Example
AN EXAMPLE OF A PRODUCTDATA MODEL is depicted in Figure 2 All boxes in thisfigure correspond to data elements Arcs are used to express the pre relation that is inuse to decide whether a candidate is suitable to become a helicopter pilot in the DutchAir Force Multiple starts of an arrow are joined into one by small black dots Forexample the outgoing arrows of data elements b and c are joined into one singlearrow leading to data element a It represents a production rule for a with data ele-ments b and c as inputs Unlike the BOM in Figure 1 there are no cardinalities ineffect On the other hand constraints cost flow time and probabilities are associatedwith production rules The meaning of the data elements is as follows
a suitability to become a helicopter pilot b psychological fitness
238 REIJERS LIMAM AND VAN DER AALST
c physical fitness d latest result of suitability test in the previous two years e quality of reflexes and f quality of eyesight
One of the things that follow from the figure is that there are three different produc-tion rules for the top element a The suitability of a candidate can be determined onbasis of either of the following
the results of the psychological test (b) and the physical test (c) the result of a previous test (d) or the candidatersquos eyesight quality (f)
The relations constr cst flow and prob for this example are as shown in Table 1 Ifx is a data element the value of x is denoted with x From this table it follows thatobtaining values for leafs is much more time-consuming in this example than othervalues This represents a common phenomenon that actions that involve communica-tion with external parties take more flow time than internal actions Furthermore itcan be concluded that if a candidatersquos eyes are worse than ndash30 or +30 dioptries thisinformation can be used as a direct knockout for the test result [3] The probability
Figure 2 Helicopter Pilot ProductData Model
Table 1 Relations constr cst flow and prob for Testing a Helicopter PilotCandidate
x constr(x) cst(x) flow(x) prob(x)
(a b c) True 80 1 10(a d ) d Icirc suitable not suitable 10 1 01(a f ) f lt ndash30 or f gt +30 5 1 04(b AElig) True 150 48 10(c e f ) True 50 1 10(d AElig) True 10 16 10(e AElig) True 60 4 10(f AElig) True 60 4 10
PRODUCT-BASED WORKFLOW DESIGN 239
that this will happen for an arbitrary case is 04 Note that each production rule for thetop element can be a knockout for a specific case
From the helicopter pilot product data model it becomes clear how the dependen-cies between data may be used to derive a favorable design For example suppose thatour redesign target is to minimize the cost and we have to decide what to do firstchecking the eyes of the candidate or looking for a previous test result From an analy-sis of the productdata model it follows that first looking up the test result and if stillrequired subsequently testing the candidatersquos eyes is a cheaper approach than theother way around The expected cost of pursuing these scenariorsquos is respectively 668(= 10 + (01 10) + (09 (60 + 04 5)) and 686 (= 60 + (04 5) + 06 (10 + 01 10)) Note how hard it would be to make such a decision on basis of intuition alone
Conformance
UP TO THIS POINT NO SPECIFICATIONS ARE GIVEN of the production rules other thantheir signature For each element of the pre relation such a specification should beavailable to produce a working workflow design However to consider the optimalityof a workflow model the exact specifications are mostly not relevant Much morerelevant is that a given workflow model conforms with the productdata model underconsideration We define a correctness notion for workflow models
Workflow Model
A workflow model PM on a productdata model (D C pre F constr cst prob) isdefined by (T prod W) where
T is a set of tasks prod T reg F the production rule applied in the task and W is a set of execution sequences
An execution sequence r Icirc W is a sequence t1t2tk of tasks with k Icirc 0 such thatfor any 1 pound i pound j pound k holds that ti tj Icirc T and ti = tj THORN i = j (single executions of each task)
Conformance
A workflow model (T prod W) conforms to the productdata model (D C pre Fconstr cst flow prob) if and only if for each execution sequence r = t1t2tk Icirc W k Icirc
0 holds that
( )( ) ( ) ( ) ( ) ( )i j
i k p cs F
prod t p cs c cs j i ds D prod t c ds
1
1
pound pound Icirc
= Icirc $ pound lt Icirc =
( ) ( ) ( )ii k cs D prod t top cs1 $ pound pound Icirc =
The first requirement ensures a proper order of the application of production rulesThe second requirement guarantees that the top element may be produced
240 REIJERS LIMAM AND VAN DER AALST
In general given a productdata model there is an infinite number of conformanttop-level workflow models Different subsets of tasks executed in some order maylead to the production of the top element In the next section we will discuss thecriteria that make one design preferable over another
Design Criteria
WHEN DESIGNING PRODUCT-BASED WORKFLOWS a large variety of criteria may betaken into account (for an overview see [28]) Clearly it is impossible to translate allthese criteria into one design approach Therefore we are considering for our paperthe following three important design criteria (1) quality (2) costs and (3) time Wefocus on these three criteria because we have encountered them in several redesignprojects Cost is often a convenient view on the internal efficiency of a companywhereas time is a way to make the external demands of clients on a company opera-tional Very often a trade-off has to be made between doing things at low cost (egby postponing activities that may become superfluous) or in a rapid fashion (eg bydoing possibly superfluous activities simultaneously) But even when cost is the preva-lent factor and time is not there may be requirements on an organization that it can-not drop its service between a certain quality threshold This may be because ofgovernment regulations or expected dents in the corporate image Different redesigncriteria or other definitions of the quality costs and time criteria than the ones thatfollow may be more suitable in an actual redesign encounter
Costs and time will be defined in this paper according to the functions cst and flowQuality is defined as the probability that an acceptable value of the top element can bedetermined Note that quality depends on the structure of the graph (ie function pre)and the probability that a production rule leads to a value To allow for a formaldefinition of these design criteria we introduce the notion of a plan
Plan
Let (D C pre F constr cst prob) be a productdata model Any subset S of D iscalled a plan
One can think of a plan as a subgraph of the graph denoting the productdata modelThe elements of S are the data elements that should be produced The set a d is aplan corresponding to the productdata model shown in Figure 2 In this plan theproduction rules (dAElig) and (ad) are executed in some order The set a e is alsoa plan although this plan will never lead to a value for data element a For any givenplan we can determine the probability that a value for the top element is determined
Quality of a Plan
Let (D C pre F constr cst prob) be a productdata model The quality of a plan S IacuteD is defined as p_quality(S) = qtop for all d Icirc S
PRODUCT-BASED WORKFLOW DESIGN 241
( ) ( )( )
d ed cs F e cs
q prob d cs q e
1 1 Icirc Icirc
= - - times timesdOtilde Otilde (1)
where
( ) [ ]e S
ee S
0
1
Iumld =
Icirc Egrave AElig
The quality of a plan is the probability that an acceptable value of the top elementcan be determined assuming that all production rules only referring to elements in Sare executed The exact formulation of (1) ensures that all possible scenariorsquos of ob-taining an acceptable result are added in the overall quality of the plan Note that forany production rule (p cs) Icirc F holds that all elements in cs should be part of the planin order to contribute to qp
Consider the productdata model shown in Figure 2 and three plans S1 = a d S2 =a b c e f and S3 = a e For plan S1 holds that the quality of this plan isp_quality(S1) = qtop = qa According to formula (1) qa = 1 ndash (1 ndash prob(ad) times qd timesd(d)) with qd = 1 ndash (1 ndash prob(d AElig) times qAElig times d(AElig)) = 1 So p_quality(S1) = qa = 01Similarly for plan S2 p_quality(S2) = 1 and for plan S3 p_quality(S3) = 0
Note that the introduced notion is a rather narrow view on quality For example itdisregards the distinction between producing an exactly correct result and an accept-able result In line with the definition of the prob function of the productdata modelour quality notion focuses on producing acceptable results However from a qualityviewpoint it may be of interest to define a quality design criterion that expresseswhich accuracy of the results may be expected As we have indicated in the introduc-tion of this section the presented criteria are open for adaptation in actual PBWDencounters
Costs of a Plan
Let S Iacute D be a plan The costs of S are
( ) ( ) ( ) ( )( ) e csp cs F
p csts S cst p cs p e
_ IcircIcirc
= timesd times dOtilde (2)
The costs of a plan are simply given by the sum of all production rules costs rel-evant for the plan Note that again it is assumed that production rule (p cs) is ex-ecuted if p Egrave cs is a subset of plan S These costs can be interpreted as the maximumcosts that are associated with the execution of a plan
The costs of plans S1 = a d S2 = a b c e f and S3 = a e are as follows Forplan S1 the only production rules relevant are (a d) and (d AElig) So according toformula (2) p_csts(S1) = cst(a d) times d(a) times d(d) + cst(d AElig) times d(d) times d(AElig) = 20(see Table 1) Similarly p_csts(S2) = 405 and p_csts(S3) = 60
242 REIJERS LIMAM AND VAN DER AALST
In practice the expected cost of a plan may be of much more interest to the com-pany that issues the design than the maximum cost However the attractiveness of thepresented cost criterion of a plan is the simplicity of its definition and its indepen-dence of the way the production rules are structured in the final workflow designTherefore this criterion should be seen as a first cost indication for a selected set ofproduction rules It may be wise to refine this notion in later steps of the design or todefine a different cost notion from the start (eg focusing on the minimal cost) Wewill indicate further in this section at what stage of the design a more refined costnotion in our opinion is recommendable
Flow Time of a Plan
The actual time required to produce all data elements of a plan depends on the orderin which the production rules are executed In a worst-case scenario where all pro-duction rules of the plan are executed sequentially the total flow time is
( ) ( ) ( ) ( )( ) e cspcs F
p_flow S flow p cs p e IcircIcirc
= timesd times dOtilde (3)
Formula (3) expresses the sum of the flow times of individual production rules thatcan actually be applied because their input data elements are also part of the planObviously by executing some of the production rules of the plan in parallel the ac-tual flow time can be reduced
Consider plan S4 = abcdef Assume that this plan is executed in the followingorder (dAElig) (ad) (fAElig) (af) (eAElig) (cef) (bAElig) (abc) Thenthe average worst case flow_time(S4) = flow(a b c) times d(a) times d(b) times d(c) + flow(af) times d(a) times d(f) + flow(a d) times d(a) times d(d) + flow(b AElig) times d(b) times d(AElig) + flow(c e f) timesd(c) times d(e) times d(f) + flow(f AElig) times d(f) times d(AElig) + flow(e AElig) times d(e) times d(AElig) + flow(d AElig) timesd(d) times d(AElig) = 76 time units Now suppose that the production rule (a d) leads to a valuefor a then the flow_time(S4) = flow(a d) times d(a) times d(d) + flow(d AElig) times d(d) times d(AElig)= 17 time units only So the average flow time of a plan may be much smaller be-cause a value for a data element can be obtained before all elements of the plan arederived
Given a plan S it is easy to calculate its quality p_quality(S) the associated maxi-mum costs p_costs(S) and the worst-case flow time p_flow(S) Note that a plan is nota workflow model it is merely a subset of data elements In general given targetvalues for each of these design criteria it is very complex to find the optimal solutionIn this paper we present an approach to deal with this multicriteria optimization prob-lem in a heuristic sense It should be stressed however that this approach does notnecessarily render the optimal solution Given sufficient time and a limited productdata model a brute-force generation of all alternative workflow designs may be pref-erable In our proposed heuristic the notions of a plan and the criteria p_quality(S)and p_costs(S) play a central role The heuristic uses the fact that p_quality(S) andp_costs(S) allow for the definition of a cost optimal plan (COP) given a quality level
PRODUCT-BASED WORKFLOW DESIGN 243
Cost Optimal Plan
Let (D C pre F constr cst prob) be a productdata model and q Icirc [0 1] be a qualitylevel Plan S Iacute D is cost optimal if and only if
p_quality(S) sup3 q and Scent Iacute D p_quality(Scent ) sup3 q THORN p_csts(Scent ) sup3 p_csts(S)
Consider R the set of plans that can be derived from the productdata model ofFigure 2 R = S1 S2 S3 S4 S5 where S5 = a f Assume q = 08 We already knowthe quality level of plans S1 S2 and S3 p_quality(S1) = 01 p_quality(S2) = 1 andp_quality(S3) = 0 It is easy to calculate the quality level of plans S4 and S5p_quality(S4) = 1 and p_quality(S5) = 04 Only plans S2 and S4 fulfill condition (1)For those plans costs are p_csts(S2) = 405 and p_csts(S4) = 425 According to thedefinition of cost optimality it appears that plan S2 is the COP
A COP gives the least costly subset of data elements that needs to be calculated toobtain a given quality level Looking at the underlying multicriteria optimization prob-lem of finding an optimal workflow design on basis of a productdata model we havein truth used the notion of the COP to recast the quality criterion as a constraint Inour experience several companies will find this acceptable as they will focus prima-rily on time and costmdashalthough they may feel for legal reasons or for reasons ofdecency obliged to maintain a minimal level of quality Note that the usefulness of aCOP increases when the number of data elements composing the productdata modelbecomes high Then the COP helps to make a first rough elimination of data ele-ments before the design process starts This heuristic can be implemented in a toolbox(see below)
Note that the costs associated to such a plan are the maximal costs that is the coststhat are made if all corresponding production rules need to be calculated However aknockout may result in a value for the top element before the whole plan is executedTherefore it is important to order the production rules The ordering of the productionrules can then be based on refined notions of the time criterion or the cost criterionmentioned in the previous section that is focusing on the expected flow time and costrather than their maximums Such criteria should obviously take the exact ordering ofthe production rules into account For the ordering there are two extreme approaches
1 Breadth-first Start with the leaf nodes in the plan and execute as many pro-duction rules in parallel as possible
2 Depth-first Start with the part of the plan that has the best qualitycost ratiothat is execute the production rules sequentially and start with the most prom-ising branches first
Assuming sufficient capacity the breadth-first approach optimizes the process withrespect to flow time but at high costs (in principle all production rules associated tothe plan are executed) The depth-first minimizes the expected costs but may result insubstantial longer flow times For the breadth-first approach there is no need to orderthe activities executing the production rules The graph structure is used to maxi-
244 REIJERS LIMAM AND VAN DER AALST
mize parallelism For the depth-first approach these activities need to be orderedsequentially
We wish to conclude this section with two observations The first is that the pre-sented criteria and their exact definitions are not fundamental for the PBWD methodWhat is fundamental is that these criteria are specified at all and actually used toguide the design Specific demands of a redesign project may deliver specific designcriteria Second the approach we presented is not guaranteed to deliver the optimalresult with respect to all design criteria we introduced Rather we sketched a possibleyet general approach to heuristically deal with the complex multi-criteria optimiza-tion problem at hand In the eighth section we will show a contrasting approachwhich explores the complete search space for an optimal design in a practical setting
An ExSpect Toolbox for Cost Optimal Plan ExSpectCOP
TO SUPPORT THE NOTIONS OF A plan and a COP we have developed a toolbox usingExSpect (see [10 11]) Before we present the functionality of the toolbox we brieflydiscuss the background of ExSpect ExSpect has been developed in the Departmentof Mathematics and Computing Science of Eindhoven University of Technology In1995 the development of ExSpect moved to the consultancy firm Deloitte amp Touchewhere it is used as the standard modeling and analysis tool ExSpect is based on high-level Petri nets (see eg [15]) It offers a complete functional programming lan-guage and supports complex simulation studies The ExSpect language and tool canbe used in two ways One way is to combine predefined building blocks (processorsand subsystems) to specify a large system However not all systems can be built inthis way It may be necessary to adapt building blocks or even to create them fromscratch using the ExSpect functional language More details about ExSpect can befound in van der Aalst et al [6]
In order to develop the ExSpectCOP toolbox we have used the functional part ofExSpect as a high-level programming language This choice has been made becauseof the advantages of this functional language over ordinary programming languages
ExSpectCOP consists of an ExSpect model that returns the COP for a given prod-uctdata model and a given quality level It is composed of a single system wherechannels stores and processors have been created and installed A channel is a placein the Petri nets terminology A store is a special kind of place where information canbe saved A processor is a transition in the Petri nets terminology It is the activecomponent of the specification where functions may be called and conditions de-fined For this tool several functions have been defined in order to derive plans qual-ity cost and flow time of plans Functions also allow the search of a COP
Figure 3 shows a screenshot of ExSpectCOP The productdata model is modeleddefining two tables prt and det Table det (Data ElemenT) returns for each data ele-ment the production rule that generates it (p cs) the cost the probability and theflow time of generating it from (p cs) Table prt (Production Rule Table) lists for eachproduction rule (p cs) the pre data elements needed (that is all elements of cs) Bothtables are stored in Store_prt and Store_ det
PRODUCT-BASED WORKFLOW DESIGN 245
The first important step in executing ExSpectCOP is to obtain all relevant possibleplans that can be generated from the productdata model A natural way of doing thatwould be to compute all possible plans that can be derived from the product datamodel (which is a set of data elements) and then to pick up the plans that meet theuserrsquos required quality level In general this is not feasible since the number of sub-sets of possible plans increases exponentially with the set of data elements So analgorithm has been implemented to reduce the search space for fitting plans Since weare interested in high-quality level plans the algorithm is based on the property that ifa sub-plan has a lower quality than what is desirable then any subset of this sub-planwill only have a lower or equal quality Thus the search for sub-plans should startwith the biggest sub-plan that is the plan containing all data elements This reducesconsiderably the search for sub-plans To implement this algorithm we first obtain allthe data elements of the product data model (pdm) by firing processorget_all_data_elements_of_pdm In this processor a function uses tables prt and detto derive the data elements Since each data element can be generated from variousproduction rules it may appear several times as an element of table det Next plansthat meet the desirable quality level only are derived from the set of all data elementsby firing processor plans_quality_is_sup_or_eq_q
The second step in executing ExSpectCOP is to identify the COP among all theplans that meet the quality level criteria This is determined by applying in processorSet_COP the COP heuristic described in the sixth section
Results related to the COP (included data elements cost of the plan quality of theplan and flow time of the plan) are obtained after firing of processor COP_all_data
Figure 4 shows the input data dashboard available in the simulation mode Thedashboard window is used to monitor and edit the contents of the channels during the
Figure 3 A Screenshot of ExSpectCOP
246 REIJERS LIMAM AND VAN DER AALST
execution of the ExSpect model The user is asked to build both tables det and prt toset the quality level and to start the simulation Figure 4 shows the dashboard filledwith input data for the helicopter pilot example
Figure 5 shows the dashboard containing the simulation results for the helicopterpilot example when the quality level equals 08 The dashboard gives the results ofthe execution consisting in the contents of each channel channel plans_quality_is_sup_or_eq_q shows the plans that satisfy the quality level criterion and channel COP_all_data shows the COP with details of cost quality and flow time
In the case of the helicopter pilot there are two plans with a quality level of oneThe plan containing all the data elements abcdef and the plan abcef TheCOP in this case is the latter plan abcef with a flow of 59 and a cost of 450
If we assume a lower quality level say 08 then we still obtain the two above-mentioned plans We need to apply a quality level of 04 to obtain a different configu-ration containing 16 plans The COPs are in this case acf and af with a qualityof 04 a cost of 65 and a flow of five In this case the cost is obviously lower than450 (obtained with a quality level of 08) but on the other hand there is only a 40percent chance to make a decision about the suitability for candidates to become ahelicopter pilot (data element a)
A Case Study The Social Insurance Company
AT THIS POINT WE HAVE DESCRIBED the first two phases of PBWD namely the scopeand analysis phases The design and the evaluation phases are not considered in depthhere We do present a case study that illustrates how the complete method works Weaim at demonstrating using this case that the design phase is dependent on the strat-egy the company would like to adopt in its relationship with customers and withrespect to other strategic issues such as cost and time We argue that the relativeimportance of the criteria the company wishes to set also determines the product-driven redesign rules that should be applied in the design phase The latter two con-siderations are for example not taken into account in the design method developedin Herrmann and Walter [17]
Figure 4 Input Data Dashboard of the ExSpectCOP Toolbox
PRODUCT-BASED WORKFLOW DESIGN 247
Introduction and Scope Phase
The PBWD method was applied in 1999 within the setting of a Dutch social insur-ance company (SIC) The information product under consideration during this projectwas the decision if a claimant is entitled to pay-related unemployment benefits whenhe or she claims to have become unemployed The SIC had unsuccessfully tried toredesign the process in a more conventional approach during that year using brain-storming techniques and green field approaches The resulting process design couldnot convince the people on the work floor or the information technology (IT) depart-ment that it was a workable improvement of the existing process At the time thepressure on the SIC was immense as the Dutch market for this type of product wouldbe liberated at the beginning of 2000 allowing commercial insurance companies tooffer the same type of service to the Dutch government As the end of 1999 wasnearing the management of the SIC became receptive for a new redesign approachin this case PBWD
The reference office for this project was one medium-sized office out of the 20offices in the Netherlands working on this decision This office on average handles alittle less than 10000 claims a year Three design directives were defined by the SICfor the final design First and mainly to decrease the expected average effort in termsof human labor hours The reason is an expected gain in efficiency and a minimiza-tion of cost Second to apply the case worker principle for each particular case thesame resource executes all steps within the process The motivation is higher qualityof work as the case worker knows the case in detail Finally to minimize the numberof contacts with customers The motivation is an improvement in the service qualityas perceived by the applicant
In a period of three months a new workflow design was derived for the describedproduct taking the former directives into account Information related to the product
Figure 5 Simulation Results Dashboard for the Helicopter Pilot Example
248 REIJERS LIMAM AND VAN DER AALST
in question the claim decision was derived from three sources the Dutch Unem-ployment Law which contains the regulations regarding the unemployment benefitsdecision the SIC handbooks which maintain operational interpretations of the lawand a detailed SIC administration of causes for denying unemployment benefits toindividual cases as well as other statistical figures on its operations
Analysis Phase
In the analysis phase a study of the product specification was made It led to its de-composition into data elements and their logical dependencies (production rules) asdefined in the third section The analysis phase yielded a number of data elementswhich were numbered as i1 i2 i51
Data Elements
The informal description of the meaning of each of the data elements is given in Table2 As can be seen from this table i18 is the top element ldquoclaimant is entitled to (pay-related) unemployment benefitsrdquo Data elements i1 to i10 are ldquotime periodsrdquo for ex-ample i1 is the period in which a claimant receives illness benefits (if at all) It isprohibited under Dutch law to receive unemployment benefits during such a period
The Production Rules
Table 3 lists the production rules needed for this case The exact specifications of thecontent of the production rules are not presented here because of its sheer size (30pages) [27] To give the reader some intuition on these rules it can be stated here thatthe decision to grant benefits to someone who has become unemployed (i18) dependson three major requirements which are
1 The claimant should be insured against becoming unemployed (i9)2 The claimant must satisfy a ldquorefer requirementrdquo (i11)3 The claimant must satisfy a ldquolabor history requirementrdquo (i15)
The mentioned requirements themselves depend on various other data elementsFor example the labor history requirement (i15) can be satisfied by either havingbecome unemployed immediately after a period of protracted disability (i17) or byhaving worked during four out of five of the years immediately preceding the unem-ployment (i16) The exact logic and constraints to count these years are expressed byother production rules and data elements of the productdata model Figure 6 showsthe entire product data model
To help implementing the first design directive for each production rule it wasdecided whether it could be formally specified thus enabling an automation of theproduction rule Of all rules 26 production rules were formally specifiable and onlysix production rules could not be specified or could not be specified completely in theform of an algorithm The latter involved the production of data elements i11 i16
PRODUCT-BASED WORKFLOW DESIGN 249
Table 2 Meaning of Data Elements
Dataelement Description
i1 Period in which claimant receives illness benefitsi2 Period in which claimant receives excessive combined social benefitsi3 Period claimant livesresides outside the Netherlandsi4 Period in which claimant does not rightfully live in the Netherlandsi5 Period in which claimant is detainedimprisonedi6 Period in which the claimant is 65 years or olderi7 Period in which the claimant has legal scruples against insurancei8 Period in which claimant enjoys holidayi9 Period in which claimant is an employeei10 Period in which claimant is unemployedi11 Claimant satisfies refer requirement i13 Date from which claimant lost the right for paymenti14 Data from which the claimant is available to accept labori15 Claimant satisfies labor history requirementi16 Claimant satisfies four out of five years requirementi17 Claim is directly following labor disablement benefitsi18 Claimant is entitled to (pay-related) unemployment benefitsi21 Birth date of the claimanti23 Claimantrsquos holiday administrationi24 Registration of unemployment insurancei25 Registration of social benefitsi27 Claimantrsquos unemployment is caused by strikework stoppagei28 Period in which applicant receives reintegration benefitsi29 Refer period for claimanti30 First day of unemployment of claimanti31 Number of weeks claimant worked in refer periodi32 First week of unemployment of claimanti33 Registration of housingi34 Average number of labor hours per week of claimanti35 First day of labor history for applicanti36 Day status survey of claimantrsquos labor historyi37 Loss pattern of labor hours of claimant i38 Care data on claimanti39 Employment function of which the claimant has become unemployedi40 Employment functions that have been followed up by the employment
function of which the claimant has become unemployedi41 Earlier employment functions of the claimanti42 Approved labor courses for unemployedi43 Common first labor day for claimanti44 List of claimantrsquos yearly worked daysi45 Register of convictionsi47 Educationcourses of claimant that precede or follow on the loss of labor
hoursi48 Weeks in refer period already taken into accounti49 Labor pattern of claimanti50 Register of special classes of employment functionsi51 Claimant has taken care of underage children
250 REIJERS LIMAM AND VAN DER AALST
Table 3 SIC Production Rules
Production rule Automatic Constraint Cost Probability
(i11 i31) Partly i31 defined 06 085(i13 AElig) No True 008 10(i14 AElig) No True 008 10(i15 i16) Yes i16 = true 0 0997(i15 i17) Yes i17 = true 0 0003(i17 i25 i30) Partly True 61 10(i16 i25 i30 i35 i36 i44) Partly True 561 10(i18 i1) Yes i37 in i1 0 0009(i18 i2) Yes i37 in i2 0 0013(i18 i8) Yes i37 in i8 0 0016(i18 i9) Yes i9 = false 0 0002(i18 i10) Yes i10 not defined 0 0068(i18 i11) Yes i11 = false 0 0079(i18 i15) Yes i15 = false 0 021(i23 AElig) No True 067 10(i27 AElig) No True 008 10(i34 i36 i37 i41) Partly True 42 10(i36 AElig) No True 10 10(i37 AElig) No True 167 10(i39 AElig) No True 017 10(i40 i39 i41) (i42 i47) Partly True 03 10(i43 i39 i49) Partly True 06 10(i47 AElig) No True 033 10
Notes The following production rules are automatic their constraints evaluate to true there is nocost in executing them and their success probability equals one (i1 i25 i37) (i2 i25 i37)(i3 i33 i37) (i4 i33 i37) (i5 i37 i45) (i6 i21 i37) (i7 i24 i37) (i8 i23 i37)(i9 i24 i39) (i10 i13 i14 i34 i37 i42) (i15 i16 i17) (i17 i25 i30) (i18 i9 i11i15) (i21 AElig) (i24 AElig) (i25 AElig) (i28 i25 i37) (i29 i25 i30 i35 i36) (i30 i32i37 i43) (i32 i1 i2 i3 i4 i5 i6 i7 i8 i10 i27 i28) (i33 AElig) (i35 AElig) (i41 AElig) (i44AElig) (i45 AElig) (i48 AElig) (i49 AElig) (i31 i29 i40 i48)
i34 i40 i42 and i43 To make the difference clear between (partly) manual andautomatic production rules (partly) manual production rules are represented in theproductdata model like dashed lines (see Figure 6)
In Table 3 four columns are depicted in addition to that of the production ruleldquoautomaticrdquo ldquoconstraintrdquo ldquocostrdquo and ldquoprobabilityrdquo The column ldquoautomaticrdquo is de-fined in order to take into account the first design directive Columns ldquoconstraintrdquoldquocostrdquo and ldquoprobabilityrdquo are directly derived from the formal product model as de-fined in the third section We will discuss each of them now
The column ldquoautomaticrdquo for a production rule for a node element it indicateswhether it can be formally specified For a production rule for a leaf element itindicates whether it is directly available and accessible to the SIC For both
PRODUCT-BASED WORKFLOW DESIGN 251
types of rules a positive answer to this question implies that it can be automati-cally made available to the process Hence no labor cost is involved For infor-mation rules for node elements it may be the case that it is not completelyformally specifiable Partial handwork is still required It is indicated by thevalue ldquopartlyrdquo in the ldquoautomaticrdquo column
The column ldquoconstraintrdquo the constraints were derived from the law and hand-books and also from the SIC experts opinions and precedents
Figure 6 The SIC ProductData Model
252 REIJERS LIMAM AND VAN DER AALST
The column ldquoprobabilityrdquo due to the aggregated administration of historicalcases the SIC maintained a quantitative survey could be easily executed afterthe probabilities under which the production results produce the desired resultAlthough these probabilities are probably not completely independent of eachother there were no records of the dependencies among them
The column ldquocostrdquo cost is expressed in terms of the average time in minutes anSIC clerk has to spend on it For the execution of production rules that could bespecified formally no cost figures were assumed to be imposed
Concerning production rules that obtain values for the 18 leaf nodes it turned outthat 10 of the leaf data elements are directly and permanently available to the SICitself (i21 i24 i25 i33 i35 i41 i44 i45 i48 and i49) This was either because theSIC maintains the data itself or because it had direct access to data of third parties Noproduction rules are required for these data elements and no cost for obtaining themhas been applied For each of the other eight leaf data elements (i13 i14 i23 i27 i36i37 i39 and i47) exactly one production rule was specified with a cost figure usedthroughout the project The source of the information is in all cases the claimantitself For the seven partly manual production rules (i11 i16 i17 i34 i40 i42 andi43) the total cost was determined on basis of the weighted cost for manual andautomated cost For example the production rule for i11 must be executed manuallyin 15 percent of the cases in 85 percent of the cases there is no labor cost As theaverage cost for manual execution of this production rule is four labor minutes theweighted average is 015 4 = 06 minutes
The ProductData Model
The relations between the data elements (production rules) are given in the productdata model of Figure 6 Note that a crossing of arrows that is not covered by a blackdot has no semantics Most data elements are represented precisely once in the figureThere are two exceptions i25 and i36 These are both depicted twice to prevent toomuch entanglement of arrows This is indicated by the bold and italic form of theiridentifiers
As explained in the third section knockout production rules are rules that executionmay lead to the determination of a value for the top element after which the process-ing can end So from Figure 6 follows that eight knockout production rules are ineffect We will informally discuss these knockouts here to illustrate the model
A straightforward way of decision-making is to check whether the claimant is in-sured against becoming unemployed (i9) whether the claimant satisfies a ldquorefer re-quirementrdquo (i11) and whether the claimant satisfies a so-called ldquolabor historyrequirementrdquo (i15) If all these conditions apply the claimant will receive his or herperiodical unemployment benefits Either unsatisfactory outcome of one of these threeconditions will disqualify the claim The latter three production rules are representedby the single arrows leading from respectively i9 i11 and i15 to i18 There are fourmore conditions that may also stop the processing if their outcome is unsatisfactoryThese three conditions directly depend on the values of respectively i1 i2 i8 and
PRODUCT-BASED WORKFLOW DESIGN 253
i10 For example if the claimant is unemployed while he or she is on a holiday theclaim will not be rewarded This can be deduced from the value of data element i8
In the sequel we refer with ldquomanual production rulesrdquo to production rules with apositive labor cost and with ldquoautomatic production rulesrdquo to all other production rules
Cost Optimal Plan
Before the design phase starts the COP was derived using the heuristic in the sixthsection The aim of deriving such a plan is to minimize the costs for treating claimapplications and also to facilitate the exploration and design of the workflow Theimportance of the COP becomes higher as the number of data elements increases
We have used the ExSpectCOP toolbox to determine the COP in the case of SICSeveral alternatives have been considered for quality levels The results are shown inTable 4
It was agreed to consider as acceptable a 08 quality level As there are two planswith the same cost ad quality the smallest was chosen to simplify the design That ledto plan 2 as a final COP The subgraph of the original productdata model on basis ofthis plan is shown in Figure 7
Design Phase
The design of the workflow on basis of the COP was driven by the earlier-stateddesign objectives We discuss the results for our design approach
Minimize the cost implies automating automatic production rules and using adepth-first strategy in which knockouts are ordered such that the expected costof executing the process is minimal (see [3 24])
Case worker principle all work on one specific case is assigned to the sameemployee (This is not reflected in the structure of the workflow design but bythe allocation rules used in practice)
Table 4 Cost Optimal Plans for the SIC Case
Minimal qualitylevel required Plan Quality Cost
1 AElig mdash mdash09 PLAN 1 = ALL DATA ELEMENTS 0901 217808 PLAN 1 0901 2178
PLAN 2 = PLAN 1 i17 0899 156903 PLAN 1 0901 2178
PLAN 2 0899 1569PLAN 3 = PLAN 1 i9 0339 2178PLAN 4 = PLAN 1 i17 i9 0338 1569
254 REIJERS LIMAM AND VAN DER AALST
Figure 7 Cost-Optimal Plan of the SIC ProductData Model
PRODUCT-BASED WORKFLOW DESIGN 255
Minimize the number of contacts with the claimant as soon as one data elementis required from the claimant all data elements of the claimant are gathered
We will approach the design by considering one imaginary case This is valid as allcases will be treated equally The design of the workflow takes place in five steps Forthe first four steps the available data elements are depicted according to the legend ofFigure 7 All data elements of Figure 7 are available after the fifth step
Step 1 Initially Available Information
As a start situation the SIC holds the information i21 i24 i25 i33 i35 i41 i44 i45i48 and i49 (See Figure 7)
Step 2 Consult of Claimant
No automatic production rules can be performed on basis of the available informa-tion Recall that all leaf data elements not readily available to the SIC have to beprovided by the claimant On basis of the third design objective all these eight leafproduction rules are executed Having done that the process execution up to thatpoint has an average cost of 408 minutes (= 008 + 008 + 067 + 008 + 1 + 167 +017 + 033) and the following information is available i13 i14 i21 i23 i24 i25i27 i33 i35 i36 i37 i39 i41 i44 i45 i47 i48 and i49 The additional data ele-ments at this point are depicted in Figure 7
Step 3 Automatic Production Rules
On basis of the available information we first look for carrying out automatic pro-duction rules as they can be applied without any cost These are (i1 i25 i37) (i2i25 i37) (i3 i33 i37) (i4 i33 i37) (i5 i37 i45) (i6 i21 i37) (i7 i24i37) (i8 i23 i37) (i9 i24 i39) and (i28 i25 i37)
The total available information is now i1 i2 i3 i4 i5 i6 i7 i8 i9 i13 i14 i21i23 i24 i25 i27 i28 i33 i35 i36 i37 i39 i41 i44 i45 i47 i48 and i49 Theadditional data elements at this point are depicted in Figure 7
Step 4 First Choice of Manual Production Rules
Already there is a probability of 004 (= 0009 + 0013 + 0016 + 0002) that theprocessing may end by an additional execution of one of the knockouts (i18 i1)(i18 i2) (i18 i8) or (i18 i9) in case either i1 i2 i8 or i9 are not satisfied (seeTable 3) So for 4 percent of the cases an average cost of only 408 minutes may beexpected
In the more general case that there is no knockout processing must proceed Bynow there is no other option than to execute a manual production rule We recall thatthese are (i11 i31) (i16 i25 i30 i35 i36 i44) (i17 i25 i30) (i34 i36 i37i41) (i40 i39 i41) (i42 i47) and (i43 i39 i49)
256 REIJERS LIMAM AND VAN DER AALST
Would these production rules be totally independent of each other 6 = 720 differ-ent orderings should be considered for the rest of the design However we can limitthe number of alternatives by inspecting the dependencies of the productdata modelIn general the optimal choice for a production rule is the one that increases the chancefor a knockout at the lowest possible cost For any of the remaining knockout possi-bilities production rules (i34 i36 i37 i41) and (i42 i47) are required In execut-ing them there is no preference in their ordering individual executions of these ruleswill not lead to any probability for a knockout So the following step in the process isto execute (i34 i36 i37 i41) and (i42 i47) in arbitrary order followed by (i10i13 i14 i34 i37 i42) which has no cost There is a probability of 0068 that theprocess will then end by applying (i18 i10) The process so far has an average costof 858 minutes On average already 11 percent of the cases is knocked out
If the execution of (i34 i36 i37 i41) (i42 i47) and (i10 i13 i14 i34 i37i42) did not facilitate a knockout through (i10 i18) the automatic production rule(i32 i1 i2 i3 i4 i5 i6 i7 i8 i10 i27 i28) may be executed Supposing that avalue for i18 could not be obtained earlier this makes the following informationavailable i1 i2 i3 i4 i5 i6 i7 i8 i9 i10 i13 i14 i21 i23 i24 i25 i27 i28 i32i33 i34 i35 i36 i37 i39 i41 i44 i45 i47 i48 and i49 The data elements addition-ally available at this point are depicted in Figure 7
Step 5 Final Choice of Manual Production Rules
Again a manual production rule has to be chosen to be applied next All remainingknockouts rely on the result of (i43 i39 i49) so this is our obvious next choice Itwill facilitate the automatic execution of (i30 i32 i37 i43) followed by the execu-tion of automatic production rule (i29 i25 i30 i35 i36)
Because i17 is no part of the COP there is no alternative than to choose anothermanual production rule We recall that the only remaining manual production rulesare (i11 i31) (i16 i25 i30 i35 i36 i44) and (i40 i39 i41) Inspecting theirdependencies it is obvious that (i40 i39 i41) must precede (i11 i31) What ismore the scenario of subsequent executions of (i40 i39 i41) (i16 i25 i30 i35i36 i44) and (i11 i31) is not a smart one After all if (i16 i25 i30 i35 i36i44) is executed a knockout may follow making the prior effort to execute (i40i39 i41) superfluous The only sensible scenario is to order the remaining manualproduction rules are
scenario 1 (i40 i39 i41) (i11 i31) (i16 i25 i30 i35 i36 i44) scenario 2 (i16 i25 i30 i35 i36 i44) (i40 i39 i41) (i11 i31)
With respect to scenario 1 it starts with the subsequent execution of (i40 i39i41) and (i31 i29 i40 i48) With a probability of 085 production rule (i11i31) can be successfully applied If so either knockout may follow by the singleexecution of (i18 i11) or by the thread of executions of (i16 i25 i30 i35 i36i44) (i15 i16) and (i18 i9 i11 i15) Note that in the latter case (i18 i9 i11i15) is preferable over (i18 i15) because it has no cost and a success probability
PRODUCT-BASED WORKFLOW DESIGN 257
of one Now suppose after execution of (i40 i39 i41) and (i31 i29 i40 i48) that(i11 i31) could not be applied (p = 015) The only chance of obtaining a value fori18 is then that subsequent execution of (i16 i25 i30 i35 i36 i44) (i15 i16)and (i18 i15) is successful The total cost for this scenario is 604 time units and ithas a success probability of 088
With respect to scenario 2 this scenario will start with the execution of (i16 i25i30 i35 i36 i44) followedmdashif possible (p = 0997)mdashby the automatic productionrule (i15 i16) With a probability of 021 the knockout (i18 i15) can then takeplace If either of the production rules (i15 i16) or (i18 i15) failed then thesubsequent execution of the production rules (i40 i39 i41) (i31 i29 i40 i48)and (i11 i31) should preferably take place In addition if (i15 i16) was notsuccessful then it may be followed by (i18 i11) with a slight success probability(0079) otherwise it is preferable to execute (i18 i9 i11 i15) The total cost ofthis scenario is 625 minutes and it has exactly the same probability to deliver a topvalue (088)
As follows from this comparison the cost figures of these scenariorsquos are almostsimilar but the preferable alternative is scenario 1 Note that the evaluation of thesescenariorsquos is simplified because of the elimination of i17 Otherwise the probabilitythat i15 could have been determined on basis of i17 should have been taken intoaccount
The Final Design
This concludes the design of the workflow The execution sequences of the workflowmodel are compactly represented with the workflow net in Figure 8 Petri nets areused for representing the workflow net (see eg [1 2]) Alongside or inside mosttasks an ordered enumeration of production rules is listed The exceptions are thethree tasks labeled with ldquoskiprdquo which have no production rules and are only addedfor logistic reasons For the other tasks the production rules are executed in the orderof enumeration when the corresponding task is executed The order of some of theserules is arbitrarily fixed This is of no concern for the performance of the workflow asthe case worker principle is applied that is all tasks for the same case are performedby the same worker Each state in which different alternative routings can be followedis depicted as an OR-split In italics the condition is expressed for the correspondingrouting These conditions are derived from the constraints in Table 3
Quality of the Design
For the sake of validation a prototype was developed of an integrated informationsystem that both supports the logistic routing of the workflow and the execution of itscontent that is the production rules This prototype was also developed with ExSpectbecause of the relative ease to reuse the involved production logic The subject ofbuilding such a prototype on basis of a formal productdata model is treated in Cromand Reijers [8]
258 REIJERS LIMAM AND VAN DER AALST
It is important to distinguish at this point the two levels of use of this tool the meta-modeling (modeling of the product data model and derivation of the COP ExSpectCOP toolbox see Figure 3) and the actual modeling level (prototype execution of theworkflow) These levels are shown in Figure 9
To the end user of the prototype four different predefined cases were presentedthat referred to real applications for an unemployment allowance and included realdata When using the prototype to enact the handling of such a case tasks with auto-matic production rules were executed by the prototype itself Tasks with manual pro-duction rules were to be performed by the end user of the prototype SIC professionalsused it in workshops held during the last weeks of 1999 Aside from some minorremarks the prototyped design was accepted as reflecting a way of working that wassufficient and acceptable to determine the right for an unemployment allowance
Evaluation of the validated workflow design pointed out that all design objectiveswere met by it In particular cost was drastically minimized The average executioncost of the new workflow design for a single case was 1434 minutes This is a 73percent reduction of the original average service time of 538 minutes of the realworkflow It means about 1000 working days saved for the SIC company each yearThis reduction was mainly due to the high level of automation within the design To
Figure 8 Final Workflow Design
PRODUCT-BASED WORKFLOW DESIGN 259
a lesser degree the specific ordering of knockouts contributed to this decrease Incomparison with the existing workflow in operation about three-fourths of its opera-tions was automated As a side effect it was observed that for 10 percent of all casesno human intervention at all would be required to determine the right for a claim Inthis situation we can speak of straight-through-processing or unattended workflow[21] The effort in applying the PBWD method consisted in about 300 working daysThis clearly indicates that the redesign effort resulted in a significantly better workfloweven considering implementation costs
No fair comparison can be made with the results of a participative redesign ap-proach of the case study process which takes the existing process as a starting pointThe results of earlier redesign attempts within the SIC were not available to the au-thors However the deficiencies we attributed to prevailing design practice in theintroductionmdashlack of design detail and difficulty to leave the original design be-hindmdashare no characteristics of the new design
Lessons Learned
This case description shows that in specific circumstances exploring the completesearch space for the most favorable workflow design is feasible The COP did notsignificantly limit the size of the data elements to be considered in this case In gen-eral productdata models may become much larger so that the role of the COP be-comes more important For example the case described in Reijers [26] incorporates aproductdata model of some 600 data elements In this paper we do not considermore general ways of deriving workflow designs within the bounds of a COP indetail as it is a subject on its own The general outline of a general design for abreadth-first workflow model can be sketched as follows On basis of a COP and theproductdata model all execution sequences of production rules can be derived thathave a positive probability to deliver a value for the top element The model thatpursues the simultaneous execution of all these execution sequences will lead to thequickest possible result and is therefore the optimal breadth-first model Allinterleavings of this model can be used to determine a breadth-first workflow modelthat satisfies the targets for the used design criteria
Figure 9 The Different Levels of Use of the ExSpect Tool
260 REIJERS LIMAM AND VAN DER AALST
An important lesson learned from the case study about the applicability of PBWDis the importance of existing product specifications PBWD is restricted to fields wherea clear concept of the products to be delivered exists as specified in handbooksproduction procedures customer brochures and so on This means that PBWD ismore likely to be applied in legislative settings or within companies that already havesome tradition on administrative recording such as banks and insurance companiesParticipative approaches do not suffer from this restriction Nonetheless it seemscommon sense that any company should decide first what to do before it can con-sider how to do it best
Conclusion
IN THIS PAPER WE PRESENTED A NEW analytical way of looking at workflow processdesign By taking the product as a starting point many of the problems mentioned inthe introduction can be avoided A formal model a corresponding notion of conform-ance and a possible quantification of design criteria have been given A heuristicapproach toward product-driven workflow design has been presented as well as acase description that includes an actual workflow design
By now the consultancy firm Deloitte amp Touche applied the method presented inthis paper four times in client engagements in 1999 2000 and 2001 (including thecase study described in the eighth section) Business processes of a large Dutch bankand a national social security agency have been redesigned In each occasion at leasta 50 percent cost reduction and a 30 percent flow time reduction has been achievedwhile being accepted by the end users as valid and workable (see eg [26])
The issue whether PBWD as a method will be adopted by the business communityis to some extent open We already indicated that the ability to collect the data for theproductdata model (see the third section) and the existence of product specifications(see ldquoLessons Learnedrdquo in the eighth section) are important conditions for its applica-tion We feel that considering the risks involved for a company to adopt an innovativenew approach the number of engagements so far is hopeful In our opinion the suc-cess of the SIC company was not an incident but the result of a rational quantitativeway of looking at process redesign In the end what will convince general manage-ment to try PBWD is not its technical merit but the methodrsquos practical success insimilar settings Until a substantial track record has been built up it will primarily begreat pressuremdashsuch as the situation of the SIC in the case studymdashthat will movecompanies from the beaten path
A practical boost for the ease with which PBWD can be applied would come fromthe development of tools to model productdata models and derive workflow modelsA first step has been reached by the development of the ExSpectCOP toolbox thatallows the modeling of the productdata model and the evaluation of the COP Furtherresearch can lead to the incorporation of other relevant design criteria relevant defi-nitions techniques and algorithms
We have demonstrated through the case study that the design method cannot beindependent of the strategies companies may wish to adopt We have described infor-
PRODUCT-BASED WORKFLOW DESIGN 261
mally in which way a design method can be applied when defining design criteria andtheir relative importance Future research will deal with the formal description of thedesign method and the generation of corresponding workflows
Our workflow design approach so far has abstracted from the resource dimensionIn particular a workflow design generated with PBWD does not prescribe to whichpeople work that is generated by executing the workflow should be allocated to Bothstructural and dynamic demands on work distribution may be considered to be inte-grated in the design method (eg [4 20])
Finally in the third section we compared the classical BOM with our productdatamodel for workflow processes Current ERP systems allow for genericvariant BOMs[12 16] In this way it is possible to deal with large product families having millionsof variants van Veen and Wortman [30] As is shown in van der Aalst [1] this con-cept can be translated to workflow processes facing ad hoc and structural changes Itis interesting to extend the approach presented in this paper to deal with productfamilies Another topic for future research is the issue of variable cardinalities Westated that using cardinalities to represent that exactly the same piece of informationis required multiple times does not make much sense (see the third section) How-ever in some cases multiple instances of the same type of data element are requiredfor example multiple eyewitness reports for a car damage claim The productdatamodel presented in the second section does not take these cardinalities into account
REFERENCES
1 Aalst WMP van der Generic workflow models How to handle dynamic change andcapture management information In M Lenzerini and U Dayal (eds) Proceedings of theFourth IFCIS International Conference on Cooperative Information Systems (CoopISrsquo99) LosAlamitos CA IEEE Computer Society Press 1999 pp 115ndash126
2 Aalst WMP van der On the automatic generation of workflow processes based onproduct structures Computers in Industry 39 2 (1999) 97ndash111
3 Aalst WMP van der Reengineering knock-out processes Decision Support Systems30 4 (2000) 451ndash468
4 Aalst WMP van der and van Hee KM Workflow Management Models Methodsand Systems Cambridge MIT Press 2002
5 Aalst WMP van der Reijers HA and Limam S Product-based workflow design InW Shen Z Lin JP Barthes and M Kamel (eds) Proceedings of the Sixth InternationalConference on CSCW in Design Ottawa NRC Research Press 2001 pp 397ndash402
6 Aalst WMP van der de Crom PJN Goverde RRHMJ van Hee KM HofmanWJ Reijers HA and van der Toorn RA ExSpect 64 An executable specification tool forhierarchical colored Petri nets In M Nielsen and D Simpson (eds) Application and Theoryof Petri Nets 2000 (Lecture Notes in Computer Science 1825) Berlin Springer Verlag 2000pp 455ndash464
7 Aldowaisan TA and Gaafar LK Business process redesign An approach for processmapping Omega 27 5 (1999) 515ndash524
8 Crom PJN de and Reijers HA Using prototyping in a product-driven design ofbusiness processes In A DrsquoAtri A Solvberg and L Willcocks (eds) Proceedings of theOpen Enterprise Solutions Systems Experiences and Organizations Conference Rome LuissEdizioni 2001 pp 41ndash47
9 Davenport TH and Short JE The new industrial engineering Information technol-ogy and business process redesign Sloan Management Review 31 4 (1990) 11ndash27 1990
10 Deloitte amp Touche Management and ICT Consultants ExSpect 62 User ManualAmsterdam Bakkenist 1998
262 REIJERS LIMAM AND VAN DER AALST
11 Deloitte amp Touche Management and ICT Consultants ExSpect Amsterdam 2001 (avail-able at wwwexspectcom)
12 Erens F MacKay A and Sulonen R Product modelling using multiple levels of ab-stractionmdashInstances as types Computers in Industry 24 1 (1994) 17ndash28
13 Hammer M Reengineering work Donrsquot automate obliterate Harvard Business Review68 4 (JulyndashAugust 1990) 104ndash112
14 Hammer M and Champy J Reengineering the Corporation A Manifesto for BusinessRevolution New York Harper Business 1993
15 Hee KM van Information System Engineering A Formal Approach Cambridge Cam-bridge University Press 1994
16 Hegge HMH Intelligent Product Family Descriptions for Business Applications PhDdissertation Eindhoven University of Technology Eindhoven 1995
17 Herrmann Th and Walter T The relevance of showcases for the participative improve-ment of business processes and workflow management In RH Chatfield S Kuhn and MMuller (eds) Proceedings of the Participatory Design Conference (PDI rsquo98) Palo Alto CPSR1998 pp 117ndash127
18 Hofacker I and Vetschera R Algorithmical approaches to business process designComputers amp Operations Research 28 13 (2001) 1253ndash1275
19 Hupp T Polak G and Westgaard O Designing Work Groups Jobs and Work FlowSan Francisco Jossey-Bass 1995
20 Kumar A van der Aalst WMP and Verbeek HMW Dynamic work distribution inworkflow management systems How to balance quality and performance Journal of Man-agement Information Systems 18 3 (Winter 2001ndash2002) 157ndash193
21 MacSweeney G Traveling the long road to end-to-end processing Insurance amp Tech-nology 26 10 (2001) 30ndash34
22 OrsquoNeill P and Sohal AS Business process redesign A review of recent literatureTechnovation 19 9 (1999) 571ndash581
23 Orlicky A Structuring the bill of materials for MRP Production and Inventory Manage-ment 13 4 (December 1972) 19ndash42
24 Orman LV A model management approach to business process redesign Journal ofManagement Information Systems 15 1 (Summer 1998) 187ndash212
25 Peppard J and Rowland P The Essence of Business Process Re-Engineering UpperSaddle River NJ Prentice Hall 1995
26 Reijers HA Product-based design of business processes applied within the financialservices Journal of Research and Practice in Information Technology 34 2 (2002) 34ndash46
27 Reijers HA and Goverde RRHMJ Smooth cases An application of product-baseddesign [in Dutch] Deloitte amp Touche Amsterdam 1999
28 Sharp A and McDermott P Workflow Modeling Tools for Process Improvement andApplication Development Boston Artech House 2001
29 Sherwoord-Smith M People centered process re-engineering An evaluation perspec-tive to office systems re-design In BC Glasson I Hawryszkiewycz A Underwood and RAWeber (eds) Business Process Re-Engineering Information Systems Opportunities and Chal-lenges Proceedings of the IFIP TC8 Open Conference on Business Re-Engineering Informa-tion Systems Opportunities and Challenges Amsterdam Elsevier 1994 pp 535ndash544
30 Veen EA van and Wortmann JC Generative bill of material processing systemsProduction Planning and Control 3 3 (1992) 314ndash326
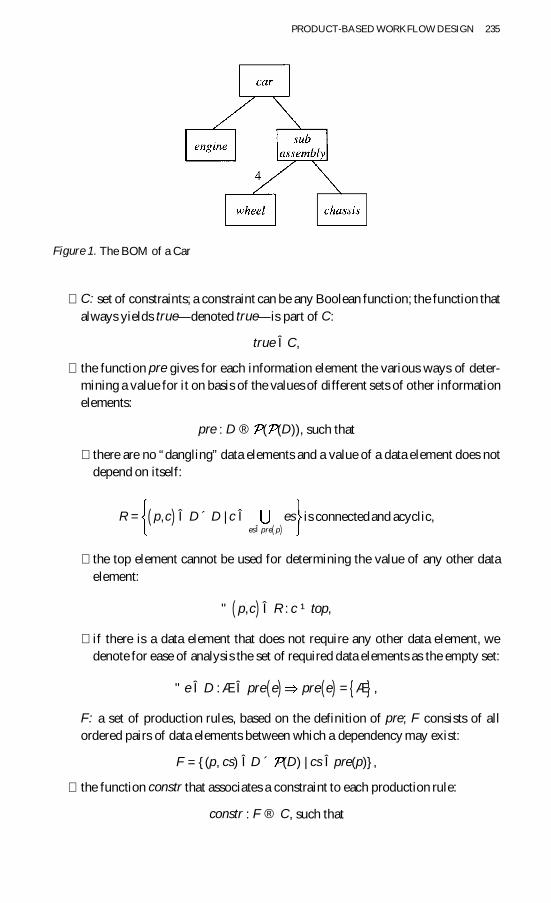
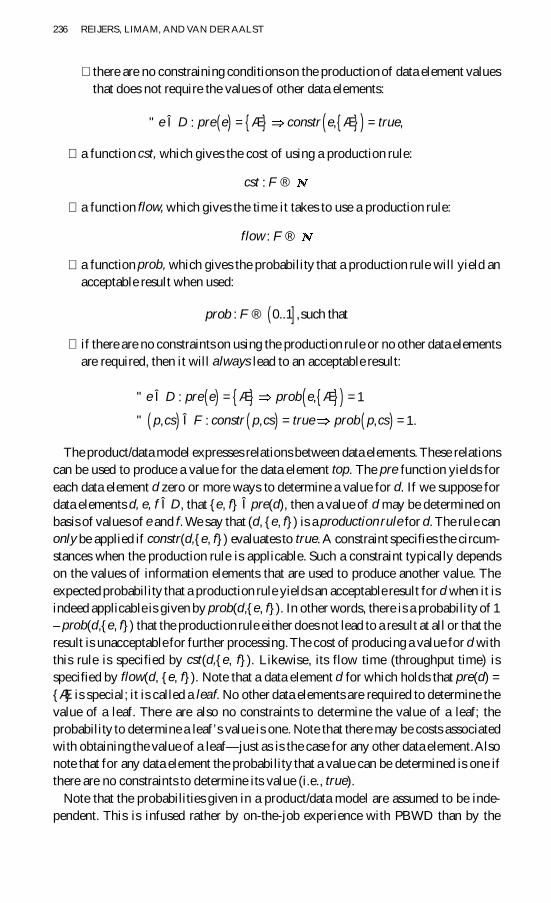
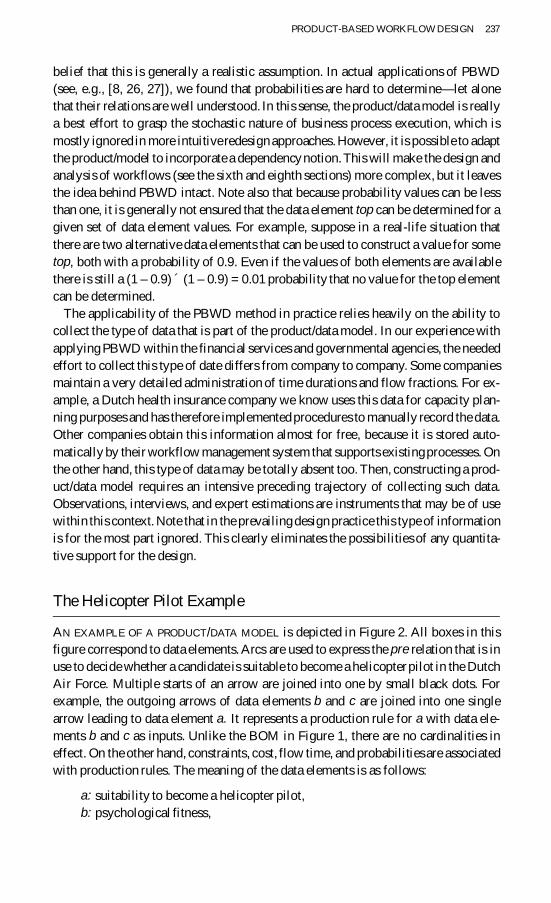
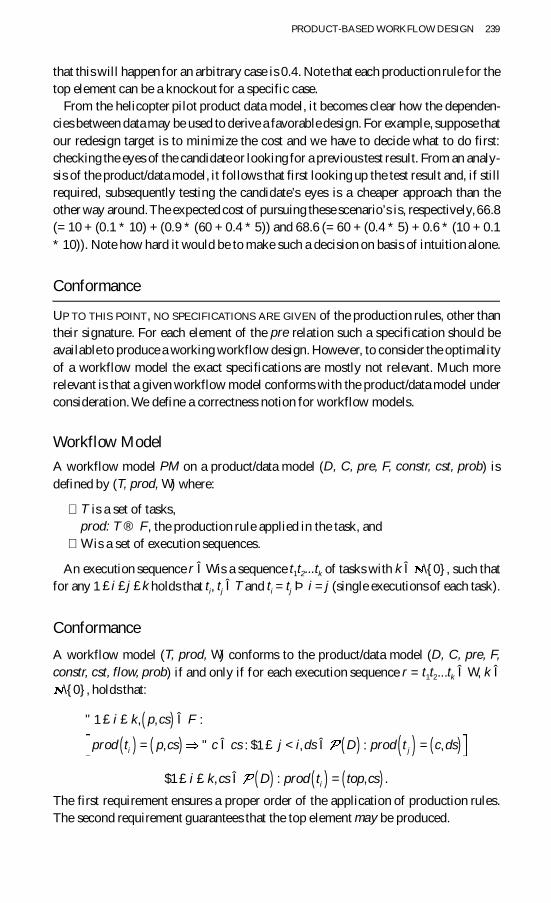
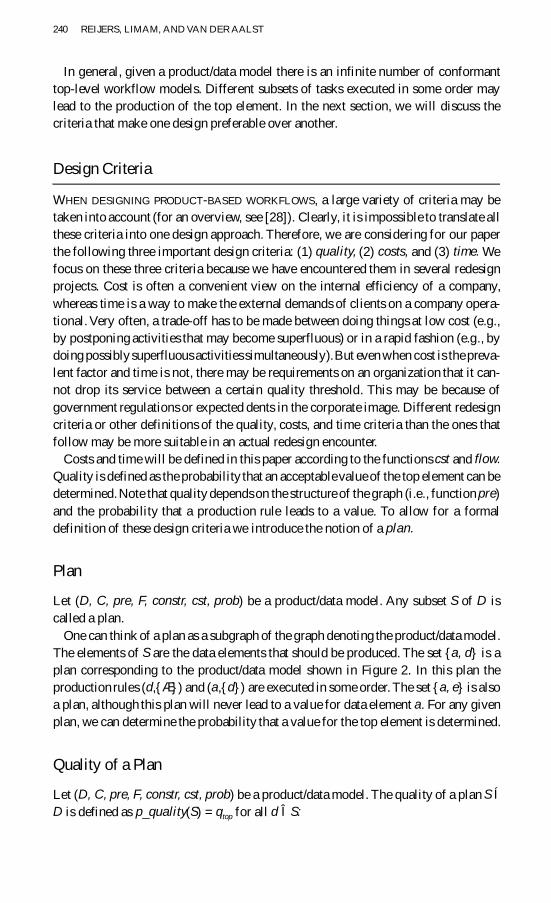
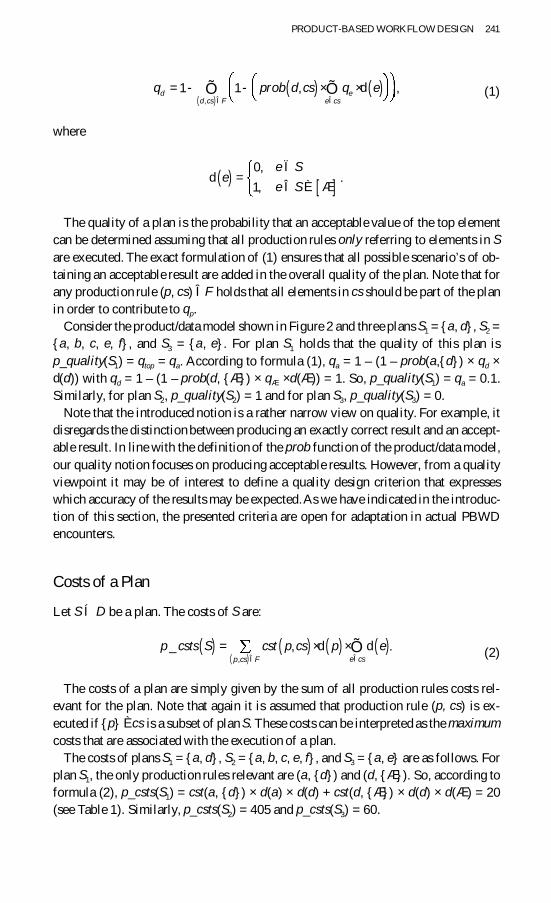
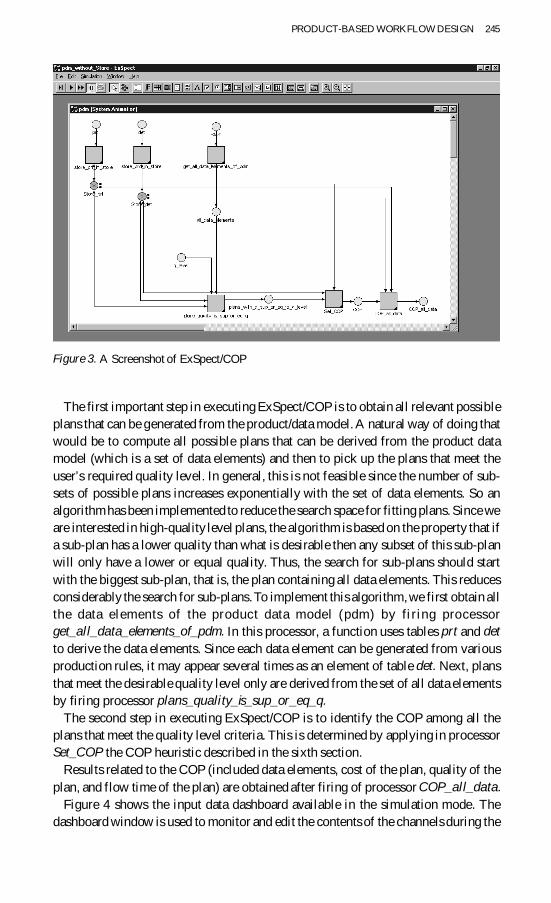
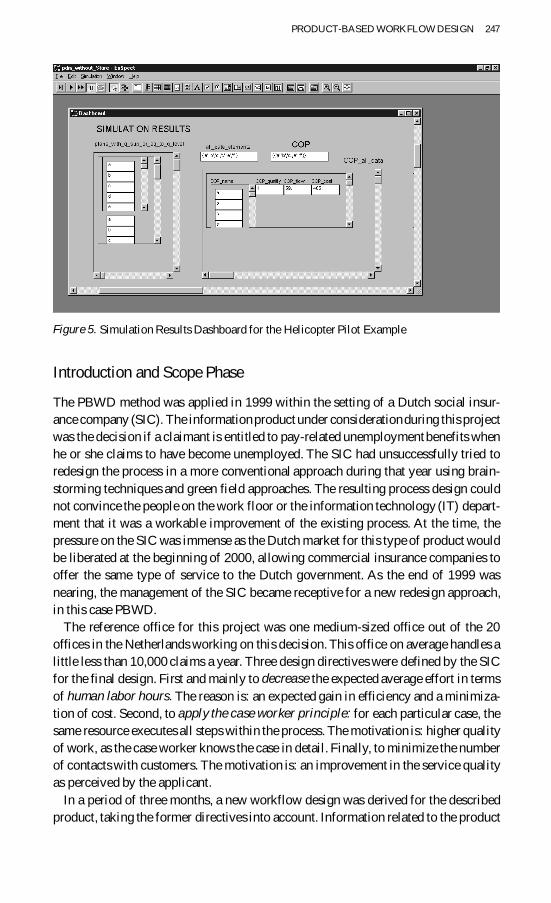
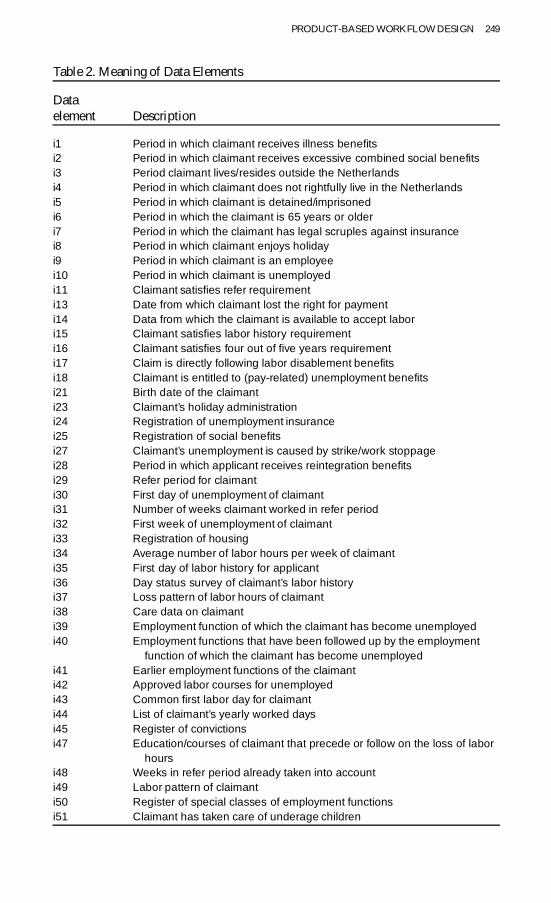
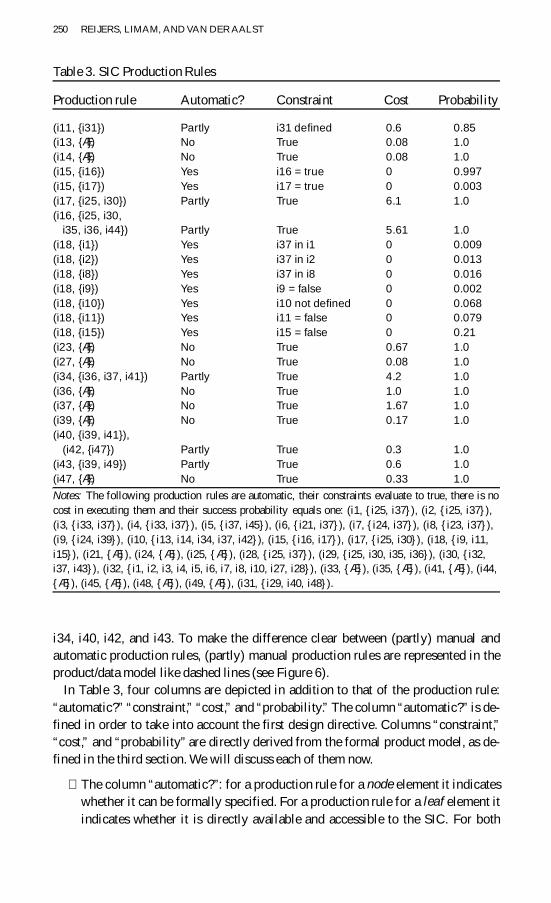
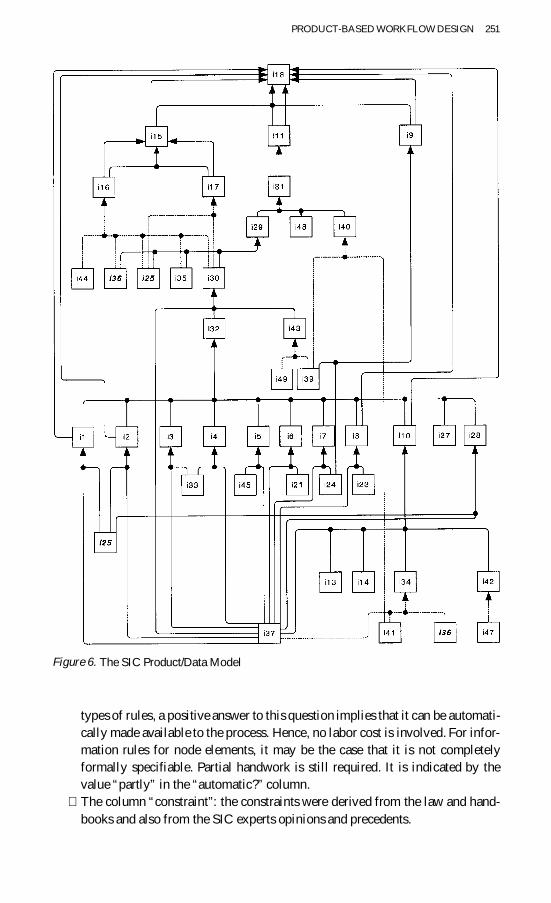
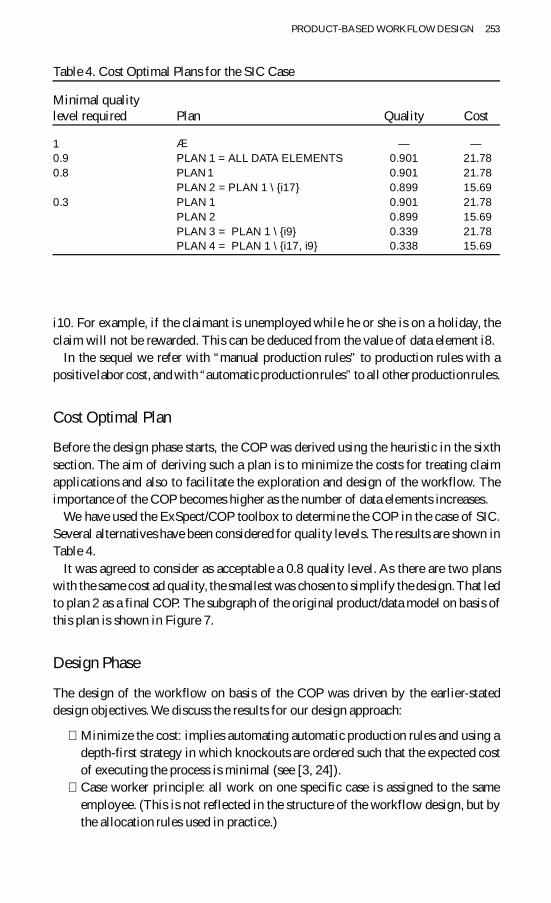
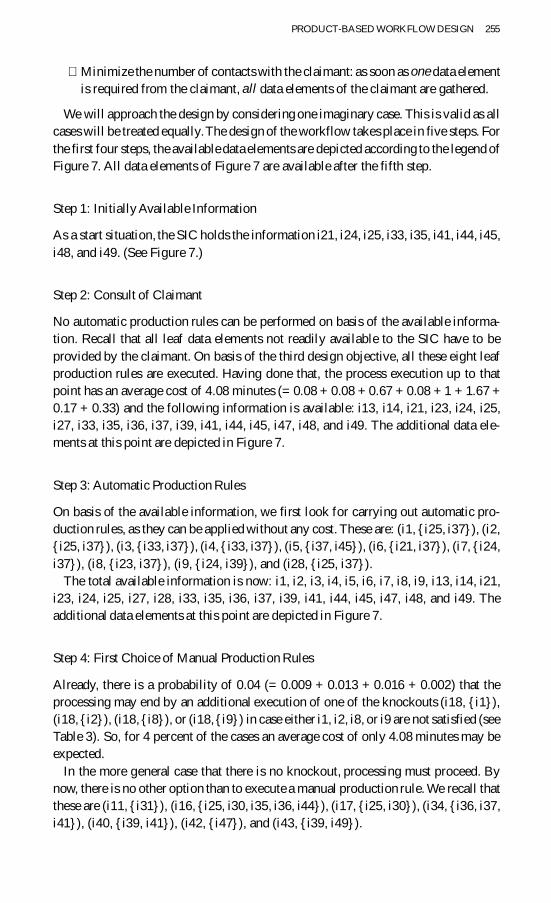
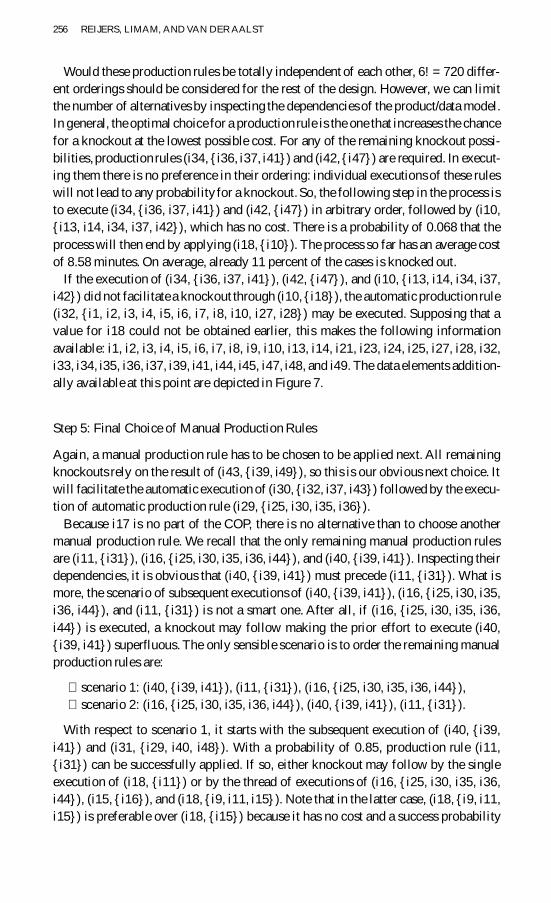
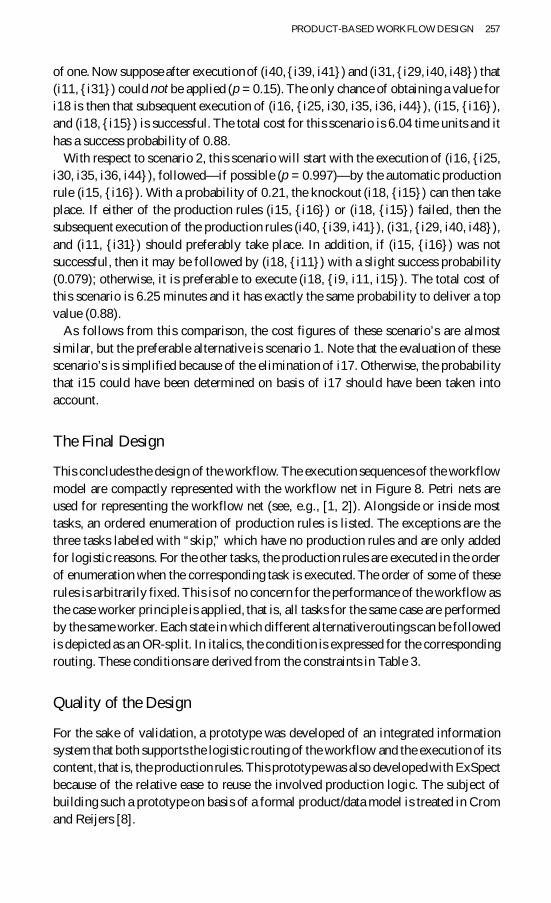
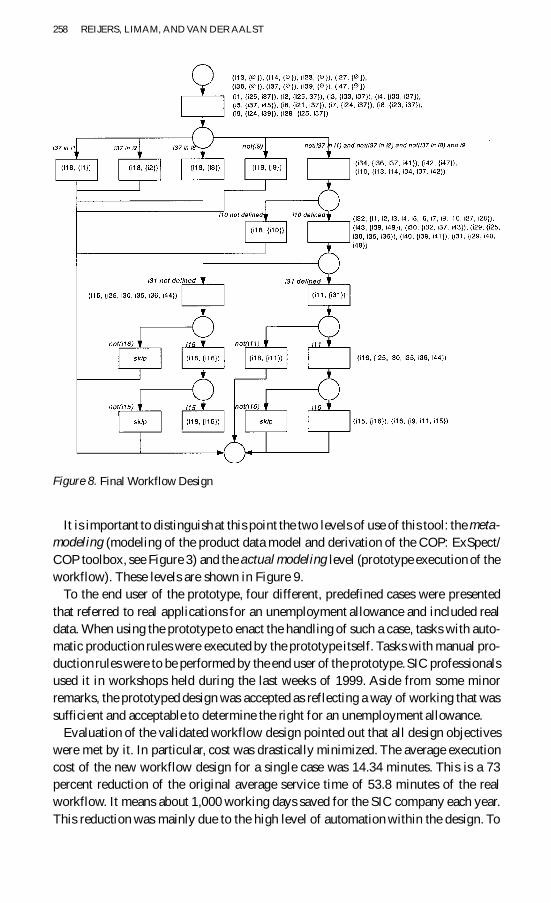
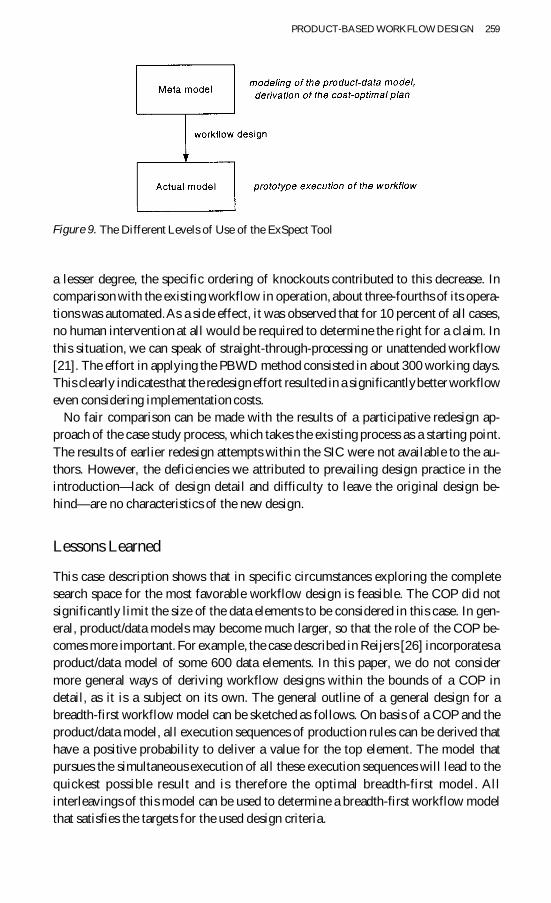