process management and technological innovation: ad1c25a6gwz7q5e.cloudfront.net/papers/1301.pdf ·...
TRANSCRIPT
Process Management and Technological Innovation: A Longitudinal Study of the Photography and Paint Industries
Mary J. Benner University of Pennsylvania Michael Tushman Harvard University
© 2002 by Johnson Graduate School, Cornell University. 0001 8392/02/47040676/$3.00.
We thank Francis Narin and Mike Albert of CHI Research for patent data and advice, and Jenny Chatman, Lee Fleming, Giovanni Gavetti, Charles O'Reilly, Nelson Repenning, and Toby Stuart for comments on earlier drafts. We are also grateful to ASQ Associate Editor Reed Nelson and three anonymous reviewers for careful reviews and helpful suggestions. Thanks also to Linda Johanson for excellent editorial guidance. An earlier version of this paper was published in the 2001 Best Paper Proceedings of the Academy of Management, Business Policy and Strategy Division.
This research explores the impact of process manage ment activities on technological innovation. Drawing on research in organizational evolution and learning, we suggest that as these practices reduce variance in organi zational routines and influence the selection of innova tions, they enhance incremental innovation at the expense of exploratory innovation. We tested our hypotheses in a 20year longitudinal study of patenting activity and ISO 9000 quality program certifications in the paint and photography industries. In both industries, the extent of process management activities in a firm was associated with an increase in both exploitative innova tions that built on existing firm knowledge and an increase in exploitation's share of total innovations. Our results suggest that exploitation crowds out exploration. We extend existing empirical research by capturing how process management activities influence the extent to which innovations build on existing firm knowledge. We suggest that these widely adopted organizational prac tices shift the balance of exploitation and exploration by focusing on efficiency, possibly at the expense of long term adaptation.*
Process management and its associated set of managerial practices and programs (e.g., total quality management, Six Sigma, ISO 9000) is perhaps the most important managerial innovation of the last 20 years (Cole and Scott, 2000), so much so that it has taken on aspects of a managerial fad (Abrahamson, 1996). Over this period, managers have per fected process methodologies and practices, even as schol ars have explored the nature and boundaries of this phenom enon (Cole and Scott, 2000). The promise of process management is that focusing on variance reduction and increased process control will drive both speed and organiza tional efficiency (e.g., Garvin, 1988; Clark and Fujimoto, 1991; Harry and Schroeder, 2000).
The process revolution's initial focus was on manufacturing, but its reach has since extended into administrative, product development, distribution, and resource allocation processes in organizations (Garvin, 1995, 1998; Powell, 1995; Heaphy and Gruska, 1995; Cole, 1998). In particular, process manage ment's potential to affect technological innovation directly has also increased, through programs like ISO 9001 and Design for Six Sigma, specifically concerned with extending process management techniques into product design and development activities (Harry and Schroeder, 2000; ISO, 2003). As the influence of processfocused activities increas ingly spreads to areas of exploration or variationcreation in organizations, the question of how it affects technological innovation is increasingly important (Sutcliffe, Sitkin, and Browning, 2000).
Although Winter (1994: 63) observed that quality manage ment may be "indispensable in the struggle for competitive survival," the emphasis on process management techniques and methods has taken place in competitive contexts that require a firm to be both efficient and innovative, to explore as well as exploit (March, 1991; Tushman and O'Reilly, 1997). As process management techniques celebrate variance reduction and control, they may accentuate incremental,
676/Administrative Science Quarterly, 47 (2002): 676706
Process Management
exploitative innovation at the expense of exploratory innova tion (Sutcliffe, Sitkinf and Browning, 2000; Benner and Tush man, 2003). While exploitative activities help firms learn and adapt quickly in the short term, those same activities may inhibit experimentation and exacerbate inertia and, in turn, impede organizational responsiveness to environmental shifts (Levinthal, 1991, 1997a; Repenning and Sterman, 2002).
Despite the ubiquity and endurance of process management techniques in practice and their potential to affect exploration, there has been little research on how these practices affect technological innovation. Most process management literature is prescriptive, aimed at practicing managers to pro mote the use of process management in organizations and citing the expected benefits of improved efficiency and profits (e.g., Garvin, 1988, 1995; Harrington and Mathers, 1997; Harry and Schroeder, 2000). Several empirical studies have explored the crosssectional relationships between process management adoption and financial performance (Powell, 1995; Ittner and Larcker, 1997; Samson and Terziovski, 1999) but have found no conclusive evidence of the expected bene fits associated with process management techniques. Ittner and Larcker (1997) found the use of process improvement techniques associated with improved performance in the auto industry but not the computer industry, while Powell (1995) and Samson and Terziovski (1999) found no evidence that the specific use of process improvement techniques affected financial performance. In addition, research shows that process management may result in paradoxical out comes, such as poor financial performance following process focused efforts (e.g., Garvin, 1991; Sitkin, 1992; Sterman, Repenning, and Kofman, 1997). These equivocal results highlight the importance of research into the contingent effects of process management on both short and longterm organizational outcomes. While some research has begun to explore process management's potential to affect exploration (Sutcliffe, Sitkin, and Browning, 2000; Benner and Tushman, 2003), empirical work has not examined the effects of process management on technological innovation. We under take that task in this paper.
PROCESS MANAGEMENT AND TECHNOLOGICAL INNOVATION Process management practices are the shared underlying component of a series of qualityrelated initiatives, including total quality management (TQM), the Malcolm Baldrige Award criteria, ISO 9000, and Six Sigma programs. Process management techniques focus on improving an organization's efficiency through highlevel coordination of an organization's activities in a rationalized system of endtoend processes. The process management philosophy and associated procedures, focused on rationalizing, coordinating, and repeating organizational processes, are a comprehensive problemsolving heuristic that is processoriented, customer focused, factbased, and participative throughout a firm (Winter, 1994).
Process management techniques comprise three main activi ties. First, concerted effort is undertaken to map or docu
677/ASQ, December 2002
ment routines that underlie the delivery of an organization's product or service across the organization (Hammer and Champy, 1993; Garvin, 1995; Harrington and Mathers, 1997). Routines are then subject to process improvement, aimed particularly at incremental change that rationalizes processes and streamlines interfaces and handoffs between interdepen dent organizational subunits (Dean and Bowen, 1994; Ander son, Rungtusanatham, and Schroeder, 1994; Garvin, 1995; Harry and Schroeder, 2000). Process management efforts rely on ongoing measures of process efficiency and effectiveness, such as improved yields, reduced waste and time to market for new products, and customer satisfaction, to drive continuous improvement efforts (Garvin, 1988; Hackman and Wageman, 1995; Powell, 1995; Cole, 1998). In an organiza tion utilizing process management approaches, the cus tomers of interest are not only the external customers of the organization's outputs, but also the internal customers at points of handoff between organizational processes (Hammer and Stanton, 1999).
Process management activities are often applied to new product development processes (Cole and Scott, 2000; Repenning and Sterman, 2002). Process efficiency and effec tiveness for improvement efforts in new product develop ment processes are often measured by time to market for new products and customer satisfaction. Customer satisfac tion also involves internal customers, that is, owners of downstream processes. In this case, product development effectiveness would be gauged by how well it meets the needs of the internal customers downstream from product development, in manufacturing and distribution processes. The product development process, in turn, is the internal cus tomer of the research activities and other processes upstream. A focus on continuous improvement in new prod uct development is intended to alter the handoffs or inputs from upstream research activities. In turn, a focus on continu ous improvements in efficiency in manufacturing or distribu tion processes will likely affect the outputs or handoffs resulting from the product development process upstream. Process management improvement efforts thus aim at streamlining the entire system of processes across an organi zation, through incremental improvements in processes and handoffs between them, guided by the immediate feedback of shortterm measures.
Once processes have been mapped and improved, the last element of process management involves adherence to rou tines through the adoption of standardized best practices throughout an organization (Hackman and Wageman, 1995; Harrington and Mathers, 1997; Mukherjee, Lapre, and Van Wassenhove, 1998). This phase ensures that organizational processes are repeated, allowing for continued efficiency improvements.
Because they focus on adherence to routines, process man agement activities have the potential to affect an organiza tion's technological innovations. Technological innovation is an important source of variation in organizations and, in turn, a root of organizational adaptation (Nelson and Winter, 1982; Tushman and Nelson, 1990). Technological innovation pro
678/ASQ, December 2002
Process Management
vides organizations with options for either initiating or responding to technological change. Dynamic capabilities are anchored in both exploiting current technologies and resources for efficiency benefits and in generating new pos sibilities through exploration (March, 1991; Teece, Pisano, and Shuen, 1997; Rosenkopf and Nerkar, 2001). Research in technological innovation has noted organizational tendencies toward local search and exploitation (e.g., Helfat, 1994; Sorensen and Stuart, 2000) and the role of stable routines in incumbents' inability to respond appropriately to technologi cal change (e.g., Henderson and Clark, 1990; Christensen and Bower, 1996). More generally, work in learning and evolution has suggested that increased routinization and coordination in an organization's activities may speed responsiveness in sta ble environments but also contributes to resistance to change, competency traps, and inadequate or inappropriate responses in changing environments (e.g., Levitt and March, 1988; LeonardBarton, 1992; Cohen and Bacdayan, 1994; Sull, Tedlow, and Rosenbloom, 1997; Levinthal, 1997b). Abernathy (1978) argued that as firms in the auto industry became focused on incremental change and improvement, they were increasingly unable to undertake more radical, variation creating forms of innovation.
Exploitation and Exploration in Technological Innovation Exploration and exploitation have been characterized as fun damentally different search modes (March, 1991). While exploitation involves local search that builds on a firm's exist ing technological capabilities, exploration involves more dis tant search for new capabilities (March and Simon, 1958; Weick, 1979). Exploitative innovations involve improvements in existing components and architectures and build on the existing technological trajectory, whereas exploratory innova tion involves a shift to a different technological trajectory (Christensen, 1997; Rosenkopf and Nerkar, 2001). Empirical literature reflects this dichotomy, often distinguishing between innovations that leverage a firm's existing knowl edge and innovations that rely on no previous firm knowl edge (e.g., Sorensen and Stuart, 2000; Rosenkopf and Nerkar, 2001). For example, innovation researchers often dis tinguish between patents that cite one or more prior patents of the focal firm and patents that cite no prior patents of a focal organization. Implicit in such approaches is an assump tion that truly exploratory, varianceincreasing activities require distant search and a departure from a focal firm's store of current skills and capabilities. The idea of exploration as distant search can be extended by characterizing an orga nization's innovative activity along a continuum, measured by the extent to which it is anchored in knowledge used in a firm's previous innovations. Innovation is increasingly exploratory the more it departs from knowledge used in prior innovation efforts and, conversely, increasingly exploitative the more deeply anchored it is in existing firm knowledge. Process management's influence on exploitation. Process management activities can influence technological innovation by affecting an organization's tendencies to build on familiar knowledge in its innovation efforts. There are two main mechanisms by which process management activities might
679/ASQ, December 2002
influence innovation in organizations: process management's effects could unfold both through incremental learning, as process management activities are increasingly applied to an organization's routines (e.g., Levitt and March, 1988; Lant and Mezias, 1992), and through its influence on the internal selec tion environment for innovation projects.
Process management as a system of incremental learning arises following the adoption of process management initia tives, as best practices are established and organizational activities are repeated in these standard processes. Process management specifically prescribes a focus on incremental change in existing organizational routines, and its accompany ing practices support this philosophy (e.g., Adler, 1993; Anderson, Rungtusanatham, and Schroeder, 1994). Process management entails a view of improvements as controlled experiments that involve repetition of practices and measure ment prior to making small, testable changes (Hackman and Wageman, 1995; Harry and Schroeder, 2000). Organizations collect and rely on measures of efficiency (e.g., time to mar ket for new products) and quality (customer satisfaction) to guide improvement efforts. Christensen and Bower (1996) showed that among disk drive manufacturers, stable resource allocation processes that were focused on existing customer satisfaction channeled innovation away from architectural innovations for emergent customer sets. As process management creates an organizational focus on measure ments to satisfy existing customers, it is also likely to chan nel innovation into areas that benefit existing customers and exploit existing knowledge.
Organizational learning research suggests that repetition of and incremental improvement in established practices results in both increased efficiency and proficiency in those activities (Levitt and March, 1988; March, 1991; Levinthal and March, 1993). Repetition through routines not only reduces the time to carry out the activity but also reduces the variance in per formance of the routine, reflecting increased proficiency. Thus, as incremental learning associated with process man agement extends in an organization, the organization becomes not only more efficient in a set of practices but also increasingly reliable as the variation in its performance is reduced (March, 1991; Levinthal and March, 1993). Moreover, as process management activities apply directly to product development processes (Cole and Scott, 2000), this increased efficiency and reduction in variation associated with increasingly reliable processes directly affects the firm's innovations. Organizations will innovate more rapidly as they incrementally improve innovation processes, yet the variance in the resulting innovation and/or new product development outcomes will be reduced. Increased process management activities will be associated with enhanced incremental learn ing along a given technological trajectory.
The use of process management also provides an enabling structure that allows for more efficient horizontal coordination of activities toward a common organizational goal (e.g., Adler and Borys, 1996). Tighter coupling occurs with the application of process management activities to intentionally streamline the system of organizational routines against the dual objec
680/ASQ, December 2002
Process Management
tives of efficiency and quality. More specifically, tighter link ages emerge as efforts to improve downstream processes spur incremental changes in the outputs or handoffs from upstream, supplying processes. For example, focused efforts to improve manufacturing processes result in tweaking new product developments to better leverage downstream processes and spur continued measurable improvements in manufacturing efficiency and internal customer satisfaction. Such changes in the product development processes and outputs are themselves likely to be incremental, while, at the same time, the handoffs between the product development and manufacturing processes become more efficient and streamlined. Increasing stability and reliability as it applies to systems of routines is an intended outcome of process management practices (e.g., Harry and Schroeder, 2000), and it emerges both as processes are repeated in best practices and as process management activities are used to coordinate link ages between organizationspanning routines. Efforts toward tighter horizontal coordination create greater interdependen cies and interactions (Levinthal, 1997b; Siggelkow, 2001). Increasing congruence among organizational routines creates systemwide benefits of continued incremental change, leading to further stability and focus on incremental change. Such tightening of internal linkages and communication patterns also increasingly affects the types of technological innova tions that can be produced (cf. Henderson and Clark, 1990).
Thus, while process management activities involve an explicit focus on continuous innovation and change, particularly at the outset (e.g., Winter, 1994; Hackman and Wageman, 1995), these practices trigger searches for solutions increasingly in the neighborhood of existing skills and knowledge and are likely to spur innovations that utilize existing or familiar knowledge. The ongoing repetition of sets of established best practices further promotes incremental innovation and change through experiential learning processes (Levitt and March, 1988). The behavioral consistency and reliability in the concerted efforts inherent in process management activities echo a strong culture focused on incremental innovation for existing customers (Miller, 1993; Sorensen, 2002). Stated for mally, we predict:
Hypothesis 1: The greater the extent of process management activ ities in a firm, the larger the number of exploitative innovations. Process management's influence on exploration. The first order learning and tighter coordination associated with process management activities also actively prevents non incremental innovation and change (e.g., Hannan and Free man, 1984; Tushman and Romanelli, 1985; Sull, Tedlow, and Rosenbloom, 1997; Levinthal, 1997b). Activities associated with increased variation and uncertainty, such as improvisa tion (Miner, Bassoff, and Moorman, 2001) or brainstorming (Sutton and Hargadon, 1996) may be inconsistent with a focus on adherence to established routines and measures of increased efficiency and are therefore likely to be driven out in a process management context. Further, over and above variancereducing pressures, process management's influ
681 /ASQ, December 2002
ence on exploratory innovations works through a second powerful mechanism: the use of process management activi ties in firms affects innovation selection by increasing the salience of innovation efficiency and effectiveness measures and the perceived payoffs of competing innovation projects.
Firms must continually balance the tradeoffs between proto types or technologies that leverage product development skills and are rapidly commerciaiizeable and those that lie out side the current dimensions of core capabilities (Leonard Barton, 1992). Innovations that serve different customer sets or rely on new and unknown technologies are highly uncer tain and difficult to measure (Henderson et aL, 1998). Such exploratory activities are increasingly unattractive compared with the shortterm measurable improvements in competen cy arising from exploitation (Levinthal and March, 1993; Christensen, 1997). While the benefits of exploitation are cer tain, positive, and close in time, the returns to exploratory activities, if any, are distant and uncertain (March, 1991; Levinthal and March, 1993). The shortterm certainty of exploitation crowds out exploratory learning and innovation by triggering a reduction in investments in experimentation (Levinthal and March, 1993).
As an organization's routines are increasingly honed under the purview of process management activities, they become measurably more efficient (e.g., Sterman, Repenning, and Kofman, 1997). Innovations that leverage an improved system of routines have immediate and predictable benefits. For example, new product developments that rely on inputs obtained through efficient purchasing processes or that use distribution channels reached through streamlined supply chain processes will show immediate promise against effi ciency measures like speed to market. The benefits of exploitation become increasingly salient. Organizational cul tures focused on measures of incremental improvement squeeze out more distant innovations in favor of further improvements in the existing capabilities and skills defined by existing routines (Sorensen, 2002). Similarly, a culture of continuous improvement may trigger conflict, mistrust, and increasing control, which, in turn, dampens exploration (Repenning and Sterman, 2002).
While process management may enable rapid development of competenceenhancing innovations, it may also create innovation traps that restrict exploration (cf. Levitt and March, 1988; LeonardBarton, 1992). Process management's stated objective of controlling processes and "attacking variation" (Harry and Schroeder, 2000) contrasts with prescriptions for variationincreasing activities and redundancy designed to increase organizational variety (Burgelman, 1983; Nonaka and Takeuchi, 1995). Process management, in its philosophy and associated tools, facilitates tighter nonhierarchical linkages between routines and subunits, and the increasingly inertial system actively inhibits exploratory innovations that depart from capabilities defined in established routines (Hannan and Freeman, 1984; Sull, Tedlow, and Rosenbloom, 1997).
The shortterm effects of process management activities on exploitative innovation also have longerterm ramifications for
682/ASQ, December 2002
Process Management
exploratory innovation. Innovative activities in a previous period can have important effects on an organization's options for future innovation by providing a knowledge base that can rapidly absorb technological competence from external sources (Levitt and March, 1988; Cohen and Levinthal, 1990). An organization that lacks exploration in one period may be excluded from areas of future exploratory activity by the lack of a relevant knowledge base (e.g., Cohen and Levinthal, 1990; Teece, Pisano, and Shuen, 1997). By the very nature of their underlying philosophy and methods, process manage ment activities may drive out exploratory innovation. We therefore hypothesize:
Hypothesis 2: The greater the extent of process nnanagement activ ities in a firm, the smaller the number of exploratory innovations.
Our arguments above further suggest a "crowdingout" hypothesis (March, 1991; Levinthal and March, 1993). Because of powerful incremental learning effects and the selection environment associated with incremental innova tion, organizations that adopt process management activities will favor exploitative innovation at the expense of explo ration. Thus, we hypothesize not only changes in levels of exploitation and exploration in the context of process man agement activities but also a shift toward an increasing share of exploitative innovations at the expense of exploratory inno vation:
Hypothesis 3: The greater the extent of process management activ ities in a firm, the larger the share of innovations that are highly exploitative.
In studying the effects of process management, a number of researchers have explored the impacts of total quality man agement (TQM) programs in organizations in theoretical and empirical work (e.g., Sitkin, Sutcliffe, and Schroeder, 1994; Dean and Snell, 1996; Easton and Jarrell, 1998; Staw and Epstein, 2000) and in case studies (e.g., Kolesar, 1993; Wruck and Jensen, 1994; Sterman, Repenning, and Kofman, 1997). But interpretation of studies of TQM programs has been hampered by heterogeneity in the practices actually adopted by organizations. TQM programs include many features that are defined in different ways by researchers (Hackman and Wageman, 1995), and it is unclear which practices organizations adopt and, specifically, whether the adopted practices involve mapping, improving, and adhering to processes. Even so, results from TQM studies are also equiv ocal. We have therefore focused on firms' use of ISO 9000. While the ISO 9000 program obviously represents only one of the myriad ways organizations engage in process manage ment activities, it offers several advantages. First, since its initiation in 1987 by the International Organization for Stan dards (ISO), ISO 9000 has been widely adopted in industries like the photography and paint industries, which we studied (Quality Digest 1999; ISO, 2003). Second, the ISO 9000 pro gram's focus is on ensuring that organizations create consis tent, stable processes through process documentation and adherence (Harrington and Mathers, 1997; ISO, 2003), mak ing it a good measure of the process management phenome non. Its motto is "document what you do and do what you
683/ASQ, December 2002
document" (ISO, 2003). Third, the considerable risk of obtain ing inaccurate data about the actual use of process manage ment practices from more subjective approaches is mitigated by a thirdparty audit and certification program, by registrars such as Underwriters Laboratories (UL). These registrars pro vide the data on firms' use of ISO 9000, helping ensure that organizations have undertaken at least some verifiable activi ties focused on documenting and adhering to processes. Fourth, these data allow us to construct a longitudinal mea sure of the extent of process management. The more ISO 9000 certifications a firm obtains over time, the more likely it is that it is increasing its focus on process management activities. In addition, minimal adoption of ISO 9000 for its legitimacy benefits (firms that deem themselves "ISO 9000 Certified" with one certification) is inherently revealed, as we can assess the effects on innovation, reflected in patenting activity, as an organization increases its ISO 9000 intensity. Patents are useful for measuring technological innovation, as they are only awarded to novel, nonobvious designs that rep resent advancements over existing technology. Researchers have argued that patent data are a reliable and valid measure of innovative activity (e.g., Griliches, Pakes, and Hall, 1987; Albert et al., 1991; Podolny and Stuart, 1995).
METHODS We tested our hypotheses with two largesample, longitudi nal studies of firms in the photography and paint industries over the period 1980 to 1999. We selected the photography and paint industries for differences in their competitive con texts and to rule out singleindustry effects. Information on the paint industry was taken from company reports available from Investext, in addition to several years of Moody's indus try reports. Background information on digital photography came from investment research reports, Moody's industry reports, company articles available through searches, other publicly available information, and the Future Image Report.
The paint industry during this period was a stable competitive arena (Fredrickson and laquinto, 1989). It was characterized by intense costreduction pressures on paint manufacturers from large purchasers like Home Depot and Lowe's (e.g., Cerankosky, 1999). These cost pressures spurred continued incremental changes focused on improving efficiency. More over, technological change in the paint industry was incre mental during this period. Beginning in the mid1980s, in response to environmental regulations aimed at reducing emissions of organic compounds, the industry was forced to reduce the solvents used in paint. Firms in the industry focused on improving paint and process technology to allow the use of less paint and solvents. These characteristics sug gest a stable industry characterized by incremental techno logical change (cf. Abernathy and Utterback, 1978; Tushman and Anderson, 1986; Anderson and Tushman, 2001).
In contrast, the photography industry offers an opportunity to test our hypotheses in the context of more technological change and uncertainty. Since the mid1980s, the photogra phy industry had been undergoing a technological change, from chemicalbased film technology to digital (Tripsas and
684/ASQ, December 2002
Process Management
Gavetti, 2000), and had a high level of uncertainty. The period under study was an era of ferment, as multiple approaches to filmless, electronic cameras competed with each other and against filmbased cameras (Tushman and Murmann, 1998). This was also a period of market turbulence, reflected in high uncertainty about customers' acceptance of digital technology, changes in distribution channels from drugstores and retail film developers to large consumer electronics chain stores, and ongoing concerns about rent capture (Trispsas and Gavetti, 2000).
Level of Analysis Our level of analysis is a firm. Our sample includes single business firms and the particular segments of multibusiness firms that operate within the two industries. We have made an effort to get data on patenting and process management pertaining specifically to a firm's activities within the paint industry or photography industry, that is, at the businessunit level. The advantage of our approach is that it enabled us to study a comparable sample of organizations participating in a particular industry. Although we analyzed firm activities and outcomes at the businessunit or businesssegment level, however, there is only one business unit for each firm in our study, so we use the terms firm and business unit inter changeably here. In all cases we have in mind that firm's activities specifically in the industry under study.
Sample and Measures We developed two longitudinal databases to test our hypotheses. We first compiled lists of organizations with any operations in the paint or photography industry, drawn from Dun & Bradstreet's Million Dollar Database, Moody's corpo rate index, and other sources in multiple years. We then used these lists to obtain our measures of patenting and process management. The resulting samples included 98 firms in the photography industry and 17 firms in the paint industry that had patents in the patent classifications related to photogra phy and paint (discussed below).
Dependent Variables Exploitative and exploratory technological innovation.We developed our dependent variable, measures of technological innovation, using data from the U.S. Patent and Trademark Office (USPTO). We constructed our data on patent activity using information from patents awarded from 1980 through 1999. Patent abstracts contain information about the assignee (the company that owns the patent), the threedigit patent classification, indicating the technology area in which the patent is granted (there are over 400 patent classifica tions), and the technological antecedents of the invention, indicated by citations to prior patents.
As our interest was in the activities of these firms as they pertain to the photography or paint industries, we worked with patent data experts to select patents in the technology classifications that represented the photography and paint industries. Our data for the photography industry were drawn from 12 patent classifications broadly associated with pho
685/ASQ, December 2002
tography and imaging technology. These classes and their definitions are listed in the Appendix. A broad definition of photography and imaging is important to represent accurately the full range of patents pertaining to innovations in the pho tography industry. For example, patents pertaining to the development of digital camera technology often fall into patent class 348, television, rather than into patent class 396, photography. In the paint industry, we drew patents for the firms on our list from patent class 106, representing coating compositions.
We created multiple measures of exploitation and exploration based on the extent to which a firm's innovation efforts were anchored in its existing knowledge. Each patent abstract pro vides a list of citations to previous patents, that is, the "prior art" upon which the current patent builds. Using this informa tion, we assessed the extent to which a firm's patenting efforts built on knowledge it had used in its previous patents. The prior patents cited by a patent were coded as existing firm knowledge if they were either repeat citations (patents the firm had previously cited) or selfcitations (the firm's own previous patents). That is, we assumed that the extent to which a firm was drawing on its existing knowledge was reflected in the extent to which it cited patents that it had also cited in earlier patenting efforts or, in cases when a patent was cited for the first time by a firm, if it was the firm's own prior patent. With these data, we then categorized patents according to the proportion of each one that was based on existing knowledge and developed several patent count measures for each firm. At one extreme, the most exploratory patent category comprises patents that depart entirely from prior firm knowledge. In this case, our variable is the number of patents for a firm in each year having no repeat or selfcitations. This measure of exploration echoes definitions used in previous literature (e.g., March, 1991; Sorensen and Stuart, 2000). We also constructed measures at the 10 percent, 20 percent, and 40 percent levels, repre sented as the number of patents by year for each firm that constitute 10 percent or less, 20 percent or less, and 40 per cent or less, respectively, of the citations to prior knowledge of the focal firm. Thus, we captured a firm's innovation profile by assessing the number of patents in each of these cate gories, year by year.
At the other extreme, we constructed a similar measure of exploitation as the number of patents with 100 percent of their citations to familiar patents, that is, patents cited by the firm in an earlier innovation effort and/or selfcitations. Simi larly, our second exploitation measure, the 80 percent cate gory, consists of the count of patents in each firmyear with at least 80 percent of their citations to existing firm knowl edge, as measured by familiar patents. We developed similar measures at the 40 percent, 60 percent, 90 percent, and 100 percent level. These measures allowed us to construct a pic ture of the extent to which a firm's patenting efforts each year are more or less anchored in prior knowledge from pre vious innovation efforts. Further, it allowed us to examine how a firm's intensity of exploitation and exploration changed
686/ASQ, December 2002

Process Management
as process management activities were undertaken in the organization.
Our measures further improve on prior research by focusing not only on selfcitations as measures of exploitation but also on repeat citations by a firm. Prior empirical work has been based largely on measures of selfcitations, that is, whether a firm cites its own previous patents. Our measures provide better insight into the extent to which a firm's innovation builds upon or exploits familiar knowledge it has used in prior patenting efforts and does not restrict the definition of knowl edge to the relatively rare cases in which a firm's patents have achieved the level of importance necessary for subse quent selfcitation.
To link the patent measure to the time when innovation activ ity was undertaken in a firm, we recorded patents by their fil ing dates, rather than approval dates, as there may be arbi trarily long lags between filing and approval dates for patents (Ahuja, 2000). In addition, we used a oneyear lead on the measures of exploitation and exploration to allow for some time between the process management activities and the innovation associated with the patent application, which also helps alleviate concerns about reverse causality.
Independent Variable ISO 9000 certifications. We constructed our independent variable, the extent of process management activities, from thirdparty data on ISO 9000 quality program certifications for firms in the photography and paint industries. We were able to obtain data by business unit, as each certification includes a 4digit Standard Industrial Classification code designation. For photography, we selected ISO 9000 certifications for the business units in our sample if they were in SIC code 3861, representing photography and imaging equipment and sup plies. In some cases, the 4digit SIC code was represented as 3800 or was missing. In these cases, we relied on the tex tual description in the certification's scope section and tried to include certifications that mentioned photography or imaging. For the paint industry, we selected ISO 9000 certifications for business units in our sample if they were in SIC code 2851. Often, however, only SIC code 2800 was listed, or the SIC code designation was missing. We again crosschecked the text describing the scope of the ISO 9000 certification for mentions of paint or coatings. We constructed measures of the extent of process management activities undertaken within a business unit as the cumulative count of certifications for a business unit by year. The number of ISO 9000 certifications for 1996 would thus be the sum of the certifications through 1995, plus the new certifications for 1996. Reflecting industry differences, firms in the paint industry were much more likely to adopt process manage ment and had several times more ISO 9000 certifications than firms in the photography industry.
Analysis and Controls To assess the relationship between process management and counts of exploitative and exploratory patents, we used a panel negative binomial model with firm fixed effects and
687/ASQ, December 2002
We employed a negative binomial specifi cation because patent count data are inte ger counts that take only positive values, and models with dependent count vari ables may be misspecified if estimated with OLS regression (King, 1988). Pois son regressions are often used to analyze count data (e.g., Ahuja, 2000), but such models are fairly restrictive and require the mean and variance to be equal. If observations within a year are not inde pendent, the variance may be greater than the mean. If such overdispersion exists, negative binomial models will be better (Cameron and Trivedi, 1990), but pooling multiple observations over time for each organization violates the inde pendence assumptions required for unbi ased parameter estimates. This can be corrected by clustering data through ran dom effects (e.g., Guo, 1996) or fixed effects models. Here we used firm fixed effects controls, as they offer other advantages in eliminating alternative explanations.
year controls. Negative binomial models are commonly used for patent data counts (e.g., Fleming, 2001), and a panel neg ative binomial design (longitudinal data on a panel of firms) with firm fixed effects provides several important advantages in eliminating alternative explanations. 1 In particular, it helps eliminate alternative explanations driven by differences between firms. For example, one could argue that larger firms are more likely to have both more exploitative innova tions and more activities available for ISO 9000 certification. A crosssectional regression would rely on the variation created by differences between firms in both exploitation and ISO 9000 utilization and, even with controls for size, would not differentiate between the underlying characteristics of firms and the "effects" of ISO 9000, while the panel data design with firm fixed effects and year controls would address this concern. The firm fixedeffects controls account for stable differences between firms, such as size or age; the model relies only on the withinfirm variation in both independent and dependent variables. That is, given a firm's size, age, ten dency to exploit previous innovations, etc., a significant sta tistical finding in this model requires that increases in ISO 9000 activity within the firm be associated with increases in the firm's level of exploitation, regardless of how much exploitation there was prior to ISO 9000 activities.
Panel designs with fixed effects and year dummies are par ticularly useful in correcting for omittedvariable bias, particu larly if the potential control variables are not individually important but together are likely to have an effect (Hsiao, 1986). To accomplish this in a panel design, it is necessary to control for three types of factors (Hsiao, 1986: 25): (1) those that vary over time for firms and are different across firms, such as expenditures on research and development (R&D) or financial performance; (2) factors that vary over time but are generally invariant across firms in an industry sample, such as economic conditions or industry demand characteristics; and (3) factors that are relatively invariant within a firm and over time but vary across firms, such as organizational cul ture or management knowhow. Our paneldata design con trolled for the above factors with the variables described below.
We controlled for withinfirm changes over time with mea sures of both total patent applications and total revenue by year. The patenting variable measures changes in firms' investments in innovation activity but generally also captures changes in the general health of a firm from year to year. Results were the same when we used a twoyear rolling average of this variable. We also obtained revenue data from COMPUSTAT and Worldscope for 43 of the companies in the photography sample and 7 companies in the paint industry sample. While patent application information could be obtained at the businessunit level, in most cases, we were not able to obtain revenue data for a particular business seg ment, so revenue data are at the firm level. Revenue data are frequently used to control for size differences across firms. In our model, however, differences in size across firms are con trolled with the fixedeffect design. Thus, the revenue mea sure provides an alternative to the patent measure in control
688/ASQ, December 2002
Process Management
ling for withinfirm changes in resources or yeartoyear health. The addition of the revenue measure as a control vari able did not change our results.
We controlled for factors that differ across firms but that are relatively stable over time within firms, such as management knowhow or organizational culture, with firm fixed effects. Controlling for fixed effects results in a conservative model, as the variation in the dependent and independent variable arises not from the differences in innovation activity or ISO 9000 adoption between firms (i.e., crosssectional differ ences) but from changes in both over time within each firm. Fixedeffect models overcome many of the questions that arise from crosssectional statistical designs, such as whether firm differences (i.e., unobserved heterogeneity) are responsible for observed differences in both ISO 9000 adop tion and patenting patterns. We also controlled for factors that vary over time but affect all firms in the industry, such as economic conditions or market demand conditions, with dummy variables for each year. This also controls for any spu rious correlations that might result from the underlying time trends in increasing ISO 9000 adoptions.
Our model has additional analytical benefits beyond the paneldata design and controls that help further eliminate alternative explanations for the observed relationships. While ISO 9000 certification began in 1991 in the photography industry and 1990 in the paint industry, patent data are avail able back to 1980. This allowed us to assess a firm's patent ing patterns prior to the start of ISO 9000 certifications. We arbitrarily chose a start date of 1985 for our analysis, but in checks for robustness, the use of other start dates did not alter the results. In addition, the sample includes firms with no ISO 9000 certifications. Thus, the study is a quasiexperi ment, utilizing a pre and posttest design with a control group (Cook and Campbell, 1979). This allows for stronger causal inferences than other approaches, as the effect of ISO 9000 certification activity on a particular adopter's patenting must be significantly different than the baseline of both that adopter's previous patenting activity and the patenting activity for nonadopters over the same period.
The panel negative binomial models (e.g., Guo, 1996) we used to test hypotheses 1 and 2 are represented by the fol lowing equation:
log xit = Xiitp + oEj + jij (1)
where Pr (y = r) = (X r e^/r!; y is the observed count and r is an integer; X is a vector of characteristics of firm i at time t; and a is a correction for overdispersion (i.e., for mean not equal to variance). The model also includes jXj, a timeinvariant firm i effect, which can be treated as either fixed or random; our models used fixed effects, which limits the variation used in the analysis to withinfirm estimates. We ran these models using the xtnbreg command in the STATA statistical software, with the fixedeffects option. We ran the analysis on each of our dependent measures of patent
689/ASQ, December 2002
counts using several different exploitation and exploration measures. Models to test hypothesis 3 required a different specification, as the dependent variable is not patent counts but the ratio of exploitative innovations to total innovation. Using this ratio as the dependent variable in a regression violates multiple regression assumptions, however, as this ratio is constrained between 0 and 1. An approach that remedies this opera tionally is to regress ln(p/1p) on the independent variables. In this case, p is the number of exploitative patents, and the denominator, 1p, is effectively the count of exploratory patents. Results were similar using either approach. Here we report the somewhat more intuitive results, reflecting the wording of hypothesis 3, using the exploitation/total patents ratio as the dependent variable. Because the dependent vari able was a ratio, we used crosssectional, timeseries (panel) OLS regressions. These models incorporate the same panel data designs and controls, including firm fixed effects, and are represented by the following equation:
R i t = X l t * p + JL. + e it (2)
where R is the ratio of exploitation to total patents for firm i at time t; Xjt is a vector of characteristics of firm i at time t, including the cumulative count of ISO 9000 certifications and control variables; |x is a timeinvariant firm i effect, which can be treated as either fixed or random, respectively, in fixed or randomeffects models (equivalent to a firmlevel dummy in fixedeffects models); and ert is an error term. We used the xtreg command (with fixed effects) in STATA for these analy ses.
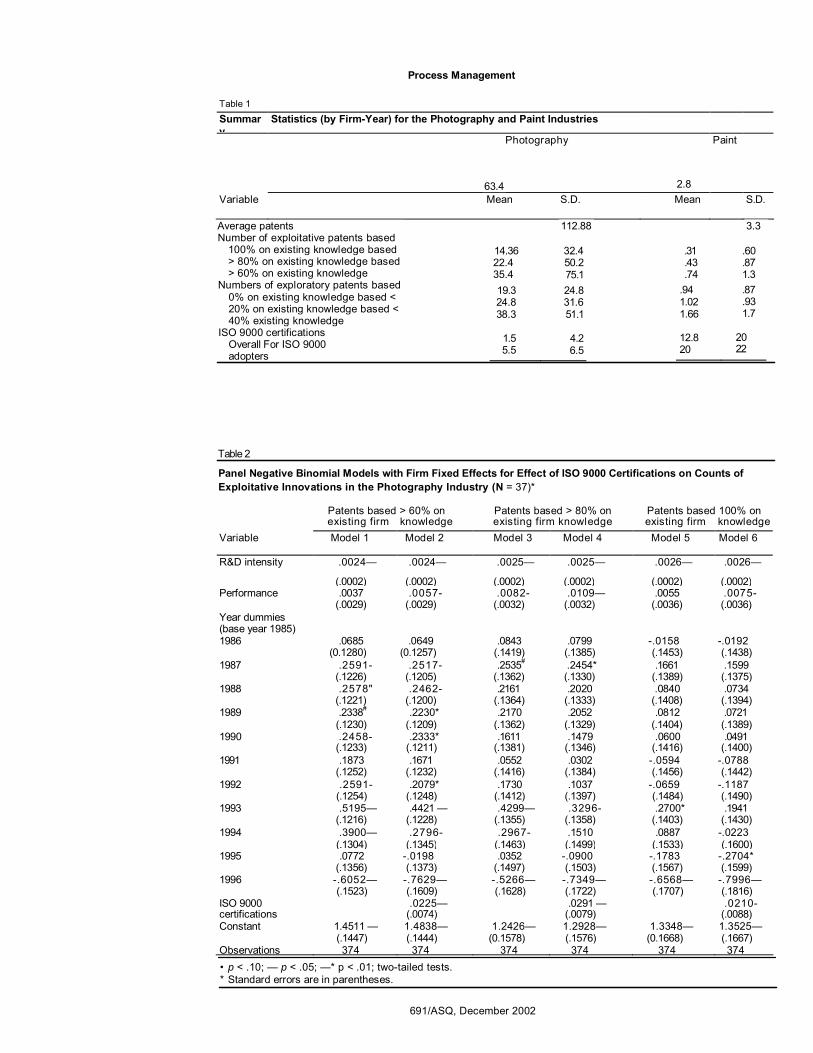
In the photography industry, the initial sample included 98 firms and 64,000 source (citing) patents from 1980 to 1999, which cited another 388,000 patents. As revenue data were not available for many of the firms, the sample size was reduced when models included the performance variable. Thirtyfive of the firms had at least one ISO 9000 certification (in any part of the organization), while 21 of the firms had at least one ISO 9000 certification specifically related to photog raphy or imaging. The maximum number of ISO 9000 certifi cations for a firm was 21, and ISO 9000 adopters had an average of 5.5 certifications. There were 1,100 firmyears of data.
In the paint industry data, there were 656 source patents that cited another 4,685 patents. There were 17 firms in the sam ple; 13 had adopted ISO 9000. The maximum for any firm was 95 ISO 9000 certifications. The data included 250 firm years. Table 1 shows summary statistics for the photography and paint industry data.
RESULTS Photography Industry Hypothesis 1 proposed that as firms increase their process management activity, exploitative innovation would increase, and the findings support this hypothesis. Table 2 shows
690/ASQ, December 2002
Process Management
Table 1 Summar y
Statistics (by FirmYear) for the Photography and Paint Industries
Photography Paint
Variable Mean S.D. Mean S.D.
Average patents Number of exploitative patents based 100% on existing knowledge based > 80% on existing knowledge based > 60% on existing knowledge
Numbers of exploratory patents based 0% on existing knowledge based < 20% on existing knowledge based < 40% existing knowledge
ISO 9000 certifications Overall For ISO 9000 adopters
112.88
14.36 22.4 35.4
32.4 50.2 75.1
19.3 24.8 38.3
24.8 31.6 51.1
1.5 5.5
4.2 6.5
3.3
.31
.43
.74
.60
.87 1.3
.94 1.02 1.66
.87
.93 1.7
12.8 20
2022
Table 2
Panel Negative Binomial Models with Firm Fixed Effects for Effect of ISO 9000 Certifications on Counts of Exploitative Innovations in the Photography Industry (N = 37)*
Patents based > 60% on Patents based > 80% on Patents based 100% on existing firm knowledge existing firm knowledge existing firm knowledge
Variable Model 1 Model 2 Model 3 Model 4 Model 5 Model 6
R&D intensity .0024— .0024— .0025— .0025— .0026— .0026—
(.0002) (.0002) (.0002) (.0002) (.0002) (.0002) Performance .0037 .0057 .0082 .0109— .0055 .0075
(.0029) (.0029) (.0032) (.0032) (.0036) (.0036) Year dummies (base year 1985) 1986 .0685 .0649 .0843 .0799 .0158 .0192
(0.1280) (0.1257) (.1419) (.1385) (.1453) (.1438) 1987 .2591 .2517 .2535 # .2454* .1661 .1599
(.1226) (.1205) (.1362) (.1330) (.1389) (.1375) 1988 .2578" .2462 .2161 .2020 .0840 .0734
(.1221) (.1200) (.1364) (.1333) (.1408) (.1394) 1989 .2338 # .2230* .2170 .2052 .0812 .0721
(.1230) (.1209) (.1362) (.1329) (.1404) (.1389) 1990 .2458 .2333* .1611 .1479 .0600 .0491
(.1233) (.1211) (.1381) (.1346) (.1416) (.1400) 1991 .1873 .1671 .0552 .0302 .0594 .0788
(.1252) (.1232) (.1416) (.1384) (.1456) (.1442) 1992 .2591 .2079* .1730 .1037 .0659 .1187
(.1254) (.1248) (.1412) (.1397) (.1484) (.1490) 1993 .5195— .4421— .4299— .3296 .2700* .1941
(.1216) (.1228) (.1355) (.1358) (.1403) (.1430) 1994 .3900— .2796 .2967 .1510 .0887 .0223
(.1304) (.1345) (.1463) (.1499) (.1533) (.1600) 1995 .0772 .0198 .0352 .0900 .1783 .2704*
(.1356) (.1373) (.1497) (.1503) (.1567) (.1599) 1996 .6052— .7629— .5266— .7349— .6568— .7996—
(.1523) (.1609) (.1628) (.1722) (.1707) (.1816) ISO 9000 .0225— .0291— .0210 certifications (.0074) (.0079) (.0088) Constant 1.4511 — 1.4838— 1.2426— 1.2928— 1.3348— 1.3525—
(.1447) (.1444) (0.1578) (.1576) (0.1668) (.1667) Observations 374 374 374 374 374 374 • p < .10; — p < .05; —* p < .01; twotailed tests. * Standard errors are in parentheses.
691/ASQ, December 2002
63.4 2.8
results from three of the exploitation variables. Models 1, 3, and 5 show the effect of the control variables on the three measures of exploitation, while models 2, 4, and 6 include the ISO 9000 variable. In general, with the exception of 1996, exploitative innovation was higher throughout the decade than in the base year, 1985. In addition, within a firm, exploitation tended to increase with increases in R&D intensity (measured by total patenting activity) and also generally with increases in firm performance (measured by revenue). Yet even after the exploitation favoring influences of firm size and health, R&D efforts, and the natural increases in exploitation over time and with firm age, increases in ISO 9000 activity had an additional positive and significant effect on the number of exploitative innovations. This effect was positive and significant regardless of the measure of exploitation. In general, the positive effect of process intensity on exploita tive innovation became continually stronger and more signifi cant with increases in the proportion of prior knowledge used in patenting. This trend continued beyond the 90 percent cat egory (patents based on more than 90 percent existing knowledge). In model 6, employing the dependent variable comprising patents based 100 percent on existing knowledge reduced the strength and significance of the coefficient slightly, due to the reduction in patents that exactly met the 100 percent criteria. Even at this extreme level of exploitation, however, the effect of process intensity on exploitation is positive and significant. The results reported in table 2 include the performance variable, which reduced the size of the sample, as revenue data were not available for several firms, but results with and without the revenue control were similar in sign and significance.
Our exploitation analysis included a smaller set of firms than the full sample, reflecting missing observations in some years. Panel designs with fixedeffects controls eliminate firms with missing observations. To gauge the effects of dropped firms, we ran the model using randomeffects con trols rather than fixed effects. Randomeffects controls also consider the clustered nature of multiple observations for each firm but do not eliminate firms from the analysis if they are missing observations. The less conservative random effects models are consistent with the fixedeffects results in table 2. The inclusion of more firmyears accentuates the positive effect of ISO 9000 certifications on exploitative inno vation. In support of hypothesis 1, then, within a firm, an increase in the extent of process management is associated with an increase in exploitative innovation.
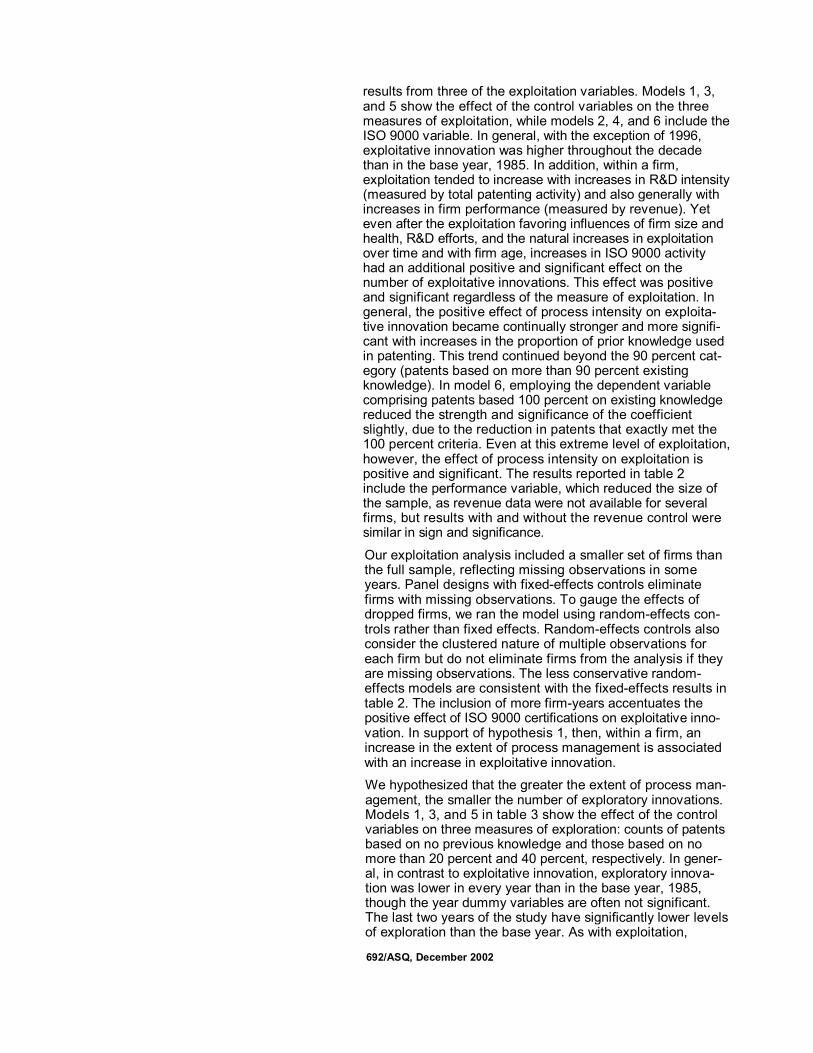
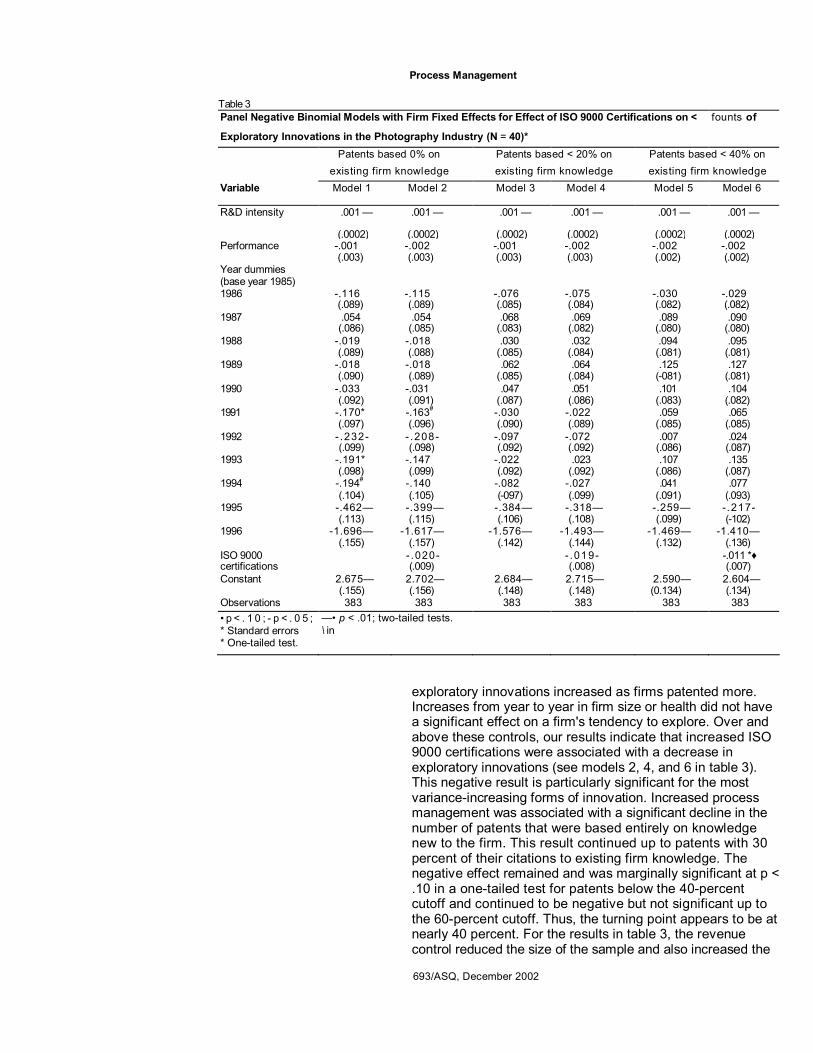
We hypothesized that the greater the extent of process man agement, the smaller the number of exploratory innovations. Models 1, 3, and 5 in table 3 show the effect of the control variables on three measures of exploration: counts of patents based on no previous knowledge and those based on no more than 20 percent and 40 percent, respectively. In gener al, in contrast to exploitative innovation, exploratory innova tion was lower in every year than in the base year, 1985, though the year dummy variables are often not significant. The last two years of the study have significantly lower levels of exploration than the base year. As with exploitation,
692/ASQ, December 2002
Process Management
Table 3 Panel Negative Binomial Models with Firm Fixed Effects for Effect of ISO 9000 Certifications on < founts of
Exploratory Innovations in the Photography Industry (N = 40)* Patents based 0% on Patents based < 20% on Patents based < 40% on
existing firm knowledge existing firm knowledge existing firm knowledge Variable Model 1 Model 2 Model 3 Model 4 Model 5 Model 6
R&D intensity .001— .001— .001— .001— .001— .001—
(.0002) (.0002) (.0002) (.0002) (.0002) (.0002) Performance .001 .002 .001 .002 .002 .002
(.003) (.003) (.003) (.003) (.002) (.002) Year dummies (base year 1985) 1986 .116 .115 .076 .075 .030 .029
(.089) (.089) (.085) (.084) (.082) (.082) 1987 .054 .054 .068 .069 .089 .090
(.086) (.085) (.083) (.082) (.080) (.080) 1988 .019 .018 .030 .032 .094 .095
(.089) (.088) (.085) (.084) (.081) (.081) 1989 .018 .018 .062 .064 .125 .127
(.090) (.089) (.085) (.084) (081) (.081) 1990 .033 .031 .047 .051 .101 .104
(.092) (.091) (.087) (.086) (.083) (.082) 1991 .170* .163 # .030 .022 .059 .065
(.097) (.096) (.090) (.089) (.085) (.085) 1992 .232 .208 .097 .072 .007 .024
(.099) (.098) (.092) (.092) (.086) (.087) 1993 .191* .147 .022 .023 .107 .135
(.098) (.099) (.092) (.092) (.086) (.087) 1994 .194 # .140 .082 .027 .041 .077
(.104) (.105) (097) (.099) (.091) (.093) 1995 .462— .399— .384— .318— .259— .217
(.113) (.115) (.106) (.108) (.099) (102) 1996 1.696— 1.617— 1.576— 1.493— 1.469— 1.410—
(.155) (.157) (.142) (.144) (.132) (.136) ISO 9000 .020 .019 .011 *♦ certifications (.009) (.008) (.007) Constant 2.675— 2.702— 2.684— 2.715— 2.590— 2.604—
(.155) (.156) (.148) (.148) (0.134) (.134) Observations 383 383 383 383 383 383 • p < . 1 0 ; p < . 0 5 ; —• p < .01; twotailed tests. * Standard errors \ in * Onetailed test.
exploratory innovations increased as firms patented more. Increases from year to year in firm size or health did not have a significant effect on a firm's tendency to explore. Over and above these controls, our results indicate that increased ISO 9000 certifications were associated with a decrease in exploratory innovations (see models 2, 4, and 6 in table 3). This negative result is particularly significant for the most varianceincreasing forms of innovation. Increased process management was associated with a significant decline in the number of patents that were based entirely on knowledge new to the firm. This result continued up to patents with 30 percent of their citations to existing firm knowledge. The negative effect remained and was marginally significant at p < .10 in a onetailed test for patents below the 40percent cutoff and continued to be negative but not significant up to the 60percent cutoff. Thus, the turning point appears to be at nearly 40 percent. For the results in table 3, the revenue control reduced the size of the sample and also increased the
693/ASQ, December 2002
significance of the result, suggesting that these tendencies may be stronger for larger, public firms.
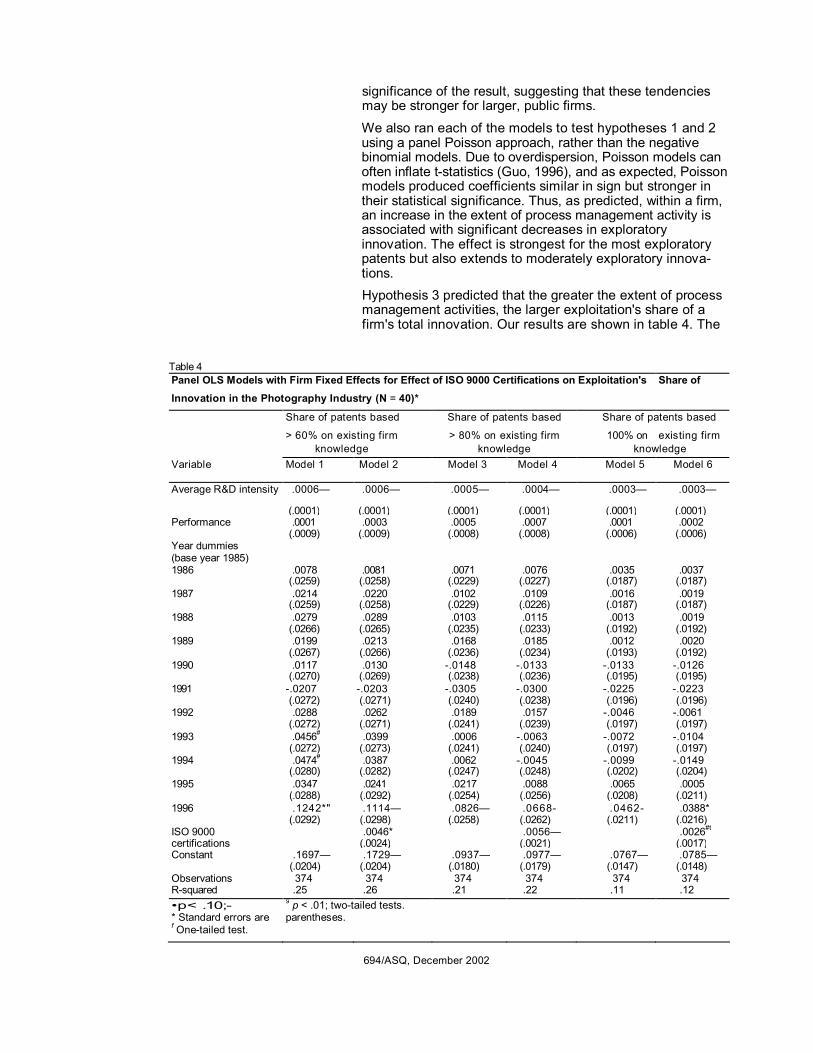
We also ran each of the models to test hypotheses 1 and 2 using a panel Poisson approach, rather than the negative binomial models. Due to overdispersion, Poisson models can often inflate tstatistics (Guo, 1996), and as expected, Poisson models produced coefficients similar in sign but stronger in their statistical significance. Thus, as predicted, within a firm, an increase in the extent of process management activity is associated with significant decreases in exploratory innovation. The effect is strongest for the most exploratory patents but also extends to moderately exploratory innova tions. Hypothesis 3 predicted that the greater the extent of process management activities, the larger exploitation's share of a firm's total innovation. Our results are shown in table 4. The
Table 4 Panel OLS Models with Firm Fixed Effects for Effect of ISO 9000 Certifications on Exploitation's Share of Innovation in the Photography Industry (N = 40)*
Share of patents based Share of patents based Share of patents based
> 60% on existing firm > 80% on existing firm 100% on existing firm knowledge knowledge knowledge
Variable Model 1 Model 2 Model 3 Model 4 Model 5 Model 6
Average R&D intensity .0006— .0006— .0005— .0004— .0003— .0003—
(.0001) (.0001) (.0001) (.0001) (.0001) (.0001) Performance .0001 .0003 .0005 .0007 .0001 .0002
(.0009) (.0009) (.0008) (.0008) (.0006) (.0006) Year dummies (base year 1985) 1986 .0078 .0081 .0071 .0076 .0035 .0037
(.0259) (.0258) (.0229) (.0227) (.0187) (.0187) 1987 .0214 .0220 .0102 .0109 .0016 .0019
(.0259) (.0258) (.0229) (.0226) (.0187) (.0187) 1988 .0279 .0289 .0103 .0115 .0013 .0019
(.0266) (.0265) (.0235) (.0233) (.0192) (.0192) 1989 .0199 .0213 .0168 .0185 .0012 .0020
(.0267) (.0266) (.0236) (.0234) (.0193) (.0192) 1990 .0117 .0130 .0148 .0133 .0133 .0126
(.0270) (.0269) (.0238) (.0236) (.0195) (.0195) 1991 .0207 .0203 .0305 .0300 .0225 .0223
(.0272) (.0271) (.0240) (.0238) (.0196) (.0196) 1992 .0288 .0262 .0189 .0157 .0046 .0061
(.0272) (.0271) (.0241) (.0239) (.0197) (.0197) 1993 .0456 # .0399 .0006 .0063 .0072 .0104
(.0272) (.0273) (.0241) (.0240) (.0197) (.0197) 1994 .0474 # .0387 .0062 .0045 .0099 .0149
(.0280) (.0282) (.0247) (.0248) (.0202) (.0204) 1995 .0347 .0241 .0217 .0088 .0065 .0005
(.0288) (.0292) (.0254) (.0256) (.0208) (.0211) 1996 .1242*" .1114— .0826— .0668 .0462 .0388*
(.0292) (.0298) (.0258) (.0262) (.0211) (.0216) ISO 9000 .0046* .0056— .0026 #t certifications (.0024) (.0021) (.0017) Constant .1697— .1729— .0937— .0977— .0767— .0785—
(.0204) (.0204) (.0180) (.0179) (.0147) (.0148) Observations 374 374 374 374 374 374 Rsquared .25 .26 .21 .22 .11 .12 •p< .10; 9 p < .01; twotailed tests. * Standard errors are in
parentheses. f Onetailed test.
694/ASQ, December 2002
Process Management
dependent variable in these models is the ratio of exploitative innovation to total innovation for a firm. In addition, we calcu lated this ratio with three different measures of exploitation: patents based > 60 percent on existing knowledge, > 80 per cent on existing knowledge, and 100 percent on existing knowledge. Models 1, 3, and 5 in table 4 show the effects of the control variables on the exploitation ratios. Exploitation garnered a larger share of innovation as a firm increased its patenting activity, but the ratio did not increase significantly across years. Models 2, 4, and 6 add the ISO 9000 variable. In support of hypothesis 3, these results show that increases in process management activity in a firm are associated with increases in exploitation's share of the total amount of inno vation. While this result was less significant for less exploita tive innovations (60 percent model 2, at p < .10), the effect becomes strongly significant as the innovations become increasingly exploitative (80 percent, model 6, at p < .01). Again, similar to model 1, the significance and strength of the coefficient continues up to about the 90percent cutoff level. The most extreme exploitation case (model 6) restricts the dependent variable to only those patents based 100 percent on familiar knowledge. The reduction in significance likely results from a smaller number of patents meeting this criteri on.
Increases in process management activities appear not only to increase exploitative patents but also trigger a shift toward more exploitative patents, that is, patents with a higher pro portion of previously used knowledge. These effects exist even after controlling for fixed effects, such as age or size, year effects, R&D intensity over time, and increases in exploitation that occur over time and with age. In the photog raphy industry, our results indicate that as process manage ment increases, exploitation garners an everlarger share of the firm's patenting activity. It appears that process manage ment activities crowd out more exploratory, experimental forms of innovation.
Paint Industry Table 5 shows the results of the panel negative binomial models used to test hypothesis 1 for the paint industry data. Models 1, 3, and 5 show the results for the effect of control variables on the three categories of exploitative innovation. In contrast to photography, the controls have no consistent effects on exploitative innovation, though in general, the year and revenue variables are negatively associated with exploita tive innovation. Models 2, 4, and 6 include the ISO 9000 cer tification variable. In support of hypothesis 1, process man agement activities are significantly positively associated with exploitation across the three models. Similar to the photogra phy industry results, the effect of process management activ ities on exploitation becomes stronger for innovation that is more exploitative (e.g., model 4). Again, as in the photogra phy results, this trend continues up to the 90 percent level, and the significance decreases slightly for the most extreme and restrictive form of exploitation (model 6). In the paint industry, as in the photography industry, increased process management activity is associated with increased exploitative
695/ASQ, December 2002

Table 5 ________________________________________________________________________________________ Panel Negative Binomial Models with Firm Fixed Effects for Effect of ISO 9000 Certifications on Counts of Exploitative Innovations in the Paint Industry (N = 5)*
Patents based > 80% on existing firm knowledge
Variable Model 1 Model 2 Model 3 Model 4 Model 5 Model 6
R&D intensity .0839 .1217 .0810 .4837 .0135 .4976*
(0.074) (.1055) (.1064) (.2255) (.1298) (.2816) Performance .0083 .0016 .0919 .1193 .0726 .1547
(.0940) (.0969) (.1335) (.1651) (.1774) (.2337) Year dummies (base year 1985) 1986 1.8545 1.1909 1.2929 .2653 .9975 .3119
(.8142) (.8293) (1.2095) (1.4388) (1.2416) (1.5809) 1987 .9448 1.487* 18.9057 19.1604 20.2281 21.0507
(.7454) (.7960) (9,900) (3,942) (17,160) (10,399) 1988 .5236 .8775 .1177 0.9079 .0211 .6888
(.6669) (.6987) (1.0943) (1.2611) (1.2054) (1.4647) 1989 .7797 .3633 .4625 1.0707 .1003 .9190
(.7103) (.6726) (1.1464) (1.2428) (1.4438) (1.5095) 1990 1.1893 1.078 .1966 .1764 .0942 .2787
(.8605) (.8702) (1.3672) (1.6318) (1.7299) (2.0133) 1991 .7979 .4602 .5874 1.5022 .0332 1.0899
(.7019) (.6789) (1.1459) (1.2665) (1.5065) (1.6684) 1992 .8440 1.368* .8888 .2401 .8360 0.6686
(.7170) (.7417) (1.1192) (1.2679) (1.4562) (1.8058) 1993 .9206 2.145 .2640 2.784* .5929 3.2620
(.7075) (.8564) (1.1853) (1.6008) (1.4446) (2.3272) 1994 .7364 2.367 .5298 3.389* .6859 5.4440*
(.6486) (.9255) (.9934) (1.7410) (1.4072) (2.8096) 1995 .8543 2.3589 1.0136 2.3678 .5243 3.9702
(.7512) (.9617) (1.2088) (1.7788) (1.6786) (2.8234) 1996 .9573 3.486— .8649 5.240 .3589 7.9076
(.6489) (1.124) (.9936) (2.2527) (1.5466) (3.6526) ISO 9000 .0609— .1522— .1714 certifications (.0206) (.0478) (.0699) Constant 16.53 17.86 15.89 19.37 17.16 24.06
(1,073.7) (1,080.2) (1,208.3) (925.0) (1,275.9) (120.03) Observations 42 42 42 42 42 42 * p < .10; — p < .05; *** p < .01; twotailed tests. * Standard errors are in parentheses.
innovation; these results are generally accentuated for more exploitative innovation.
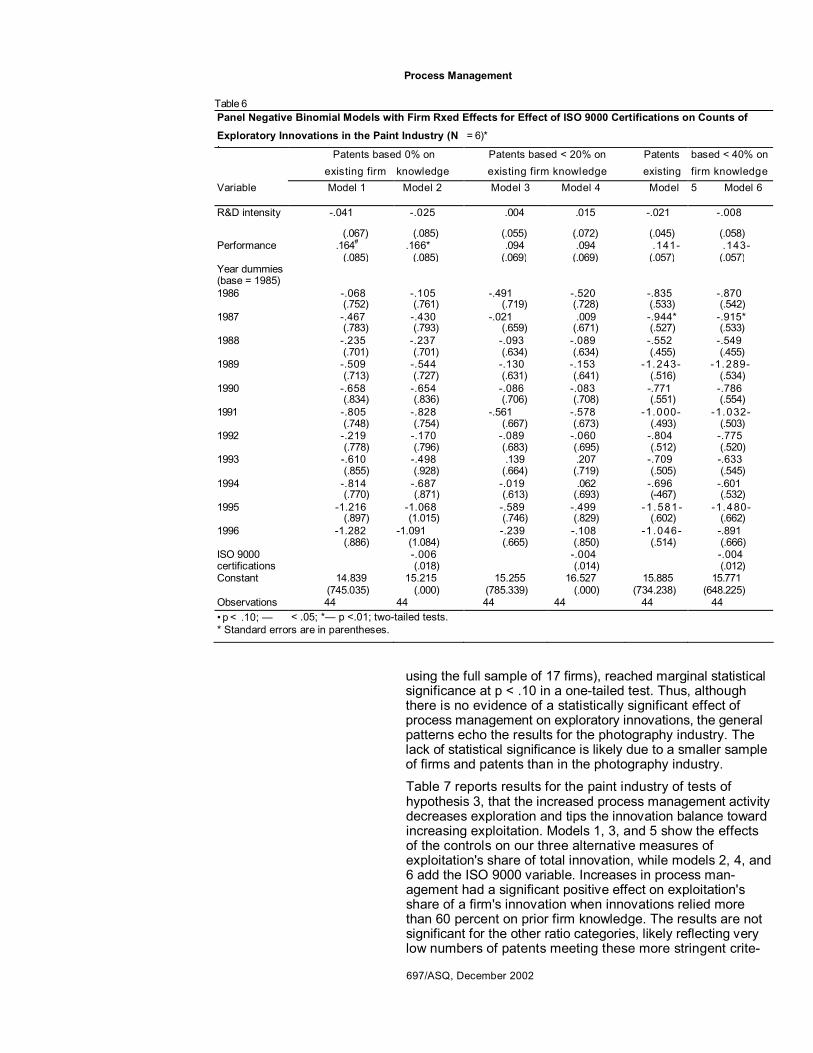
Table 6 shows the results of tests of hypothesis 2, that greater process management activities would be associated with less exploratory innovation. Again, models 1, 3, and 5 show the effects of the control variables on three categories of exploration. Models 2, 4, and 6 add the ISO 9000 certifica tion variable. The coefficients on the ISO 9000 variable are consistently negative, as in the photography industry, but they never reach significance, failing to support hypothesis 2. Increases in process management activities do not appear to affect exploratory patents in the paint industry.
We also ran the exploitation and exploration models for the paint industry using panel Poisson specifications with fixed effects, and again, as in the photography industry, the posi tive results were stronger in the panel Poisson results. In the exploration models, the negative results were also stronger, and in one case (the most exploratory category of innovation,
696/ASQ, December 2002
Patents based > 60% on existing firm knowledge
Patents based 100% on existing firm knowledge
Process Management
Table 6 Panel Negative Binomial Models with Firm Rxed Effects for Effect of ISO 9000 Certifications on Counts of Exploratory Innovations in the Paint Industry (N :
= 6)*
Patents based 0% on Patents based < 20% on Patents based < 40% on existing firm knowledge existing firm knowledge existing firm knowledge
Variable Model 1 Model 2 Model 3 Model 4 Model 5 Model 6
R&D intensity .041 .025 .004 .015 .021 .008
(.067) (.085) (.055) (.072) (.045) (.058) Performance .164 # .166* .094 .094 .141 .143
(.085) (.085) (.069) (.069) (.057) (.057) Year dummies (base = 1985) 1986 .068 .105 .491 .520 .835 .870
(.752) (.761) (.719) (.728) (.533) (.542) 1987 .467 .430 .021 .009 .944* .915*
(.783) (.793) (.659) (.671) (.527) (.533) 1988 .235 .237 .093 .089 .552 .549
(.701) (.701) (.634) (.634) (.455) (.455) 1989 .509 .544 .130 .153 1.243 1.289
(.713) (.727) (.631) (.641) (.516) (.534) 1990 .658 .654 .086 .083 .771 .786
(.834) (.836) (.706) (.708) (.551) (.554) 1991 .805 .828 .561 .578 1.000 1.032
(.748) (.754) (.667) (.673) (.493) (.503) 1992 .219 .170 .089 .060 .804 .775
(.778) (.796) (.683) (.695) (.512) (.520) 1993 .610 .498 .139 .207 .709 .633
(.855) (.928) (.664) (.719) (.505) (.545) 1994 .814 .687 .019 .062 .696 .601
(.770) (.871) (.613) (.693) (467) (.532) 1995 1.216 1.068 .589 .499 1.581 1.480
(.897) (1.015) (.746) (.829) (.602) (.662) 1996 1.282 1.091 .239 .108 1.046 .891
(.886) (1.084) (.665) (.850) (.514) (.666) ISO 9000 .006 .004 .004 certifications (.018) (.014) (.012) Constant 14.839 15.215 15.255 16.527 15.885 15.771
(745.035) (.000) (785.339) (.000) (734.238) (648.225) Observations 44 44 44 44 44 44 • p < .10; — p«
< .05; *— p <.01; twotailed tests. * Standard errors are in parentheses.
using the full sample of 17 firms), reached marginal statistical significance at p < .10 in a onetailed test. Thus, although there is no evidence of a statistically significant effect of process management on exploratory innovations, the general patterns echo the results for the photography industry. The lack of statistical significance is likely due to a smaller sample of firms and patents than in the photography industry.
Table 7 reports results for the paint industry of tests of hypothesis 3, that the increased process management activity decreases exploration and tips the innovation balance toward increasing exploitation. Models 1, 3, and 5 show the effects of the controls on our three alternative measures of exploitation's share of total innovation, while models 2, 4, and 6 add the ISO 9000 variable. Increases in process man agement had a significant positive effect on exploitation's share of a firm's innovation when innovations relied more than 60 percent on prior firm knowledge. The results are not significant for the other ratio categories, likely reflecting very low numbers of patents meeting these more stringent crite
697/ASQ, December 2002
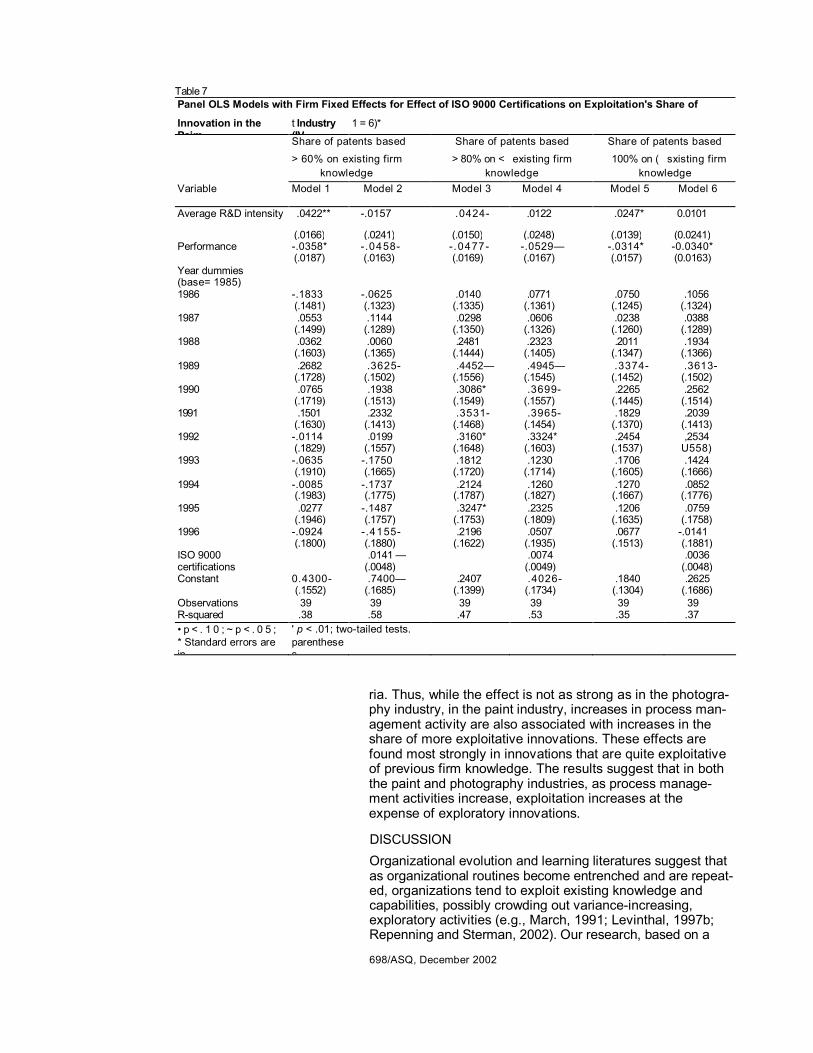
Table 7 Panel OLS Models with Firm Fixed Effects for Effect of ISO 9000 Certifications on Exploitation's Share of
Innovation in the Paim
t Industry (IV
1 = 6)*
Share of patents based Share of patents based Share of patents based
> 60% on existing firm > 80% on < existing firm 100% on ( sxisting firm knowledge knowledge knowledge
Variable Model 1 Model 2 Model 3 Model 4 Model 5 Model 6
Average R&D intensity .0422** .0157 .0424 .0122 .0247* 0.0101
(.0166) (.0241) (.0150) (.0248) (.0139) (0.0241) Performance .0358* .0458 .0477 .0529— .0314* 0.0340*
(.0187) (.0163) (.0169) (.0167) (.0157) (0.0163) Year dummies (base= 1985) 1986 .1833 .0625 .0140 .0771 .0750 .1056
(.1481) (.1323) (.1335) (.1361) (.1245) (.1324) 1987 .0553 .1144 .0298 .0606 .0238 .0388
(.1499) (.1289) (.1350) (.1326) (.1260) (.1289) 1988 .0362 .0060 .2481 .2323 .2011 .1934
(.1603) (.1365) (.1444) (.1405) (.1347) (.1366) 1989 .2682 .3625 .4452— .4945— .3374 .3613
(.1728) (.1502) (.1556) (.1545) (.1452) (.1502) 1990 .0765 .1938 .3086* .3699 .2265 .2562
(.1719) (.1513) (.1549) (.1557) (.1445) (.1514) 1991 .1501 .2332 .3531 .3965 .1829 .2039
(.1630) (.1413) (.1468) (.1454) (.1370) (.1413) 1992 .0114 .0199 .3160* .3324* .2454 ,2534
(.1829) (.1557) (.1648) (.1603) (.1537) U558) 1993 .0635 .1750 .1812 .1230 .1706 .1424
(.1910) (.1665) (.1720) (.1714) (.1605) (.1666) 1994 .0085 .1737 .2124 .1260 .1270 .0852
(.1983) (.1775) (.1787) (.1827) (.1667) (.1776) 1995 .0277 .1487 .3247* .2325 .1206 .0759
(.1946) (.1757) (.1753) (.1809) (.1635) (.1758) 1996 .0924 .4155 .2196 .0507 .0677 .0141
(.1800) (.1880) (.1622) (.1935) (.1513) (.1881) ISO 9000 .0141 — .0074 .0036 certifications (.0048) (.0049) (.0048) Constant 0.4300 .7400— .2407 .4026 .1840 .2625
(.1552) (.1685) (.1399) (.1734) (.1304) (.1686) Observations 39 39 39 39 39 39 Rsquared .38 .58 .47 .53 .35 .37 • p < . 1 0 ; ~ p < . 0 5 ; ' p < .01; twotailed tests. * Standard errors are in
parenthese s
ria. Thus, while the effect is not as strong as in the photogra phy industry, in the paint industry, increases in process man agement activity are also associated with increases in the share of more exploitative innovations. These effects are found most strongly in innovations that are quite exploitative of previous firm knowledge. The results suggest that in both the paint and photography industries, as process manage ment activities increase, exploitation increases at the expense of exploratory innovations.
DISCUSSION Organizational evolution and learning literatures suggest that as organizational routines become entrenched and are repeat ed, organizations tend to exploit existing knowledge and capabilities, possibly crowding out varianceincreasing, exploratory activities (e.g., March, 1991; Levinthal, 1997b; Repenning and Sterman, 2002). Our research, based on a
698/ASQ, December 2002
Process Management
longitudinal study of business units in the photography and paint industries, supports and extends these ideas. Research in these streams has relied on computer simulations (e.g., Levinthal, 1997b) or age and size (e.g., Sorensen and Stuart, 2000) as proxies of the extent of bureaucratic routinization that creates inertia and leads organizations to exploit existing knowledge. Our work goes beyond prior research by incorpo rating measures of managerial practices that are comparable across firms and that may directly contribute to greater rou tinization and create innovation traps. Our results indicate that process management activities spur exploitation over and above the natural tendencies that unfold with age and size. These results suggest that it is not organizational age or size per se, but routinization that gives rise to increasingly exploitative behavior. This paper, then, highlights the impor tance of going beyond the proxy measures of age and size to pinpointing the specific organizational practices that are the roots of inertia.
Our measures of exploitation and exploration also go beyond existing research. Whereas much of the research on explo ration uses dichotomous measures of exploration, we have measured exploitative and exploratory innovation along a con tinuum. These more comprehensive methods provide fine grained measures of exploration and exploitation. Our findings using these measures suggest that notions of exploration as extremely distant search, departing entirely from existing organizational knowledge, should be modified. While we found that organizations had difficulty retaining the most exploratory forms of innovation in the face of rapid exploitation, we also found that this challenge persisted even as the innovations became quite exploitative. In the photogra phy industry, even innovations that leveraged existing knowl edge (innovations that relied up to nearly 40 percent on knowledge used in prior innovations) were squeezed out in favor of extremely exploitative innovations, those based 80 percent or more on knowledge the firm had used in prior innovation efforts. These results suggest that firms' chal lenges in maintaining exploration may be more difficult than previously suggested. Organizations face a challenge in sus taining highly risky, distant search and exploration into new domains, but it appears that this challenge extends even to sustaining moderately exploratory innovations that leverage existing organizational knowledge. In addition, process man agement activities and the culture associated with exploita tion appear to drive extremely local search and exploitation based almost entirely on familiar knowledge. It may be that the combination of learning and selection effects drives more incremental innovation and stunts the firm's ability to acquire new competencies (Gatignon et al., 2002).
Our empirical design also provides a robust test of hypothe ses relating process management activities and technological innovation. The panel study design includes a pre and post test quasiexperiment and relies on longitudinal data and withinfirm variation to assess the effects of process man agement on innovation. This design helps control for con founds that arise from comparisons between firms, which cannot easily distinguish unobserved factors that influence
699/ASQ, December 2002
adoption of process management from factors that influence patenting behavior. Further, constraining each part of our study to a single competitive context helps mitigate concerns that arise from differences in patenting practices between industries (e.g., Ahuja, 2000). In addition, we minimized the threat of reverse causality by assessing the effects of increases in ISO 9000 activity on innovation activity in a sub sequent period. Our results suggest that activities focused on exploitation, in this case, the recent wave of attention to process manage ment, do tend to spur technological innovations that exploit existing firm knowledge. Moreover, increases in process management activities not only led to increases in exploita tive innovation, they also shifted the balance of innovative activities toward an increasing share of exploitative innova tions. These effects were found in both industries despite marked differences in their levels of market uncertainty and technological turbulence and in the differential tendency of firms in those industries to adopt process management prac tices. Our results were particularly strong in the photography indus try. Patenting in general increased over this period, and specifically, patenting anchored in existing firm knowledge also increased. A greater process management focus within an organization drove even greater increases in both exploita tive patents and exploitation's share of total patents above and beyond the general effects of time, firm health, and ten dency to patent. Evidently, process management helps firms build on prior practices and knowledge and facilitates exploitative innovation, particularly the most exploitative forms. Independent of firm size, age, and other characteris tics, however, increased process management activities in a firm were also associated with significant decreases in its most exploratory forms of innovation. In a turbulent industry, this inverse association between process intensity and explo ration could directly affect a firm's life chances. Our results also support a crowdingout argument, as process manage ment activities also appear to spur exploitation at the expense of exploration and increase the share of a firm's innovations that are exploitative.
Results were generally weaker in our smaller sample of paint industry firms. But even in this smaller sample of firms and patents, we found evidence strikingly similar to the photogra phy industry. Increases in process management activities were associated with increases in exploitative innovation. Although we did not find a significant negative effect of more extensive process management activities on exploratory innovation, the signs on the coefficient were consistently negative, and the coefficient was larger at more extreme lev els of exploration, as in the photography industry. Neverthe less, we found that exploitation's share of innovation also increased in the paint industry with increases in process management. The positive relationship was most significant for patents that relied 60 percent or more on existing firm knowledge. While this result was weaker than in the photog raphy industry sample, it again suggests a crowdingout effect. Thus, even in this stable industry, exploitation increas
700/ASQ, December 2002
Process Management
ingly dominates with increases in process management activ ities, measured both by increases in the number of exploita tive patents and the increasing share of exploitative patents. While we have found some consistency in the effects of process management activities on innovation outcomes, these effects may have different impacts on other organizational outcomes. While the increase in exploitative innovations was consistent across industries, the subsequent effect of increased exploitation may have different implications for firm performance in these industries. In the photography industry, the dampening effect of process management on exploratory innovation may have implications for adaptation to subsequent transitions in technology. For example, the recent troubles at Polaroid and Kodak in responding to the digital revolution in photography may be linked to organizational inertia rooted in their attempts to exploit film expertise (Tripsas and Gavetti, 2000). Process management practices are aimed at helping organizations adapt, yet their possibly unintended effects on reducing variation or increasing inertia may impede adaptation to environmental shifts and increase the importance of selection processes in organizational outcomes (Singh, House, and Tucker, 1986; Levinthal, 1991). In contrast, rapid exploitation may be functional for organiza tions when environments are stable, such as in the paint industry. Tighter linkages between organizational routines and a focus on incremental innovation help speed commercializa tion of innovations in stable or incrementally changing con texts. Yet such an innovation trajectory reduces technical vari ation and stunts a firm's absorptive capacity (Cohen and Levinthal, 1990). Such consequences of process management activities might slow responsiveness to technological transitions and reduce a firm's life chances at these junc tures. Assessing process management's influence on innova tion activity is a first step in exploring its impact on organiza tional outcomes. Subsequent research on the effects of process management activities on organizational outcomes may help untangle the equivocal empirical results and help determine the contingent effects of process management activities on both innovation and organizational outcomes (Sutcliffe, Sitkin, and Browning, 2000; Benner, 2003; Benner and Tushman, 2003).
Institutional pressures play a role in process management adoption, particularly in recent forms of process management such as the ISO 9000 program (Guillen, Guler, and MacPherson, 2002), and for later adopters of a process man agement initiative, who may do so increasingly for legitimacy (Westphal, Gulati, and Shortell, 1997; Zbaracki, 1998). These coercive pressures, for example, from powerful buying orga nizations or in response to government regulations, may cause firms to adopt such practices in contexts in which a focus on exploitation and lack of exploration is quite harmful. The growing need to demonstrate adoption and use of process management activities may be more akin to the "coercive bureaucracy" that Adler and Borys (1996) described, which stifles innovation and promotes inertia. Our findings suggest a trend in this direction—the type of innova tion enabled by process management appears to be the most
701/ASQ, December 2002
Guler, I., M. Guillen, and J. M. MacPherson 2002 "Global competition, institu
tions, and the diffusion of organizational practices: The international spread of the ISO 9000 quality certificates." Administrative Science Quar terly, 47: 207232.
Guo, G. 1996 "Negative multinomial regres
sion models for clustered event counts." In A. E. Raftery (ed.), Sociological Methodology, 26: 113132. San Francisco: JosseyBass.
Hackman, J. R., and R. Wageman 1995 "Total quality management:
Empirical, conceptual, and practical issues." Administra tive Science Quarterly, 40: 309342.
Hammer, M., and J. Champy 1993 Reengineering the Corpora
tion: A Manifesto for Busi ness Revolution. New York: HarperBusiness.
Hammer, M., and S. Stanton 1999 "How process enterprises
really work." Harvard Busi ness Review, 77 (6): 108118.
Hannan, M. T., and J. Freeman 1984 "Structural inertia and organi
zational change." American Sociological Review, 49: 149 164.
Harrington, H. J., and D. D. Mathers 1997 ISO 9000 and Beyond: From
Compliance to Performance Improvement. New York: McGrawHill.
Harry, M., and R. Schroeder 2000 Six Sigma: The Breakthrough
Management Strategy Revo lutionizing the World's Top Corporations. New York: Cur rency.
Heaphy, M. S., and G. F. Gruska 1995 The Malcolm Baldrige National
Quality Award: A Yardstick for Quality Growth. Boston: AddisonWesley.
Helfat, C. E. 1994 "Evolutionary trajectories in
petroleum firm R&D." Man agement Science, 40: 17201747.
Henderson, R., J. Del Almo, T. Becker, and J. Lawton 1998 "The perils of excellence: Bar
riers to effective process improvement in product dri ven firms." Production and Operations Quarterly, 7: 218.
Henderson, R. M., and K. B. Clark 1990 "Architectural innovation: The
reconfiguration of existing product technologies and the failure of established firms." Administrative Science Quar terly, 35: 930.
Hsiao, C. 1986 Analysis of Panel Data. Cam
bridge: Cambridge University Press.
ISO (International Organization for Standardization) 2003 ISO 9000 "One Two Three."
http://www.iso.ch.
Ittner, C. D., and D. Larcker 1997 "The performance effects of
process management tech niques." Management Sci ence, 43: 522534.
King, G. 1988 "Statistical models for political
science event counts: Bias in conventional procedures and evidence for the exponential Poisson regression model." American Journal of Political Science, 32: 838863.
Kolesar, P. J. 1993 "Vision values milestones:
Paul O'Neill starts total quality at Alcoa." California Manage ment Review, 35 (3): 133 165.
Lant, T. K., and S. J. Mezias 1992 "An organizational learning
model of convergence and reorientation." Organization Science, 3: 4771.
LeonardBarton, D. 1992 "Core capabilities and core
rigidities: A paradox in manag ing new product develop ment." Strategic Manage ment Journal, 13: 111125.
Levinthal, D. 1991 "Organizational adaptation
and environmental selection: Interrelated processes of change." Organization Sci ence, 2: 140145.
1997a "Three faces of organizational learning: Wisdom, inertia and discovery." In R. Garud, P. Nayyar, and Z. Shapira (eds.), Technological Innovation: Oversights and Foresights: 167180. Cambridge: Cam bridge University Press.
1997b"Adaptation on rugged land scapes." Management Sci ence, 43: 934950.
Levinthal, D., and J. G. March 1993 "The myopia of learning."
Strategic Management Jour nal, 14:95112.
Levitt, B., and J. G. March 1988 "Organizational learning."
Annual Review of Sociology, 14:319340.
March, J. G. 1991 "Exploration and exploitation in
organizational learning." Organization Science, 2: 71 87.
March, J. G., and H. A. Simon 1958 Organizations. New York:
Wiley.
Miller, D. 1993 "The architecture of simplici
ty." Academy of Management Review, 18: 116138.
Miner, A. S., P. Bassoff, and C. Moorman 2001 "Organizational improvisation
and learning: A field study." Administrative Science Quar terly, 46: 304337.
Mukherjee, A., M. Lapre, and L. Van Wassenhove 1998 "Knowledge driven quality
improvement." Management Science, 44: S35S49.
Nelson, R., and S. Winter 1982 An Evolutionary Theory of
Economic Change. Cam bridge, MA: Harvard University Press.
Nonaka, I., and H. Takeuchi 1995 The KnowledgeCreating
Company. New York: Oxford University Press.
Podolny, J. M., and T. E. Stuart 1995 "A rolebased ecology of
technological change." Ameri can Journal of Sociology, 5: 12241260.
Powell, T. C. 1995 "Total quality management as
competitive advantage: A review and empirical study." Strategic Management Jour nal, 16: 1537.
Quality Digest 1999 Database of ISO 9000certi
fied companies. http://www.qualitydigest.com.
Repenning, N. P., and J. Sterman 2002 "Capability traps and selfcon
firming attribution errors in the dynamics of process improvement." Administrative Science Quarterly, 47: 265295.
Rosenkopf, L., and A. Nerkar 2001 "Beyond local search: Bound
aryspanning, exploration, and impact in the optical disc industry." Strategic Manage ment Journal, 22: 287306.
704/ASQ, December 2002

Process Management
Samson, D., and M. Terziovski 1999 "The relationship between
total quality management practices and operational per formance." Journal of Opera tions Management, 17: 393^09.
Siggelkow, N. 2002 "Evolution toward fit."
Administrative Science Quar terly, 47: 125159.
Singh, J. V., R. J. House, and D. J. Tucker 1986 "Organizational change and
organizational mortality." Administrative Science Quar terly, 31: 587611.
Sitkin, S. 1992 "The road to hell: The dynam
ics of distrust in an era of quality." In R. M. Kramer and T. Tyler (eds.), Trust in Organi zations: 196215. London: Sage.
Sitkin, S. B., K. M. Sutcliffe, and R. G. Schroeder 1994 "Distinguishing control from
learning in total quality man agement: A contingency per spective." Academy of Man agement Review, 19: 537 564.
S0rensen, J. B. 2002 "The strength of corporate
culture and the reliability of firm performance." Adminis trative Science Quarterly, 47: 7091.
S0rensen, J. B., and T. E. Stuart 2000 "Aging, obsolescence, and
organizational innovation." Administrative Science Quar terly, 45: 81112.
Staw, B. M., and L D. Epstein 2000 "What bandwagons bring:
Effects of popular manage ment techniques on corporate performance, reputation and CEO pay." Administrative Sci ence Quarterly, 45: 523556.
Sterman, J. D., N. P. Repenning, and F. Kofman 1997 " Unanticipated side effects of
successful quality programs: Exploring a paradox of organi zational improvement." Man agement Science, 43: 503 521.
Sull, D., R. Tedlow, and R. Rosenbloom 1997 "Managerial commitments
and technology change in the U.S. tire industry." Industrial and Corporate Change, 6: 461500.
Sutcliffe, K., S. Sitkin, and L. Browning 2000 "Tailoring process manage
ment to situational require ments." In R. E. Cole and W. R. Scott (eds.), The Quality Movement and Organization Theory: 315330. London: Sage.
Sutton, R. I., and A. Hargadon 1996 "Brainstorming groups in con
text: Effectiveness in a prod uct design firm." Administra tive Science Quarterly, 41: 685718.
Teece, D. J.f G. Pisano, and A. Shuen 1997 "Dynamic capabilities and
strategic management." Strategic Management Jour nal, 18: 509533.
Tripsas, M., and G. Gavetti 2000 "Capabilities, cognition, and
inertia: Evidence from digital imaging." Strategic Manage ment Journal, 21: 11471161.
Tushman, M. L., and P. Anderson 1986 "Technological discontinuities
and organizational environ ments." Administrative Sci ence Quarterly, 31: 439465.
Tushman, M. L., and J. P. Murmann 1998 "Dominant designs, technolo
gy cycles, and organizational outcomes." In B. M. Staw and L. L. Cummings (eds.), Research in Organizational Behavior, 20: 213266. Greenwich, CT: JAI Press.
Tushman, M. L., and R. N. Nelson 1990 "Technology, organizations
and innovation: An introduc tion." Administrative Science Quarterly, 35: 18.
Tushman, M. L., and C. A. O'Reilly 1997 Winning Through Innovation.
Boston: Harvard Business School Press.
Tushman, M. L., and E. Romanelli 1985 "Organizational evolution: A
metamorphosis model of con vergence and reorientation." In L. L. Cummings and B. M. Staw (eds.), Research in Organizational Behavior, 7: 171222. Greenwich, CT: JAI Press.
Weick, K. E. 1979 The Social Psychology of
Organizing. New York: McGrawHill.
Westphal, J. D., R. Gulati, and S. M. Shorten 1997 "Customization or conformi
ty? An institutional and net work perspective on the con tent and consequences of TQM adoption." Administra tive Science Quarterly, 42: 366394.
Winter, S. 1994 "Organizing for continuous
improvement: Evolutionary theory meets the quality revo lution." In J. Baum and J. Singh (eds.), Evolutionary Dynamics of Organizations: 90108. New York: Oxford University Press.
Wruck, K., and M. Jensen 1994 "Science, specific knowledge,
and total quality man agement." Journal of Accounting and Economics, 18: 247287.
Zbaracki, M. J. 1998 "The rhetoric and reality of
total quality management." Administrative Science Quar terly, 43: 602636.
APPENDIX: Patent Classification Codes Patent Class Title
Photography Industry
250 Radiant Energy 345 Computer Graphics Processing, Operator Interface Processing,
and Selective Visual Display Systems 348 Television (many digital camera patents are included here)
705/ASQ, December 2002
355 Photocopying 356 Optics: Measuring and Testing 359 Optics: Systems (Including Communication) and Elements 360 Dynamic Magnetic Information Storage or Retrieval 382 Image Analysis 386 Television Signal Processing for Dynamic Recording or
Reproducing 396 Photography 428 Stock Material or Miscellaneous Articles 430 Radiation Imagery Chemistry: Process, Composition, or
Product Thereof
Paint Industry
106 Coating Compositions
706/ASQ, December 2002