procedure for performing in-plane membrane … performing in‐plane membrane conductivity testing...
TRANSCRIPT

Procedures For Performing In‐Plane Membrane
Conductivity Testing
Test protocol for Conductivity Screening TestingWork Performed Under
DOE Contract DE‐FC36‐06GO16028 June 9 2008
EXECUTIVE SUMMARY
This document outlines in detail a test protocol for performing in‐plane conductivity measurements on membranes for PEM fuel cells Responsibility for developing this test protocol was tasked to the Topic 2 awardee under DOE ContractDE‐FC36‐06GO16028 Under this award FSEC was to work with the fuel cellcommunity to develop standardized methodologies to membrane conductivity as afunction of temperature and relative humidity (RH) and to measure membrane mechanical properties
This conductivity protocol is used at FSEC for all membrane testing FSEC follows the conductivity protocol established by BekkTech and while different equipmentwas used for the samples that have been compared this test protocol reproduced BekkTech conductivity results BekkTech performs the DOE protocol using the BekkTech Conductivity Test System Model BT‐552 FSEC has reproduced the BekkTech test results using FSECrsquos existing test equipment with the only significantmodification to the BekkTech procedures being the length of time at each RH (BekkTech holds for 15 minutes at each RH FSEC holds for 60 minutes at each RH)
Researchers following the test protocol will be able to reproduce results that havebeen obtained by both FSEC and BekkTech
1
Contents 1 Reproducing BekkTech Conductivity Test Results hellip3 2 Gas Equipment amp Software Requirements hellip3
21 Gas Flow amp System Pressure hellip3 22 Equipment helliphelliphelliphelliphelliphelliphelliphelliphelliphelliphelliphelliphelliphelliphelliphelliphelliphelliphelliphelliphelliphelliphelliphelliphelliphelliphelliphelliphellip3 23 Software hellip3
3 Preparing a Sample for Testing helliphelliphelliphelliphelliphellip4 31 Equilibrate Sample to Room Conditions hellip4 32 Cut Sample hellip4 33 Verify Sample Width hellip4 34 Sample Length 5 35 Measure Sample Thickness 5 36 Assemble Sample in the Conductivity Cell hellip5 37 Insert Thermocouple hellip6 38 Assemble Conductivity Cell with Cell Hardware7 39 Connect to Heated Gas Lines hellip7 310 Electrical Connections to the Conductivity Cell9 311 Measuring Resistancehelliphelliphelliphelliphelliphelliphelliphelliphellip10 312 Connect Cell Hardware to Heater Power and Heater Thermocouplehellip10
4 Test Protocol for Samples Submitted to BekkTech Under the DOE Program hellip 10 5 Environmental Control of MembraneGas Supplyhellip10 6 System Pressure Regulationhelliphelliphelliphelliphelliphelliphelliphelliphelliphelliphelliphelliphelliphelliphelliphelliphelliphelliphelliphelliphelliphelliphelliphelliphelliphelliphelliphelliphelliphelliphelliphelliphelliphelliphelliphelliphellip12 7 Data Acquisition and Analysishelliphelliphelliphelliphelliphelliphelliphelliphelliphelliphelliphelliphelliphelliphelliphelliphelliphelliphelliphelliphelliphelliphelliphelliphelliphelliphelliphelliphelliphelliphelliphelliphelliphelliphelliphellip12
71 Recommended Conductivity Test Conditionshelliphelliphelliphelliphelliphelliphelliphelliphelliphelliphelliphelliphelliphelliphelliphelliphelliphelliphelliphelliphelliphelliphelliphelliphellip15 72 Prepare Equipment and Software for 30 oC Test helliphelliphellip15 73 Prepare Equipment and Software for 80 oC Test hellip16 74 Prepare Equipment and Software for 120 oC Testhelliphellip17 75 Shutdown Procedure hellip17 76 Calculating Conductivity helliphellip18 77 Basic Assumptions of Experimenthelliphelliphelliphelliphelliphelliphelliphelliphelliphelliphelliphellip hellip19
8 Contact Information helliphellip19
2
1 Test Protocol for Membrane Conductivity Screening Test Conductivity testing for the DOE program Milestones are conducted by BekkTech Corp and reported to the individual teams and to FSEC Program Management for presentation and review with DOE The purpose of this protocol is to provide the individual Task 1 team members with a verified protocol for their screening tests This document outlines the conductivity test procedures used at FSEC FSEC follows the conductivity protocol established by BekkTech and while different equipment was used for the samples that have been compared this test protocol reproduced BekkTech conductivity results
2 Gas Equipment amp Software Requirements FSEC uses the equipment and software listed below to perform conductivity measurements
21 Gas Flow and System Pressure bull Gas - Hydrogen bull 30 oC Tests
o Gas Flow Control - Two Mass Flow Controllers from the Fuel Cell Test Station Model 850C Scribner Associates Inc are used for gas‐mixing to achieve dew points for 30 oC testing
o System Pressure - 100 kPa absolute This is approximately atmospheric pressure in Florida
bull 80 oC Tests o Gas Flow Control ndash One Mass Flow Controller from the Fuel Cell Test Station
Model 850C Scribner Associates o System Pressure - 100 kPa absolute This is approximately atmospheric pressure
in Florida bull 120 oC Tests
o Gas Flow Control ndash One Mass Flow Controller from the Fuel Cell Test Station Model 850C Scribner Associates
o System Pressure - 230 kPa absolute This is approximately 130 kPa gauge in Florida Pressure is provided by a Scribner and Associates backpressure regulator
22 Equipment bull Fuel Cell Technologies 5 cm2 fuel cell test hardware with longer bolts supplied by
BekkTech bull BekkTech Conductivity Cell ndash Part BT‐112 bull BekkTech Saturator ndash Part BT‐104 bull BekkTech Heated Gas Line ndash Part BT‐125 bull Princeton Applied Research 263 PotentiostatGalvanostat bull Temperature Controllers amp Thermocouples
o Omega CSC32 Temperature Controller with a K‐type thermocouple in the saturator o Self‐tune Plus Love Controls with a K‐type thermocouple in the heated gas line o Love Controls with T‐type thermocouples in the fuel cell
bull In‐house‐made water condensers on the gas exit bull Scribner Associates backpressure regulator
3
23 Software bull Conductivity is monitored as a function of time using CorrWare (Scribner Associates) bull Gas flow and cell temperature are controlled using Fuel Cell Software (Scribner
Associates) bull Data is analyzed using Excel (Microsoft)
3 Preparing a Membrane Sample for Testing Clean all work surfaces and test hardware with ethanol and compressed air Wear properly specified gloves while handling the membrane to prevent contamination
31 Equilibrate Sample to Room Conditions Place membrane sample on a clean counter surface for 24 hours to allow equilibration to room temperature and room humidity
FSEC Facility Room Conditions Room temperature of approximately 21 oC and average room relative humidity of 60
32 Cut Sample Use the Sample Punch (BekkTech part number ACC‐960 Figure 1) to cut a piece from the membrane for testing Sample to be tested measures approximately 5 mm x 25 mm Sandwich the membrane between thin sheets of Teflon when cutting the sample
Figure 1 Sample Punch
Alternative Cutting Method Use an Exacto knife and a straight edge to cut the sample The sample must be long enough to extend slightly beyond the platinum mesh of the conductivity cell
33 Verify Sample Width Use a Width Measurement Tool (BekkTech part number ACC‐940) to verify the width of the sample being tested The Width Measurement Tool has magnification of 11x and a reticule with 01mm gradients
Figure 2 Width Measurement Tool
4
34 Sample Length Sample length is set by the BekkTech Conductivity Cell We use a length of 425 mm for all conductivity calculations
35 Measure Sample Thickness Use a Mitutoyo Gauge (Figure 3) is to determine sample thickness Measure the equilibriated (according to section 31) thickness of the membrane using an average of at least 10 readings taken over the entire membrane Sandwich the membrane between thin sheets of Teflon of known thickness when making the caliper readings
Figure 3 Mitutoyo Gauge
36 Assemble Sample in the Conductivity Cell The BekkTech conductivity cell is shown in Figure 4 Place the Teflon support (square Teflon piece) under the clamp of the BekkTech conductivity Cell This prevents unnecessary bending of platinum wires during assembly
Remove all four screws holding the top membrane clamp Then remove the top membrane clamp from the bottom membrane clamp Use tweezers to gently lift the platinum wires up from the bottom clamp
Insert the membrane sample under the platinum wires Place the membrane sample perpendicular to the voltage measurement probes in the main body Ensure there is adequate overlap between the ends of the membrane and platinum gauze at either end of the sample A schematic of a side view of the membrane sample assembly is shown in Figure 5 The conductivity cell is designed for a minimum of 3 mm of overlap with the gauze For thick samples that will be run at high humidity place the membrane above the platinum wires For thin samples or dry operating conditions place the membrane below the platinum wires
Use tweezers to place the top membrane clamp onto the top surface of the membrane sample Use the notches on the top membrane clamp as a guide Gently secure the membrane clamp using the four fasteners A picture of the conductivity cell with the top clamp secured is shown in Figure 6 Be careful to apply only light torque (finger tight) when tightening fasteners as threads in main body are easily stripped‐out
5
Figure 4 BekkTech Conductivity Cell shown with Teflon support (not labeled) beneath the membraneplatinum wire probe configuration The membrane has been inserted properly in the Main Body with top clamp off to the side
Figure 5 Assemble Sample Under Pt Wires
Figure 6 Replace Top Clamp
37 Insert Thermocouple Insert Type T internal thermo couple (TC) into the Bottom Membrane Clamp beneath the membrane as shown in Figure 7 The TC should be positioned so that the junction is directly below the membrane The junction is typically ~05 mm to 1 mm from the end of the TC Once placed snug the fitting around the TC
6
p
TC should be positioned so that the Junction is directly below membrane
The junction is typically ~05 mm to 1 mm from the end of the TC
Figure 7 Internal Thermocouple Placement
38 Assemble Conductivity Cell with Cell Hardware Place the Bekktech Conductivity Cell onto the graphite end plate of the Fuel Cell Technology test hardware as shown in Figure 8 The current collectors that extend from the ends of the graphite end plates must be aligned in the same direction as the voltagecurrent external ports of the Conductivity Cell Place the remaining graphite end plate on top of the Conductivity Cell Re‐assemble the cell hardware Using the longer bolts provided by BekkTech secure the graphiteConductivity Cellgraphite sandwich (Figure 9) You will use only 4 bolts to secure the assembly The Conductivity Cell makes a good seal with the 4 bolts Install the bolts in a diagonal pattern with a very light torque of about 20 in‐lbs to make a good seal The Teflon conductivity cell will expand upon heating so if the sandwich is bolted too tightly the Teflon will deform between the plates and begin to ldquoflow outrdquo the sides
Figure 8 Conductivity cell with cell hardware Figure 9 Assembled conductivity cell in cell hardware
39 Connect to Heated Gas Lines Serious injury or death can occur if hydrogen and oxygen are combined within the conductivity cell Therefore only one source of gas is used in performing conductivity tests regardless of the ldquoenvironmental systemrdquo used
7
FSEC uses a combination of BekkTech and Scribner components to conduct membrane conductivity tests The BekkTech Conductivity Cell hardware and BekkTech Saturator are used in conjunction with the Scribner 850C and a backpressure regulator located after the condenser on the gas exit line In this case FSEC uses the Scribner test stand for flow control and membrane temperature control and the BekkTech saturator for rapid humidity control The backpressure regulator is used for pressure control FuelCellreg SOFTWARE is used control the flowrates and cell temperature
Connect the gas outlet from the BekkTech saturator to the anode gas inlet of Fuel Cell Technology test hardware Plug the anode outlet of the fuel cell test hardware with a frac14rdquo stainless steel cap Connect the cathode gas outlet of the cell hardware to the cathode exhaust line (which is connected to a condenser followed by a pressure regulator) Plug both cathode supply at the 850C station and cathode gas inlet of fuel cell test hardware with frac14rdquo stainless steel caps Doing this and purging the system with N2 prior to application of hydrogen will eliminate the chances of accidental gas mixing The setup described above with the gas lines condenser and backpressure regulator connected to the fuel cell is shown below in Figures 10 and 11
Figure 10 Gas inlet and saturator setup
Gas Inlet Port Plugged(Side 2)
Gas Inlet Port (Side 1)
Saturator
Heated Gas Line
Gas Outlet Port Plugged (Side 1)
Gas Outlet Port (Side 2)
8
Condenser
Pressure Regulator
Figure 11 Condenser and pressure regulator setup
310 Electrical Connections to the Conductivity Cell Figure 12 shows the Fuel Cell Technologies Cell Hardware with the BekkTech Conductivity Cell in place and the electrical connections attached to perform a 4‐probe measurement The electrical connection is made to a Princeton Applied Research PotentiostatGalvanostat Model 263
Figure 12 Wiring for a four electrode measurement Connectivity from Left to Right is Counter Reference Sense Working
9
311 Measuring Resistance FSEC uses a Princeton Applied Research GalvanostatPotentiostat Model 263 to set a voltage and measures the resulting current for conductivity tests We perform a Scanning DC Sweep from 03V to ‐03V The linear Voltage‐Current data is fit for resistance
312 Connect Cell Hardware to Heater Power and Heater Thermocouple Plug the internal cell thermocouple (TC) into the thermocouple outlet Plug the power cable from the cell hardware heaters into the power outlet on the test stand
CAUTION We recommend that you always wait to connect the cell hardware heaters to power until after you have verified that the cell hardware internal TC is properly placed in the cell hardware If this TC is accidentally left out of the cell hardware or improperly installed the TC will communicate an incorrect temperature to the cell hardware temperature controller Irreparable damage to the cell hardware and conductivity cell may result
4 Test Protocol for Samples under the DOE Program Each sample is tested for approximately six days ‐ first at 30 oC then 80 oC then 120 oC A membrane sample is assembled into the conductivity cellcell hardware fixture and tested at 30 oC 80 oC and 120 oC without removal from the cell hardware
This section is intended to give nut amp bolts instruction on how to start up or change gas supply conditions using the Scribner 850C test stand and Fuel Cell SOFTWARE adjust system pressure using the backpressure regulator and take V vs I data using the PAR potentiostat and Corrware software
5 Environmental Control of MembraneGas Supply Operation Open FuelCellreg SOFTWARE Figures 13a and b show initial dialog boxes for setup cell and setup fuel with settings for a 30 oC run The cell temperature (ie membrane temperature) and fuel flow control will change based on the scheduled testing condition (either 30 80 or 120 oC) The initial dialog boxes for 80 and 120 oC runs are shown in Figures 14 and 15 respectively
0 711 0 289
Figure 13a Setup Cell menu in FuelCell software showing 30 oC test startup conditions
Figure 13b Setup Fuel menu in FuelCell software showing 30 oC startup conditions
10
1 0
Figure 14a Setup Cell menu in FuelCell software showing 80 oC test startup conditions
Figure 14b Setup Fuel menu in FuelCell software showing 80 oC startup conditions
12
120
Figure 15a Setup Cell menu in FuelCell software showing 120 oC test startup conditions
Figure 15b Setup Fuel menu in FuelCell software showing 120 oC startup conditions
Hydrogen gas is used for all conductivity tests Only nitrogen and hydrogen are connected to the test station Fuel flow rates and temperatures are set based on test membrane temperature and test relative humidity (outlined in sections 72‐74) Sections 72‐74 contain more detailed information regarding flowrate settings The temperature setpoint for the fuels is not critical because these temperatures will actually be controlled using the BekkTech saturator The temperature of the saturator controls the relative humidity of the membrane The relative humidity will be changed every 60 minutes based on the protocol for recommended conductivity test conditions outlined in section 4
In the Main Control dialog box of the FuelCell software as shown in Figure 16 click ldquoCellrdquo to control the temperature of the cell Turn on the temperature control for the saturator and line The temperature of the line should be 10‐15 oC above the temperature of the saturator to prevent condensation Then click the ldquoApply Fuelrdquo button once the prescribed temperatures are reached A click will sound from the 850C indicating solenoid valves for flow control are in function
11
Figure 16 Main control and display menu in FuelCellreg SOFTWARE
6 System Pressure Regulation When testing at membrane temperatures gt 100 oC the system must be operated at pressures above atmosphere in order to achieve 100 RH System pressure is raised by restricting gas flow out of the system via a regulator placed after the exhaust gases pass through a condenser The pressure is adjusted by dialing the regulator valve until the desired pressure is read off the gauge A system pressure of 230 kPa is recommended for testing at a membrane temperature of 120 oC
7 Data Acquisition and Analysis Open Corrware2 data acquisition software to perform conductivity measurement (collect V vs I data) and following the steps shown below
1 Select the Cyclic Voltammagram experiment (Figures 17 and 18) Choose file name and where it will be saved Then measure selected lines In Figure 20 a typical plot is shown When an appropriate amount of time has passed (one hour for each humidity and two hours for start up) press stop (the red octagon) to stop the experiment
12
Figure 17 CorrWare experiment type page
Figure 18 Cyclic voltammagram experimental setup
13
Figure 19 Typical plot of a cyclic voltammagram measurement
2 To analyze the data open CorrWare DataMacroRev5xls found on the desktop Select ldquoenable macrosrdquo This program analyzes the CorrWare data by obtaining the slope of the V‐I plots (ie the resistance) over time Copy the name of the file that was just saved (cor) in ldquoDatafile to processrdquo This file must be in the same folder as MacroRev5 Open the template file (xls) whose name matches that in ldquoTemplate file namerdquo The output file will be that named in ldquoNew Data Analysis Namerdquo Click on ldquoCreate New Data Analysis Filerdquo In a few seconds a new file is created that is the xls version of the cor file that was just obtained
3 In the new xls file open the ldquoRHamp4ElecCondVsTimerdquo tab This gives a plot of conductivity vs time An example is shown in Figure 20 By examining this plot it is possible to determine when the membranersquos conductivity reached steady‐state In the plot in Figure 20 steady state was reached around 60 minutes If steady‐state is not reached repeat the measurement using a new file name until a steady‐state is reached
4 Open the ldquodatardquo tab in the xls file The final column (G) is the calculated 4 electrode conductivity The file time is in column D Take an average of the conductivity values that have been obtained in steady state This value is the conductivity of this membrane in the conditions under study
5 Repeat the test for various operating conditions
14
Four Electrode Conductivity N112 80 C 70 RH
1200
1000
Con
duct
ivity
(mS
cm)
800
600
400
200
00 0 30 60 90 120 150
Time (Minutes) Figure 20 Sample conductivity plot 71 Recommended Conductivity Test Conditions The test includes both decreases and increases to the RH This provides a more complete picture of the characteristics of the sample since the water content may change slowly with relative humidity and the conductivity may change with time
bull Load membrane into Conductivity Cell bull Adjust Temperatures pressures and flowrates to meet ldquowet‐uprdquo specifications bull Wet‐up at desired temperature (30 80 or 120 oC) 70 RH for 2 hours bull Follow RH steps allowing 60 minutes of stabilization for each as follows
Dew Point for 70 RH ramping down to 20 in increments of 10 followed by a ramping up to 100 in increments of 10 72 Prepare Equipment amp Software for 30 oC Test Ensure that the valve on the dry gas line that connects into the wet gas line is open Gas‐mixing is needed for controlling dew points at 30 oC Hydrogen gas is fed to both the anode and the cathode Gas Flow ndash 1000 SCCM Hydrogen Gas Mixing - The dew points are set using a mixture of dry gas (‐50 oC anode water was drained from the test station) with gas saturated to a dew point of 45 oC (cathode) System Pressure -100 kPa absolute This is atmospheric pressure in Florida Sample Conditioning - Wet‐up at 30 oC 70 RH for 2 hours
15
After 2 Hours of Conditioning - Operating conditions are adjusted every 60 minutes Note that 2 Mass Flow Controllers are required for this temperature One flows gas through the Saturator (Wet Gas cathode) The second mixes with the saturated gas after the Saturator (Dry Gas anode) Wet and dry gas flows are controlled using FuelCell software (Scribner)
The gas flow rates required to reach the desired relative humidities are outlined in Table 1 From 20‐40 RH 2000 sccm of gas is used while from 50‐100 RH 1000 sccm of gas is used
Relative Humidity (RH)
Wet Gas Flow Rate (45 oC dew point)
(SCCM)
Dry Gas Flow Rate (‐50 oC dew point) (SCCM)
70 289 711 60 246 754 50 204 796 40 326 1664 30 243 1757 25 202 1798 20 161 1839 25 202 1798 30 243 1757 40 326 1664 50 204 796 60 246 754 70 289 711 80 331 669 90 375 625 95 396 604 100 418 582
Table 1 Wet and dry gas flow rates required to reach the desired relative humidities at 30 oC
73 Prepare Equipment amp Software for 80 oC Test Ensure that the valve on the dry gas line that connects into the wet gas line is closed Gas‐mixing is not needed for controlling dew points at 80 oC
Gas Flow - 1000 SCCM Hydrogen Gas Mixing ndash None System Pressure -100 kPa absolute This is atmospheric pressure in Florida Sample Conditioning - Wet‐up at 80 oC 70 RH for 2 hours After 2 Hours of Conditioning - Operating conditions (saturator temperature) are adjusted every 60 minutes as follows
bull Dew Point of 714 oC for 70 RH bull Dew Point of 679 oC for 60 RH bull Dew Point of 638 oC for 50 RH bull Dew Point of 589 oC for 40 RH bull Dew Point of 529 oC for 30 RH bull Dew Point of 492 oC for 25 RH
16
bull Dew Point of 448 oC for 20 RH bull Dew Point of 492 oC for 25 RH bull Dew Point of 529 oC for 30 RH bull Dew Point of 589 oC for 40 RH bull Dew Point of 638 oC for 50 RH bull Dew Point of 679 oC for 60 RH bull Dew Point of 714 oC for 70 RH bull Dew Point of 746 oC for 80 RH bull Dew Point of 774 oC for 90 RH bull Dew Point of 787 oC for 95 RH bull Dew Point of 800 oC for 100 RH
74 Prepare Equipment and Software for 120 oC Test Ensure that the valve on the dry gas line that connects into the wet gas line is closed Gas‐mixing is not needed for controlling dew points at 120 oC
Gas Flow - 500 SCCM Hydrogen Gas Mixing ndash None System Pressure - 230 kPa absolute This is approximately 130 kPa in Florida Sample Conditioning - Wet‐up at 80C 70 RH for 2 hours After 2 Hours of Conditioning - Operating conditions (saturator temperature) are adjusted every 60 minutes as follows
bull Dew Point of 1089 oC for 70 RH bull Dew Point of 1044 oC for 60 RH bull Dew Point of 992 oC for 50 RH bull Dew Point of 930 oC for 40 RH bull Dew Point of 854 oC for 30 RH bull Dew Point of 811 oC for 25 RH bull Dew Point of 752 oC for 20 RH bull Dew Point of 811 oC for 25 RH bull Dew Point of 854 oC for 30 RH bull Dew Point of 930 oC for 40 RH bull Dew Point of 992 oC for 50 RH bull Dew Point of 1044 oC for 60 RH bull Dew Point of 1089 oC for 70 RH bull Dew Point of 1130 oC for 80 RH bull Dew Point of 1167 oC for 90 RH bull Dew Point of 1184 oC for 95 RH bull Dew Point of 1200 oC for 100 RH
75 Shut Down Procedures bull When the test has completed stop fuel using FuelCell software bull Cool the system by reducing the temperatures on the temperature controllers bull When the system has cooled to below 100 oC reduce back pressure to 100 kPa and allow
system to depressurize
17
L
T
W
V
I
bull Turn off PAR 263 Potentiostat bull When the system has cooled to ~50 oC close FuelCell program turn off test station and
turn off Nitrogen and Hydrogen
76 Calculating Conductivity The formula for calculating conductivity is included in the MacroRev5xls file To manually calculate conductivity use the following information R is calculated using a Least Squares Fit of the voltage‐current data
T
W
V
I
L
Figure 21 Schematic of conductivity cell
The distance between V1 and V2 probe points (L) in the conductivity cell is 425 mm The definition of Resistance in terms of bulk resistivity R is shown in equation 1
ρL ρLR = = 1A WT
Where A is the cross‐sectional area perpendicular to the current flow which in this case is sample Width Thickness L is the distance in the direction of ion flow between voltage measurements Solving this equation for resistivity ρ results in equation 2
RWTρ = 2L
Conductivity σ is the inverse of resistivity as shown in equation 3
1 Lσ = = 3ρ RWT
For example agrave Size of Nafion membrane sample 05 cm wide 0005 cm thick agrave Slope of current vs voltage measurement (resistance) 2230 Ohms 60C 100 RH
18
R W T sdot sdot 2 230 ohms sdot05cm sdot0005 cm = = =1311Ohms cm ρ sdot
L 0425cm
This yields a conductivity of
1σ = = 0076 Siemens cm ρ
77 Basic Assumptions of Experiment When assessing the accuracy of results note the following assumptions agrave The length of the membrane between the platinum wire measurement probes connected
to V1 and V2 is known to be 0425 cm for the Conductivity Cell V1 and V2 are measured using platinum wire 075 mm diameter The two wires are
5 mm apart center‐to‐center Thus for a rigid sample 5 mm may be a better distance to use But for a pliable sample 425 mm is a better measurement
Be aware that some membrane samples may swell or change dimension impacting resistivity measurements
agrave The interior humidity of the Conductivity Cell is exactly what is set at the humidifier Many humidifiers are inaccurate Be sure to test the humidification system if
results of these tests will be used for more than comparative analysis Low flows and condensing environments can lead to lower than expected humidity
levels
8 Contact Information Florida Solar Energy Center 1679 Clearlake Road Cocoa FL 32922‐5703
Tel 3216381000 Fax 3216381010
19
- ProceduresFor Performing In‐Plane MembraneConductivity Testing
- EXECUTIVE SUMMARY
- Contents
- Test Protocol for Membrane Conductivity Screening Test
- Gas Equipment amp Software Requirements
- Preparing a Membrane Sample for Testing
- Test Protocol for Samples under the DOE Program
- Environmental Control of MembraneGas Supply Operation
- System Pressure Regulation
- Data Acquisition and Analysis
- Contact Information
-
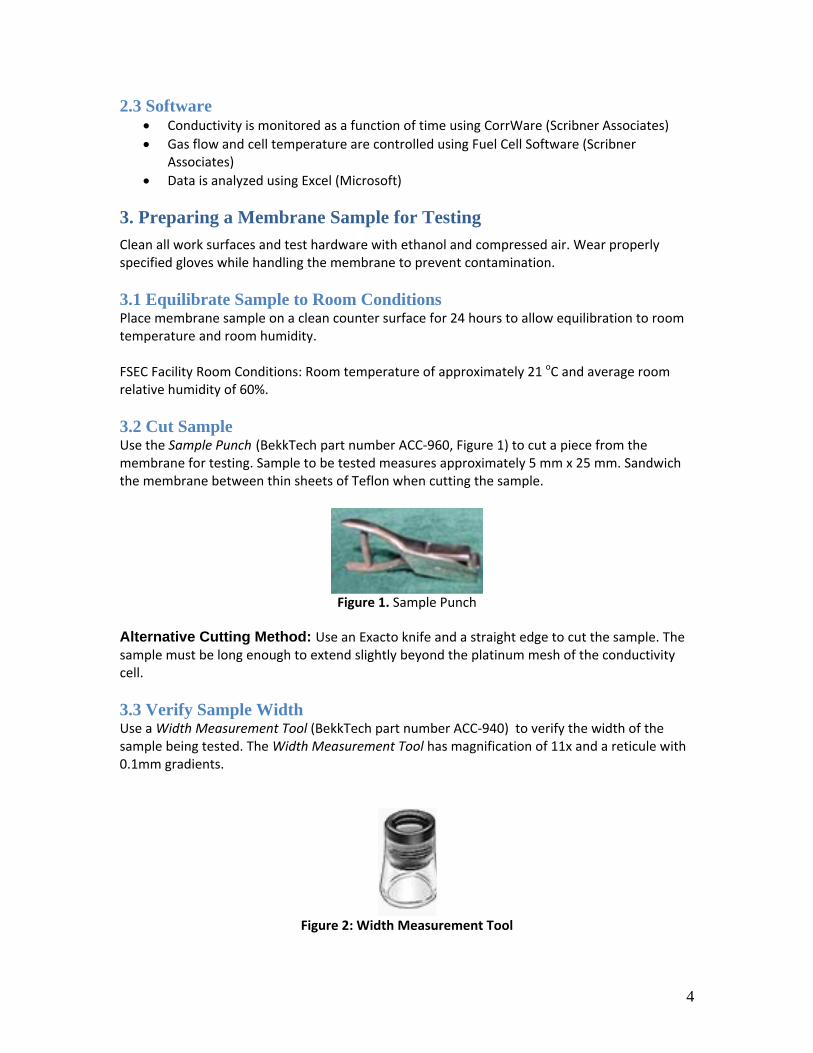
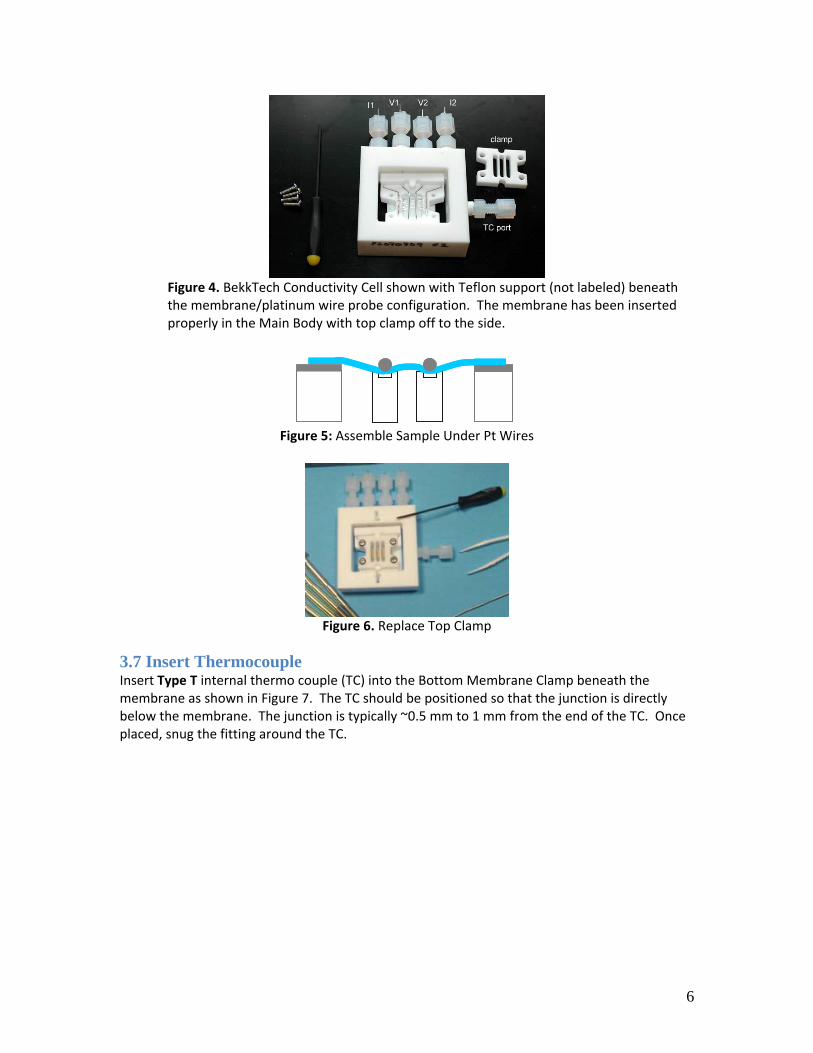
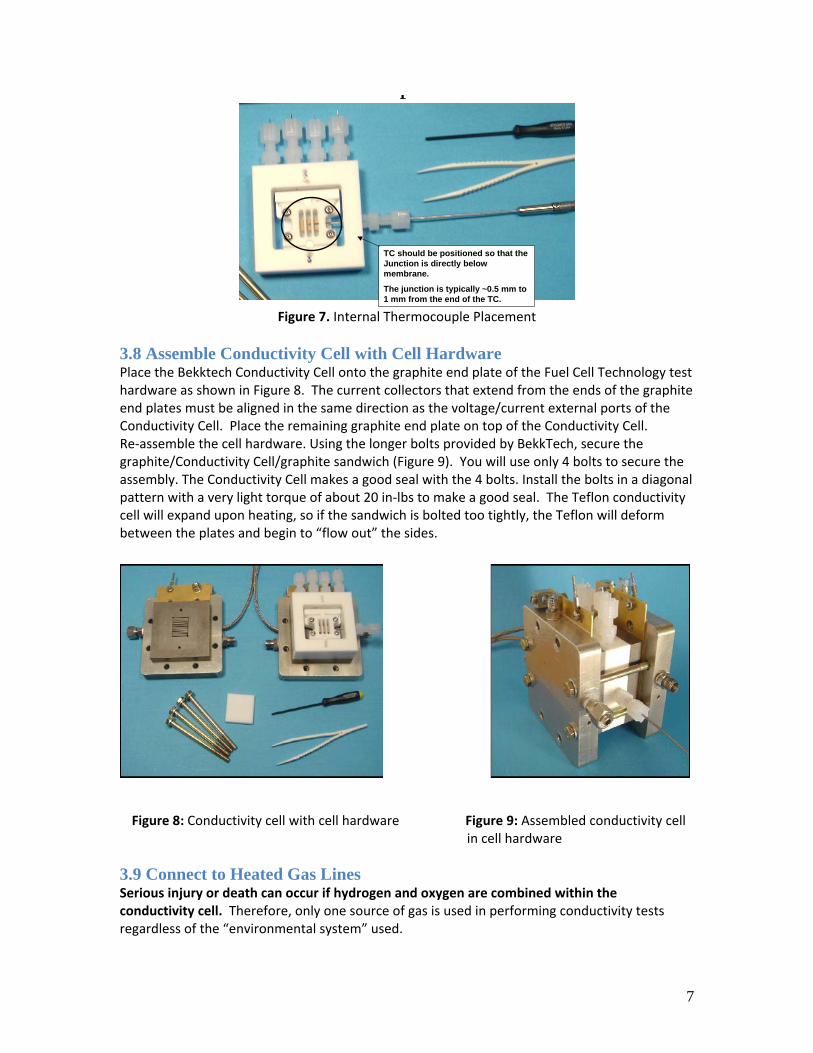
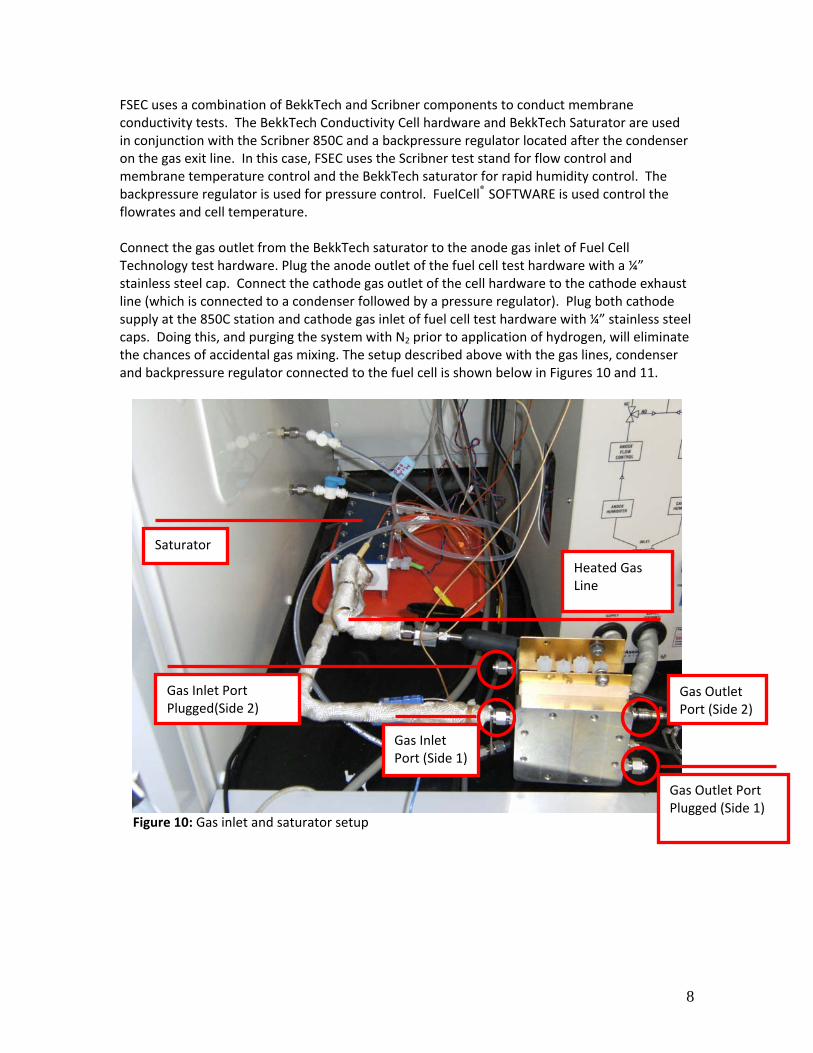
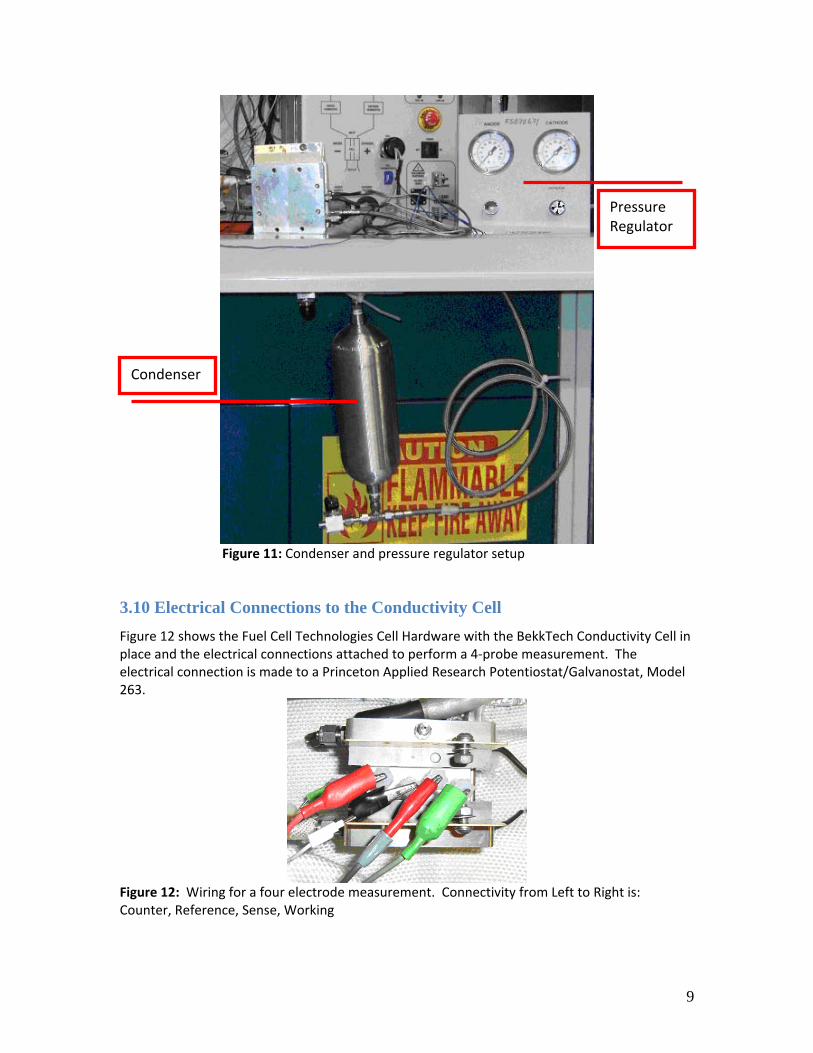
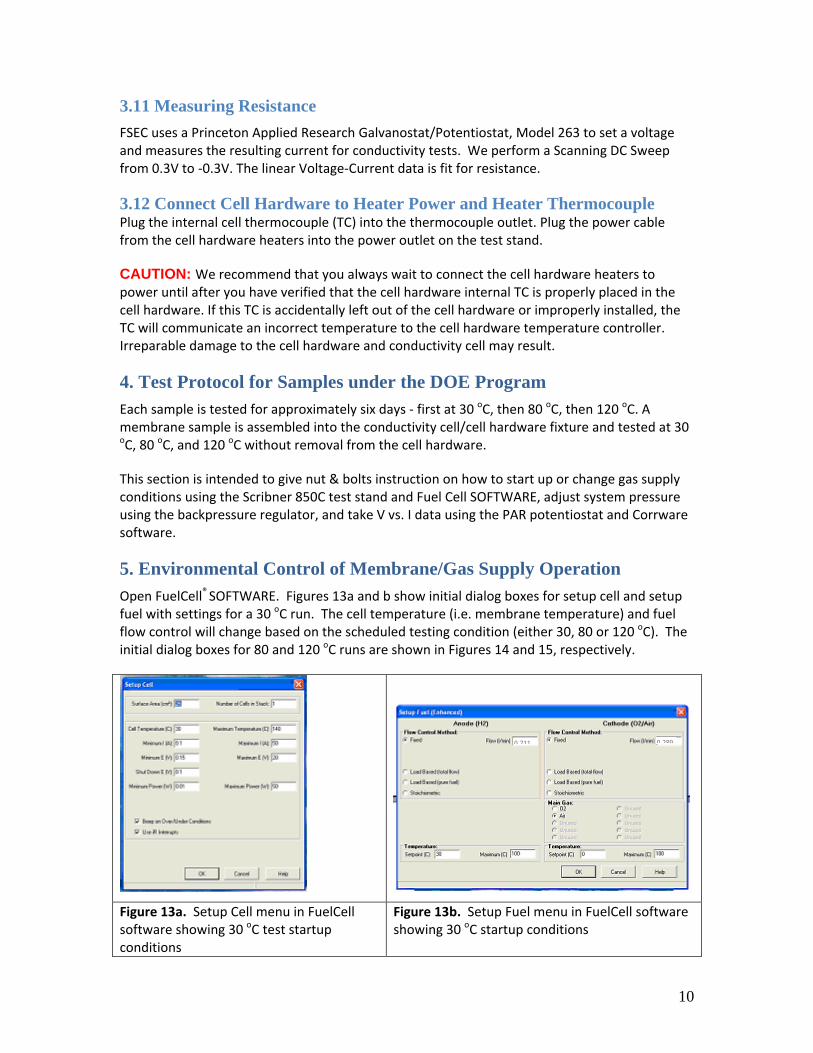
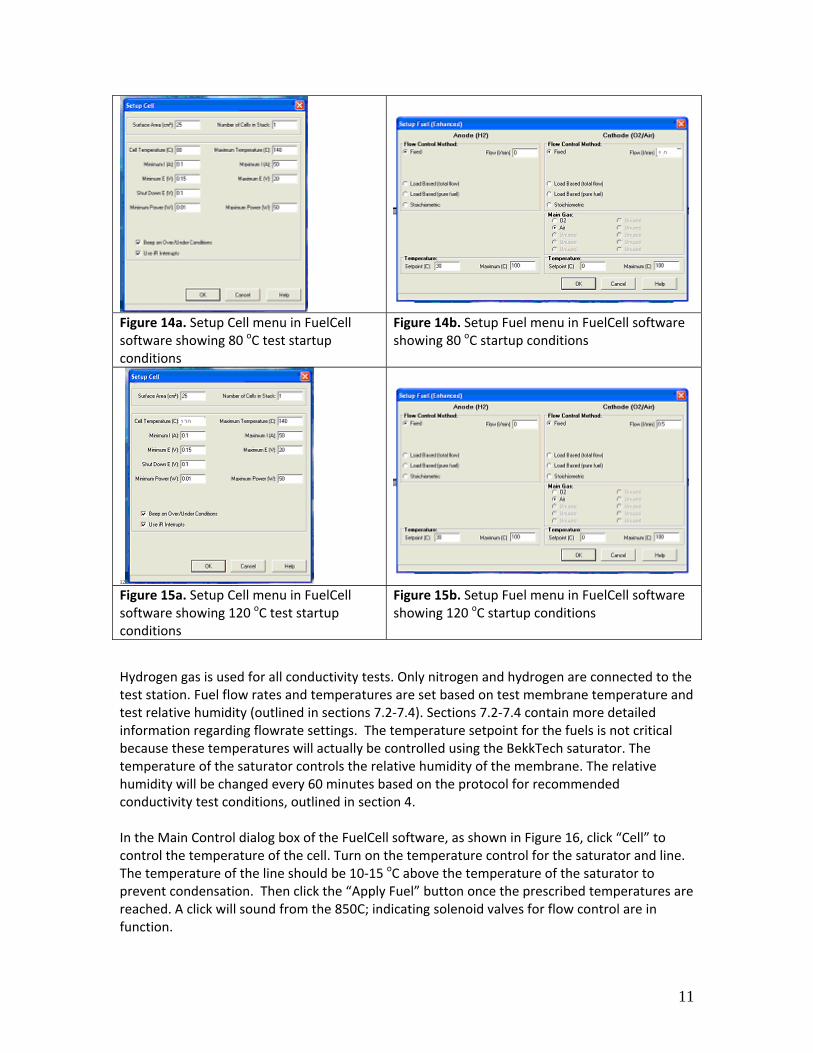
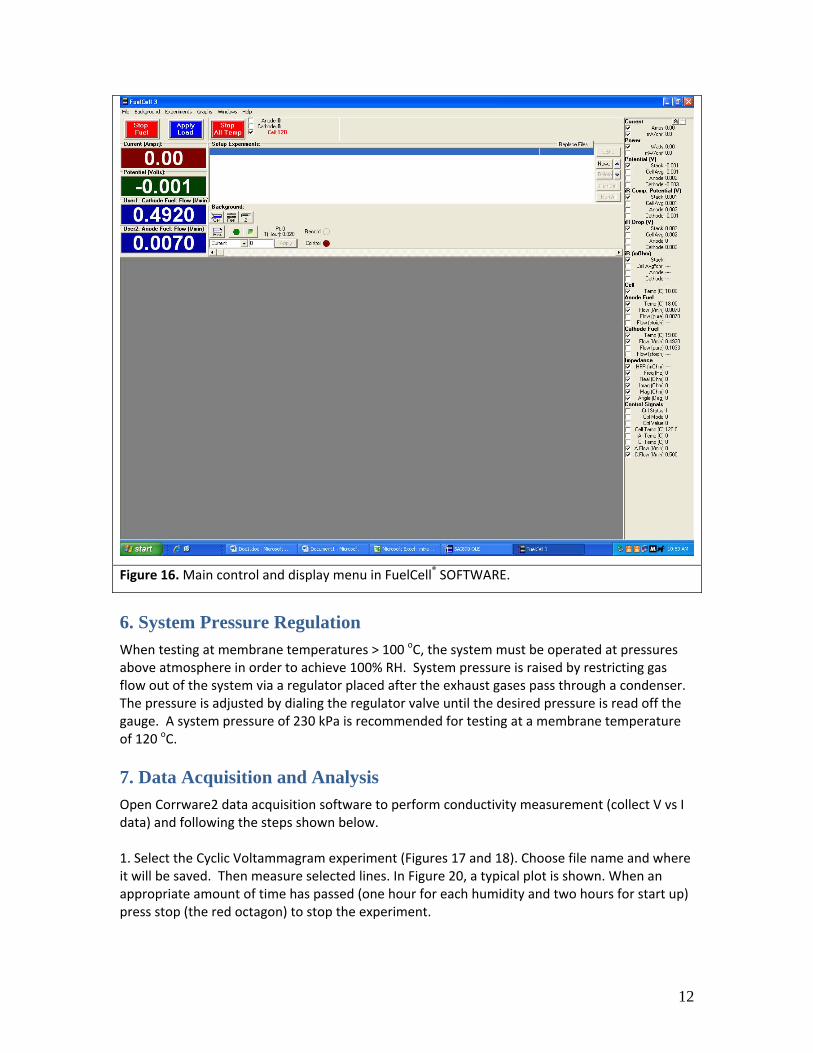
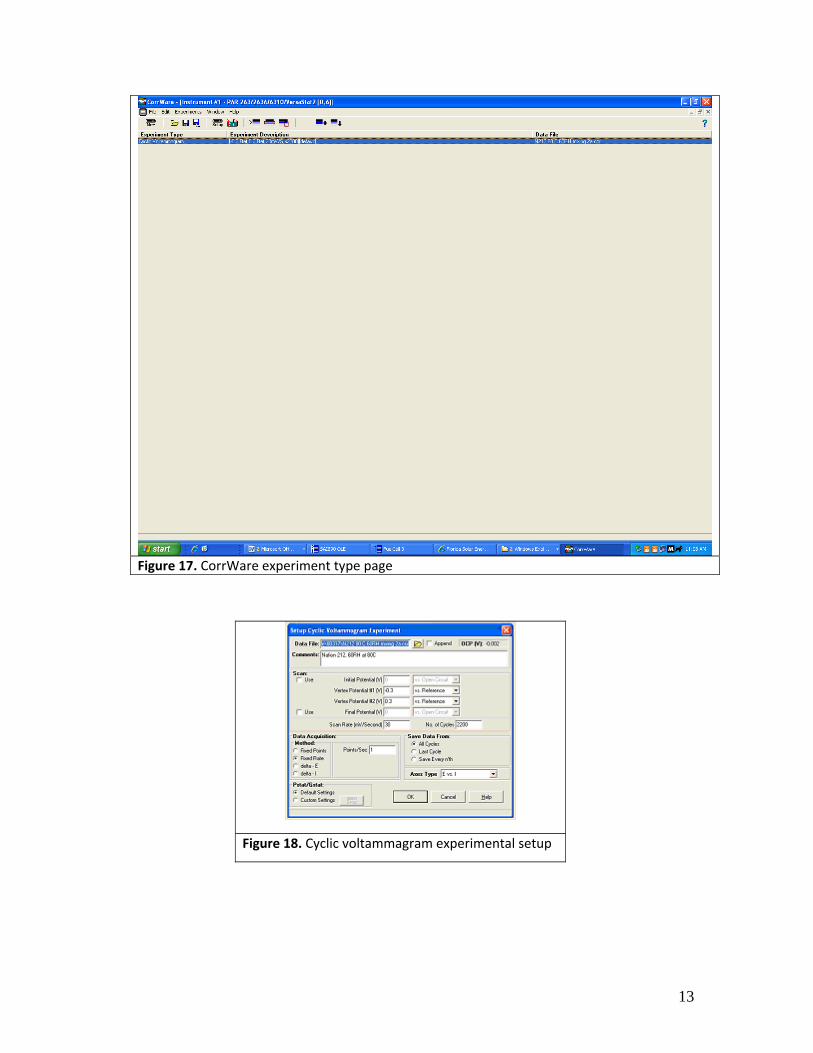
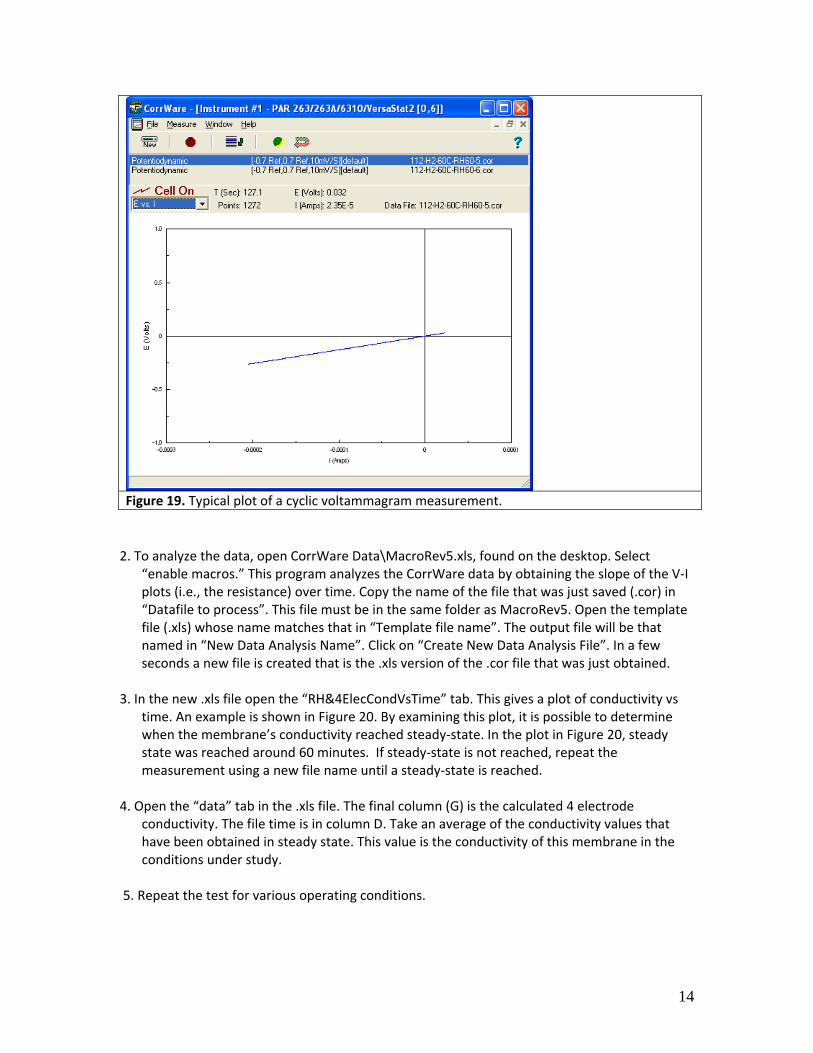
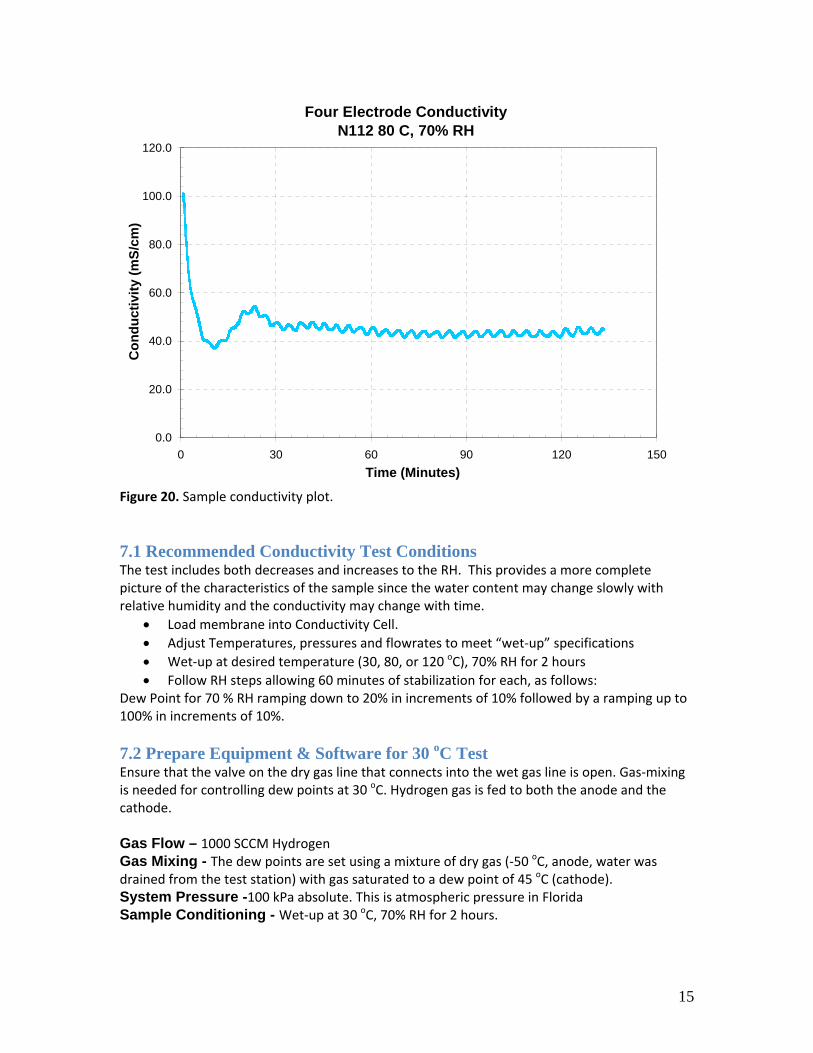
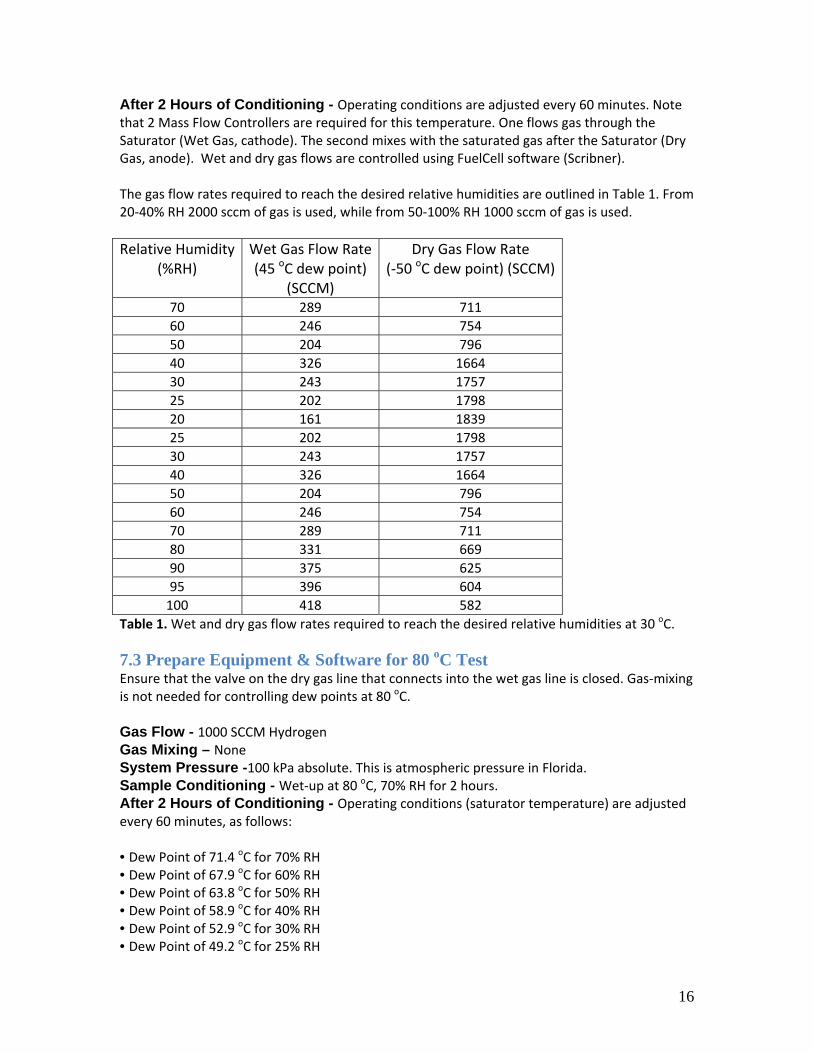
L
T
W
V
I
bull Turn off PAR 263 Potentiostat bull When the system has cooled to ~50 oC close FuelCell program turn off test station and
turn off Nitrogen and Hydrogen
76 Calculating Conductivity The formula for calculating conductivity is included in the MacroRev5xls file To manually calculate conductivity use the following information R is calculated using a Least Squares Fit of the voltage‐current data
T
W
V
I
L
Figure 21 Schematic of conductivity cell
The distance between V1 and V2 probe points (L) in the conductivity cell is 425 mm The definition of Resistance in terms of bulk resistivity R is shown in equation 1
ρL ρLR = = 1A WT
Where A is the cross‐sectional area perpendicular to the current flow which in this case is sample Width Thickness L is the distance in the direction of ion flow between voltage measurements Solving this equation for resistivity ρ results in equation 2
RWTρ = 2L
Conductivity σ is the inverse of resistivity as shown in equation 3
1 Lσ = = 3ρ RWT
For example agrave Size of Nafion membrane sample 05 cm wide 0005 cm thick agrave Slope of current vs voltage measurement (resistance) 2230 Ohms 60C 100 RH
18
R W T sdot sdot 2 230 ohms sdot05cm sdot0005 cm = = =1311Ohms cm ρ sdot
L 0425cm
This yields a conductivity of
1σ = = 0076 Siemens cm ρ
77 Basic Assumptions of Experiment When assessing the accuracy of results note the following assumptions agrave The length of the membrane between the platinum wire measurement probes connected
to V1 and V2 is known to be 0425 cm for the Conductivity Cell V1 and V2 are measured using platinum wire 075 mm diameter The two wires are
5 mm apart center‐to‐center Thus for a rigid sample 5 mm may be a better distance to use But for a pliable sample 425 mm is a better measurement
Be aware that some membrane samples may swell or change dimension impacting resistivity measurements
agrave The interior humidity of the Conductivity Cell is exactly what is set at the humidifier Many humidifiers are inaccurate Be sure to test the humidification system if
results of these tests will be used for more than comparative analysis Low flows and condensing environments can lead to lower than expected humidity
levels
8 Contact Information Florida Solar Energy Center 1679 Clearlake Road Cocoa FL 32922‐5703
Tel 3216381000 Fax 3216381010
19
- ProceduresFor Performing In‐Plane MembraneConductivity Testing
- EXECUTIVE SUMMARY
- Contents
- Test Protocol for Membrane Conductivity Screening Test
- Gas Equipment amp Software Requirements
- Preparing a Membrane Sample for Testing
- Test Protocol for Samples under the DOE Program
- Environmental Control of MembraneGas Supply Operation
- System Pressure Regulation
- Data Acquisition and Analysis
- Contact Information
-
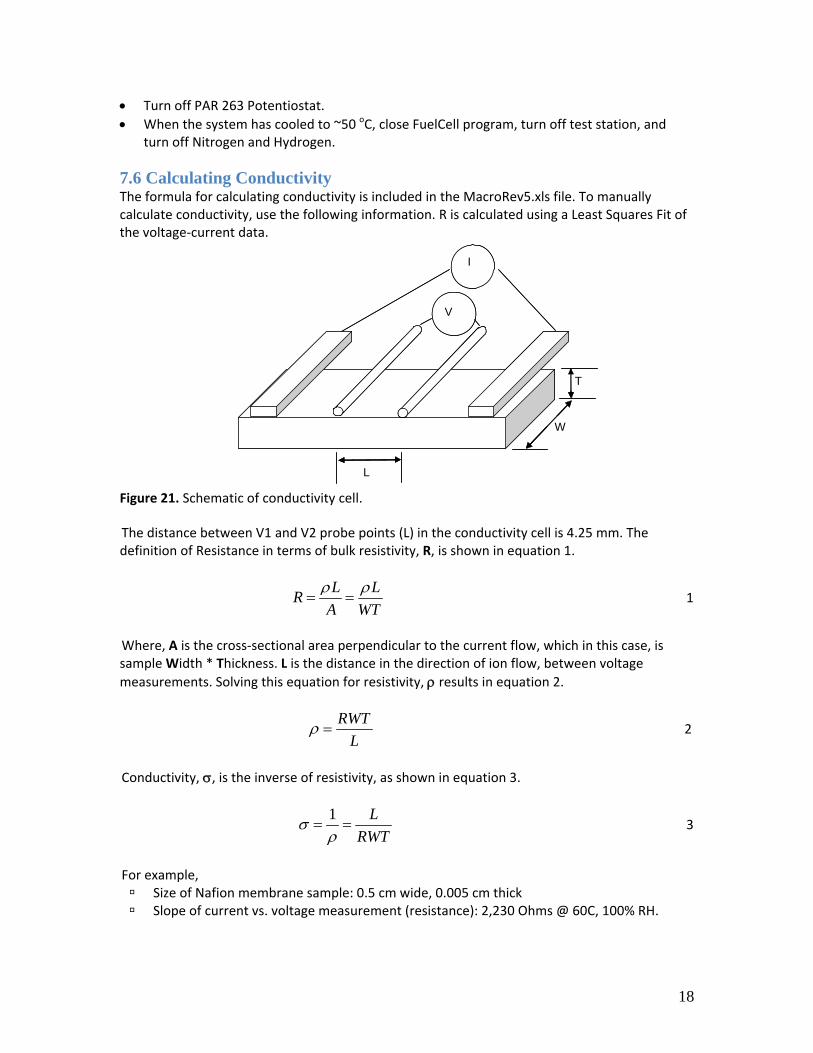