problems and performance of agro … of agro-based industries category-wise agro-based industries in...
TRANSCRIPT
IOSR Journal of Economics and Finance (IOSR-JEF)
e-ISSN: 2321-5933, p-ISSN: 2321-5925.Volume 2, Issue 4 (Jan. 2014), PP 15-25
www.iosrjournals.org
www.iosrjournals.org 15 | Page
Performance of Agro-Based Industries in India: A Critical
Analysis
*C.Lakshmi kantha reddy, **Prof S.Rathna kumari, Research Scholar,S.V.University, Tirupathi-
dept of Economics, S.V. University, Tirupathi-517502 A.P.
I. Introduction
Agriculture has been a way of life and continues to be the single most important livelihood of the
masses. Agricultural policy focus in India across decades has been on self-sufficiency and self-reliance in food
grains production. Considerable progress has been made on this front. Food grains production rose from 52
million tonnes in 1951-52 to 244.78 million tonnes in 2010-11. The share of agriculture in real GDP has fallen
given its lower growth rate relative to industry and services. However, what is of concern is that growth in the
agricultural sector has quite often fallen short of the Plan targets. During the period 1960-61 to 2010-11, food
grains production grew at a compounded annual growth rate (CAGR) of around 2 per cent. In fact, the Ninth and
Tenth Five Year Plans witnessed agricultural sectoral growth rate of 2.44 per cent and 2.30 per cent respectively
compared to 4.72 per cent during Eighth Five Year Plan. During the current Five Year plan, agriculture growth
is estimated at 3.28 per cent against a target of 4 per cent. The Approach Paper to the Twelfth Five Year Plan
emphasizes the need to “redouble our efforts to ensure that 4.0 per cent average growth” is achieved during the
Plan if not more. Without incremental productivity gains and technology diffusion across regions, achieving this
higher growth may not be feasible and has implications for the macroeconomic stability given the rising demand
of the 1.2 billion people for food. Achieving minimum agricultural growth is a pre-requisite for inclusive
growth, reduction of poverty levels, development of the rural economy and enhancing of farm incomes.
Agriculture including allied activities, accounted for 14.5 per cent of gross domestic product (GDP) at 2004-05
prices, in 2010-11 as compared to 14.7 per cent in 2009-10. Notwithstanding the declining trend in agriculture‟s
share in the GDP, it is critical from the income distribution perspective as it accounted for about 58 per cent
employment in the country according to Census 2001. Hence growth in agriculture and allied sectors remains a
„necessary condition‟ for inclusive growth. In terms of composition, out of the total share of 14.5 per cent that
agriculture and allied sectors had in GDP in 2010-11, agriculture alone accounted for 12.3 per cent, followed by
forestry and logging at 1.4 percent and fishing at 0.7 per cent . Reasonable growth in agriculture is important
both from the nutritional point of view as well as to control food prices and overall headline inflation.
The place of the agro-based industries in the development of India is widely recognized and needs no
emphasis. They can provide vast employment opportunities at comparatively low investment. The techniques of
production adopted by the agro-based industries are simple and the machinery and equipment required by them
is easily available.
The share of all agro-based industries in India account for 35.3 per cent of the total industrial units in
India 40.32 per cent share of total employment and 21.69 of the total value of industrial output, and 15.18 per
cent of the net value added during the year 2010-11. The percentage of working capital, fixed capital and net
income of agro-based industries to total industries is 21.26 per cent, 20.3 per cent and 13.96 per cent
respectively.
II. Performance Of Agro-Based Industries Category-wise Agro-Based Industries in India
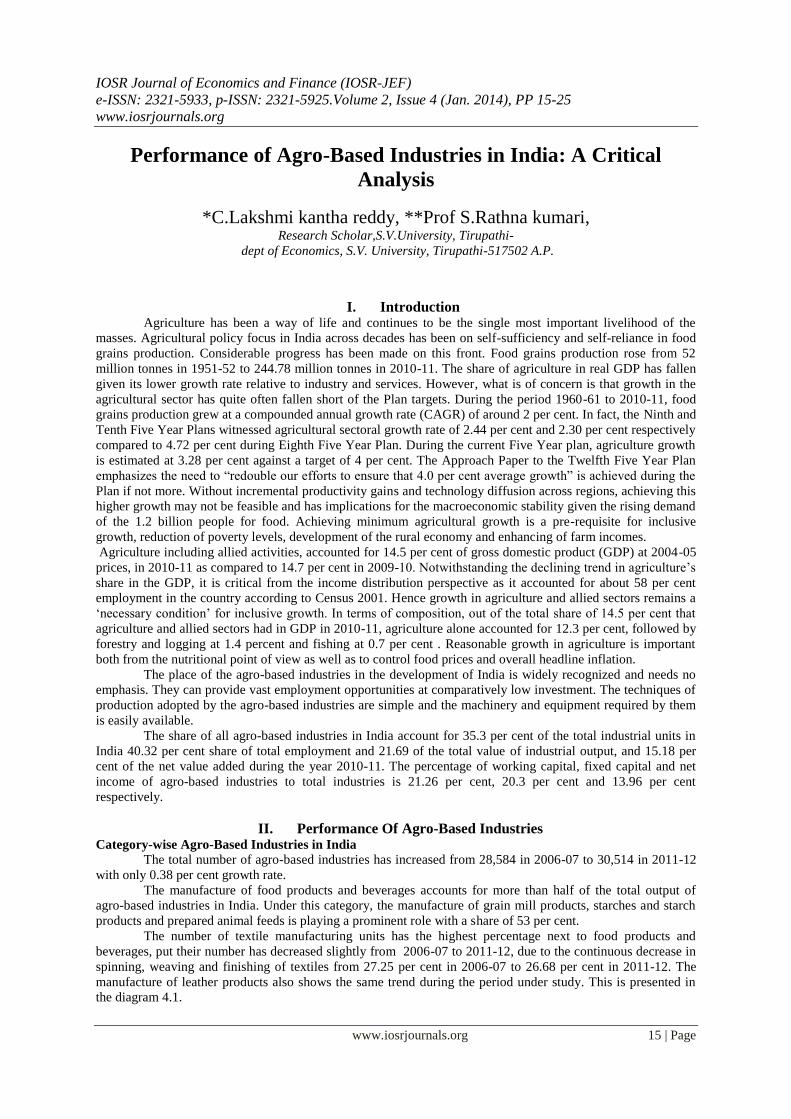
The total number of agro-based industries has increased from 28,584 in 2006-07 to 30,514 in 2011-12
with only 0.38 per cent growth rate.
The manufacture of food products and beverages accounts for more than half of the total output of
agro-based industries in India. Under this category, the manufacture of grain mill products, starches and starch
products and prepared animal feeds is playing a prominent role with a share of 53 per cent.
The number of textile manufacturing units has the highest percentage next to food products and
beverages, put their number has decreased slightly from 2006-07 to 2011-12, due to the continuous decrease in
spinning, weaving and finishing of textiles from 27.25 per cent in 2006-07 to 26.68 per cent in 2011-12. The
manufacture of leather products also shows the same trend during the period under study. This is presented in
the diagram 4.1.
Performance Of Agro-Based Industries In India: A Critical Analysis
www.iosrjournals.org 16 | Page
In the case of manufacture of food products and beverages, the Compound Growth Rate (CGR) is 5.10
per cent for both beverages, and dairy products and it is 0.48 per cent only for manufacture of other food
products category.
The CGR is computed for the different categories of agro-based industries, which are significant at 5
per cent level, except 3(c) i.e. manufacture of knitted and crocheted fabrics and articles
CATEGORY-WISE AGRO-BASED INDUSTRIES IN INDIA S
.
N
Category
2006-07
2007-08
2008-09
2009-10
2010-11
2011-12 CGR t-Stat
1 Manufacture of food
products & Beverages
25,584
(52.59)
24,238
(51.56)
28,547
(53.29)
28,654
(52.40)
29,874
(52.21)
30,510
(51.86) 2.19 48.52*
a) Production,
Processing & Preservation of Meat,
Fish, Fruit, Oil & Fats
3,951 4,012 4,258 4,426 4,897 5,019 1.40 14.12*
b) Manufacture of Dairy
Products 758 795
851
924
874
963 5.10 31.00*
c) Manufacture of Grain
Mill Products, Starches
& Starch Products and Prepared Animal Feeds
12,852
12,985
12,987
13,520
13,285
14,021
2.30 47.29*
d) Manufacture of Other
Food Products 5,874 5,044
5,921
6,012
6,623
7,215 0.48 25.36*
e) Manufacture of
Beverages 2149 1402 4530 3772 4195 3292 4.19 14.87*
2 Manufacture of
Tobacco products
2,952
(6.06)
2,541
(5.40)
3845
(7.17)
3785
(6.92)
4,136
(7.22)
4,157
(7.06) 5.76 5.59*
3 Manufacture of
Textiles
13,502
(27.25)
13,852
(29.47)
14,251
(26.60)
14,988
(27.40)
15,654
(27.36)
15,698
(26.68) 0.31 55.56*
a) Spinning , Weaving &
Finishing Textiles 9,855 9,962 10,542 10,854 10,995 11,023 1.73 41.47*
b) Manufacture of Other
Textiles 1,110 1,230 1,452 1,362 1,487 1,464 5.85 2.80*
c) Manufacture of
Knitted and Crocheted
Fabrics and Articles
2,537 2,660 2,257 2,772 3,172 3,211 5.4 0.421*
4 Manufacture of
Leather Products
2,654
(5.45)
2,842
(6.04)
2,956
(5.51)
3,241
(5.92)
3,420
(5.97)
3,896
(6.62) 3.72 3.14*
a) Manufacture of hats and caps from
waterproof
1,522 1,634 1,752 1,960 2,101 2,055 2.41 32.52*
b) Manufacture of
wearing apparel of leather and substitutes of
leather
1,132 1,208 1,204 1,281 1,319 1,841 4.75 4.15*
5 Manufacture of Paper
& Paper Products
3954
(8.12)
3529
(7.50)
3966
(7.40)
4013
(7.33)
4124
(7.20)
4568
(7.76) 2.49 22.28*
Total 48,646
(100.00)
47,002
(100.00)
53,565
(100.00)
54,681
(100.00)
57,208
(100.00)
58,829
(100.00) 1.55 71.57*
(Table value = 2.306)* Significant at 5 per cent level@ Not significant at 5 per cent level
Note : Percentages in parentheses 2. www.indiastat.com
Source: 1. Annual Survey of Industries, Central Statistical Organisation, New Delhi. (Different issues)
CATEGORY-WISE AGRO-BASED INDUSTRIES IN INDIA
(Number of Units)
Source: 1. Annual Survey of Industries, Central Statistical Organisation, New Delhi. (Different issues).
2. www.indiastat.com
Performance Of Agro-Based Industries In India: A Critical Analysis
www.iosrjournals.org 17 | Page
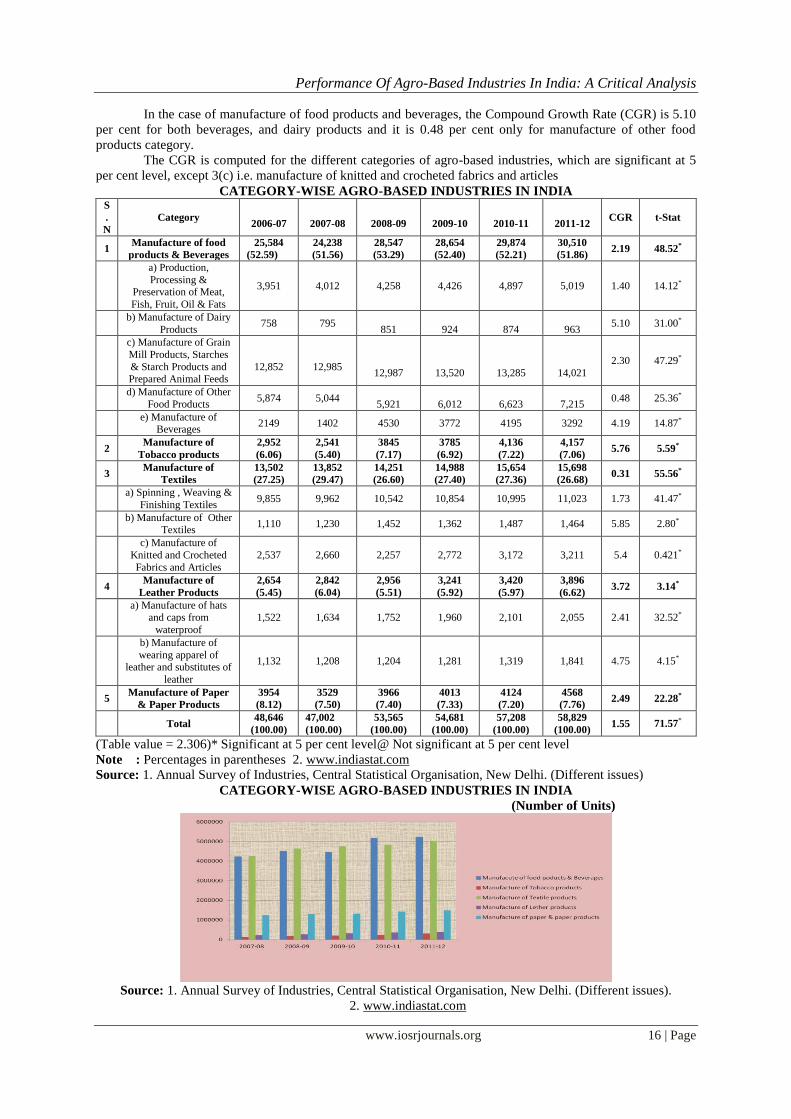
Category wise Fixed Capital of Agro-Based Industries
Fixed capital refers to any kind of real or physical capital (fixed asset) that is not used up in the
production of a product. Fixed capital is that portion of the total capital which is invested in fixed assets (such as
land, buildings, vehicles and equipment) which stay in the business almost permanently.
The fixed capital of total agro-based industries has increased by
15.29 per cent from Rs.60,00,682 lakhs in 2007-08 to Rs.77,13,367 lakhs in 2011-12.
The fixed capital was the highest in the case of manufacture of textile industry during the period 2007-
08 to 2011-12 compared to other categories of agro-based industries, but its share has been decreasing from
42.25 per cent to 40.42 per cent. The manufacture of food products and beverages is occupying second place in
fixed capital investment and its share in total agro-based industries is almost the same i.e., 42 per cent during the
period under study except 2007-08. The share of fixed capital in the case of tobacco products is the lowest in all
the years of the study. The same is shown in diagram 1.2.
The Compound Growth Rate (CGR) is calculated for all the categories of agro-based industries based
on the data available in Table 4.2. The CGR is the highest in manufacture of food products and beverages and
the lowest in the manufacture of leather products, but compound growth rate of all the categories of agro-based
industries is significant at 1 per cent level
CATEGORY–WISE FIXED CAPITAL OF AGRO-BASED INDUSTRIES
IN INDIA (Rs. in Lakhs) Sl
No
.
Category 2007-08 2008-09 2009-10 2010-11
2011-12 CGR t-Stat
1 Manufacture of food
products & Beverages
42,32,654
(41.91)
45,21,874
(41.47)
44,64,852
(40.37)
51,84,645
(43.01)
52,32,874
(42.04) 4.27 21.65*
a) Production, Processing
& Preservation of Meat, Fish, Fruit, Oil & Fats
7,23,987 7,98,745 8,25,321 9,64,951
9,36,254
5.24 17.86*
b) Manufacture of Dairy
Products 2,64,845 2,98,632 3,52,413 3,69,699
4,25,320 3.54 36.54*
c) Manufacture of Grain
Mill Products, Starches &
Starch Products and
Prepared Animal Feeds
4,65,213 4,98,741 4,83,987 5,21,632
7,35,258
6.01 14.87*
d) Manufacture of Other
Food Products 18,32,635 18,94,201 19,13,235 19,87,987
20,64,852 4.75 22.41*
e) Manufacture of Beverages
9,45,974 10,31,555 8,89,896 13,40,376
10,71,190 8.97 16.82*
2 Manufacture of Tobacco
products
1,21,541
(1.20)
1,85,029
(1.69)
1,98,200
(1.79)
2,44,760
(2.03)
3,02,494
(2.43)
2.35 30.64*
3 Manufacture of Textiles 42,66,982
(42.25)
46,32,589
(42.28)
47,52,221
(42.97)
48,35,552
(40.12)
50,31,667
(40.42)
1.39 33.87*
a) Spinning , Weaving & Finishing Textiles
36,98,554 39,56,412 41,25,987 42,56,325
42,98,758 0.24 36.54*
b) Manufacture of Other
Textiles 3,55,326 3,69,698 3,12,325 3,56,921
4,98,696 10.98 12.37*
c) Manufacture of Knitted
and Crocheted Fabrics and
Articles
2,13,102 3,06,479 3,13,909 2,22,306
2,34,213 15.24 7.54*
4 Manufacture of Leather
Products
2,32,332
(2.31)
2,65,445
(2.43)
3,23,023
(2.92)
3,65,002
(3.02)
3,90,805
(3.14)
0.71 55.77*
a) Manufacture of hats and
caps from waterproof 87,668 88,231 89,230 95,325
95,236 6.03 20.38*
b) Manufacture of wearing
apparel of leather and substitutes of leather
1,44,664 1,77,214 2,33,793 2,69,677 2,95,569 2.45 26.58*
5 Manufacture of Paper &
Paper Products
12,44,501
(12.32)
12,98,236
(11.90)
13,21,003
(11.94)
14,22,554
(11.80)
14,88,235
(11.95)
2.33 22.88*
Total 1,00,98,010
(100.00)
1,09,03,173
(100.00)
1,10,59,299
(100.00)
1,20,52,513
(100.00)
1,24,46,075
(100.00)
4.21 33.49*
Note : Percentages in parentheses (Table „t‟ value = 2.145) * Significant at 1 per cent level
Source: 1. Annual Survey of Industries, Central Statistical Organisation, New Delhi. (Different issues).
2. www.indiastat.com
Performance Of Agro-Based Industries In India: A Critical Analysis
www.iosrjournals.org 18 | Page
CATEGORY–WISE FIXED CAPITAL OF AGRO-BASED INDUSTRIES IN INDIA
(Rs. in Lakhs)
Source: 1. Annual Survey of Industries, Central Statistical Organisation, New Delhi. (Different issues).
2. www.indiastat.com
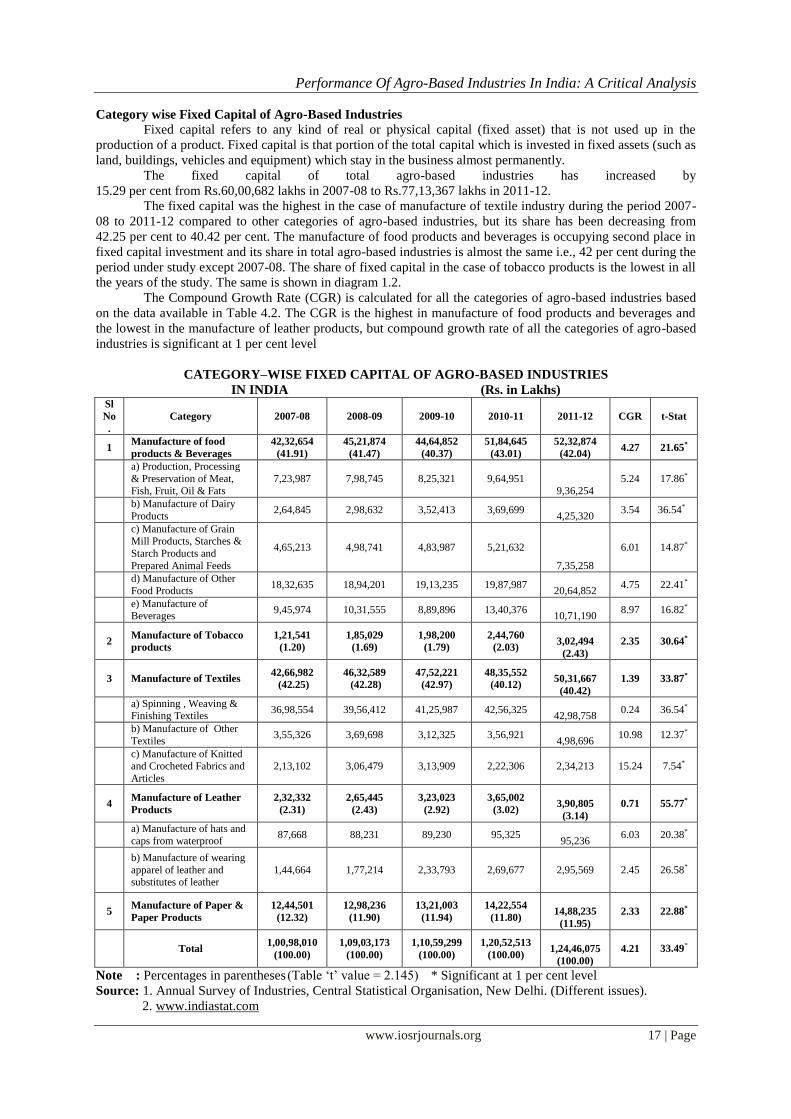
Category-wise Working Capital of Agro-Based Industries
Working Capital measures both a company's efficiency and its short-term financial health. The working
capital ratio is calculated as: Working Capital = Current Assets – Current Liabilities
Positive working capital means that the company is able to pay off its short-term
liabilities. Negative working capital means that a company currently is unable to meet its short-term liabilities
with its current assets (cash, accounts receivable and inventory). This is also known as "net working capital".
Over a period of five years, from 2000-01 to 2004-05, the working capital of total agro-based industries
has increased from Rs. 24,02,002 lakhs to Rs. 34,03,200 lakhs with the growth of 41.68 per cent. Like fixed
capital, the working capital investment is the highest in the case of manufacture of food products and beverages
in all the five years.
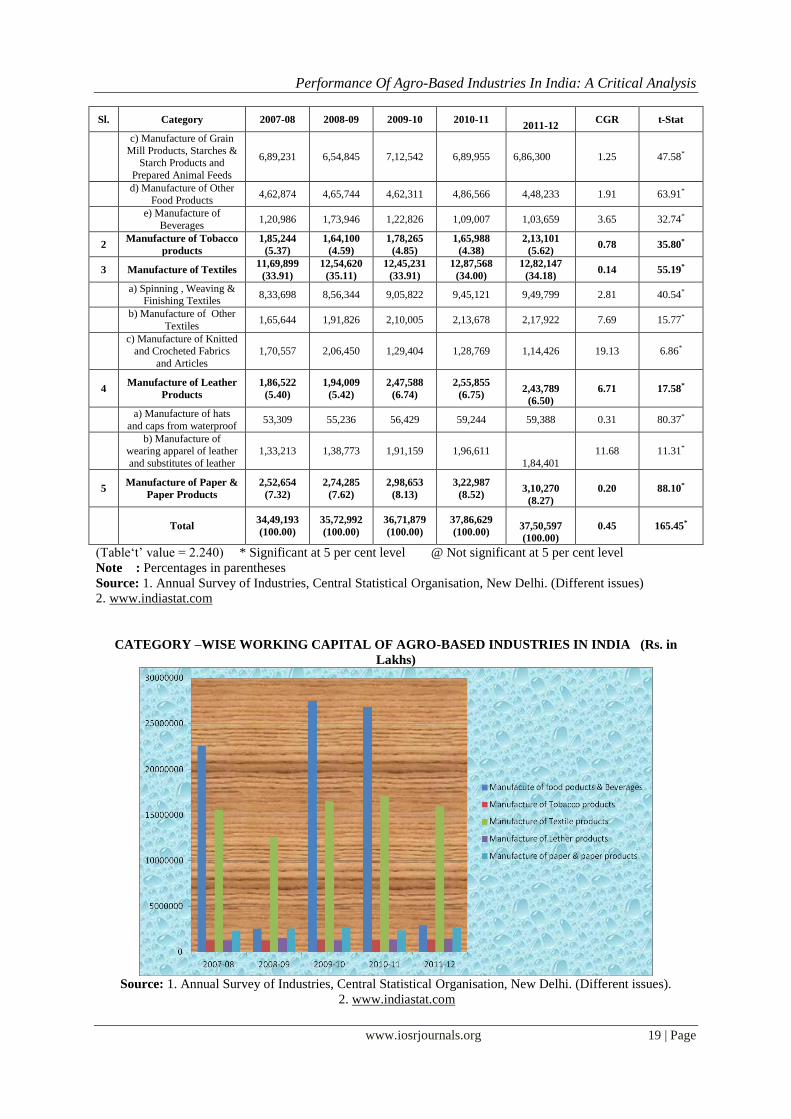
The manufacture of textiles is occupying second place in working capital position and its share has
been increasing from 33.91 per cent in 2007-08 to 33.41percent in 2010-11. Under the textile category,
spinning, weaving, and finishing of textiles need more working capital compared to others. The category-wise
working capital is shown in diagram 4.3.
The working capital position of tobacco products has gradually decreased from 5.37 per cent to 5.62
per cent and its share is the least in total agro-based industries. As per the Compound Growth Rate and t-
statistic, all the categories of agro-based industries significant at 5 per cent level except manufacture of tobacco
products
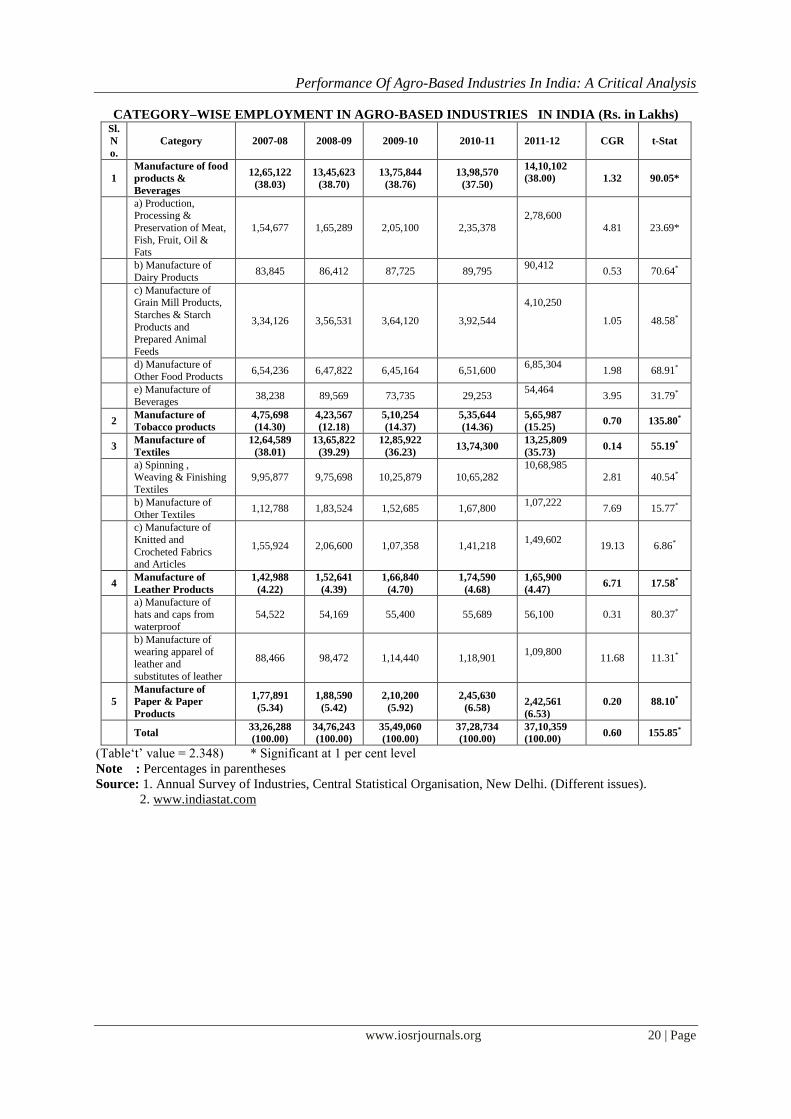
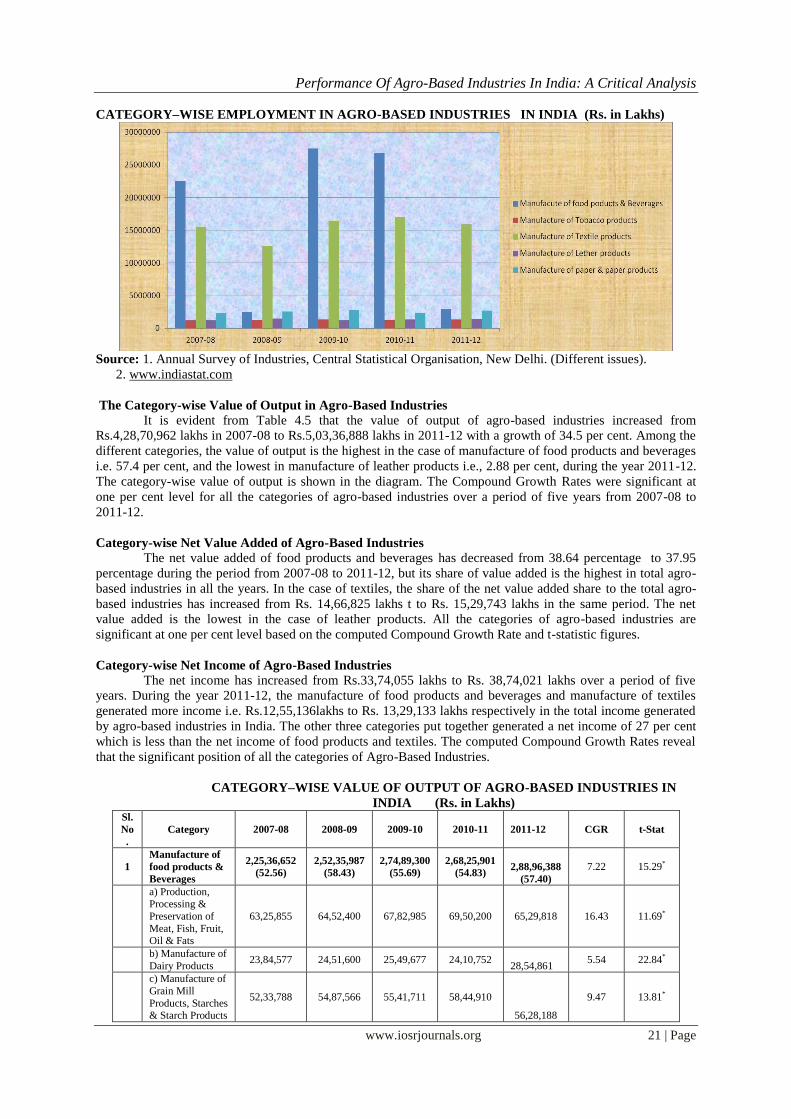
Category-wise Employment in Agro-Based Industries
Agro-based industries were providing employment to 12,65,122 persons in 2007-08 and it increased to
14,10,102 persons in 2011-12. It is observed from the Table 4.4 that among the different categories of agro-
based industries, the manufacture of food products and beverages is providing the highest share of employment
i.e. 38 per cent. The manufacture of textiles stood second by providing employment to the different persons
(34.18 per cent). Compound Growth Rates are calculated for all the agro-based industries, which are significant
at one per cent level. The employment levels are presented
CATEGORY –WISE WORKING CAPITAL OF AGRO-BASED INDUSTRIES IN INDIA (Rs. in
Lakhs)
Sl. Category 2007-08 2008-09 2009-10 2010-11
2011-12 CGR t-Stat
1 Manufacture of food
products & Beverages
16,54,874
(47.97)
16,85,978
(47.18)
17,02,142
(46.35)
17,54,231
(46.32)
17,01,290
(45.36) 1.65 76.54*
a) Production, processing
& Preservation of Meat,
Fish, Fruit, Oil & Fats
2,89,683 2,95,789 3,05,894 3,74,100
3,64,520 4.51 22.43*
b) Manufacture of Dairy
Products 92,100 95,654 98,569 94,603
98,578
0.42 67.98*
Performance Of Agro-Based Industries In India: A Critical Analysis
www.iosrjournals.org 19 | Page
Sl. Category 2007-08 2008-09 2009-10 2010-11
2011-12 CGR t-Stat
c) Manufacture of Grain
Mill Products, Starches & Starch Products and
Prepared Animal Feeds
6,89,231 6,54,845 7,12,542 6,89,955 6,86,300 1.25 47.58*
d) Manufacture of Other
Food Products 4,62,874 4,65,744 4,62,311 4,86,566 4,48,233 1.91 63.91*
e) Manufacture of
Beverages 1,20,986 1,73,946 1,22,826 1,09,007 1,03,659 3.65 32.74*
2 Manufacture of Tobacco
products
1,85,244
(5.37)
1,64,100
(4.59)
1,78,265
(4.85)
1,65,988
(4.38)
2,13,101
(5.62) 0.78 35.80*
3 Manufacture of Textiles 11,69,899
(33.91)
12,54,620
(35.11)
12,45,231
(33.91)
12,87,568
(34.00)
12,82,147
(34.18) 0.14 55.19*
a) Spinning , Weaving &
Finishing Textiles 8,33,698 8,56,344 9,05,822 9,45,121 9,49,799 2.81 40.54*
b) Manufacture of Other
Textiles 1,65,644 1,91,826 2,10,005 2,13,678 2,17,922 7.69 15.77*
c) Manufacture of Knitted and Crocheted Fabrics
and Articles
1,70,557 2,06,450 1,29,404 1,28,769
1,14,426 19.13 6.86*
4 Manufacture of Leather
Products
1,86,522
(5.40)
1,94,009
(5.42)
2,47,588
(6.74)
2,55,855
(6.75)
2,43,789
(6.50)
6.71 17.58*
a) Manufacture of hats
and caps from waterproof 53,309 55,236 56,429 59,244 59,388 0.31 80.37*
b) Manufacture of wearing apparel of leather
and substitutes of leather
1,33,213 1,38,773 1,91,159 1,96,611
1,84,401
11.68 11.31*
5 Manufacture of Paper &
Paper Products
2,52,654
(7.32)
2,74,285
(7.62)
2,98,653
(8.13)
3,22,987
(8.52)
3,10,270
(8.27)
0.20 88.10*
Total 34,49,193
(100.00)
35,72,992
(100.00)
36,71,879
(100.00)
37,86,629
(100.00)
37,50,597
(100.00)
0.45 165.45*
(Table„t‟ value = 2.240) * Significant at 5 per cent level @ Not significant at 5 per cent level
Note : Percentages in parentheses
Source: 1. Annual Survey of Industries, Central Statistical Organisation, New Delhi. (Different issues)
2. www.indiastat.com
CATEGORY –WISE WORKING CAPITAL OF AGRO-BASED INDUSTRIES IN INDIA (Rs. in
Lakhs)
Source: 1. Annual Survey of Industries, Central Statistical Organisation, New Delhi. (Different issues).
2. www.indiastat.com
Performance Of Agro-Based Industries In India: A Critical Analysis
www.iosrjournals.org 20 | Page
CATEGORY–WISE EMPLOYMENT IN AGRO-BASED INDUSTRIES IN INDIA (Rs. in Lakhs) Sl.
N
o.
Category 2007-08 2008-09 2009-10 2010-11
2011-12 CGR t-Stat
1
Manufacture of food
products &
Beverages
12,65,122
(38.03)
13,45,623
(38.70)
13,75,844
(38.76)
13,98,570
(37.50)
14,10,102
(38.00) 1.32 90.05*
a) Production, Processing &
Preservation of Meat,
Fish, Fruit, Oil & Fats
1,54,677 1,65,289 2,05,100 2,35,378
2,78,600
4.81 23.69*
b) Manufacture of
Dairy Products 83,845 86,412 87,725 89,795
90,412 0.53 70.64*
c) Manufacture of Grain Mill Products,
Starches & Starch
Products and Prepared Animal
Feeds
3,34,126 3,56,531 3,64,120 3,92,544
4,10,250
1.05 48.58*
d) Manufacture of Other Food Products
6,54,236 6,47,822 6,45,164 6,51,600 6,85,304
1.98 68.91*
e) Manufacture of
Beverages 38,238 89,569 73,735 29,253
54,464 3.95 31.79*
2 Manufacture of
Tobacco products
4,75,698
(14.30)
4,23,567
(12.18)
5,10,254
(14.37)
5,35,644
(14.36)
5,65,987
(15.25) 0.70 135.80*
3 Manufacture of
Textiles
12,64,589
(38.01)
13,65,822
(39.29)
12,85,922
(36.23) 13,74,300
13,25,809
(35.73) 0.14 55.19*
a) Spinning , Weaving & Finishing
Textiles
9,95,877 9,75,698 10,25,879 10,65,282 10,68,985
2.81 40.54*
b) Manufacture of
Other Textiles 1,12,788 1,83,524 1,52,685 1,67,800
1,07,222 7.69 15.77*
c) Manufacture of
Knitted and
Crocheted Fabrics and Articles
1,55,924 2,06,600 1,07,358 1,41,218
1,49,602 19.13 6.86*
4 Manufacture of
Leather Products
1,42,988
(4.22)
1,52,641
(4.39)
1,66,840
(4.70)
1,74,590
(4.68)
1,65,900
(4.47) 6.71 17.58*
a) Manufacture of hats and caps from
waterproof
54,522 54,169 55,400 55,689 56,100 0.31 80.37*
b) Manufacture of wearing apparel of
leather and
substitutes of leather
88,466 98,472 1,14,440 1,18,901
1,09,800
11.68 11.31*
5
Manufacture of
Paper & Paper
Products
1,77,891
(5.34)
1,88,590
(5.42)
2,10,200
(5.92)
2,45,630
(6.58)
2,42,561
(6.53)
0.20 88.10*
Total 33,26,288
(100.00)
34,76,243
(100.00)
35,49,060
(100.00)
37,28,734
(100.00)
37,10,359
(100.00) 0.60 155.85*
(Table„t‟ value = 2.348) * Significant at 1 per cent level
Note : Percentages in parentheses
Source: 1. Annual Survey of Industries, Central Statistical Organisation, New Delhi. (Different issues).
2. www.indiastat.com
Performance Of Agro-Based Industries In India: A Critical Analysis
www.iosrjournals.org 21 | Page
CATEGORY–WISE EMPLOYMENT IN AGRO-BASED INDUSTRIES IN INDIA (Rs. in Lakhs)
Source: 1. Annual Survey of Industries, Central Statistical Organisation, New Delhi. (Different issues).
2. www.indiastat.com
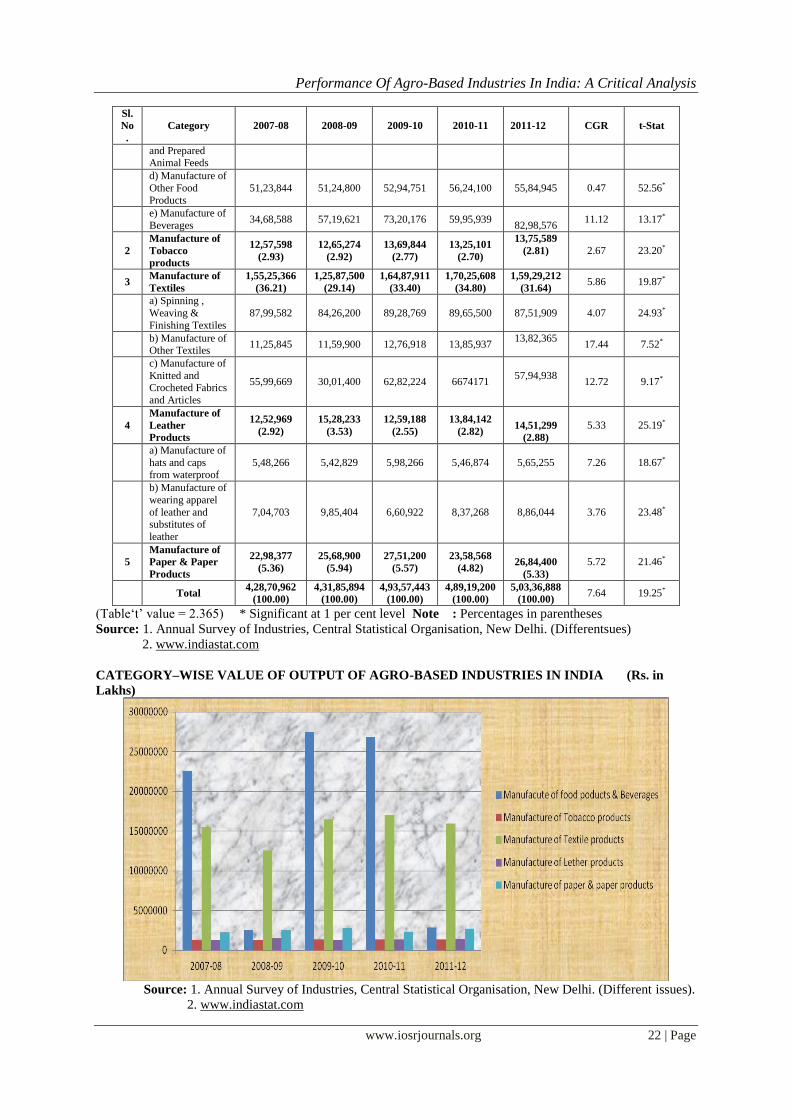
The Category-wise Value of Output in Agro-Based Industries
It is evident from Table 4.5 that the value of output of agro-based industries increased from
Rs.4,28,70,962 lakhs in 2007-08 to Rs.5,03,36,888 lakhs in 2011-12 with a growth of 34.5 per cent. Among the
different categories, the value of output is the highest in the case of manufacture of food products and beverages
i.e. 57.4 per cent, and the lowest in manufacture of leather products i.e., 2.88 per cent, during the year 2011-12.
The category-wise value of output is shown in the diagram. The Compound Growth Rates were significant at
one per cent level for all the categories of agro-based industries over a period of five years from 2007-08 to
2011-12.
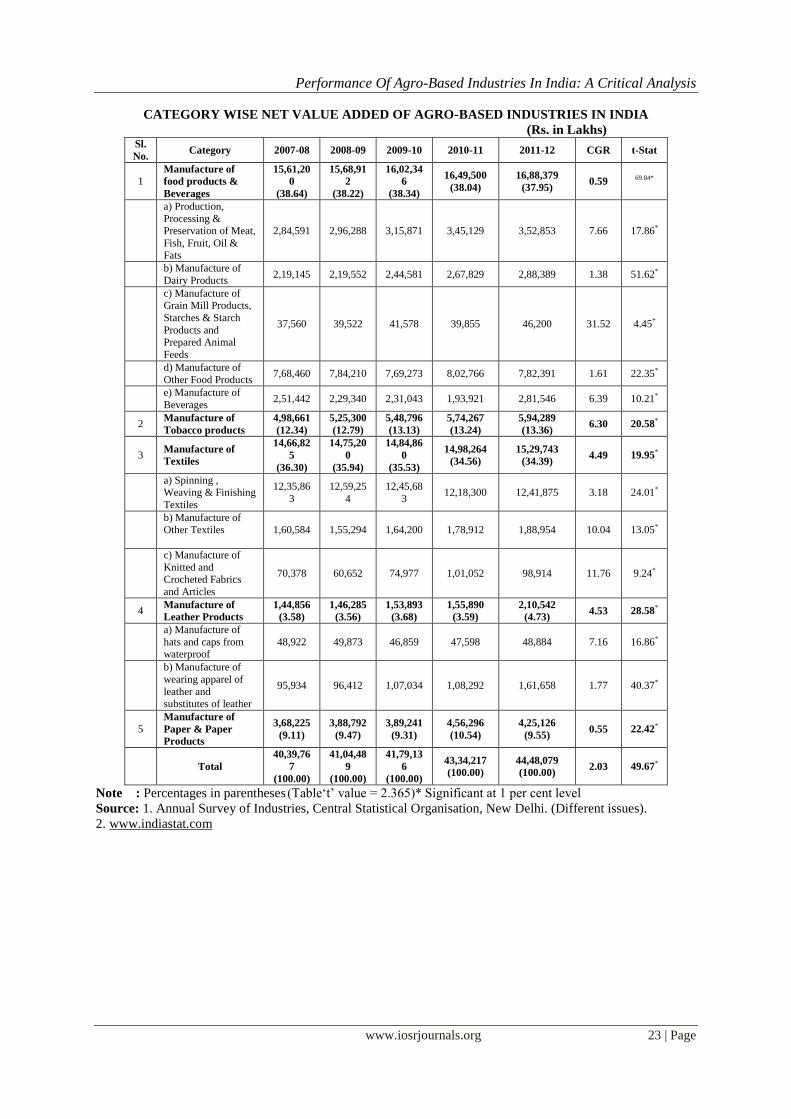
Category-wise Net Value Added of Agro-Based Industries The net value added of food products and beverages has decreased from 38.64 percentage to 37.95
percentage during the period from 2007-08 to 2011-12, but its share of value added is the highest in total agro-
based industries in all the years. In the case of textiles, the share of the net value added share to the total agro-
based industries has increased from Rs. 14,66,825 lakhs t to Rs. 15,29,743 lakhs in the same period. The net
value added is the lowest in the case of leather products. All the categories of agro-based industries are
significant at one per cent level based on the computed Compound Growth Rate and t-statistic figures.
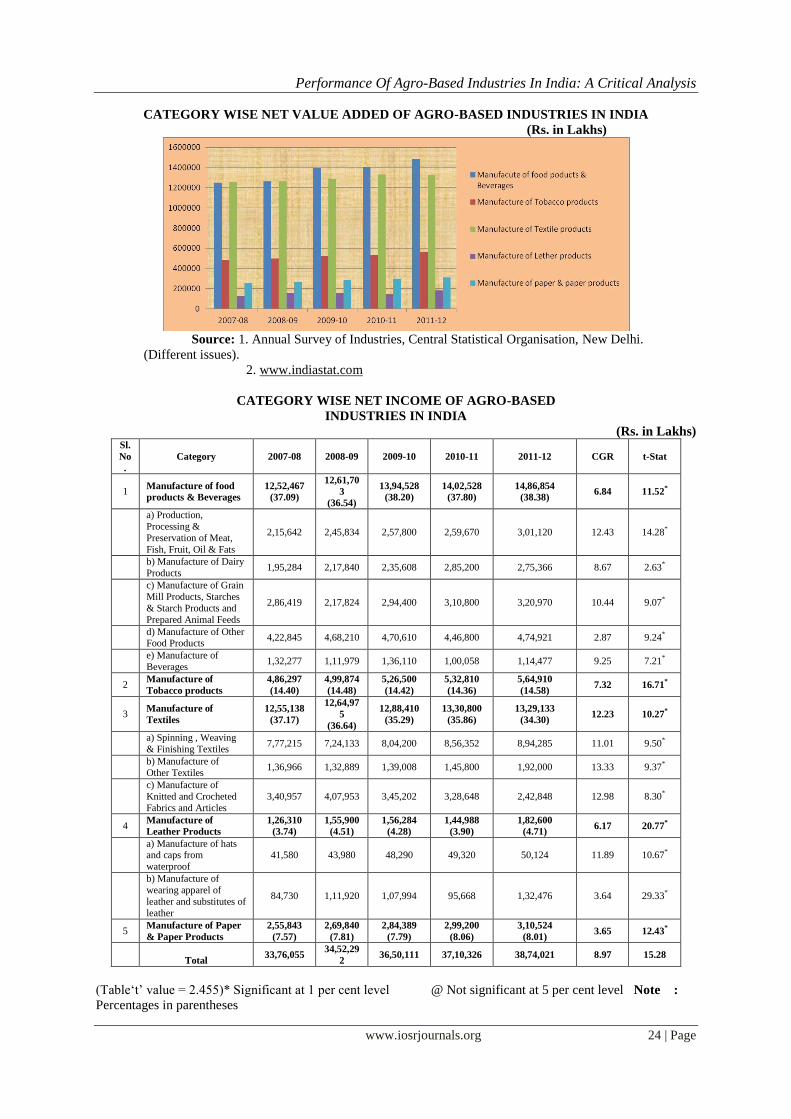
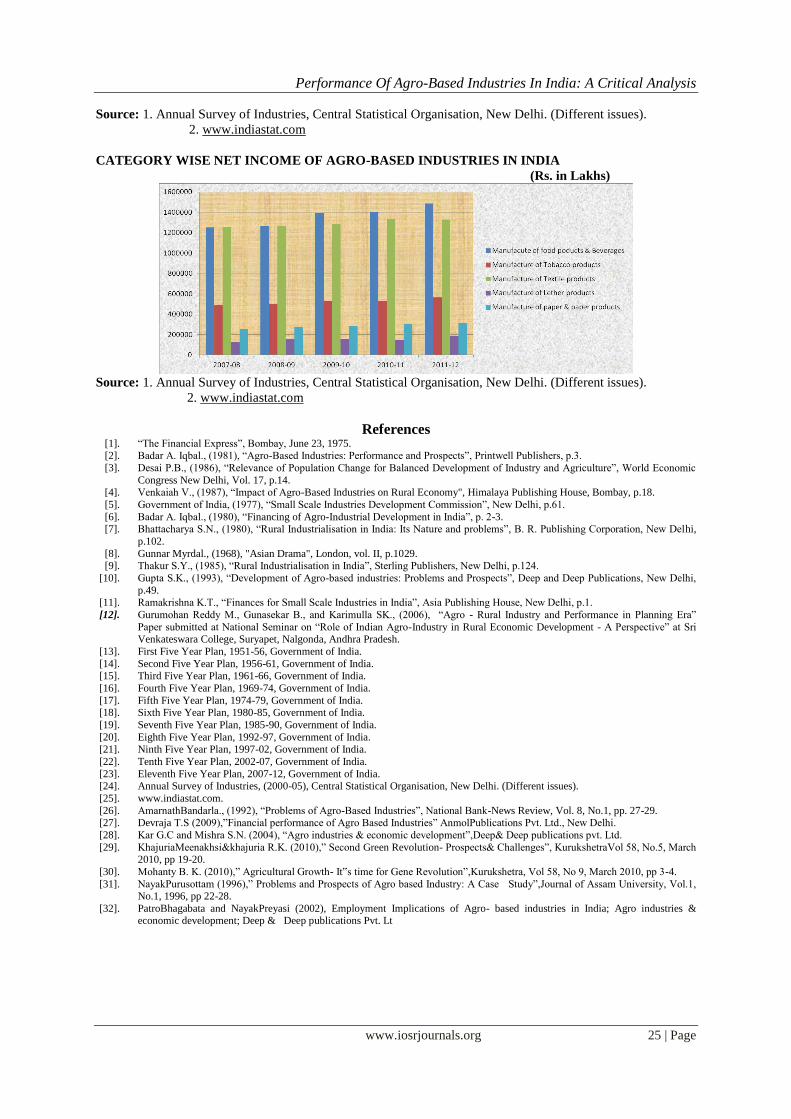
Category-wise Net Income of Agro-Based Industries The net income has increased from Rs.33,74,055 lakhs to Rs. 38,74,021 lakhs over a period of five
years. During the year 2011-12, the manufacture of food products and beverages and manufacture of textiles
generated more income i.e. Rs.12,55,136lakhs to Rs. 13,29,133 lakhs respectively in the total income generated
by agro-based industries in India. The other three categories put together generated a net income of 27 per cent
which is less than the net income of food products and textiles. The computed Compound Growth Rates reveal
that the significant position of all the categories of Agro-Based Industries.
CATEGORY–WISE VALUE OF OUTPUT OF AGRO-BASED INDUSTRIES IN
INDIA (Rs. in Lakhs) Sl.
No
.
Category 2007-08 2008-09 2009-10 2010-11
2011-12 CGR t-Stat
1
Manufacture of
food products &
Beverages
2,25,36,652
(52.56)
2,52,35,987
(58.43)
2,74,89,300
(55.69)
2,68,25,901
(54.83)
2,88,96,388
(57.40)
7.22 15.29*
a) Production, Processing &
Preservation of
Meat, Fish, Fruit, Oil & Fats
63,25,855 64,52,400 67,82,985 69,50,200
65,29,818 16.43 11.69*
b) Manufacture of
Dairy Products 23,84,577 24,51,600 25,49,677 24,10,752
28,54,861 5.54 22.84*
c) Manufacture of
Grain Mill
Products, Starches & Starch Products
52,33,788 54,87,566 55,41,711 58,44,910
56,28,188
9.47 13.81*
Performance Of Agro-Based Industries In India: A Critical Analysis
www.iosrjournals.org 22 | Page
Sl.
No
.
Category 2007-08 2008-09 2009-10 2010-11
2011-12 CGR t-Stat
and Prepared Animal Feeds
d) Manufacture of
Other Food
Products
51,23,844 51,24,800 52,94,751 56,24,100
55,84,945 0.47 52.56*
e) Manufacture of
Beverages 34,68,588 57,19,621 73,20,176 59,95,939
82,98,576 11.12 13.17*
2
Manufacture of
Tobacco
products
12,57,598
(2.93)
12,65,274
(2.92)
13,69,844
(2.77)
13,25,101
(2.70)
13,75,589
(2.81) 2.67 23.20*
3 Manufacture of
Textiles
1,55,25,366
(36.21)
1,25,87,500
(29.14)
1,64,87,911
(33.40)
1,70,25,608
(34.80)
1,59,29,212
(31.64) 5.86 19.87*
a) Spinning ,
Weaving &
Finishing Textiles
87,99,582 84,26,200 89,28,769 89,65,500
87,51,909 4.07 24.93*
b) Manufacture of Other Textiles
11,25,845 11,59,900 12,76,918 13,85,937 13,82,365
17.44 7.52*
c) Manufacture of
Knitted and Crocheted Fabrics
and Articles
55,99,669 30,01,400 62,82,224 6674171
57,94,938 12.72 9.17*
4
Manufacture of
Leather
Products
12,52,969
(2.92)
15,28,233
(3.53)
12,59,188
(2.55)
13,84,142
(2.82)
14,51,299
(2.88)
5.33 25.19*
a) Manufacture of
hats and caps from waterproof
5,48,266 5,42,829 5,98,266 5,46,874
5,65,255 7.26 18.67*
b) Manufacture of
wearing apparel
of leather and substitutes of
leather
7,04,703 9,85,404 6,60,922 8,37,268
8,86,044 3.76 23.48*
5
Manufacture of
Paper & Paper
Products
22,98,377
(5.36)
25,68,900
(5.94)
27,51,200
(5.57)
23,58,568
(4.82)
26,84,400
(5.33)
5.72 21.46*
Total 4,28,70,962
(100.00)
4,31,85,894
(100.00)
4,93,57,443
(100.00)
4,89,19,200
(100.00)
5,03,36,888
(100.00) 7.64 19.25*
(Table„t‟ value = 2.365) * Significant at 1 per cent level Note : Percentages in parentheses
Source: 1. Annual Survey of Industries, Central Statistical Organisation, New Delhi. (Differentsues)
2. www.indiastat.com
CATEGORY–WISE VALUE OF OUTPUT OF AGRO-BASED INDUSTRIES IN INDIA (Rs. in
Lakhs)
Source: 1. Annual Survey of Industries, Central Statistical Organisation, New Delhi. (Different issues).
2. www.indiastat.com
Performance Of Agro-Based Industries In India: A Critical Analysis
www.iosrjournals.org 23 | Page
CATEGORY WISE NET VALUE ADDED OF AGRO-BASED INDUSTRIES IN INDIA
(Rs. in Lakhs) Sl.
No. Category 2007-08 2008-09 2009-10 2010-11 2011-12 CGR t-Stat
1 Manufacture of
food products &
Beverages
15,61,20
0
(38.64)
15,68,91
2
(38.22)
16,02,34
6
(38.34)
16,49,500
(38.04)
16,88,379
(37.95) 0.59
69.84*
a) Production,
Processing & Preservation of Meat,
Fish, Fruit, Oil & Fats
2,84,591 2,96,288 3,15,871 3,45,129 3,52,853 7.66 17.86*
b) Manufacture of
Dairy Products 2,19,145 2,19,552 2,44,581 2,67,829 2,88,389 1.38 51.62*
c) Manufacture of Grain Mill Products,
Starches & Starch
Products and Prepared Animal
Feeds
37,560 39,522 41,578 39,855 46,200 31.52 4.45*
d) Manufacture of
Other Food Products 7,68,460 7,84,210 7,69,273 8,02,766 7,82,391 1.61 22.35*
e) Manufacture of
Beverages 2,51,442 2,29,340 2,31,043 1,93,921 2,81,546 6.39 10.21*
2 Manufacture of
Tobacco products
4,98,661
(12.34)
5,25,300
(12.79)
5,48,796
(13.13)
5,74,267
(13.24)
5,94,289
(13.36) 6.30 20.58*
3 Manufacture of
Textiles
14,66,82
5
(36.30)
14,75,20
0
(35.94)
14,84,86
0
(35.53)
14,98,264
(34.56)
15,29,743
(34.39) 4.49 19.95*
a) Spinning , Weaving & Finishing
Textiles
12,35,86
3
12,59,25
4
12,45,68
3 12,18,300 12,41,875 3.18 24.01*
b) Manufacture of Other Textiles
1,60,584 1,55,294 1,64,200 1,78,912 1,88,954 10.04 13.05*
c) Manufacture of
Knitted and Crocheted Fabrics
and Articles
70,378 60,652 74,977 1,01,052 98,914 11.76 9.24*
4 Manufacture of
Leather Products
1,44,856
(3.58)
1,46,285
(3.56)
1,53,893
(3.68)
1,55,890
(3.59)
2,10,542
(4.73) 4.53 28.58*
a) Manufacture of
hats and caps from waterproof
48,922 49,873 46,859 47,598 48,884 7.16 16.86*
b) Manufacture of
wearing apparel of
leather and substitutes of leather
95,934 96,412 1,07,034 1,08,292 1,61,658 1.77 40.37*
5 Manufacture of
Paper & Paper
Products
3,68,225
(9.11)
3,88,792
(9.47)
3,89,241
(9.31)
4,56,296
(10.54)
4,25,126
(9.55) 0.55 22.42*
Total
40,39,76
7
(100.00)
41,04,48
9
(100.00)
41,79,13
6
(100.00)
43,34,217
(100.00)
44,48,079
(100.00) 2.03 49.67*
Note : Percentages in parentheses (Table„t‟ value = 2.365)* Significant at 1 per cent level
Source: 1. Annual Survey of Industries, Central Statistical Organisation, New Delhi. (Different issues).
2. www.indiastat.com
Performance Of Agro-Based Industries In India: A Critical Analysis
www.iosrjournals.org 24 | Page
CATEGORY WISE NET VALUE ADDED OF AGRO-BASED INDUSTRIES IN INDIA
(Rs. in Lakhs)
Source: 1. Annual Survey of Industries, Central Statistical Organisation, New Delhi.
(Different issues).
2. www.indiastat.com
CATEGORY WISE NET INCOME OF AGRO-BASED
INDUSTRIES IN INDIA
(Rs. in Lakhs) Sl.
No
.
Category 2007-08 2008-09 2009-10 2010-11 2011-12 CGR t-Stat
1 Manufacture of food
products & Beverages
12,52,467
(37.09)
12,61,70
3
(36.54)
13,94,528
(38.20)
14,02,528
(37.80)
14,86,854
(38.38) 6.84 11.52
*
a) Production,
Processing &
Preservation of Meat,
Fish, Fruit, Oil & Fats
2,15,642 2,45,834 2,57,800 2,59,670 3,01,120 12.43 14.28*
b) Manufacture of Dairy
Products 1,95,284 2,17,840 2,35,608 2,85,200 2,75,366 8.67 2.63
*
c) Manufacture of Grain
Mill Products, Starches
& Starch Products and
Prepared Animal Feeds
2,86,419 2,17,824 2,94,400 3,10,800 3,20,970 10.44 9.07*
d) Manufacture of Other Food Products
4,22,845 4,68,210 4,70,610 4,46,800 4,74,921 2.87 9.24*
e) Manufacture of
Beverages 1,32,277 1,11,979 1,36,110 1,00,058 1,14,477 9.25 7.21
*
2 Manufacture of
Tobacco products
4,86,297
(14.40)
4,99,874
(14.48)
5,26,500
(14.42)
5,32,810
(14.36)
5,64,910
(14.58) 7.32 16.71
*
3 Manufacture of
Textiles
12,55,138
(37.17)
12,64,97
5
(36.64)
12,88,410
(35.29)
13,30,800
(35.86)
13,29,133
(34.30) 12.23 10.27
*
a) Spinning , Weaving
& Finishing Textiles 7,77,215 7,24,133 8,04,200 8,56,352 8,94,285 11.01 9.50
*
b) Manufacture of
Other Textiles 1,36,966 1,32,889 1,39,008 1,45,800 1,92,000 13.33 9.37
*
c) Manufacture of
Knitted and Crocheted
Fabrics and Articles
3,40,957 4,07,953 3,45,202 3,28,648 2,42,848 12.98 8.30*
4 Manufacture of
Leather Products
1,26,310
(3.74)
1,55,900
(4.51)
1,56,284
(4.28)
1,44,988
(3.90)
1,82,600
(4.71) 6.17 20.77
*
a) Manufacture of hats and caps from
waterproof
41,580 43,980 48,290 49,320 50,124 11.89 10.67*
b) Manufacture of
wearing apparel of
leather and substitutes of
leather
84,730 1,11,920 1,07,994 95,668 1,32,476 3.64 29.33*
5 Manufacture of Paper
& Paper Products
2,55,843
(7.57)
2,69,840
(7.81)
2,84,389
(7.79)
2,99,200
(8.06)
3,10,524
(8.01) 3.65 12.43
*
Total 33,76,055
34,52,29
2 36,50,111 37,10,326 38,74,021 8.97 15.28
(Table„t‟ value = 2.455)* Significant at 1 per cent level @ Not significant at 5 per cent level Note :
Percentages in parentheses
Performance Of Agro-Based Industries In India: A Critical Analysis
www.iosrjournals.org 25 | Page
Source: 1. Annual Survey of Industries, Central Statistical Organisation, New Delhi. (Different issues).
2. www.indiastat.com
CATEGORY WISE NET INCOME OF AGRO-BASED INDUSTRIES IN INDIA
(Rs. in Lakhs)
Source: 1. Annual Survey of Industries, Central Statistical Organisation, New Delhi. (Different issues).
2. www.indiastat.com
References [1]. “The Financial Express”, Bombay, June 23, 1975. [2]. Badar A. Iqbal., (1981), “Agro-Based Industries: Performance and Prospects”, Printwell Publishers, p.3.
[3]. Desai P.B., (1986), “Relevance of Population Change for Balanced Development of Industry and Agriculture”, World Economic
Congress New Delhi, Vol. 17, p.14. [4]. Venkaiah V., (1987), “Impact of Agro-Based Industries on Rural Economy", Himalaya Publishing House, Bombay, p.18.
[5]. Government of India, (1977), “Small Scale Industries Development Commission”, New Delhi, p.61.
[6]. Badar A. Iqbal., (1980), “Financing of Agro-Industrial Development in India”, p. 2-3. [7]. Bhattacharya S.N., (1980), “Rural Industrialisation in India: Its Nature and problems”, B. R. Publishing Corporation, New Delhi,
p.102.
[8]. Gunnar Myrdal., (1968), "Asian Drama", London, vol. II, p.1029. [9]. Thakur S.Y., (1985), “Rural Industrialisation in India”, Sterling Publishers, New Delhi, p.124.
[10]. Gupta S.K., (1993), “Development of Agro-based industries: Problems and Prospects”, Deep and Deep Publications, New Delhi,
p.49. [11]. Ramakrishna K.T., “Finances for Small Scale Industries in India”, Asia Publishing House, New Delhi, p.1.
[12]. Gurumohan Reddy M., Gunasekar B., and Karimulla SK., (2006), “Agro - Rural Industry and Performance in Planning Era”
Paper submitted at National Seminar on “Role of Indian Agro-Industry in Rural Economic Development - A Perspective” at Sri Venkateswara College, Suryapet, Nalgonda, Andhra Pradesh.
[13]. First Five Year Plan, 1951-56, Government of India.
[14]. Second Five Year Plan, 1956-61, Government of India. [15]. Third Five Year Plan, 1961-66, Government of India.
[16]. Fourth Five Year Plan, 1969-74, Government of India.
[17]. Fifth Five Year Plan, 1974-79, Government of India. [18]. Sixth Five Year Plan, 1980-85, Government of India.
[19]. Seventh Five Year Plan, 1985-90, Government of India.
[20]. Eighth Five Year Plan, 1992-97, Government of India. [21]. Ninth Five Year Plan, 1997-02, Government of India.
[22]. Tenth Five Year Plan, 2002-07, Government of India.
[23]. Eleventh Five Year Plan, 2007-12, Government of India. [24]. Annual Survey of Industries, (2000-05), Central Statistical Organisation, New Delhi. (Different issues).
[25]. www.indiastat.com.
[26]. AmarnathBandarla., (1992), “Problems of Agro-Based Industries”, National Bank-News Review, Vol. 8, No.1, pp. 27-29. [27]. Devraja T.S (2009),”Financial performance of Agro Based Industries” AnmolPublications Pvt. Ltd., New Delhi.
[28]. Kar G.C and Mishra S.N. (2004), “Agro industries & economic development”,Deep& Deep publications pvt. Ltd.
[29]. KhajuriaMeenakhsi&khajuria R.K. (2010),” Second Green Revolution- Prospects& Challenges”, KurukshetraVol 58, No.5, March 2010, pp 19-20.
[30]. Mohanty B. K. (2010),” Agricultural Growth- It‟s time for Gene Revolution”,Kurukshetra, Vol 58, No 9, March 2010, pp 3-4.
[31]. NayakPurusottam (1996),” Problems and Prospects of Agro based Industry: A Case Study”,Journal of Assam University, Vol.1, No.1, 1996, pp 22-28.
[32]. PatroBhagabata and NayakPreyasi (2002), Employment Implications of Agro- based industries in India; Agro industries & economic development; Deep & Deep publications Pvt. Lt