probabilistic pbee · pdf fileprobabilistic pbee applications khalid m. mosalam, professor...
TRANSCRIPT

Probabilistic PBEE Applications
KHALID M. MOSALAM, PROFESSOR
& SELIM GÜNAY, POST-DOC
UNIVERSITY OF CALIFORNIA, BERKELEY
Probabilistic Performance-based Earthquake Engineering, University of Minho, Guimarães, Portugal, October 3-4, 2012
Outline
2Probabilistic Performance-based Earthquake Engineering, University of Minho, Guimarães, Portugal, October 3-4, 2012
1. Application I: Evaluation of the effect ofunreinforced masonry infill walls on reinforcedconcrete frames with probabilistic PBEE
2. Application III: PEER PBEE assessment of ashearwall building located on the University ofCalifornia, Berkeley campus
3. Application II: Evaluation of the seismic response ofstructural insulated panels with probabilistic PBEE
Application I
3Probabilistic Performance-based Earthquake Engineering, University of Minho, Guimarães, Portugal, October 3-4, 2012
Evaluation of The Effect of Unreinforced Masonry Infill Walls on
Reinforced Concrete Frames with Probabilistic PBEE
4Probabilistic Performance-based Earthquake Engineering, University of Minho, Guimarães, Portugal, October 3-4, 2012
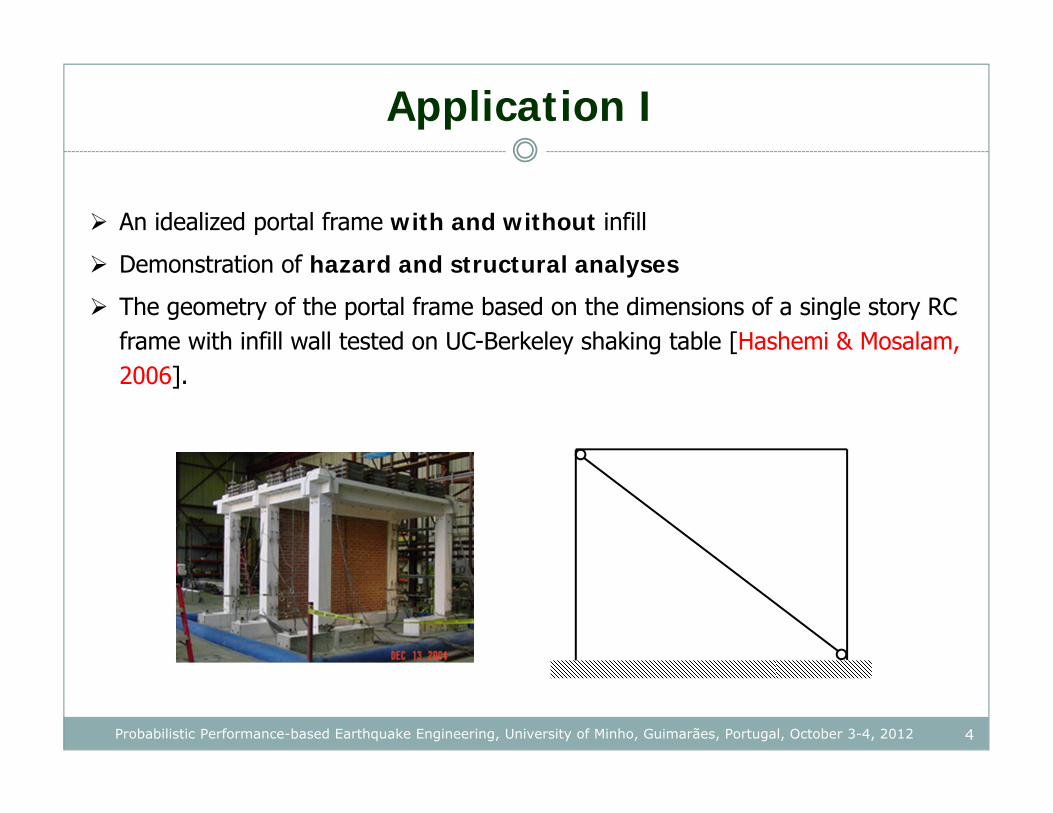
An idealized portal frame with and without infill
Demonstration of hazard and structural analyses
The geometry of the portal frame based on the dimensions of a single story RC frame with infill wall tested on UC-Berkeley shaking table [Hashemi & Mosalam, 2006].
Application I
5Probabilistic Performance-based Earthquake Engineering, University of Minho, Guimarães, Portugal, October 3-4, 2012
Application I
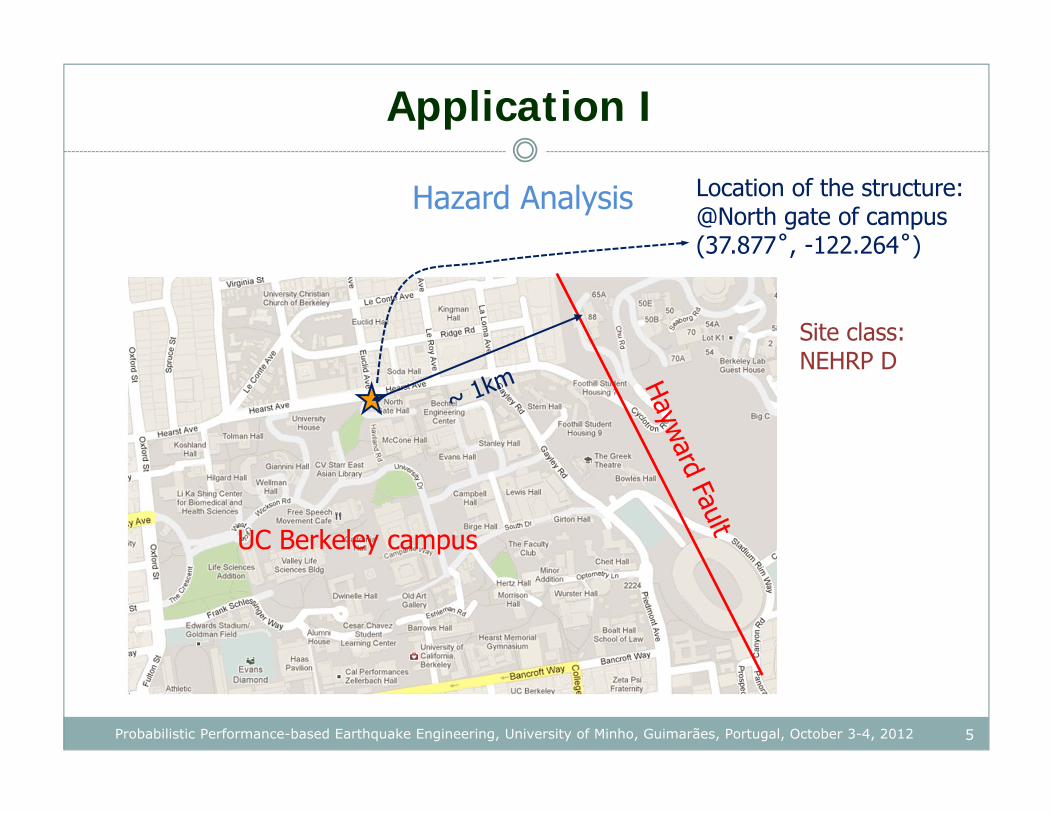
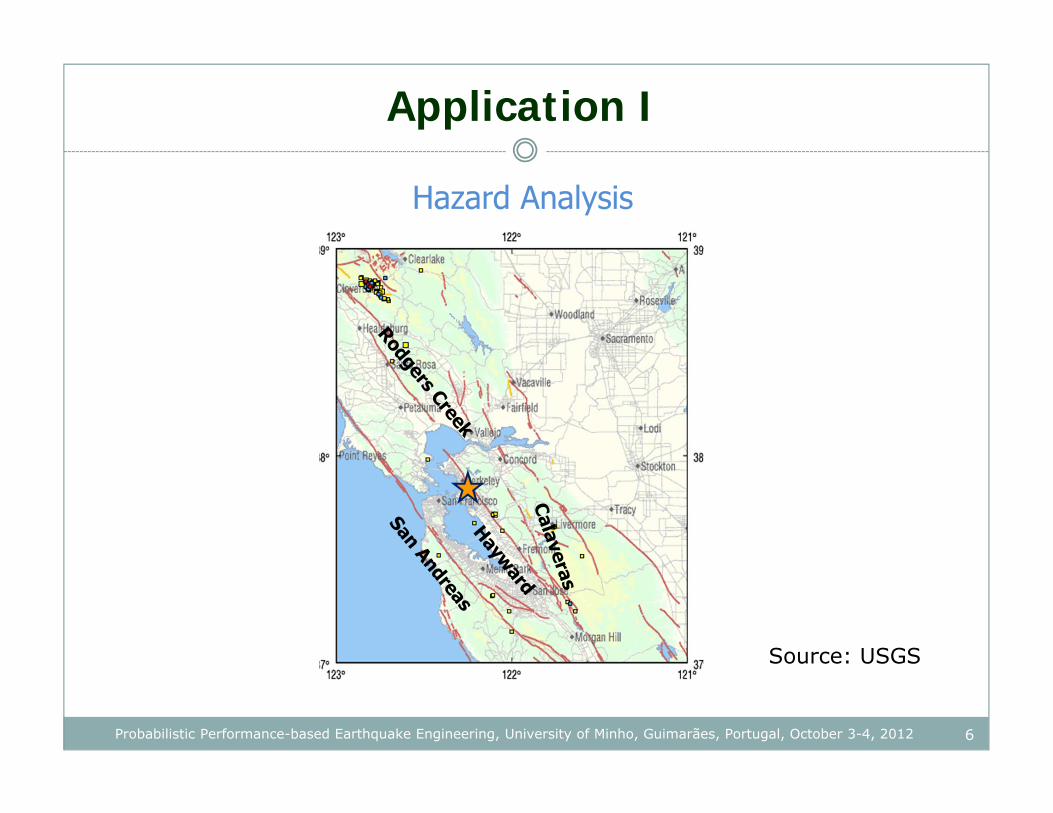
Hazard Analysis
UC Berkeley campus
Location of the structure: @North gate of campus (37.877˚, -122.264˚)
Site class: NEHRP D
6Probabilistic Performance-based Earthquake Engineering, University of Minho, Guimarães, Portugal, October 3-4, 2012
Application I
Hazard Analysis
Source: USGS

7Probabilistic Performance-based Earthquake Engineering, University of Minho, Guimarães, Portugal, October 3-4, 2012
Application I
Hazard Analysis
OpenSHAhttp://www.opensha.org
Location
Site class
IM type
Attenuation Model
Hazard Curve
Shear wave velocity in top 30 m of soil
(IM) years50,1(IM) (IM) TeP T
8Probabilistic Performance-based Earthquake Engineering, University of Minho, Guimarães, Portugal, October 3-4, 2012
Application I
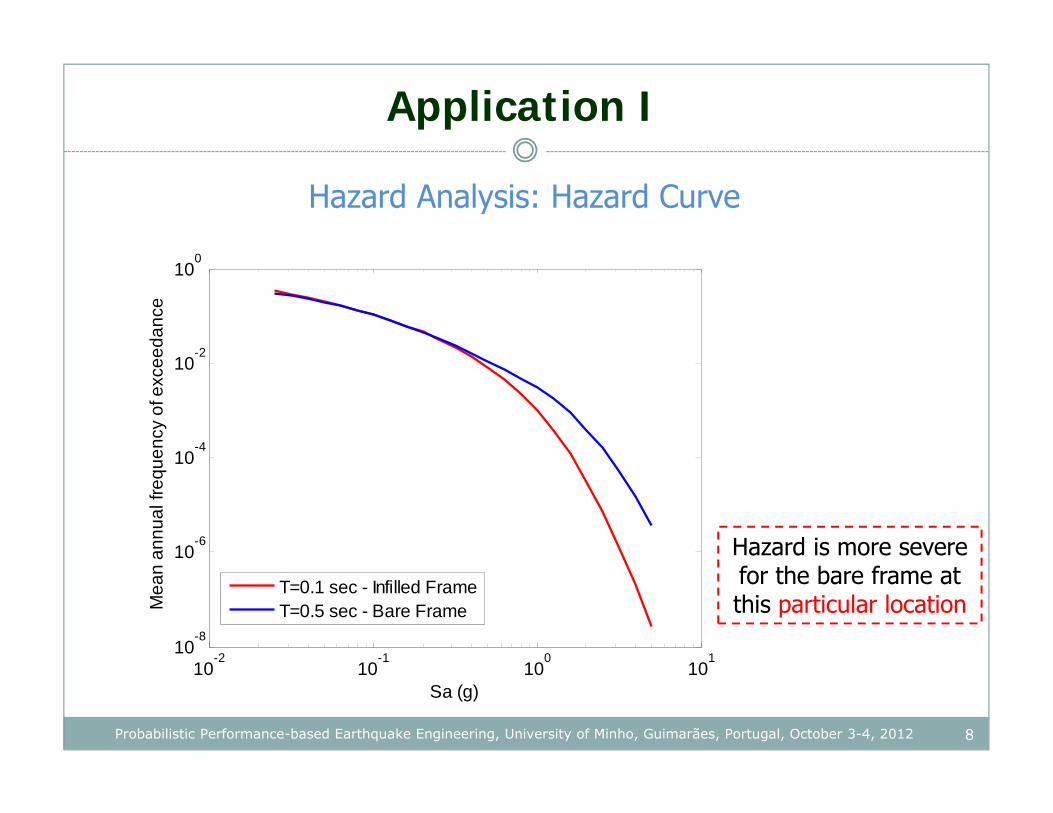
Hazard Analysis: Hazard Curve
10-2
10-1
100
101
10-8
10-6
10-4
10-2
100
Sa (g)
Mea
n an
nual
freq
uenc
y of
exc
eeda
nce
T=0.1 sec - Infilled FrameT=0.5 sec - Bare Frame
Hazard is more severe for the bare frame at this particular location
9Probabilistic Performance-based Earthquake Engineering, University of Minho, Guimarães, Portugal, October 3-4, 2012
Application I
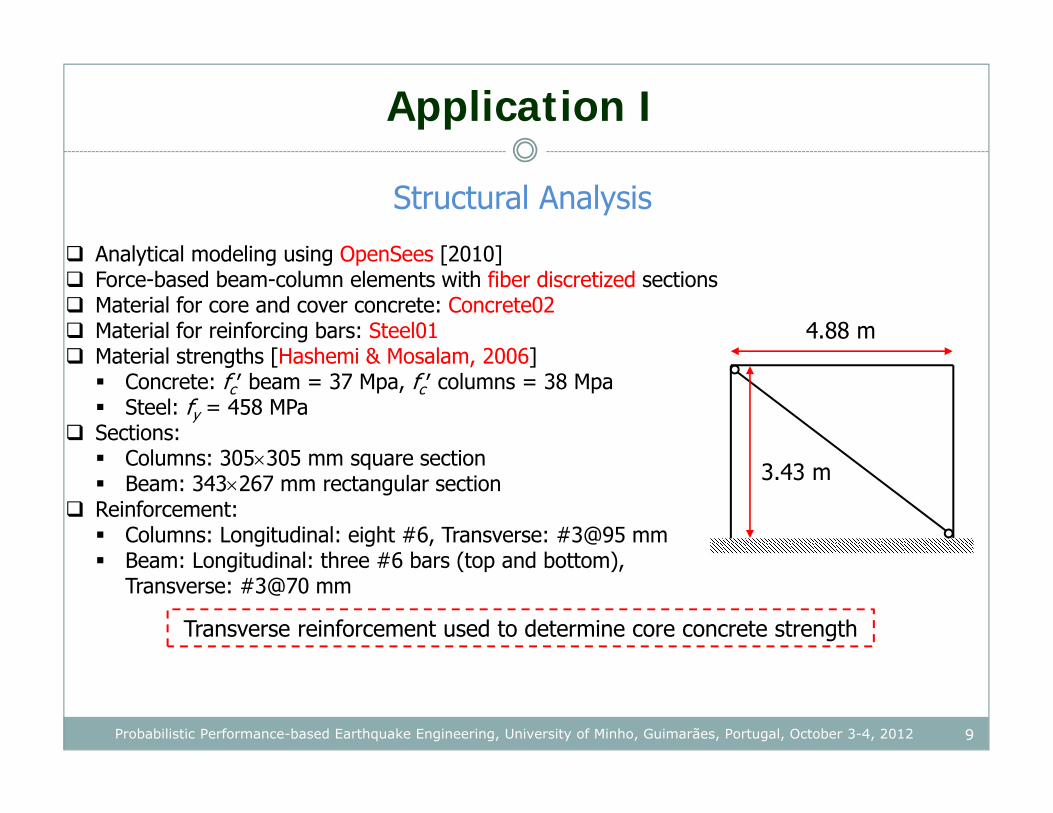
Structural Analysis
Analytical modeling using OpenSees [2010] Force-based beam-column elements with fiber discretized sections Material for core and cover concrete: Concrete02 Material for reinforcing bars: Steel01 Material strengths [Hashemi & Mosalam, 2006] Concrete: fcʹ beam = 37 Mpa, fcʹ columns = 38 Mpa Steel: fy = 458 MPa
Sections: Columns: 305305 mm square section Beam: 343267 mm rectangular section
Reinforcement: Columns: Longitudinal: eight #6, Transverse: #3@95 mm Beam: Longitudinal: three #6 bars (top and bottom),
Transverse: #3@70 mm
4.88 m
3.43 m
Transverse reinforcement used to determine core concrete strength
10Probabilistic Performance-based Earthquake Engineering, University of Minho, Guimarães, Portugal, October 3-4, 2012
Application I
Structural Analysis
Twenty ground motions [Lee & Mosalam, 2006] used in nonlinear time history analyses (explanation later in Application III)
Ground motions scaled for each of the considered Sa(T1) value
Note: Use of unscaled ground motions should be the preferred method in a real-life application
For demonstration purposes, only uncertainty in ground motion is considered; material uncertainty is not taken into consideration
Total number of analyses conducted for an intensity level is twenty
Peak interstory drift ratio (IDR) & peak roof acceleration (RA) are considered as the EDPs
11Probabilistic Performance-based Earthquake Engineering, University of Minho, Guimarães, Portugal, October 3-4, 2012
Application I
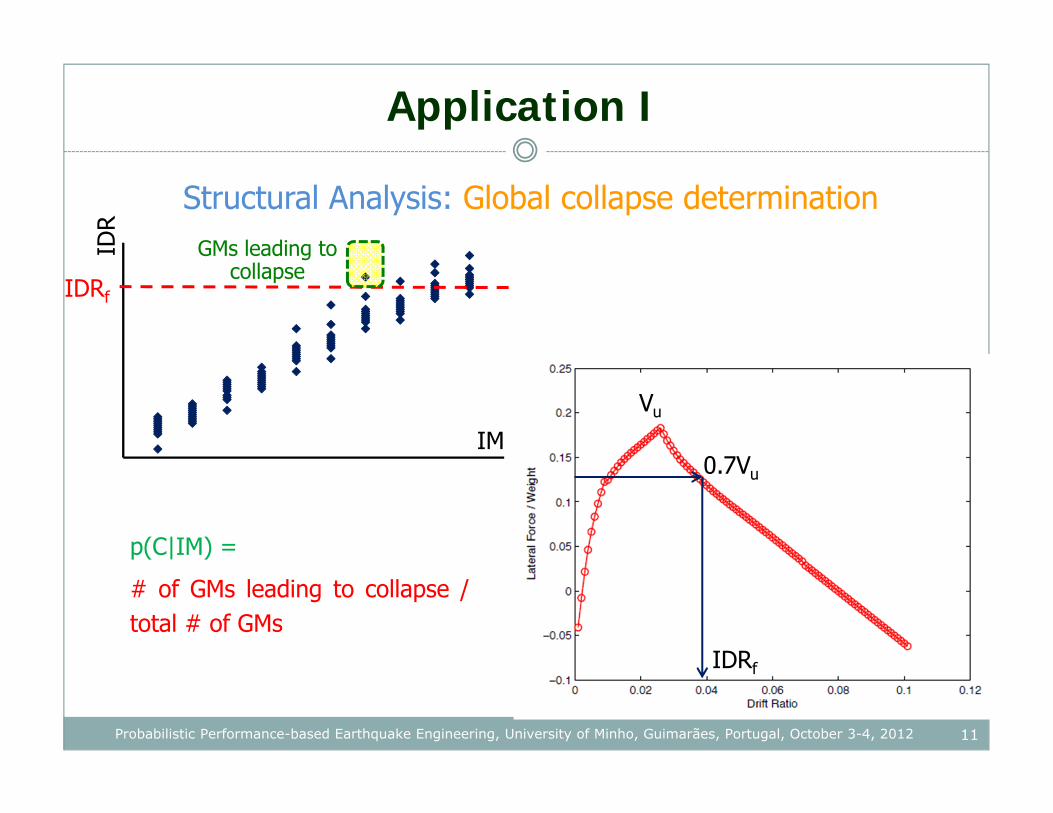
Structural Analysis: Global collapse determination
0
1
2
3
4
5
6
7
8
9
10
0 2 4 6 8 10
IDR
IM
IDRf
Vu
0.7Vu
IDRf
p(C|IM) =
# of GMs leading to collapse /total # of GMs
GMs leading to collapse
12Probabilistic Performance-based Earthquake Engineering, University of Minho, Guimarães, Portugal, October 3-4, 2012
Application I
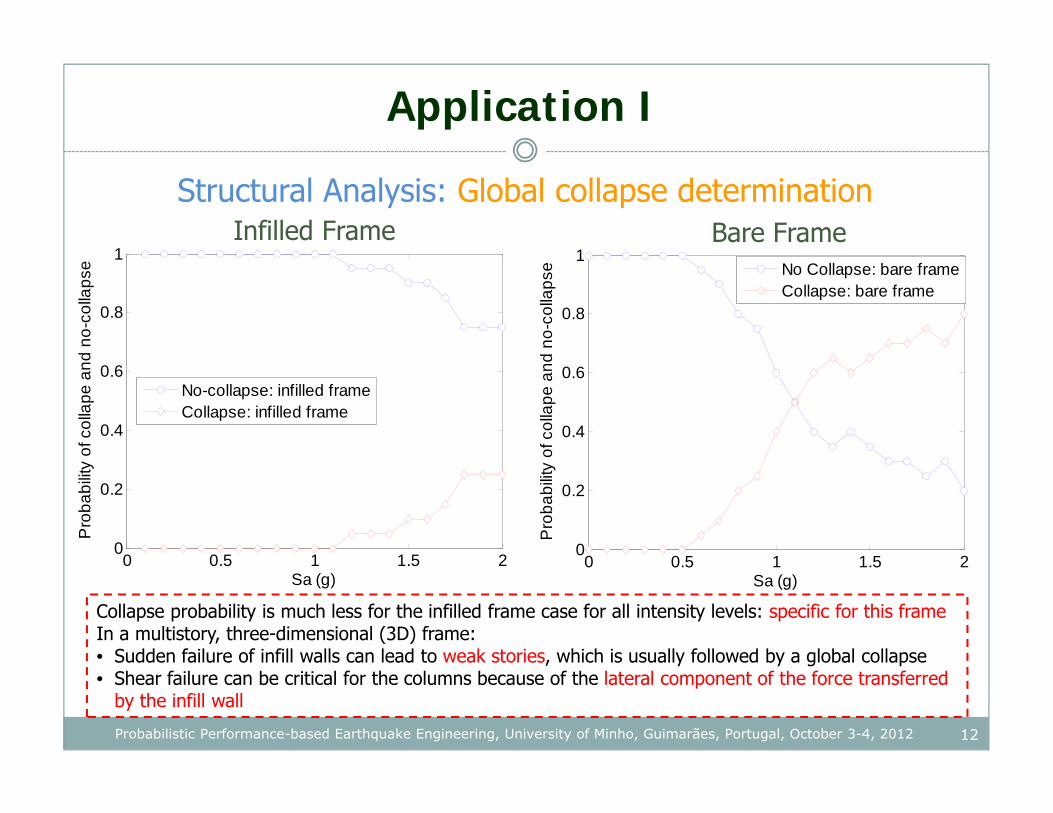
Structural Analysis: Global collapse determination
0 0.5 1 1.5 20
0.2
0.4
0.6
0.8
1
Sa (g)
Pro
babi
lity
of c
olla
pe a
nd n
o-co
llaps
e
No-collapse: infilled frameCollapse: infilled frame
Infilled Frame
0 0.5 1 1.5 20
0.2
0.4
0.6
0.8
1
Sa (g)
Pro
babi
lity
of c
olla
pe a
nd n
o-co
llaps
e
No Collapse: bare frameCollapse: bare frame
Bare Frame
Collapse probability is much less for the infilled frame case for all intensity levels: specific for this frameIn a multistory, three-dimensional (3D) frame:• Sudden failure of infill walls can lead to weak stories, which is usually followed by a global collapse• Shear failure can be critical for the columns because of the lateral component of the force transferred
by the infill wall
0
1
2
3
4
5
6
7
8
9
0
0 2 4 6 8 100
1
2
3
4
5
6
7
8
9
0
0 2 4 6 8 100
1
2
3
4
5
6
7
8
9
0
0 2 4 6 8 10
Structural Analysis
13Probabilistic Performance-based Earthquake Engineering, University of Minho, Guimarães, Portugal, October 3-4, 2012
EDP j
IM
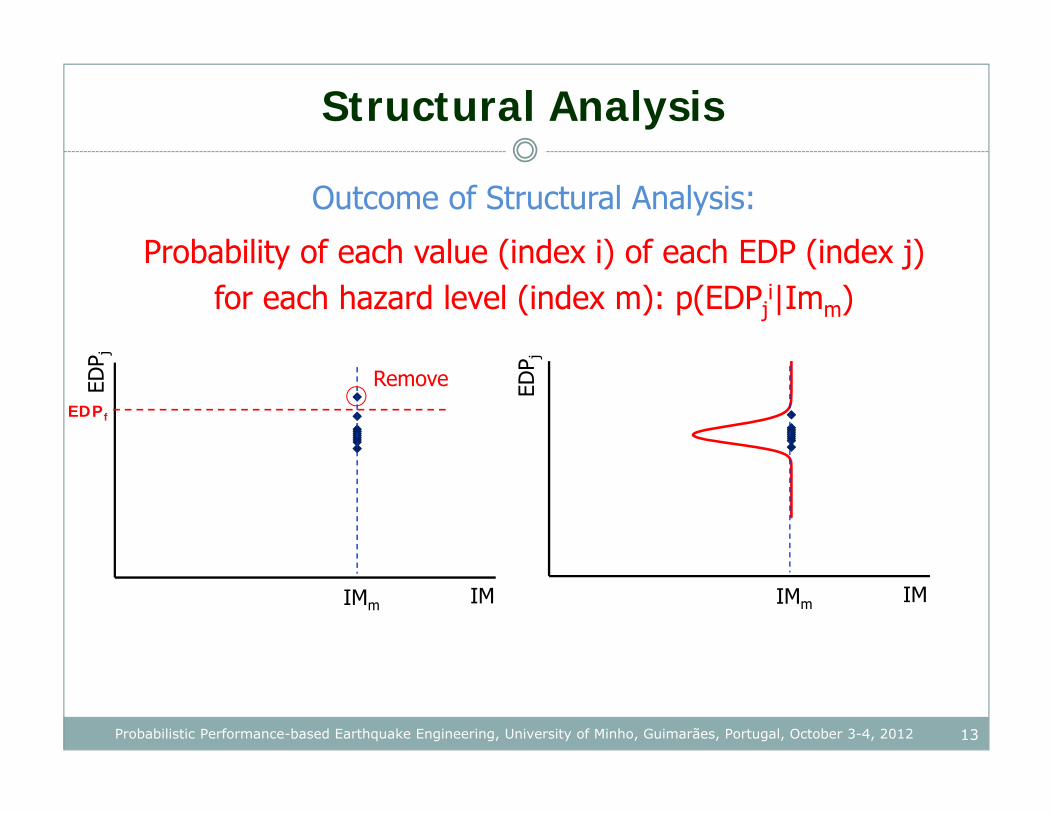
Outcome of Structural Analysis:
Probability of each value (index i) of each EDP (index j) for each hazard level (index m): p(EDPj
i|Imm)
IMm
EDPf
EDP j
Remove
IMIMm
14Probabilistic Performance-based Earthquake Engineering, University of Minho, Guimarães, Portugal, October 3-4, 2012
Application I
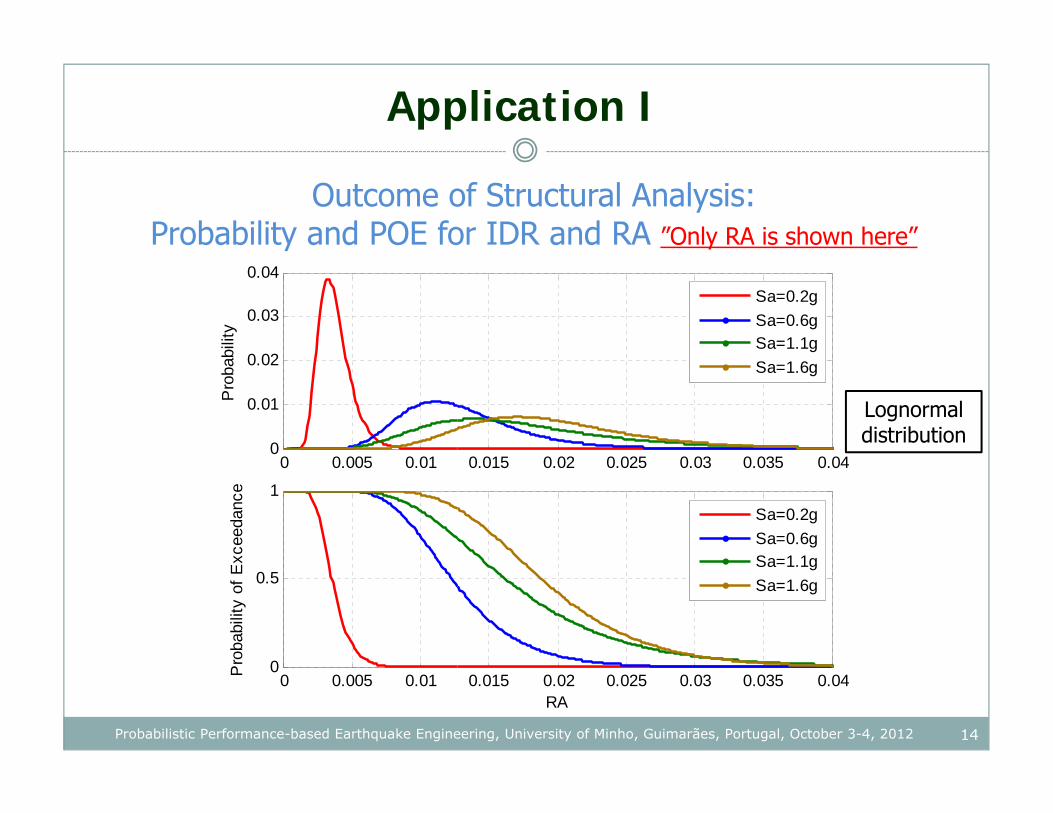
Outcome of Structural Analysis:Probability and POE for IDR and RA ”Only RA is shown here”
0 0.005 0.01 0.015 0.02 0.025 0.03 0.035 0.040
0.01
0.02
0.03
0.04
Pro
babi
lity
Sa=0.2gSa=0.6gSa=1.1gSa=1.6g
0 0.005 0.01 0.015 0.02 0.025 0.03 0.035 0.040
0.5
1
RA
Pro
babi
lity
of E
xcee
danc
e
Sa=0.2gSa=0.6gSa=1.1gSa=1.6g
Lognormal distribution
Application I
15Probabilistic Performance-based Earthquake Engineering, University of Minho, Guimarães, Portugal, October 3-4, 2012
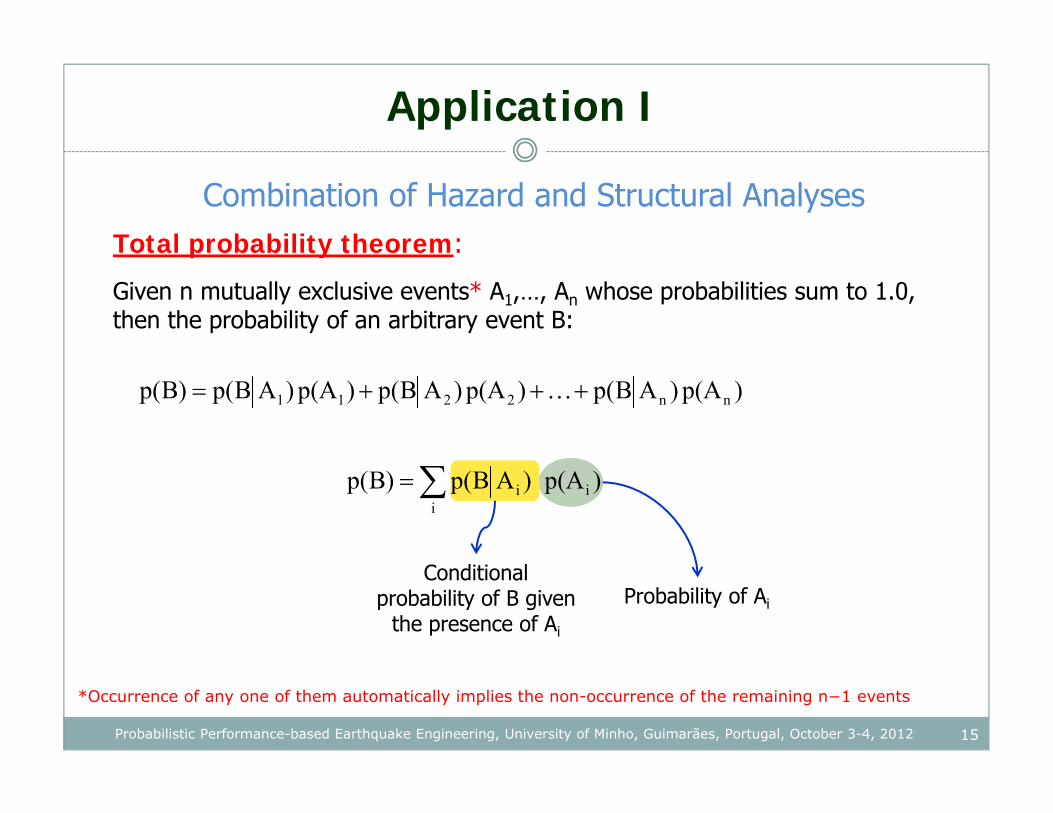
Total probability theorem:
Given n mutually exclusive events* A1,…, An whose probabilities sum to 1.0, then the probability of an arbitrary event B:
)p(A)ABp()p(A)ABp()p(A)ABp()Bp( nn2211
i
ii )p(A)ABp()Bp(
Conditional probability of B given
the presence of Ai
Probability of Ai
*Occurrence of any one of them automatically implies the non-occurrence of the remaining n−1 events
Combination of Hazard and Structural Analyses
16Probabilistic Performance-based Earthquake Engineering, University of Minho, Guimarães, Portugal, October 3-4, 2012
Application I
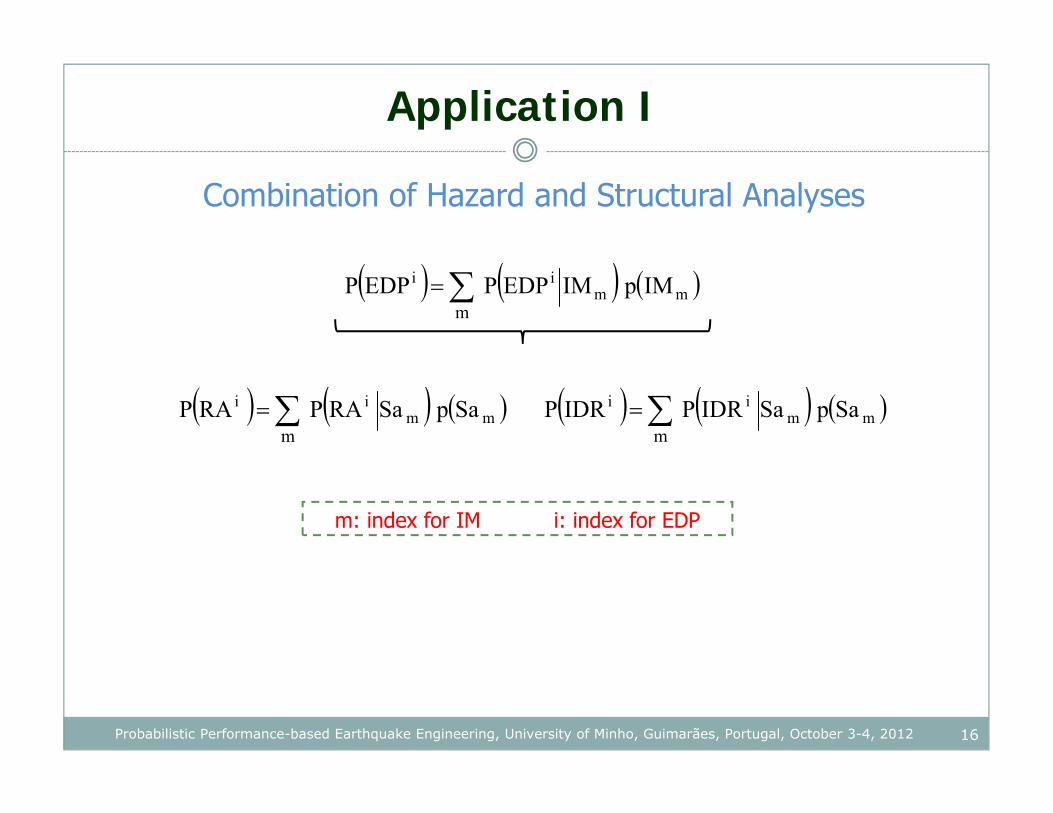
Combination of Hazard and Structural Analyses
mmii IMpIMEDPPEDPP
m
mmii SapSaRAPRAP
m mm
ii SapSaRIDPIDRPm
m: index for IM i: index for EDP
17Probabilistic Performance-based Earthquake Engineering, University of Minho, Guimarães, Portugal, October 3-4, 2012
Application I
Combination of Hazard and Structural Analyses
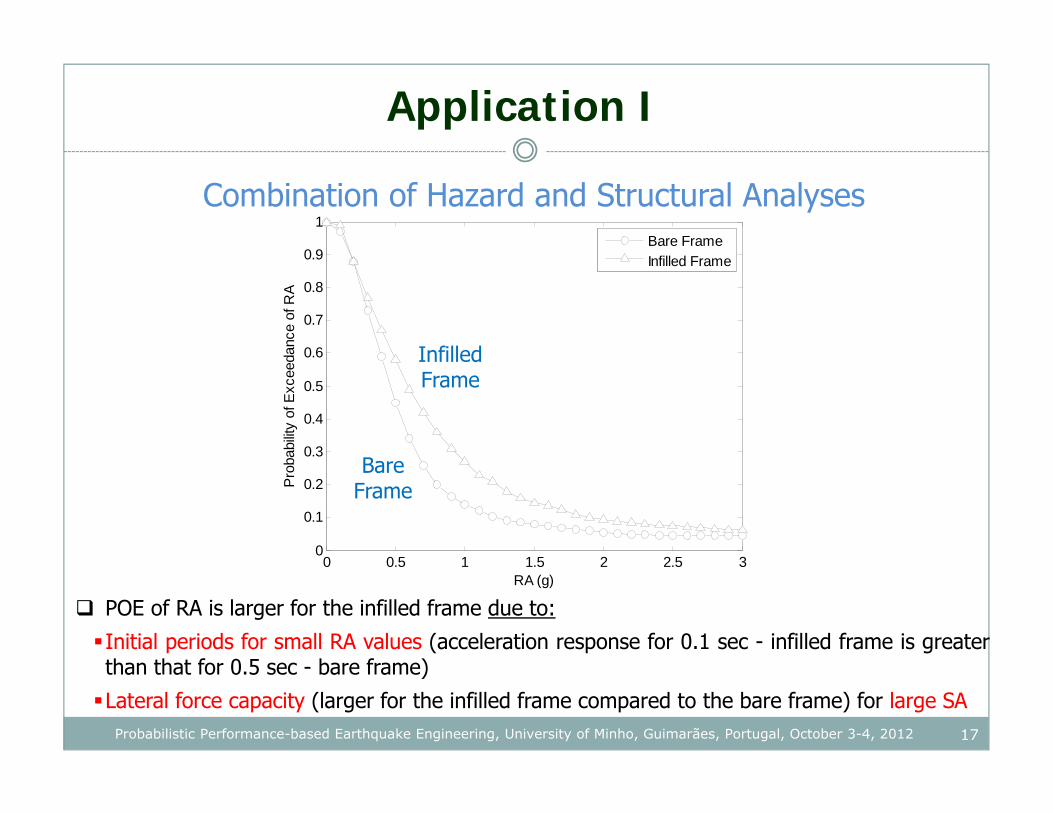
POE of RA is larger for the infilled frame due to:
Initial periods for small RA values (acceleration response for 0.1 sec - infilled frame is greaterthan that for 0.5 sec - bare frame)
Lateral force capacity (larger for the infilled frame compared to the bare frame) for large SA
0 0.5 1 1.5 2 2.5 30
0.1
0.2
0.3
0.4
0.5
0.6
0.7
0.8
0.9
1
RA (g)
Prob
abilit
y of
Exc
eeda
nce
of R
A
Bare FrameInfilled Frame
Bare Frame
Infilled Frame
0 0.5 1 1.5 2 2.5 30
0.1
0.2
0.3
0.4
0.5
0.6
0.7
0.8
0.9
1
RA (g)
Pro
babi
lity o
f Exc
eeda
nce
of R
A
Bare FrameInfilled Frame
Bare Frame
Infilled Frame
18Probabilistic Performance-based Earthquake Engineering, University of Minho, Guimarães, Portugal, October 3-4, 2012
Application ICombination of Hazard and Structural Analyses
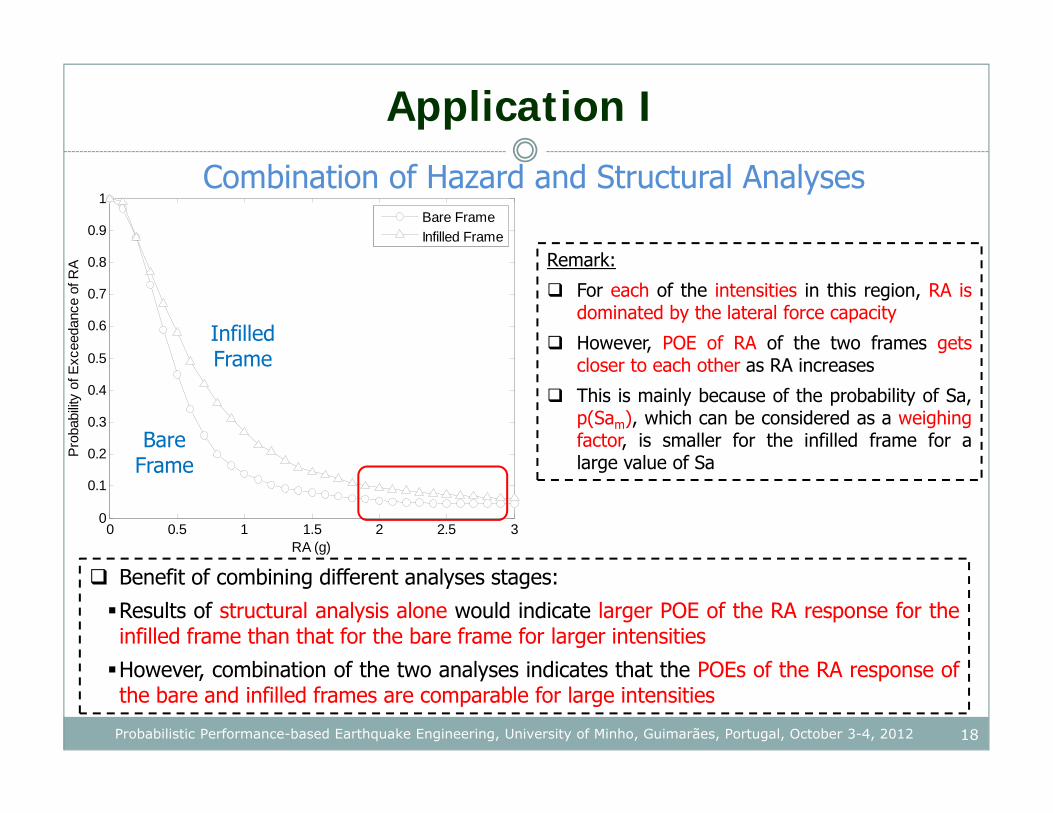
Remark:
For each of the intensities in this region, RA isdominated by the lateral force capacity
However, POE of RA of the two frames getscloser to each other as RA increases
This is mainly because of the probability of Sa,p(Sam), which can be considered as a weighingfactor, is smaller for the infilled frame for alarge value of Sa
Benefit of combining different analyses stages:
Results of structural analysis alone would indicate larger POE of the RA response for theinfilled frame than that for the bare frame for larger intensities
However, combination of the two analyses indicates that the POEs of the RA response ofthe bare and infilled frames are comparable for large intensities
0 0.5 1 1.5 2 2.5 3 3.50
0.1
0.2
0.3
0.4
0.5
0.6
0.7
0.8
0.9
1
IDR (%)
Pro
babi
lity o
f Exc
eeda
nce
of ID
R
Infilled FrameBare Frame
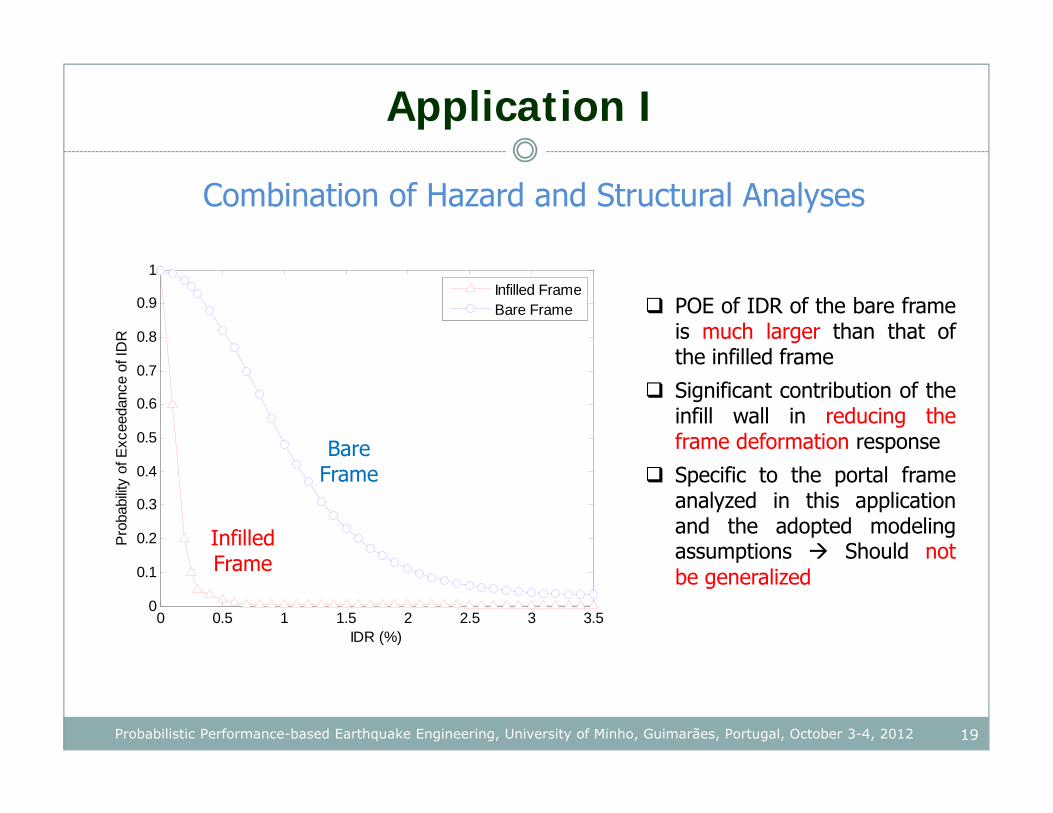
19Probabilistic Performance-based Earthquake Engineering, University of Minho, Guimarães, Portugal, October 3-4, 2012
Application I
Combination of Hazard and Structural Analyses
POE of IDR of the bare frameis much larger than that ofthe infilled frame
Significant contribution of theinfill wall in reducing theframe deformation response
Specific to the portal frameanalyzed in this applicationand the adopted modelingassumptions Should notbe generalized
Bare Frame
Infilled Frame

Application III
20Probabilistic Performance-based Earthquake Engineering, University of Minho, Guimarães, Portugal, October 3-4, 2012
PEER PBEE Assessment of a Shearwall Building Located on the University of
California, Berkeley Campus

Application III
21Probabilistic Performance-based Earthquake Engineering, University of Minho, Guimarães, Portugal, October 3-4, 2012
University of California Science (UCS) building in UC-Berkeley campus
Modern reinforced concrete shear-wall building
High technology research laboratories for organismal biology, animal facilities, offices and related support spaces
An example for which non-structural components contribute to the PBEE methodology due to valuable building contents, i.e. the laboratory equipment and research activities
Application III
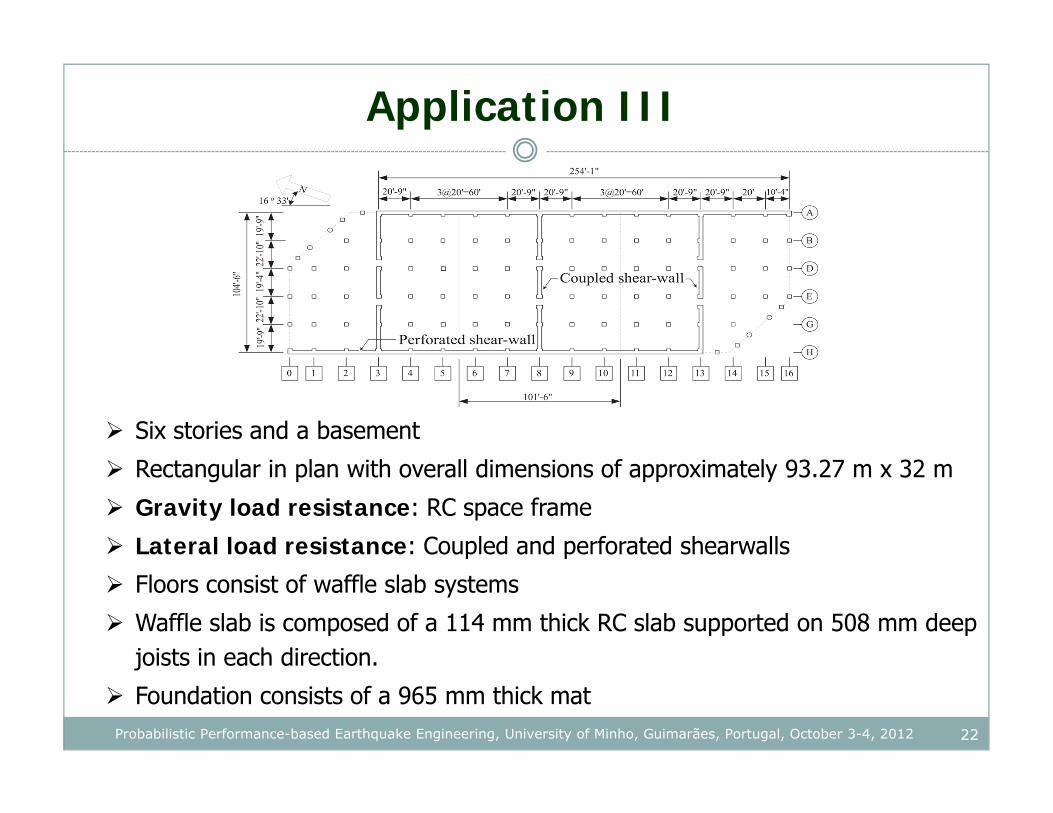
22Probabilistic Performance-based Earthquake Engineering, University of Minho, Guimarães, Portugal, October 3-4, 2012
Six stories and a basement
Rectangular in plan with overall dimensions of approximately 93.27 m x 32 m
Gravity load resistance: RC space frame
Lateral load resistance: Coupled and perforated shearwalls
Floors consist of waffle slab systems
Waffle slab is composed of a 114 mm thick RC slab supported on 508 mm deep joists in each direction.
Foundation consists of a 965 mm thick mat
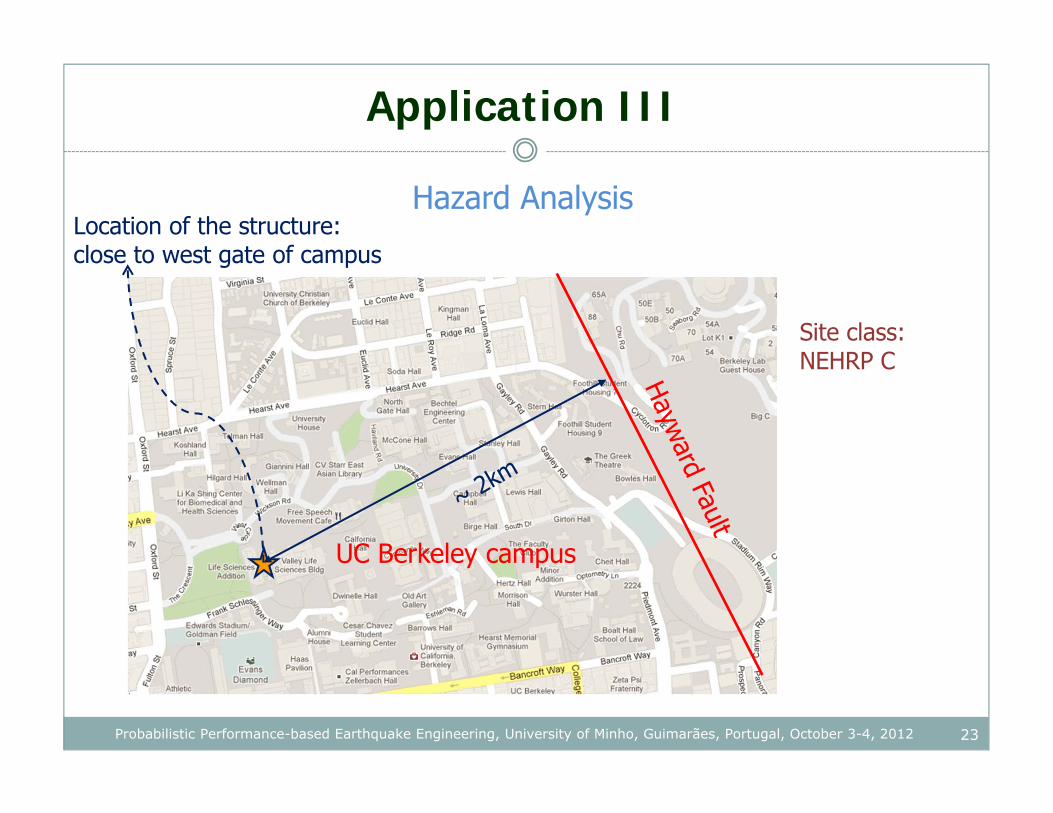
23Probabilistic Performance-based Earthquake Engineering, University of Minho, Guimarães, Portugal, October 3-4, 2012
Application III
Hazard AnalysisLocation of the structure: close to west gate of campus
UC Berkeley campus
Site class: NEHRP C
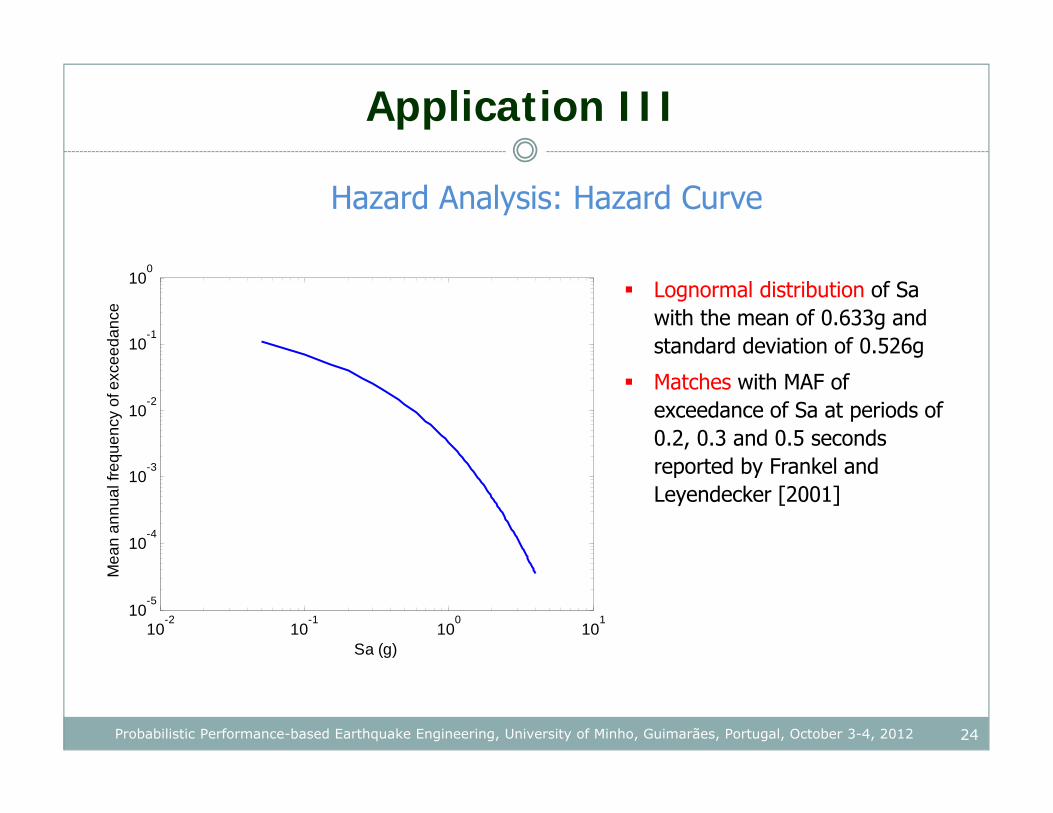
24Probabilistic Performance-based Earthquake Engineering, University of Minho, Guimarães, Portugal, October 3-4, 2012
Application III
Hazard Analysis: Hazard Curve
10-2
10-1
100
101
10-5
10-4
10-3
10-2
10-1
100
Sa (g)
Mea
n an
nual
freq
uenc
y of
exc
eeda
nce
Lognormal distribution of Sa with the mean of 0.633g and standard deviation of 0.526g
Matches with MAF of exceedance of Sa at periods of 0.2, 0.3 and 0.5 seconds reported by Frankel and Leyendecker [2001]
25Probabilistic Performance-based Earthquake Engineering, University of Minho, Guimarães, Portugal, October 3-4, 2012
Application III
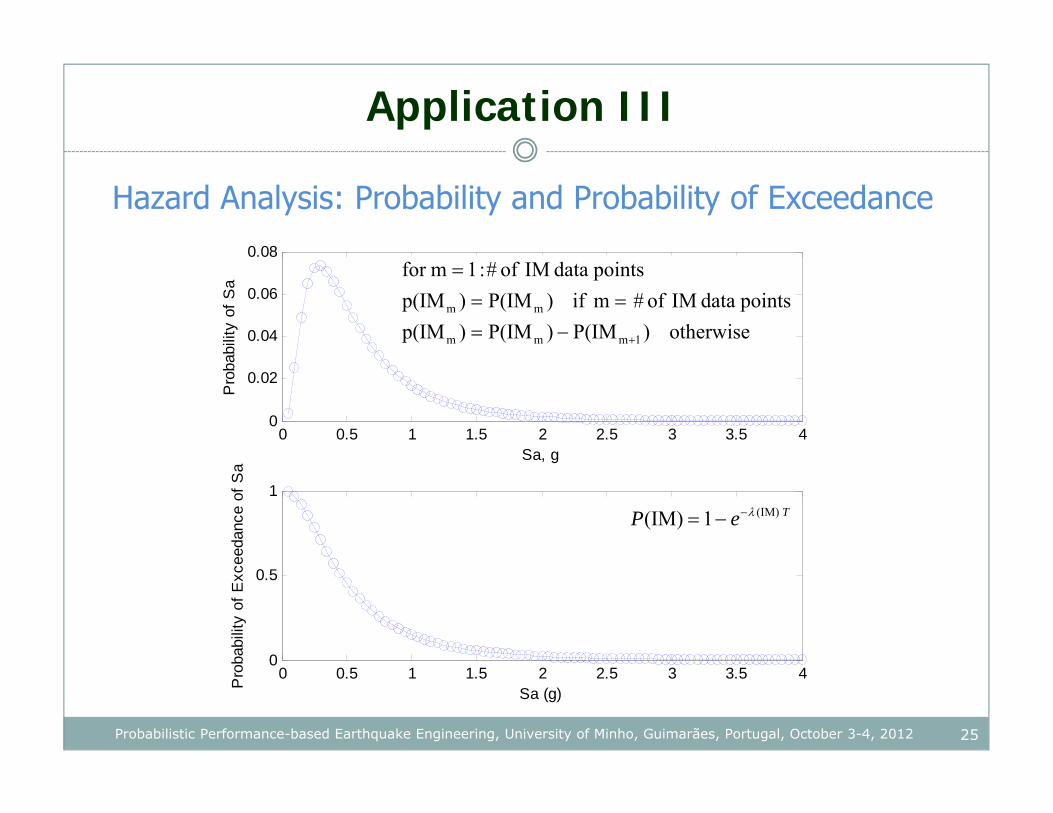
Hazard Analysis: Probability and Probability of Exceedance
0 0.5 1 1.5 2 2.5 3 3.5 40
0.02
0.04
0.06
0.08
Sa, g
Pro
babi
lity
of S
a
0 0.5 1 1.5 2 2.5 3 3.5 40
0.5
1
Sa (g)Pro
babi
lity
of E
xcee
danc
e of
Sa
TeP (IM)1(IM)
otherwise)P(IM)P(IM)p(IMpoints data IM of #mif)P(IM)p(IM
points data IM of #:1mfor
1mmm
mm
26Probabilistic Performance-based Earthquake Engineering, University of Minho, Guimarães, Portugal, October 3-4, 2012
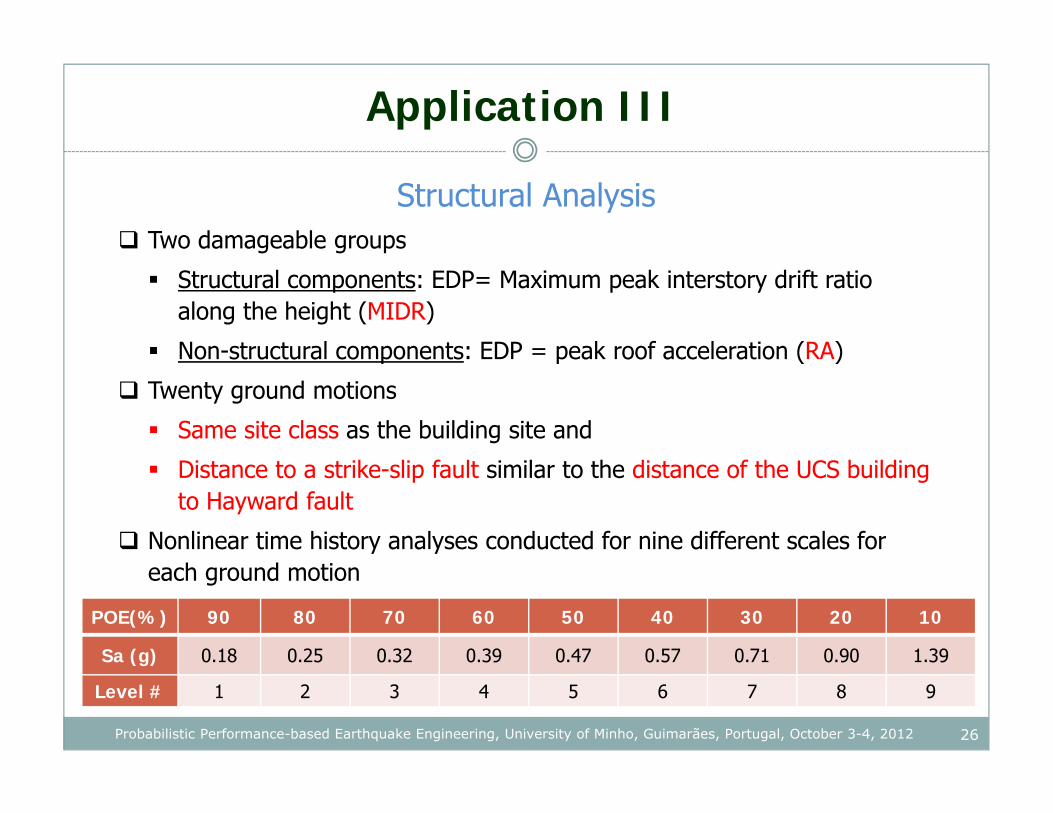
Application III
Structural Analysis Two damageable groups
Structural components: EDP= Maximum peak interstory drift ratio along the height (MIDR)
Non-structural components: EDP = peak roof acceleration (RA)
Twenty ground motions
Same site class as the building site and
Distance to a strike-slip fault similar to the distance of the UCS building to Hayward fault
Nonlinear time history analyses conducted for nine different scales for each ground motion
POE(%) 90 80 70 60 50 40 30 20 10
Sa (g) 0.18 0.25 0.32 0.39 0.47 0.57 0.71 0.90 1.39
Level # 1 2 3 4 5 6 7 8 9
27Probabilistic Performance-based Earthquake Engineering, University of Minho, Guimarães, Portugal, October 3-4, 2012
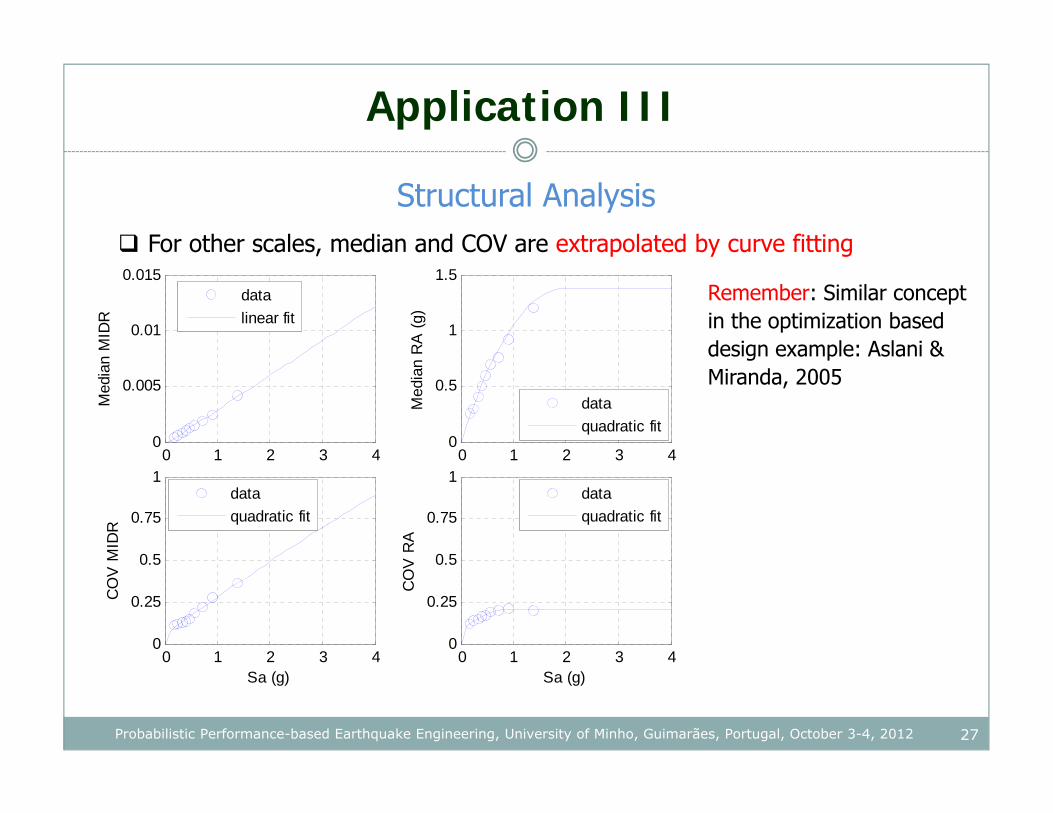
Application III
Structural Analysis For other scales, median and COV are extrapolated by curve fitting
0 1 2 3 40
0.005
0.01
0.015
Med
ian
MID
R
datalinear fit
0 1 2 3 40
0.25
0.5
0.75
1
Sa (g)
CO
V M
IDR
dataquadratic fit
0 1 2 3 40
0.5
1
1.5
Med
ian
RA
(g)
dataquadratic fit
0 1 2 3 40
0.25
0.5
0.75
1
Sa (g)
CO
V R
A
dataquadratic fit
Remember: Similar concept in the optimization based design example: Aslani & Miranda, 2005
28Probabilistic Performance-based Earthquake Engineering, University of Minho, Guimarães, Portugal, October 3-4, 2012
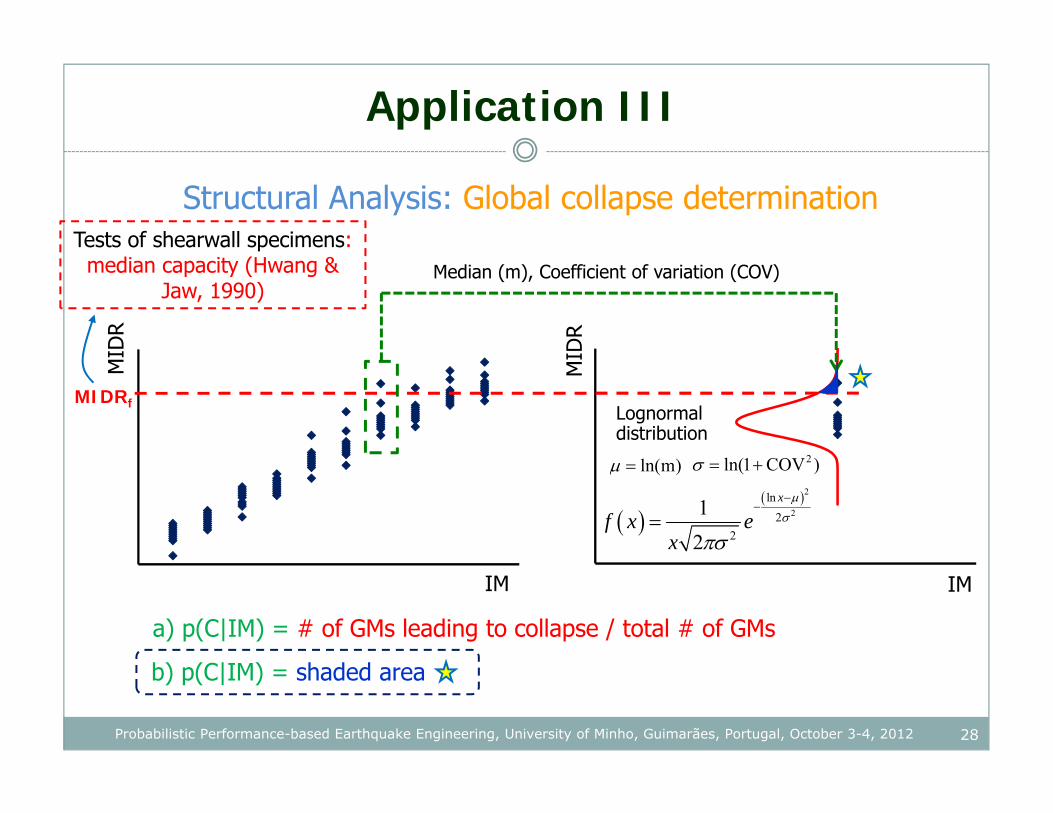
Application III
Structural Analysis: Global collapse determination
0
1
2
3
4
5
6
7
8
9
0
0 2 4 6 8 10M
IDR
IM
Median (m), Coefficient of variation (COV)
2
2ln
22
12
x
f x ex
Lognormaldistribution
)mln( )COV1ln( 2
a) p(C|IM) = # of GMs leading to collapse / total # of GMs
0
1
2
3
4
5
6
7
8
9
10
0 2 4 6 8 10
MID
R
IM
MIDRf
b) p(C|IM) = shaded area
Tests of shearwall specimens: median capacity (Hwang &
Jaw, 1990)
29Probabilistic Performance-based Earthquake Engineering, University of Minho, Guimarães, Portugal, October 3-4, 2012
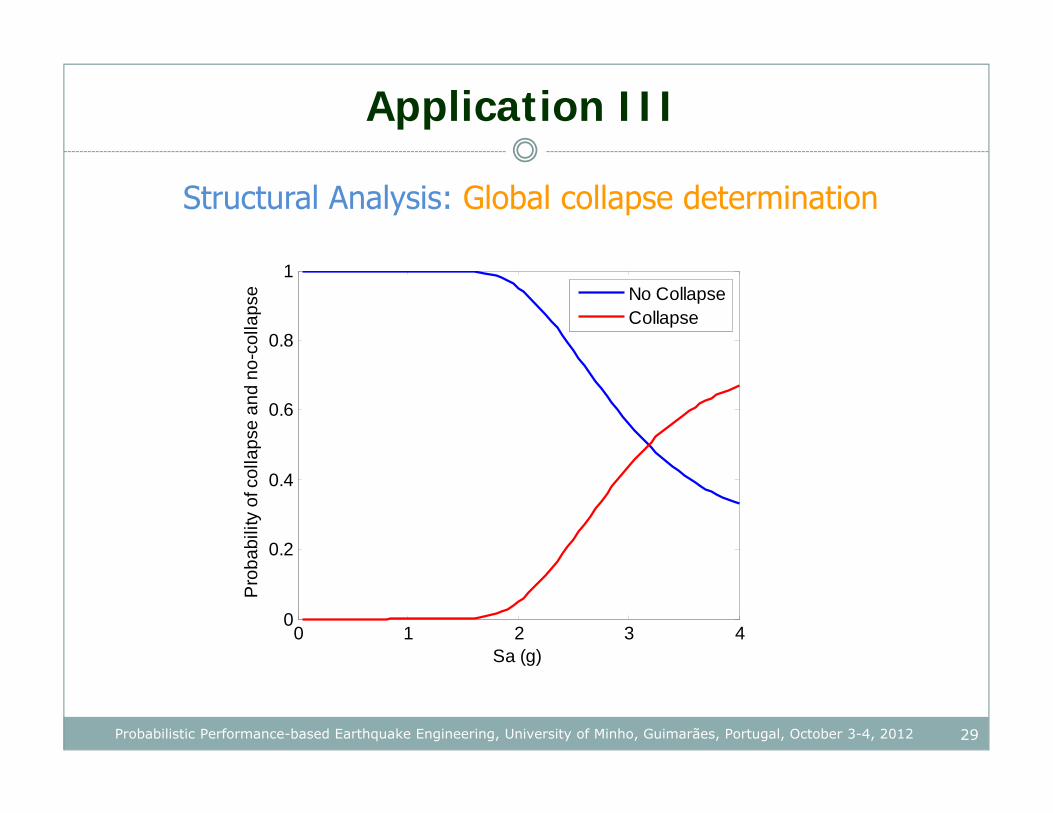
Application III
Structural Analysis: Global collapse determination
0 1 2 3 40
0.2
0.4
0.6
0.8
1
Sa (g)
Pro
babi
lity
of c
olla
pse
and
no-c
olla
pse
No CollapseCollapse
30Probabilistic Performance-based Earthquake Engineering, University of Minho, Guimarães, Portugal, October 3-4, 2012
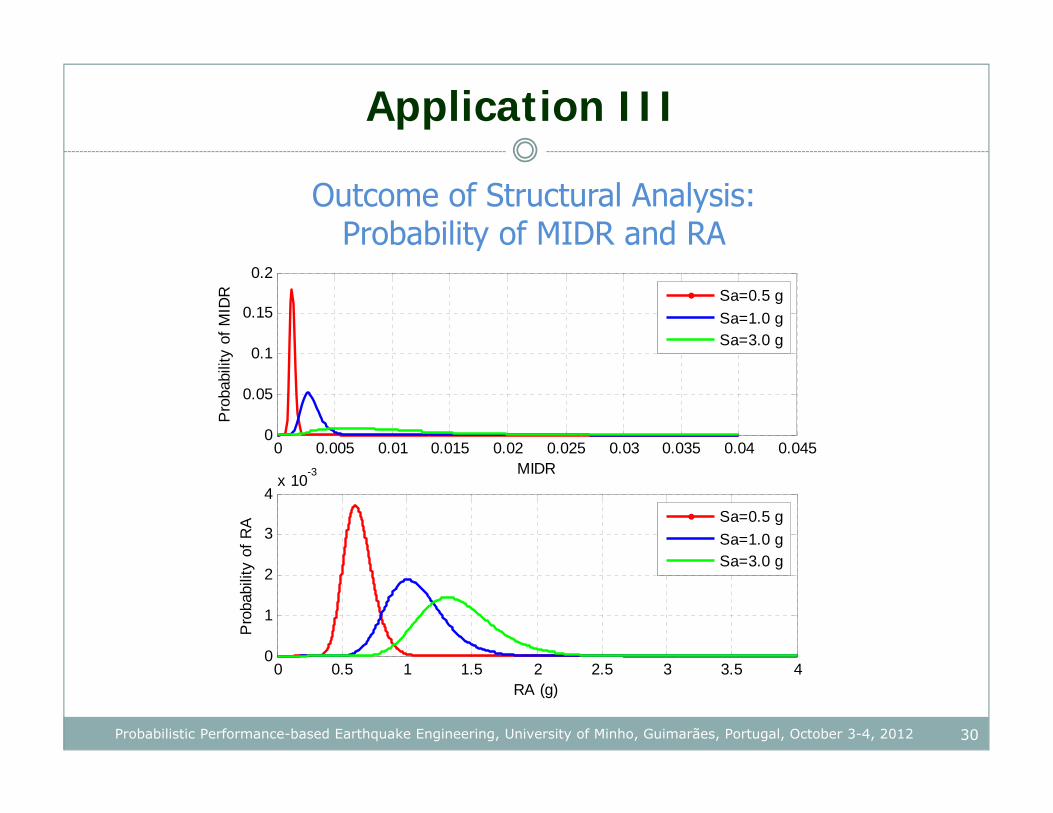
Application III
Outcome of Structural Analysis:Probability of MIDR and RA
0 0.005 0.01 0.015 0.02 0.025 0.03 0.035 0.04 0.0450
0.05
0.1
0.15
0.2
MIDR
Pro
babi
lity
of M
IDR
Sa=0.5 gSa=1.0 gSa=3.0 g
0 0.5 1 1.5 2 2.5 3 3.5 40
1
2
3
4x 10⁻³
RA (g)
Pro
babi
lity
of R
A
Sa=0.5 gSa=1.0 gSa=3.0 g
31Probabilistic Performance-based Earthquake Engineering, University of Minho, Guimarães, Portugal, October 3-4, 2012
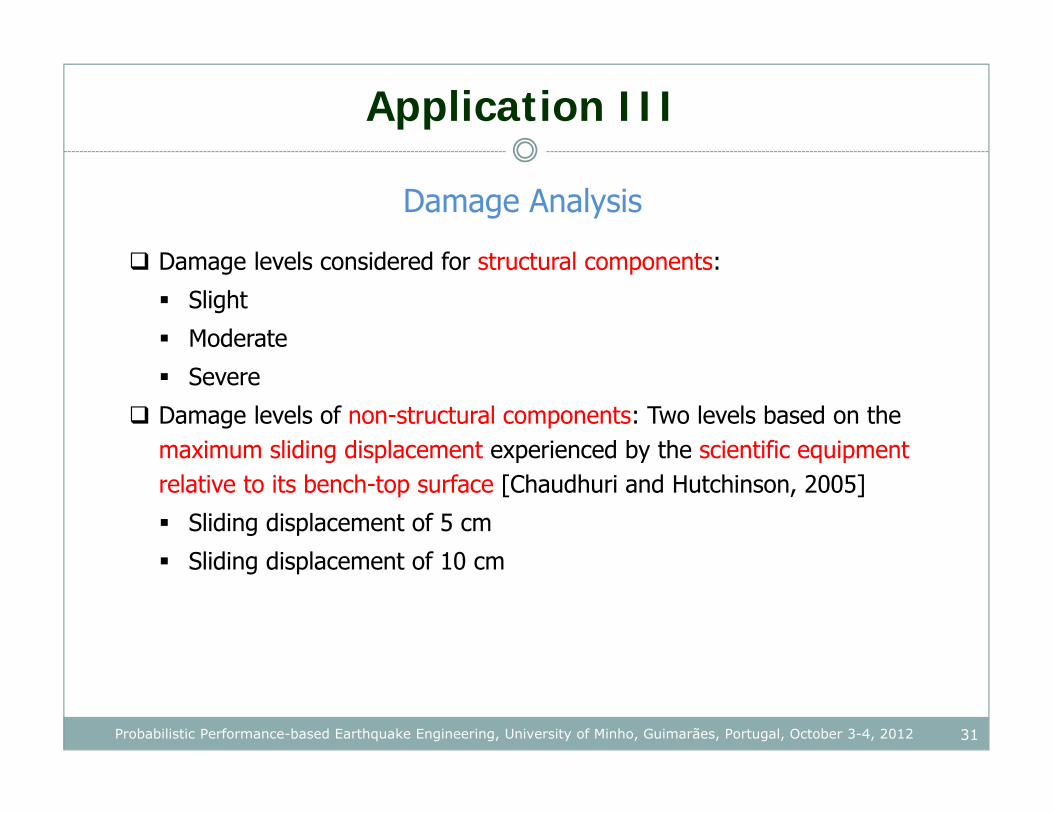
Application III
Damage Analysis
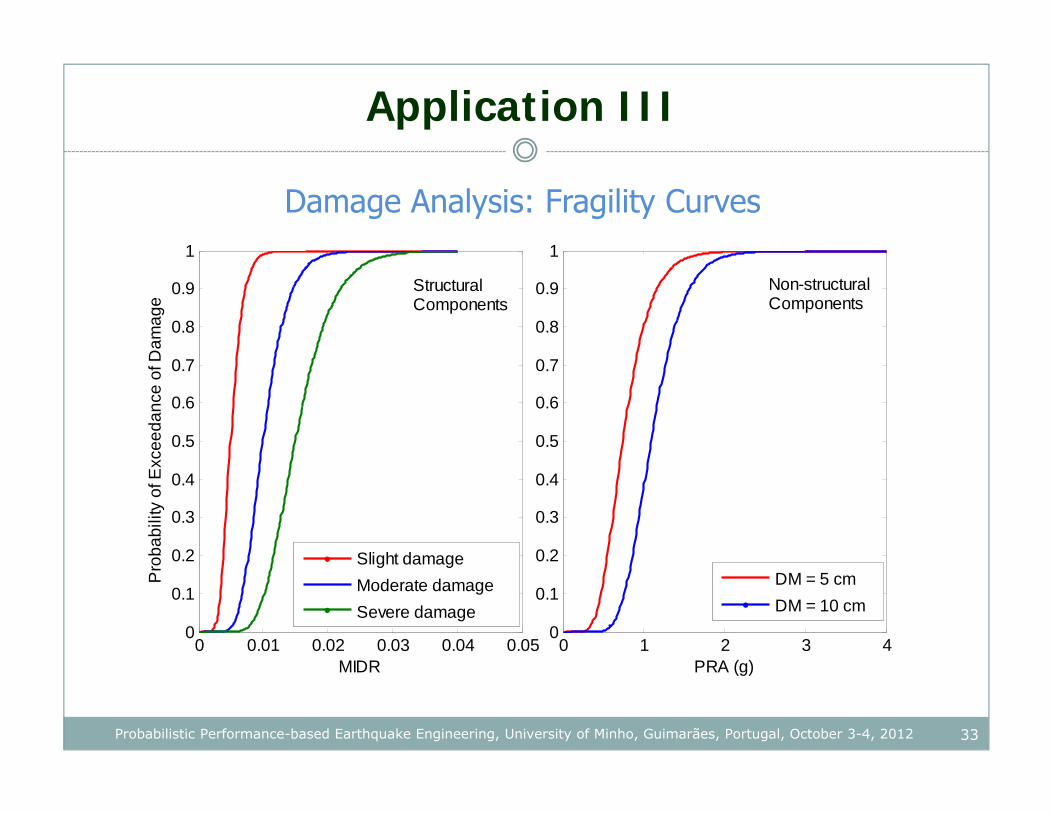
Damage levels considered for structural components:
Slight
Moderate
Severe
Damage levels of non-structural components: Two levels based on the maximum sliding displacement experienced by the scientific equipment relative to its bench-top surface [Chaudhuri and Hutchinson, 2005]
Sliding displacement of 5 cm
Sliding displacement of 10 cm
32Probabilistic Performance-based Earthquake Engineering, University of Minho, Guimarães, Portugal, October 3-4, 2012
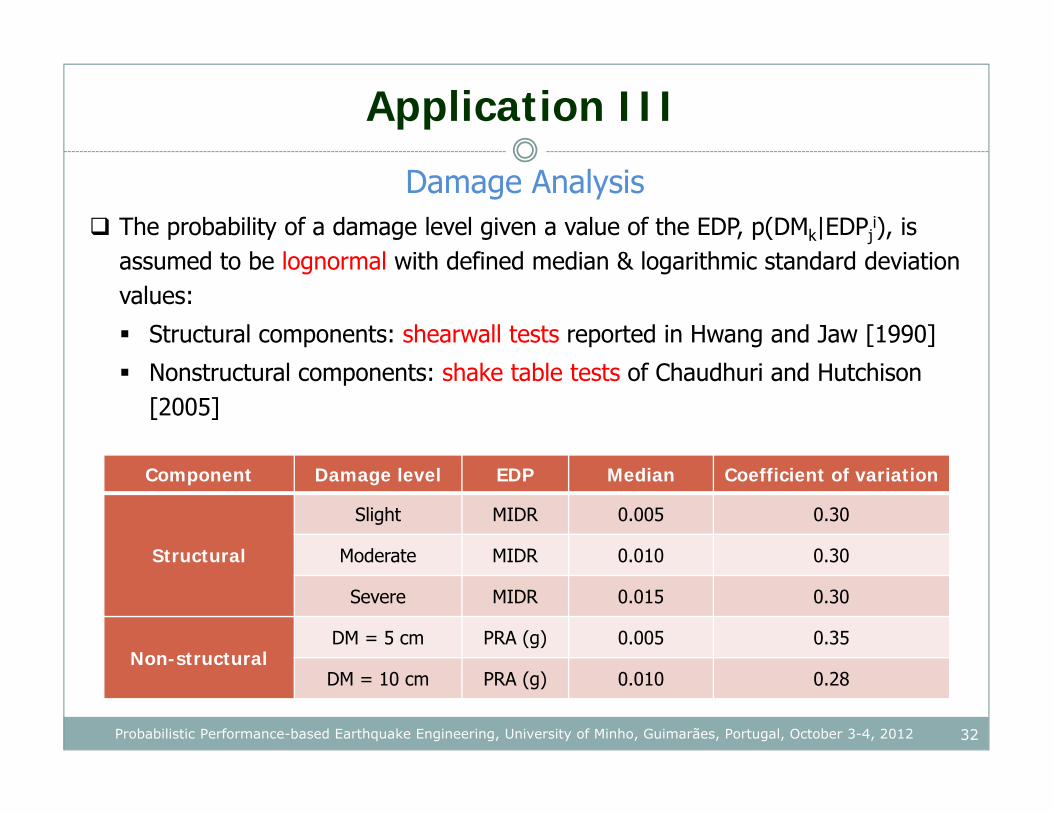
Application III
Damage Analysis The probability of a damage level given a value of the EDP, p(DMk|EDPj
i), is assumed to be lognormal with defined median & logarithmic standard deviation values:
Structural components: shearwall tests reported in Hwang and Jaw [1990]
Nonstructural components: shake table tests of Chaudhuri and Hutchison [2005]
Component Damage level EDP Median Coefficient of variation
Structural
Slight MIDR 0.005 0.30
Moderate MIDR 0.010 0.30
Severe MIDR 0.015 0.30
Non-structuralDM = 5 cm PRA (g) 0.005 0.35
DM = 10 cm PRA (g) 0.010 0.28
33Probabilistic Performance-based Earthquake Engineering, University of Minho, Guimarães, Portugal, October 3-4, 2012
Application III
Damage Analysis: Fragility Curves
0 0.01 0.02 0.03 0.04 0.050
0.1
0.2
0.3
0.4
0.5
0.6
0.7
0.8
0.9
1
MIDR
Pro
babi
lity
of E
xcee
danc
e of
Dam
age
Slight damageModerate damageSevere damage
0 1 2 3 40
0.1
0.2
0.3
0.4
0.5
0.6
0.7
0.8
0.9
1
PRA (g)
DM = 5 cmDM = 10 cm
Non-structuralComponents
StructuralComponents
34Probabilistic Performance-based Earthquake Engineering, University of Minho, Guimarães, Portugal, October 3-4, 2012
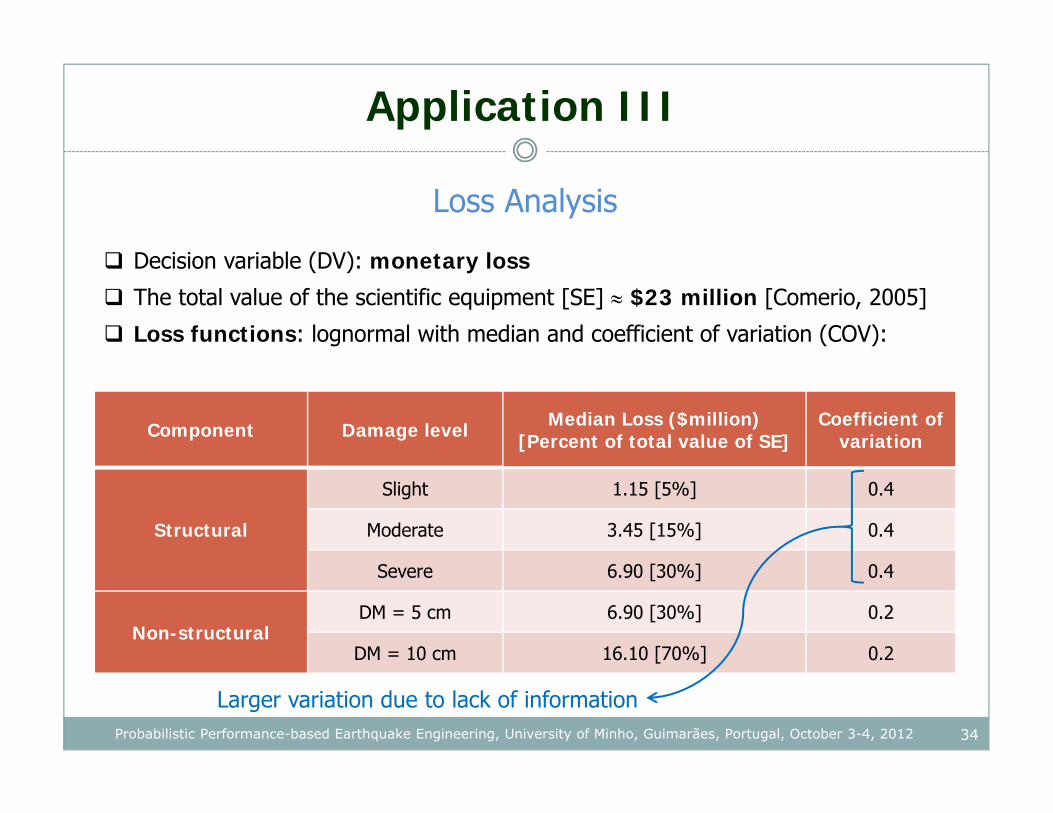
Application III
Loss Analysis
Decision variable (DV): monetary loss
The total value of the scientific equipment [SE] $23 million [Comerio, 2005]
Loss functions: lognormal with median and coefficient of variation (COV):
Component Damage level Median Loss ($million)[Percent of total value of SE]
Coefficient of variation
Structural
Slight 1.15 [5%] 0.4
Moderate 3.45 [15%] 0.4
Severe 6.90 [30%] 0.4
Non-structuralDM = 5 cm 6.90 [30%] 0.2
DM = 10 cm 16.10 [70%] 0.2
Larger variation due to lack of information
35Probabilistic Performance-based Earthquake Engineering, University of Minho, Guimarães, Portugal, October 3-4, 2012
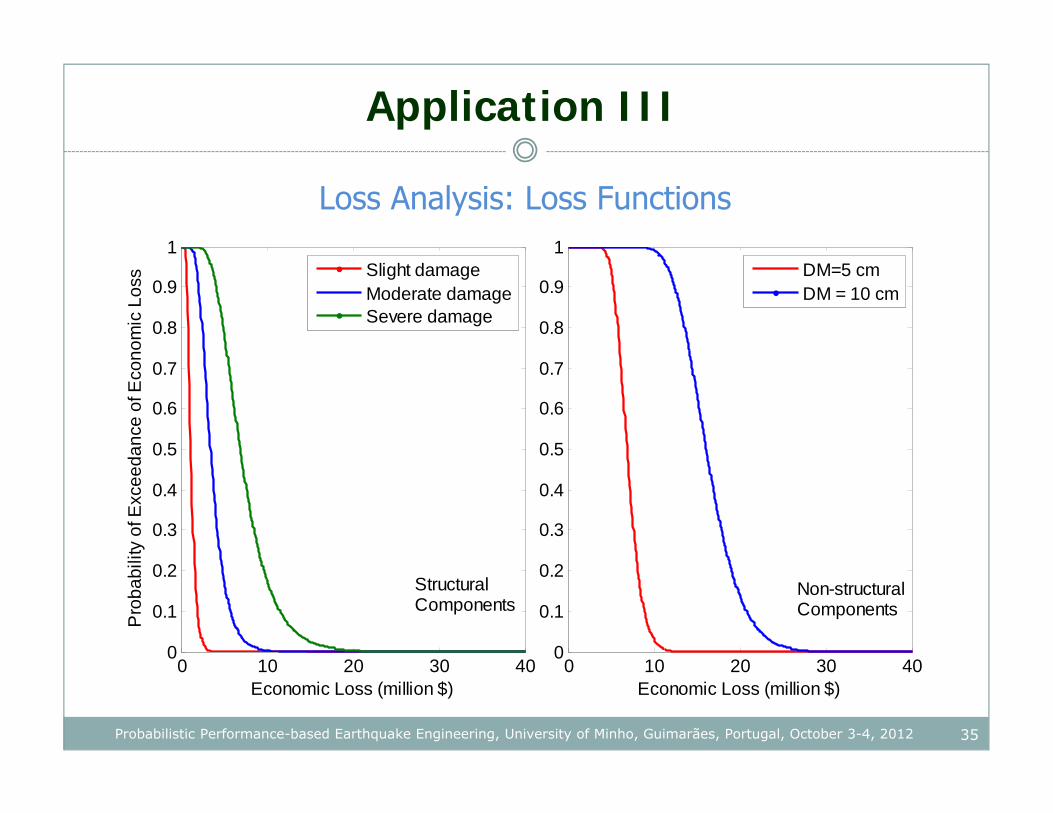
Application III
Loss Analysis: Loss Functions
0 10 20 30 400
0.1
0.2
0.3
0.4
0.5
0.6
0.7
0.8
0.9
1
Economic Loss (million $)
Pro
babi
lity
of E
xcee
danc
e of
Eco
nom
ic L
oss
Slight damageModerate damageSevere damage
0 10 20 30 400
0.1
0.2
0.3
0.4
0.5
0.6
0.7
0.8
0.9
1
Economic Loss (million $)
DM=5 cmDM = 10 cm
Non-structuralComponents
StructuralComponents
36Probabilistic Performance-based Earthquake Engineering, University of Minho, Guimarães, Portugal, October 3-4, 2012
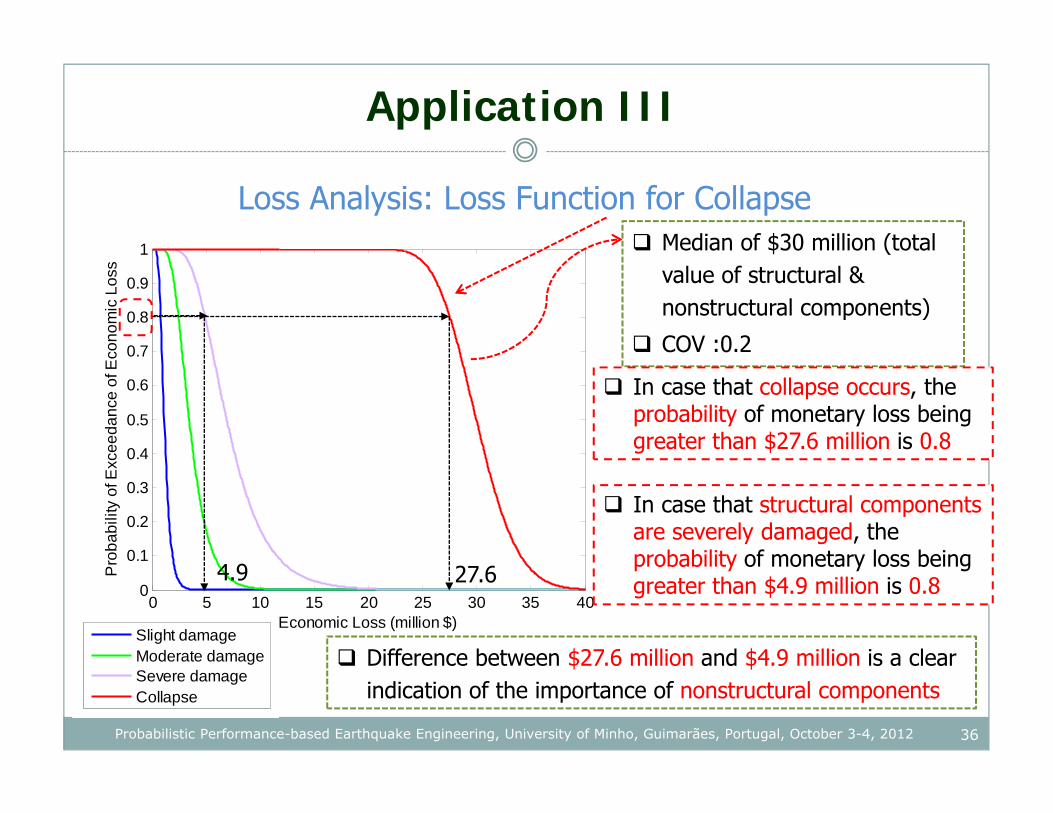
Application III
Loss Analysis: Loss Function for Collapse
0 5 10 15 20 25 30 35 400
0.1
0.2
0.3
0.4
0.5
0.6
0.7
0.8
0.9
1
Economic Loss (million $)
Pro
babi
lity
of E
xcee
danc
e of
Eco
nom
ic L
oss
Slight damageModerate damageSevere damageCollapse
Median of $30 million (total value of structural & nonstructural components)
COV :0.2
In case that collapse occurs, the probability of monetary loss being greater than $27.6 million is 0.8
Difference between $27.6 million and $4.9 million is a clear indication of the importance of nonstructural components
In case that structural components are severely damaged, the probability of monetary loss being greater than $4.9 million is 0.827.64.9
Application III
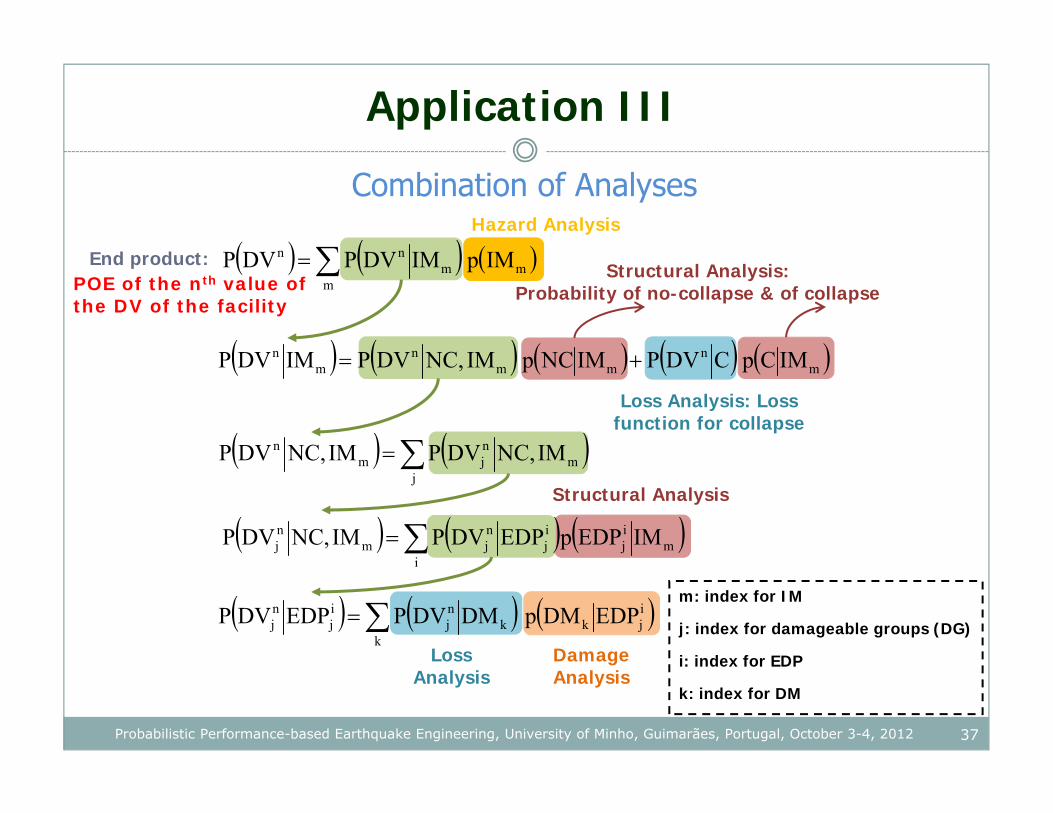
37Probabilistic Performance-based Earthquake Engineering, University of Minho, Guimarães, Portugal, October 3-4, 2012
j
mnjm
n IMNC,DVPIMNC,DVP
mn
mmn
mn IMCpCDVPIMNCpIMNC,DVPIMDVP
m
mmnn IMpIMDVPDVP
k
ijkk
nj
ij
nj EDPDMpDMDVPEDPDVP
i
mij
ij
njm
nj IMEDPpEDPDVPIMNC,DVP
End product: Structural Analysis:
Probability of no-collapse & of collapse
Loss Analysis: Loss function for collapse
m: index for IM
j: index for damageable groups (DG)
i: index for EDP
k: index for DM
Structural Analysis
Hazard Analysis
Loss Analysis
Damage Analysis
POE of the nth value ofthe DV of the facility
Combination of Analyses
38Probabilistic Performance-based Earthquake Engineering, University of Minho, Guimarães, Portugal, October 3-4, 2012
Application III
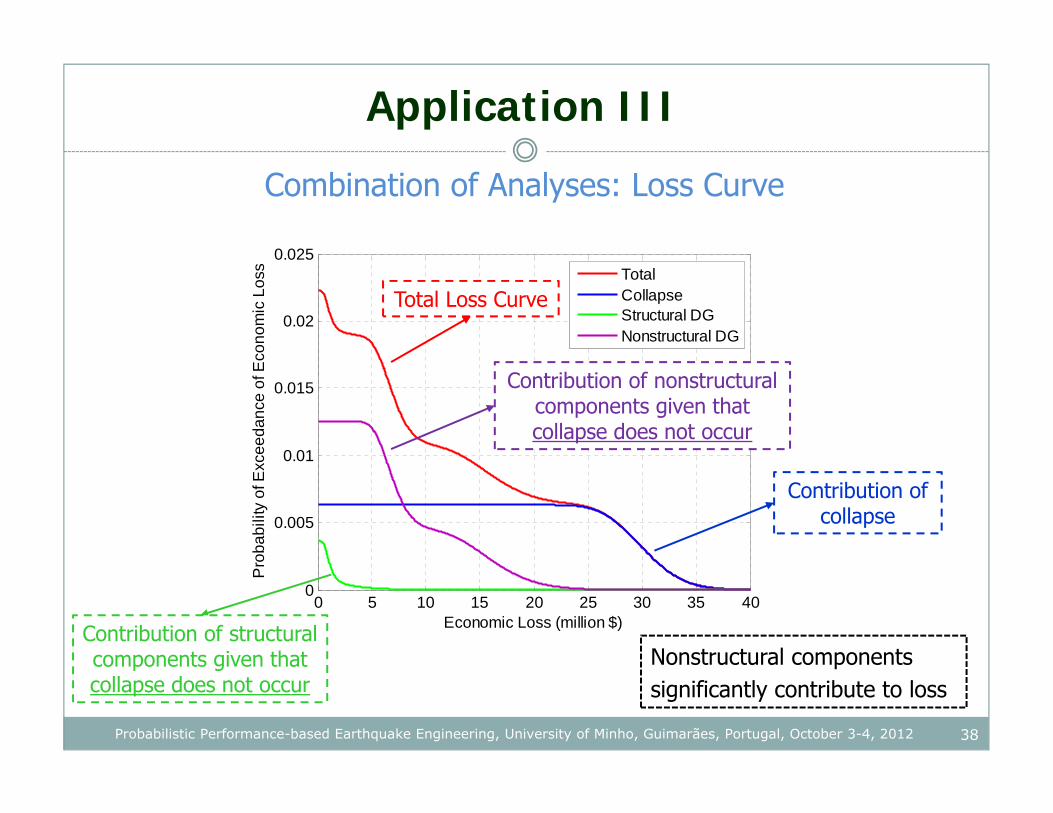
Combination of Analyses: Loss Curve
0 5 10 15 20 25 30 35 400
0.005
0.01
0.015
0.02
0.025
Economic Loss (million $)
Pro
babi
lity
of E
xcee
danc
e of
Eco
nom
ic L
oss
TotalCollapseStructural DGNonstructural DG
Total Loss Curve
Contribution of nonstructural components given that collapse does not occur
Contribution of structural components given that collapse does not occur
Contribution of collapse
Nonstructural components significantly contribute to loss
Application III
39Probabilistic Performance-based Earthquake Engineering, University of Minho, Guimarães, Portugal, October 3-4, 2012
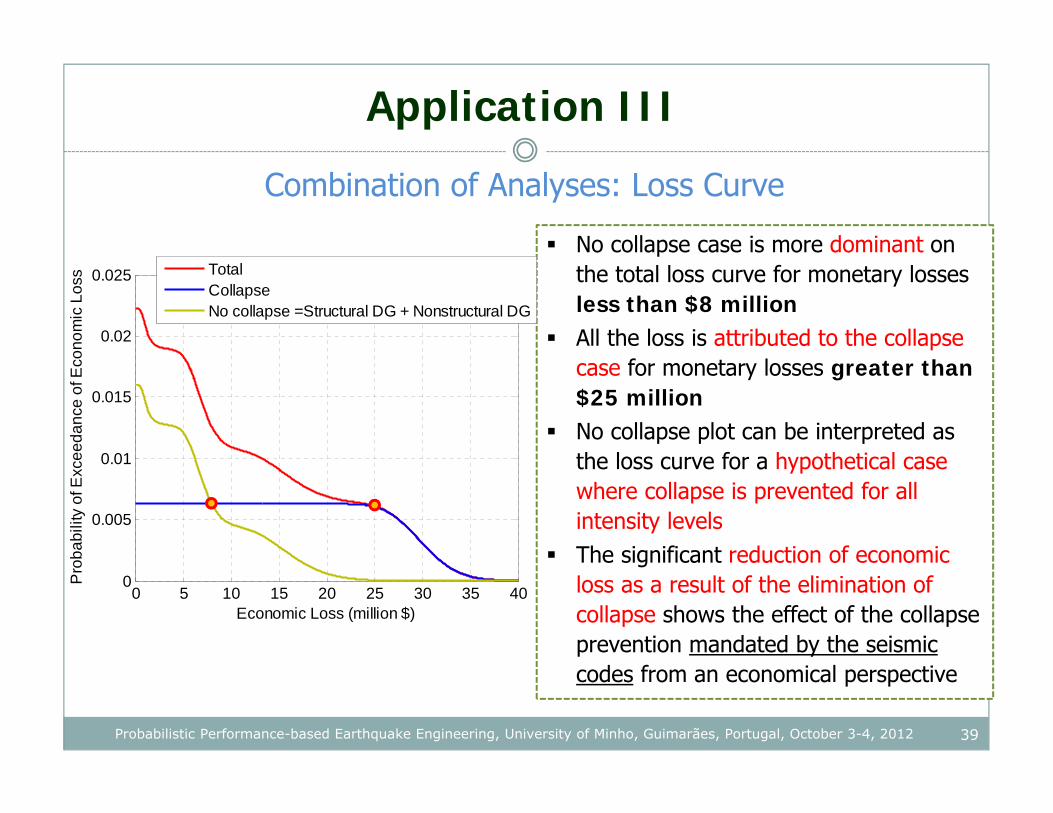
Combination of Analyses: Loss Curve
No collapse case is more dominant on the total loss curve for monetary losses less than $8 million
All the loss is attributed to the collapse case for monetary losses greater than $25 million
No collapse plot can be interpreted as the loss curve for a hypothetical case where collapse is prevented for all intensity levels
The significant reduction of economic loss as a result of the elimination of collapse shows the effect of the collapse prevention mandated by the seismic codes from an economical perspective
0 5 10 15 20 25 30 35 400
0.005
0.01
0.015
0.02
0.025
Economic Loss (million $)
Pro
babi
lity
of E
xcee
danc
e of
Eco
nom
ic L
oss
TotalCollapseNo collapse =Structural DG + Nonstructural DG
Application II
40Probabilistic Performance-based Earthquake Engineering, University of Minho, Guimarães, Portugal, October 3-4, 2012
Evaluation of the Seismic Response of Structural Insulated Panels with Probabilistic PBEE (in progress)
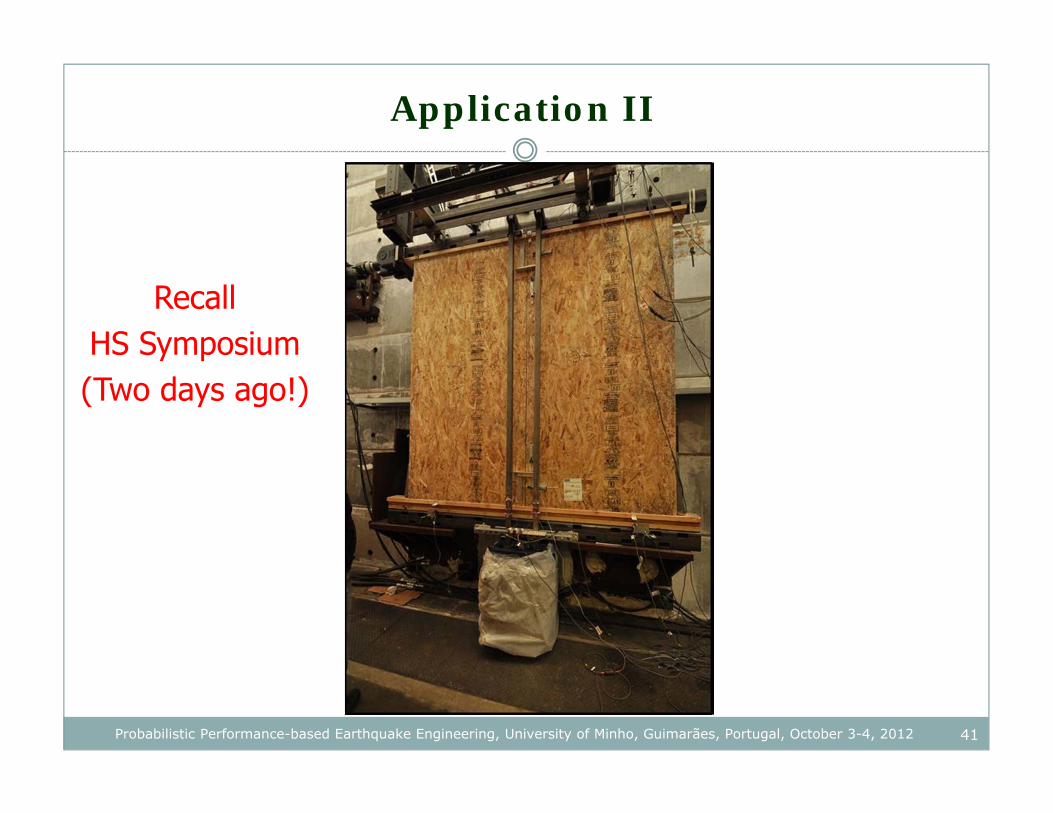
Application II
RecallHS Symposium (Two days ago!)
41Probabilistic Performance-based Earthquake Engineering, University of Minho, Guimarães, Portugal, October 3-4, 2012
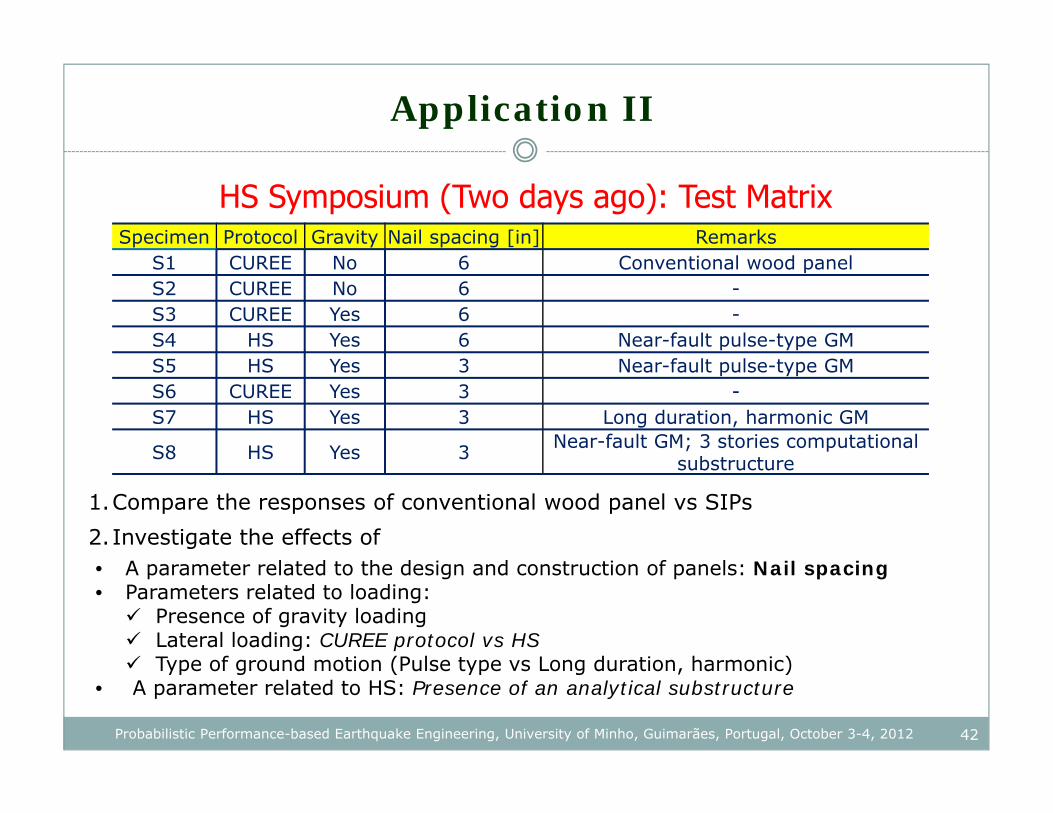
Application II
Specimen Protocol Gravity Nail spacing [in] RemarksS1 CUREE No 6 Conventional wood panelS2 CUREE No 6 -S3 CUREE Yes 6 -S4 HS Yes 6 Near-fault pulse-type GMS5 HS Yes 3 Near-fault pulse-type GMS6 CUREE Yes 3 -S7 HS Yes 3 Long duration, harmonic GM
S8 HS Yes 3 Near-fault GM; 3 stories computational substructure
• A parameter related to the design and construction of panels: Nail spacing• Parameters related to loading: Presence of gravity loading Lateral loading: CUREE protocol vs HS Type of ground motion (Pulse type vs Long duration, harmonic)
• A parameter related to HS: Presence of an analytical substructure
2.Investigate the effects of1.Compare the responses of conventional wood panel vs SIPs
HS Symposium (Two days ago): Test Matrix
42Probabilistic Performance-based Earthquake Engineering, University of Minho, Guimarães, Portugal, October 3-4, 2012
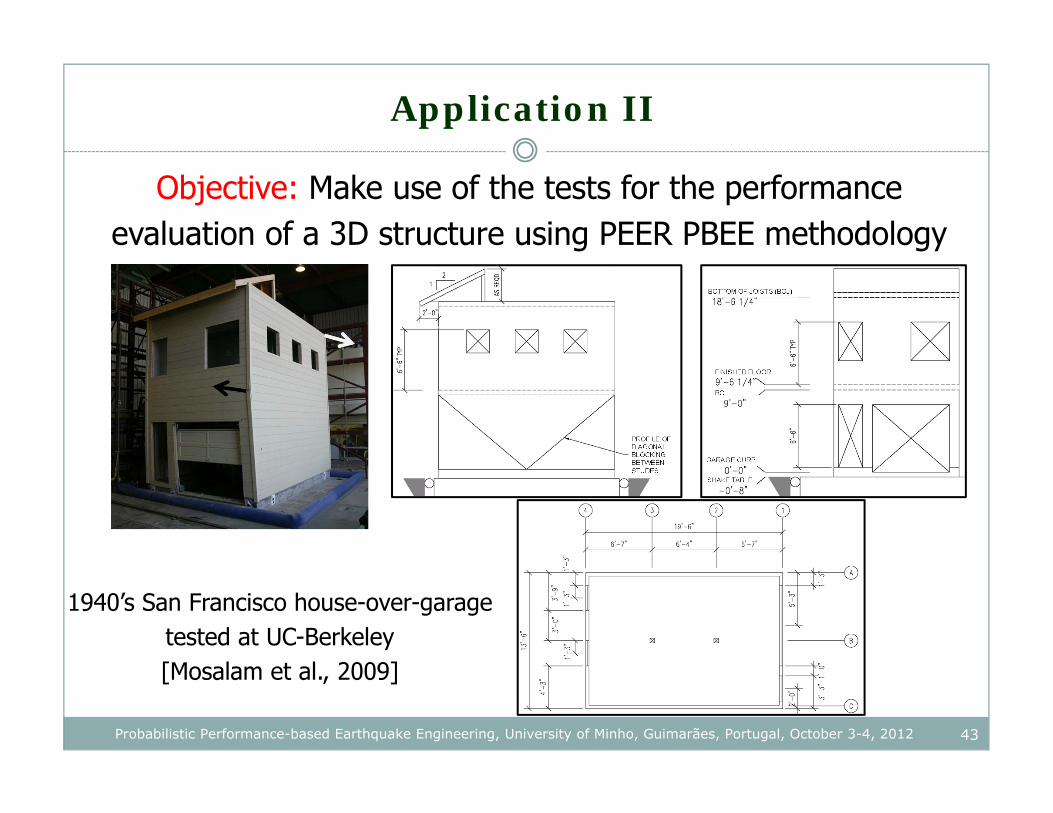
Application II
Objective: Make use of the tests for the performance evaluation of a 3D structure using PEER PBEE methodology
1940’s San Francisco house-over-garage tested at UC-Berkeley [Mosalam et al., 2009]
43Probabilistic Performance-based Earthquake Engineering, University of Minho, Guimarães, Portugal, October 3-4, 2012
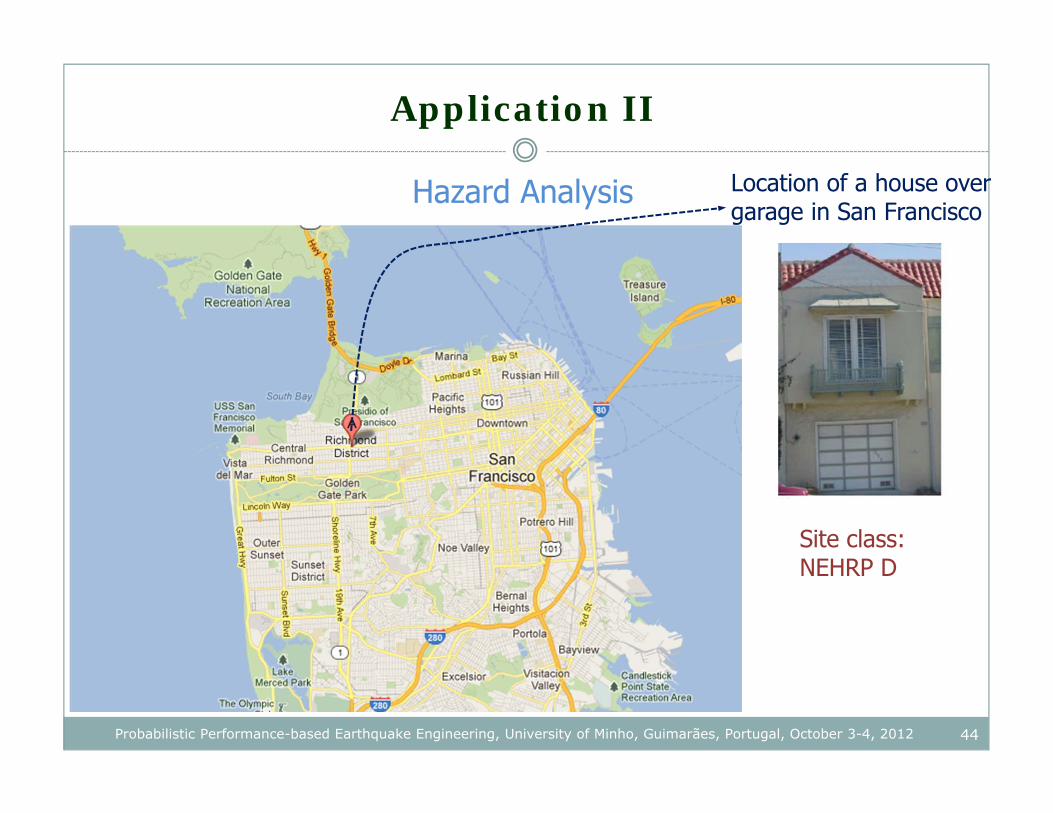
Application II
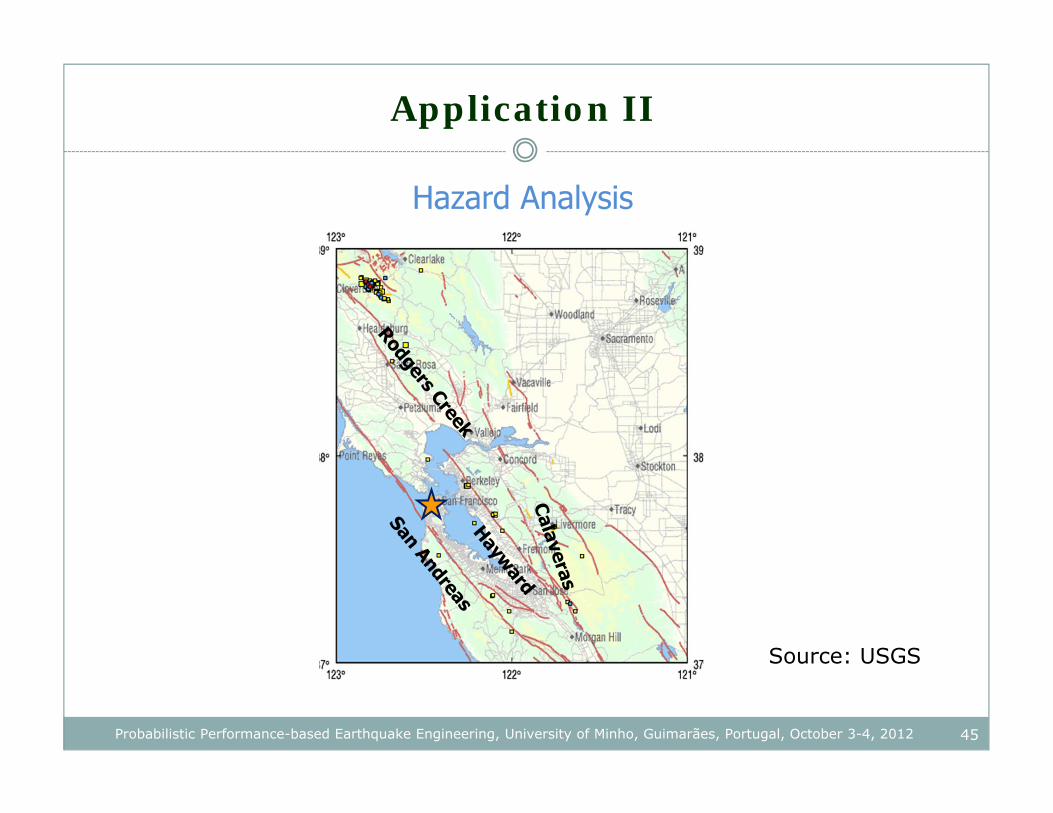
Hazard Analysis Location of a house over garage in San Francisco
Site class: NEHRP D
44Probabilistic Performance-based Earthquake Engineering, University of Minho, Guimarães, Portugal, October 3-4, 2012
Application II
45Probabilistic Performance-based Earthquake Engineering, University of Minho, Guimarães, Portugal, October 3-4, 2012
Source: USGS
Hazard Analysis
Application II
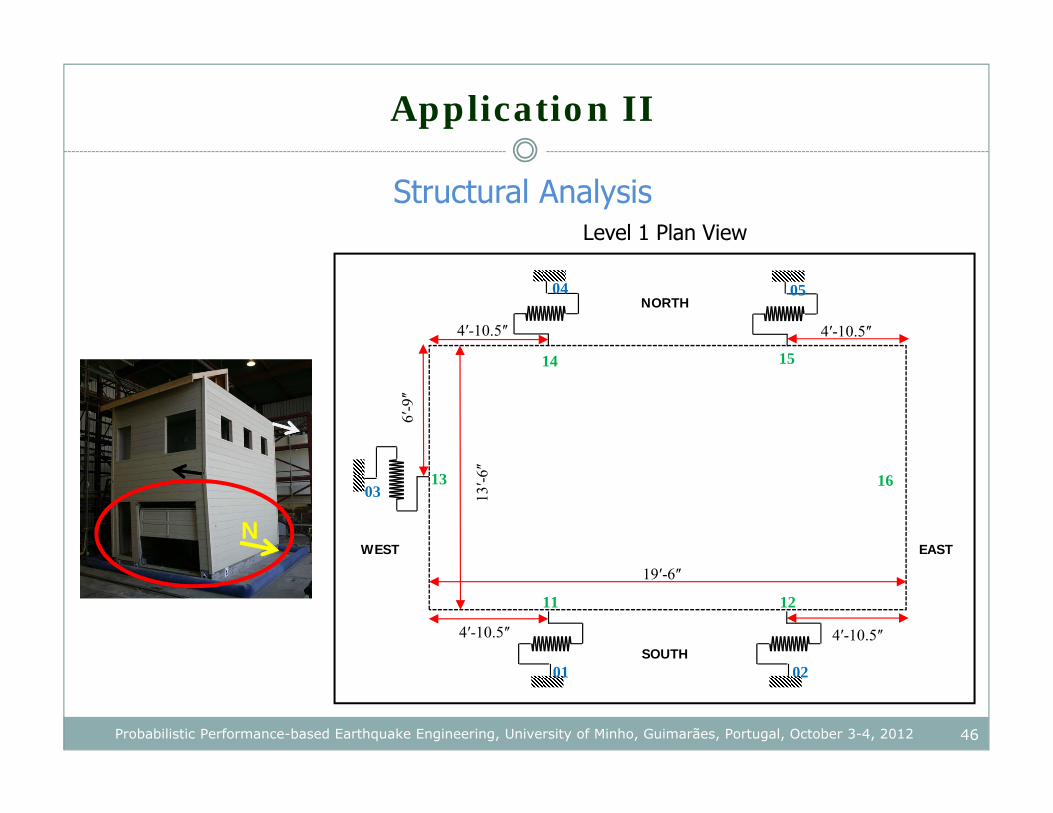
Structural Analysis
46Probabilistic Performance-based Earthquake Engineering, University of Minho, Guimarães, Portugal, October 3-4, 2012
N
Level 1 Plan View
19ʹ-6ʺ
4ʹ-10.5ʺ
13ʹ-6ʺ
6ʹ-9ʺ
4ʹ-10.5ʺ
4ʹ-10.5ʺ4ʹ-10.5ʺ
01 02
03
04 05
11 12
13
14 15
16
NORTH
SOUTH
WEST EAST
Application II
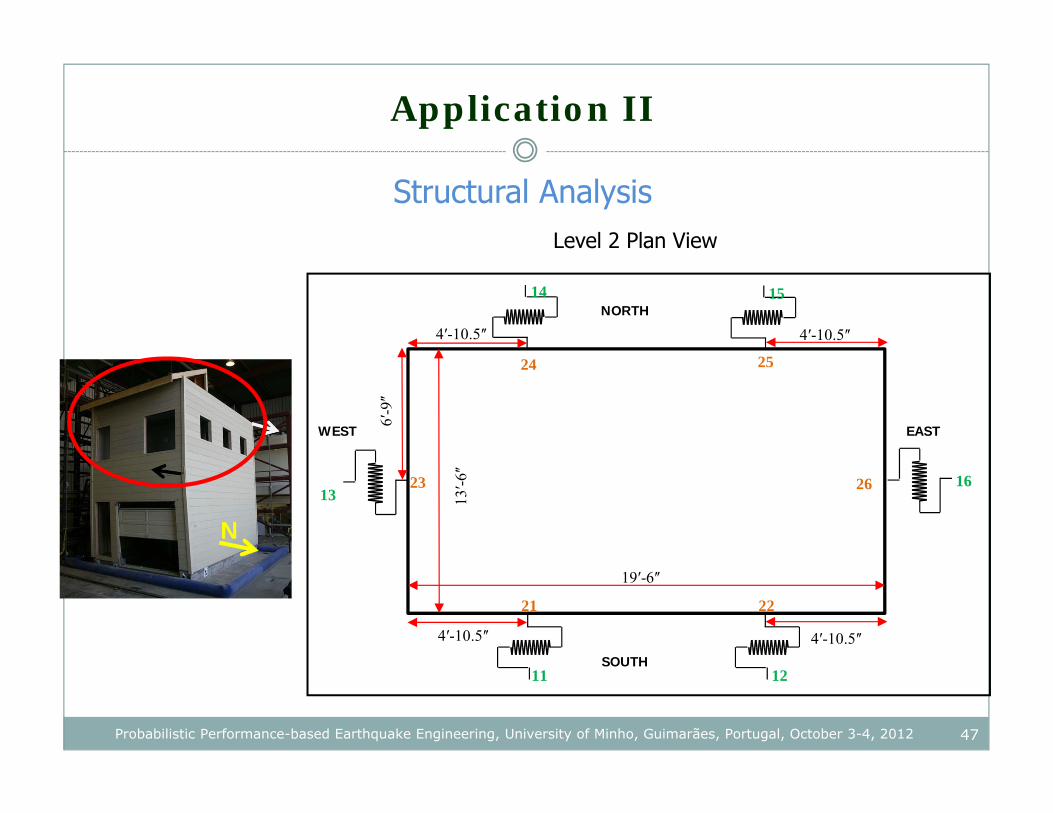
Structural Analysis
47Probabilistic Performance-based Earthquake Engineering, University of Minho, Guimarães, Portugal, October 3-4, 2012
19ʹ-6ʺ
4ʹ-10.5ʺ
13ʹ-6ʺ
6ʹ-9ʺ
4ʹ-10.5ʺ
4ʹ-10.5ʺ4ʹ-10.5ʺ
11 12
13
14 15
21 22
23
24 25
26 16
NORTH
SOUTH
WEST
Level 2 Plan View
EAST
N
Application II
Structural Analysis
48Probabilistic Performance-based Earthquake Engineering, University of Minho, Guimarães, Portugal, October 3-4, 2012
19ʹ-6ʺ
4ʹ-10.5ʺ
13ʹ-6ʺ
6ʹ-9ʺ
4ʹ-10.5ʺ
4ʹ-10.5ʺ4ʹ-10.5ʺ
01 02
03
04 05
11 12
13
14 15
16
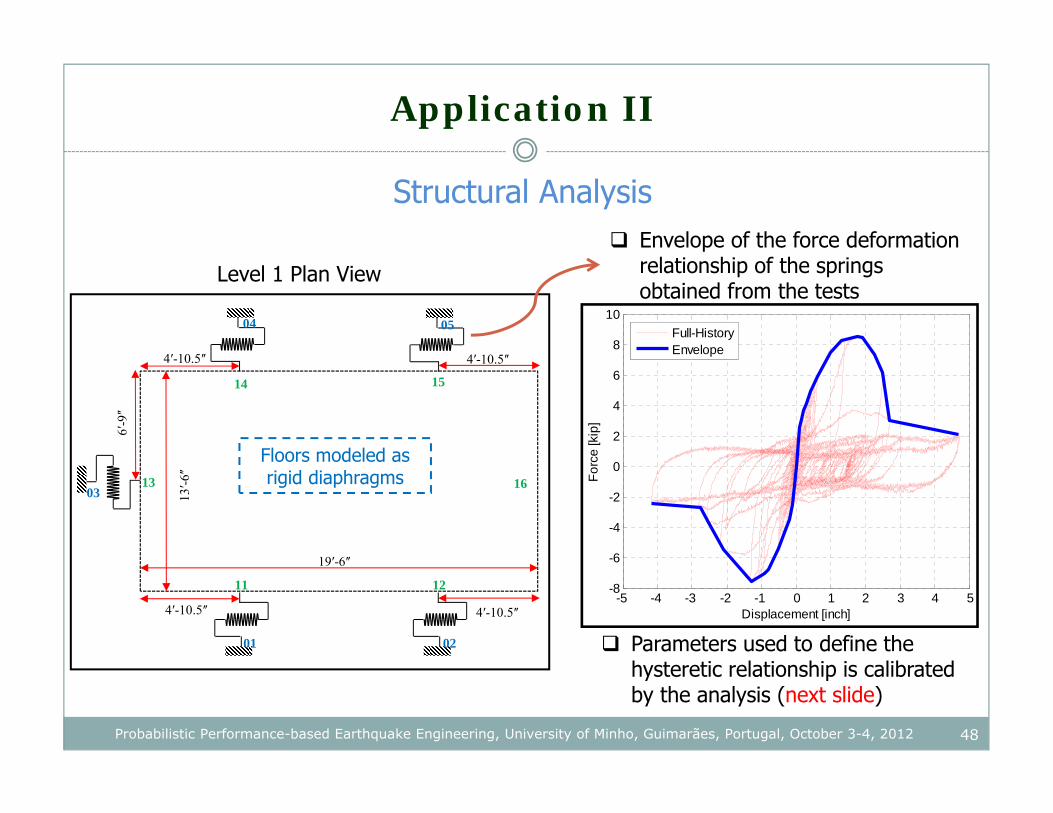
Level 1 Plan View
Floors modeled as rigid diaphragms
Envelope of the force deformation relationship of the springs obtained from the tests
-5 -4 -3 -2 -1 0 1 2 3 4 5-8
-6
-4
-2
0
2
4
6
8
10
Displacement [inch]Fo
rce
[kip
]
Full-HistoryEnvelope
Parameters used to define the hysteretic relationship is calibrated by the analysis (next slide)
Application II
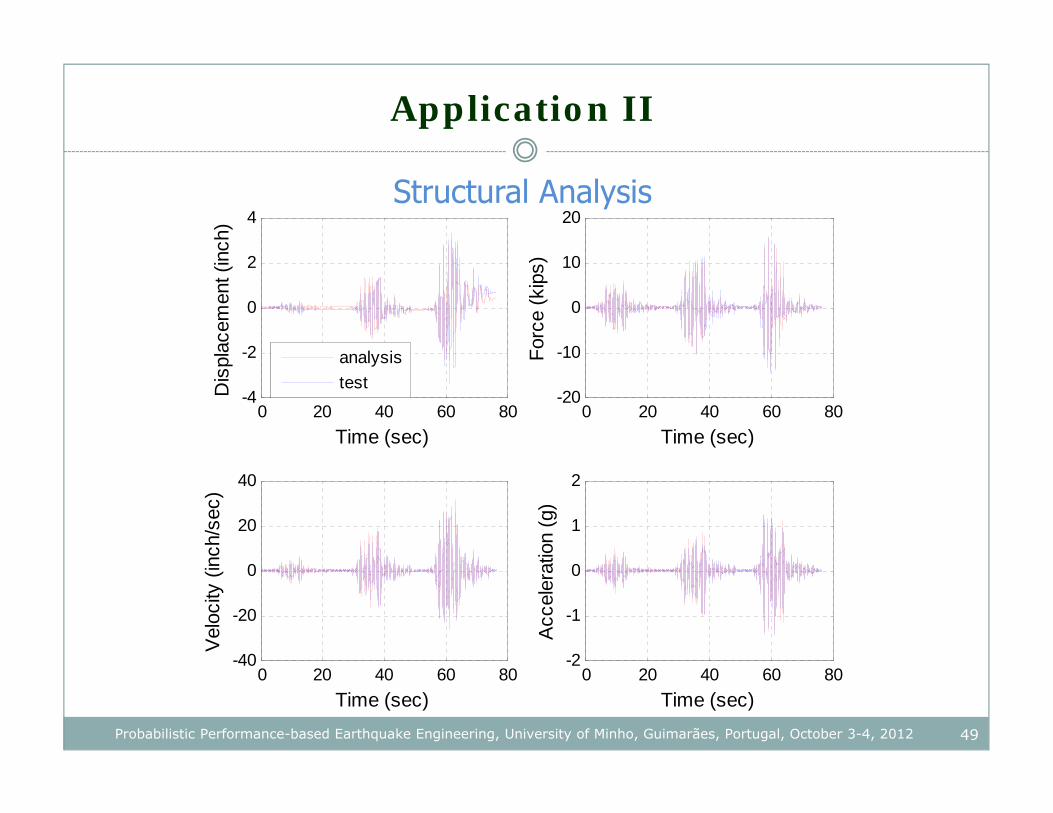
Structural Analysis
49Probabilistic Performance-based Earthquake Engineering, University of Minho, Guimarães, Portugal, October 3-4, 2012
0 20 40 60 80-4
-2
0
2
4
Time (sec)
Dis
plac
emen
t (in
ch)
0 20 40 60 80-20
-10
0
10
20
Time (sec)
Forc
e (k
ips)
0 20 40 60 80-40
-20
0
20
40
Time (sec)
Vel
ocity
(inc
h/se
c)
0 20 40 60 80-2
-1
0
1
2
Time (sec)
Acc
eler
atio
n (g
)
analysistest
Application II
Structural Analysis
50Probabilistic Performance-based Earthquake Engineering, University of Minho, Guimarães, Portugal, October 3-4, 2012
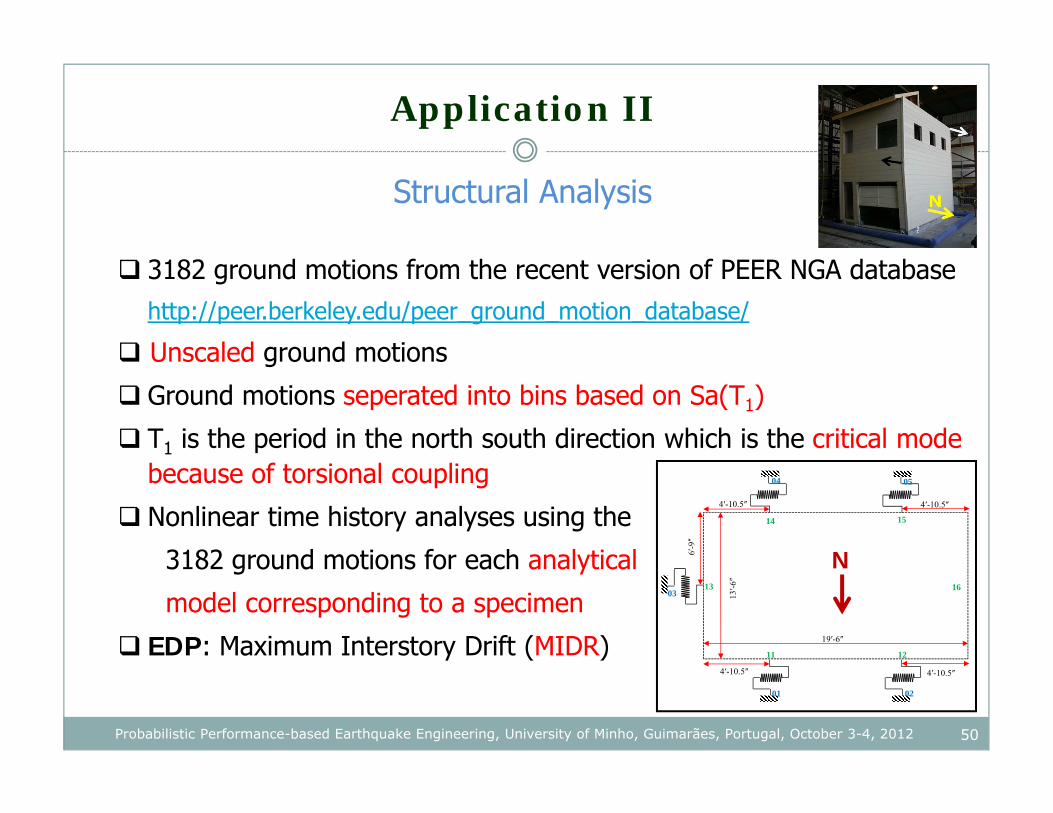
3182 ground motions from the recent version of PEER NGA databasehttp://peer.berkeley.edu/peer_ground_motion_database/
Unscaled ground motions
Ground motions seperated into bins based on Sa(T1)
T1 is the period in the north south direction which is the critical mode because of torsional coupling
Nonlinear time history analyses using the
3182 ground motions for each analytical
model corresponding to a specimen
EDP: Maximum Interstory Drift (MIDR)
N
19ʹ-6ʺ
4ʹ-10.5ʺ
13ʹ-6ʺ
6ʹ-9ʺ
4ʹ-10.5ʺ
4ʹ-10.5ʺ4ʹ-10.5ʺ
01 02
03
04 05
11 12
13
14 15
16
Application II
Damage Analysis
51Probabilistic Performance-based Earthquake Engineering, University of Minho, Guimarães, Portugal, October 3-4, 2012
Forc
e
Displacement
Light
Moderate Severe
Collapse
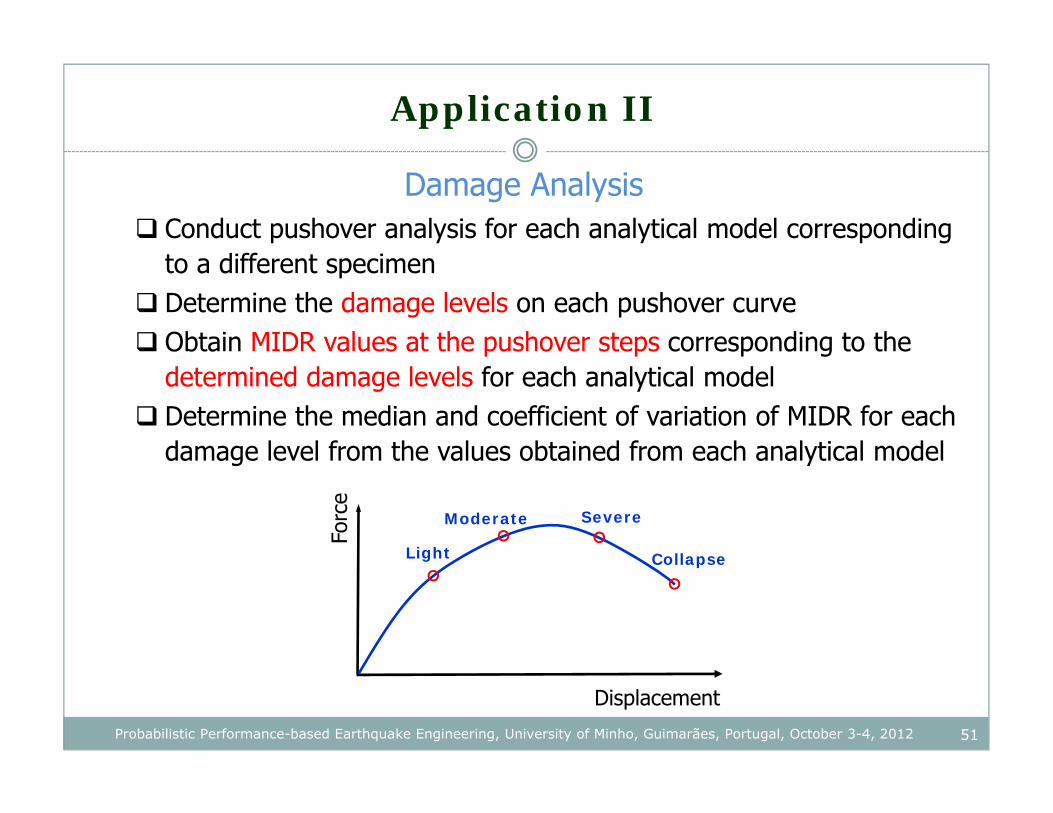
Conduct pushover analysis for each analytical model corresponding to a different specimen
Determine the damage levels on each pushover curve Obtain MIDR values at the pushover steps corresponding to the
determined damage levels for each analytical model Determine the median and coefficient of variation of MIDR for each
damage level from the values obtained from each analytical model
Application II
Loss Analysis
52Probabilistic Performance-based Earthquake Engineering, University of Minho, Guimarães, Portugal, October 3-4, 2012
Determine the median value of loss corresponding to each damage
level as a percentage of total value of the building
Determine the corresponding coefficient of variation
Obtain the loss curves from a probabilistic distribution

53
Thank you
Workshop on Fragility of Electrical Equipment and Components, RFS, UC Berkeley, June 21, 2012