pro isle of palms marina pro forma financial analysis forma financial analysis isle of palms marina...
TRANSCRIPT
Pro Forma Financial Analysis Isle of Palms Marina
ProFormaFinancialAnalysisFortheIsleofPalmsMarina
Isle of Palms, South Carolina
Prepared by: Applied Technology & Management, Inc. 941 Houston Northcutt Boulevard, Suite 201 Mount Pleasant, South Carolina 29464 (843) 414‐1040 www.appliedtm.com
Pro Forma Financial Analysis Isle of Palms Marina
i
Table of Contents
Introduction 1
Pro Forma Financial Analysis 2
Financial Spreadsheets 2
Analysis 4
Summary/Conclusions 6
Pro Forma Financial Analysis Isle of Palms Marina
1
Introduction
As part of the comprehensive redevelopment master plan study for the Isle of Palms Marina site, Applied
Technology & Management, Inc. (ATM) adapted our proprietary marina pro forma financial model to both
site redevelopment scenarios. The goal of this financial analysis was to determine the general financial
feasibility of the project. It is assumed that this initial model will provide baseline financial information
for discussion. As part of our contracted scope, ATM will apply the iteratively for up to two (2)
modifications of the proposed plans/financing approach.
Pro Forma Financial Analysis Isle of Palms Marina
2
Pro Forma Financial Analysis
Financial Spreadsheets
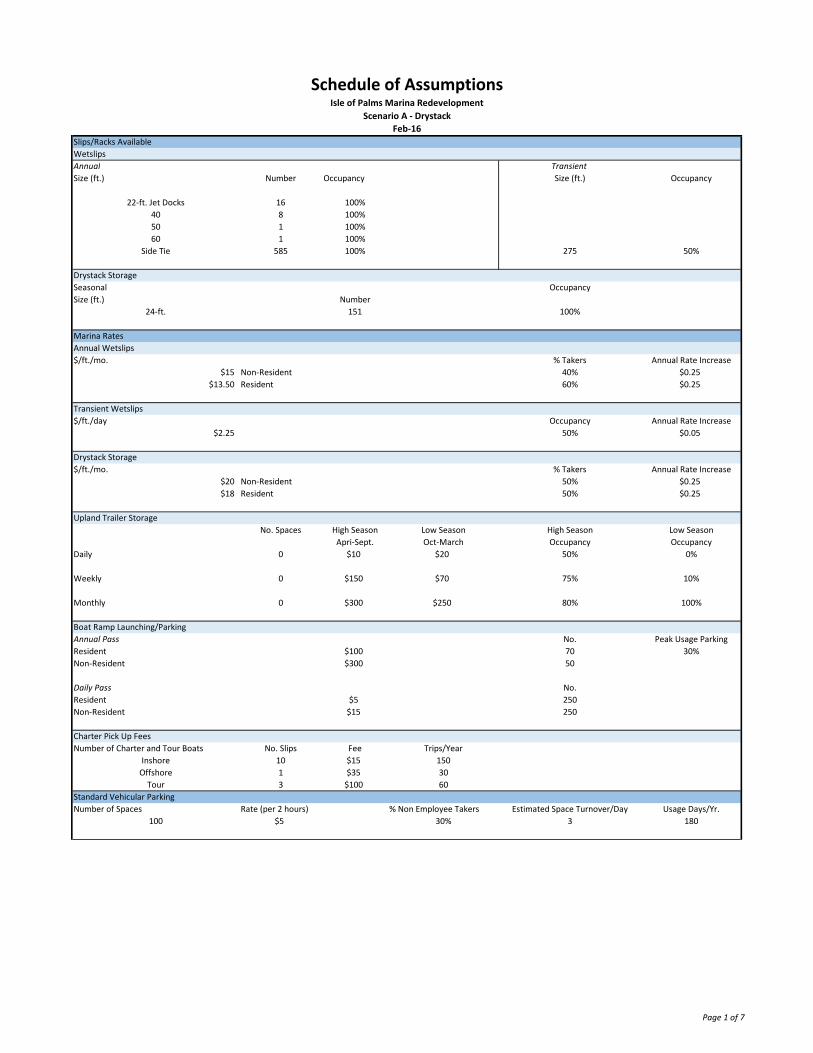
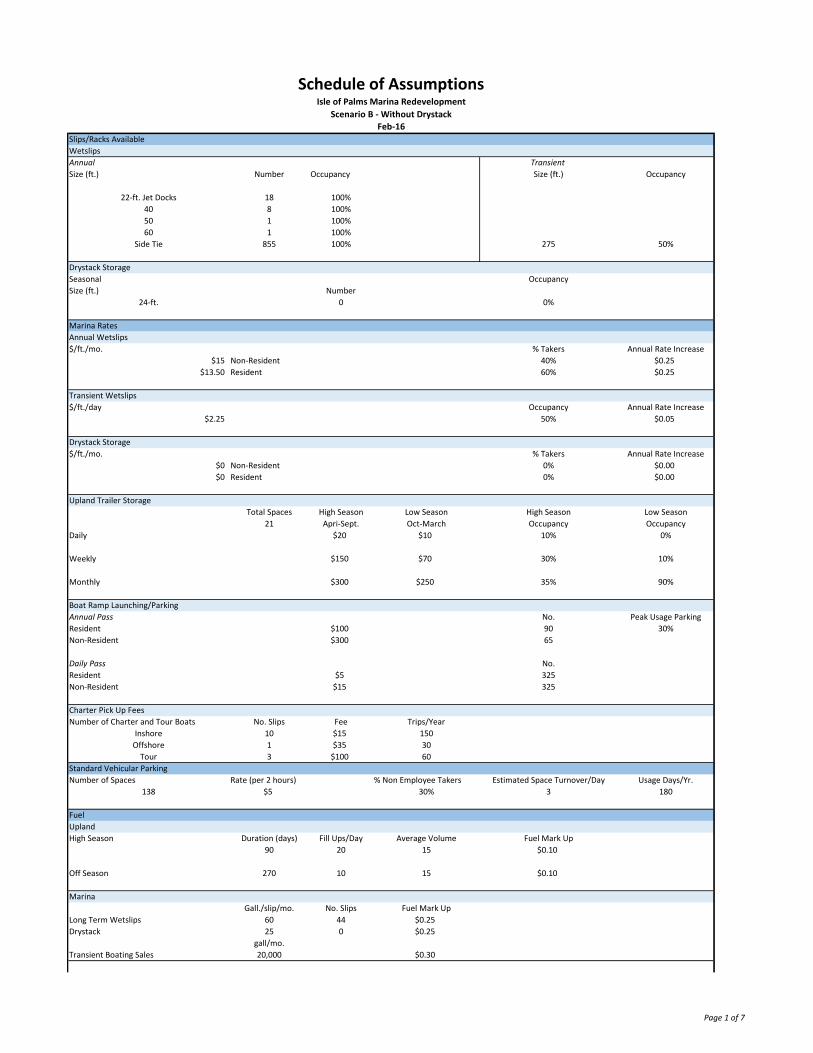
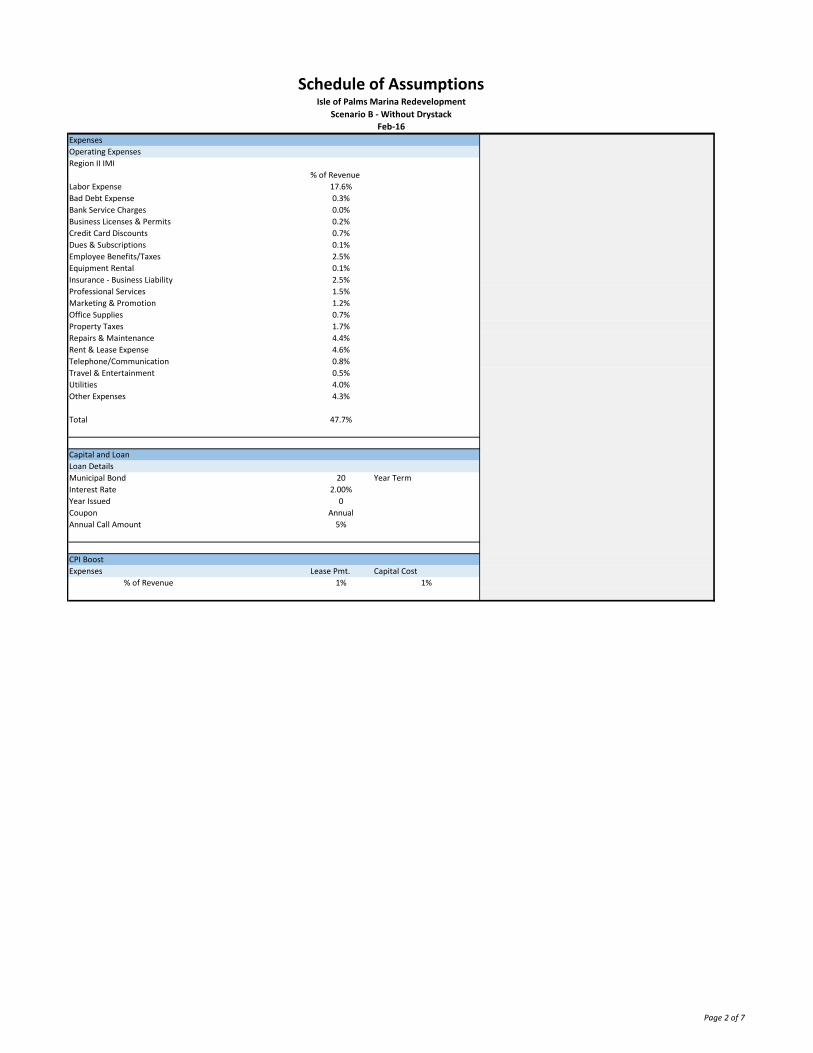
ScheduleofAssumptionsThis page represents the basis for the financial analysis. Assumptions for key project elements are
shown and carry through the rest of the analysis. These are based upon our previous feasibility and
planning efforts, International Marina Institute (IMI) data, and our experience in the industry.
The following discussion details the specifics of the Schedule of Assumptions:
Slips/Racks Available – This information is taken from the proposed marina plan and previous analysis
efforts.
Available slip/rack space is per concept plan
Occupancy shown at 100% for long‐term slips per market analysis findings
Occupancy for transient boating slips shown at 50%
Rates and distribution of slip takers is as per market analysis
Upland trailer storages are shown as per plan.
Zero spaces in Scenario A (with drystack)
Rates and occupancy as per market research and discussions with current marina operator
Boat Ramp Launching/Parking rates are as per market research. Number of passes estimated based on
available trailer parking spaces.
Charter pick up fees are as per market analysis and number of charter slips assumed in plans.
Vehicular Parking assumptions are made as per plans, market research, and anticipated usage.
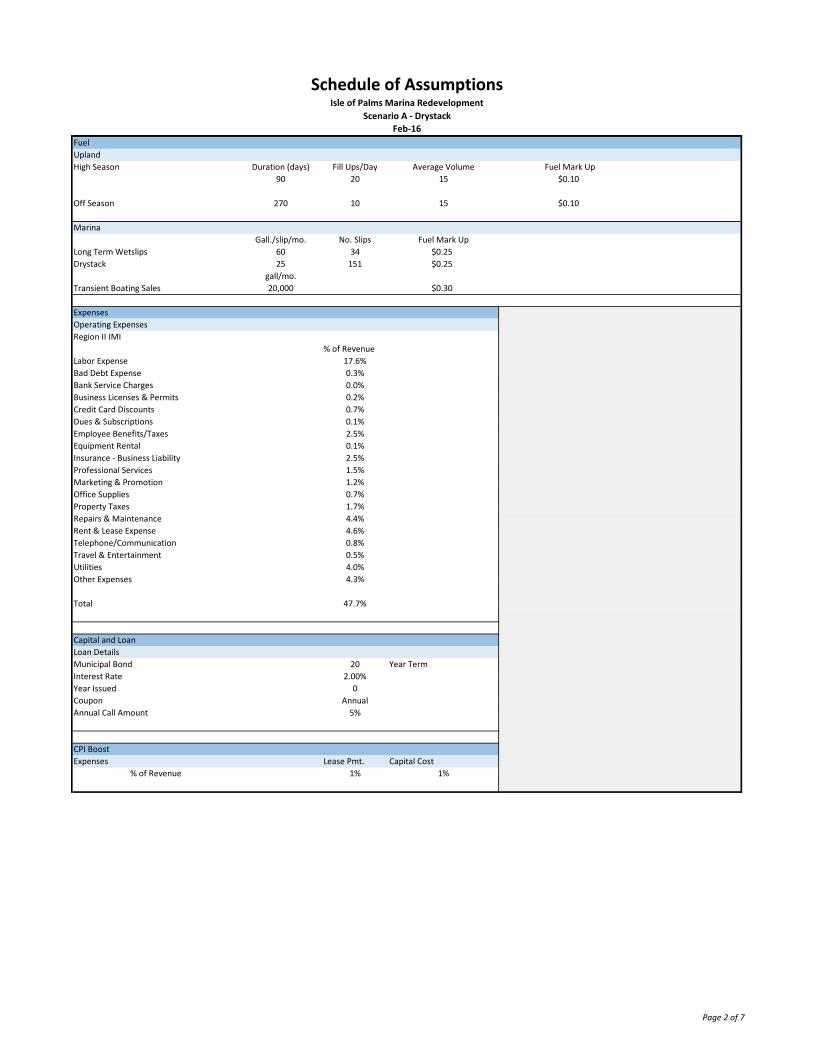
Fuel Sales assumptions are as per intended use and ATM’s experience in the industry, noting our upland
fuel sales experience is limited and historic sales data for the subject facility was not available at the
time of this analysis.
Operating Expenses are estimated using benchmark data published by the International Marina Institute
for Region II (Southeast US) marina facilities.
Capital and Loan details were suggested by the City of Isle of Palms and presented in a simplified
manner.
CPI Boost applies to the current marina operator’s lease terms.
Pro Forma Financial Analysis Isle of Palms Marina
3
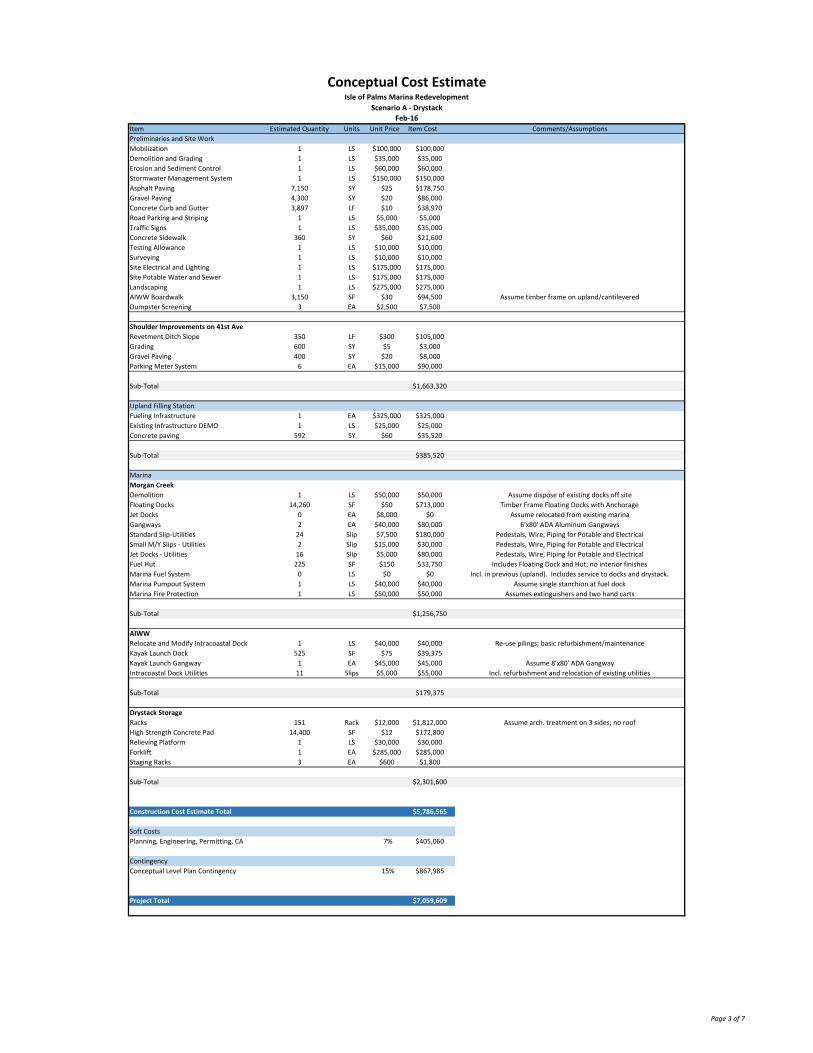
ConceptualCostEstimateThis line‐item, unit‐cost estimate is based on the provided marina site plans and the ATM team’s
experience in the marina and waterfront development industry.
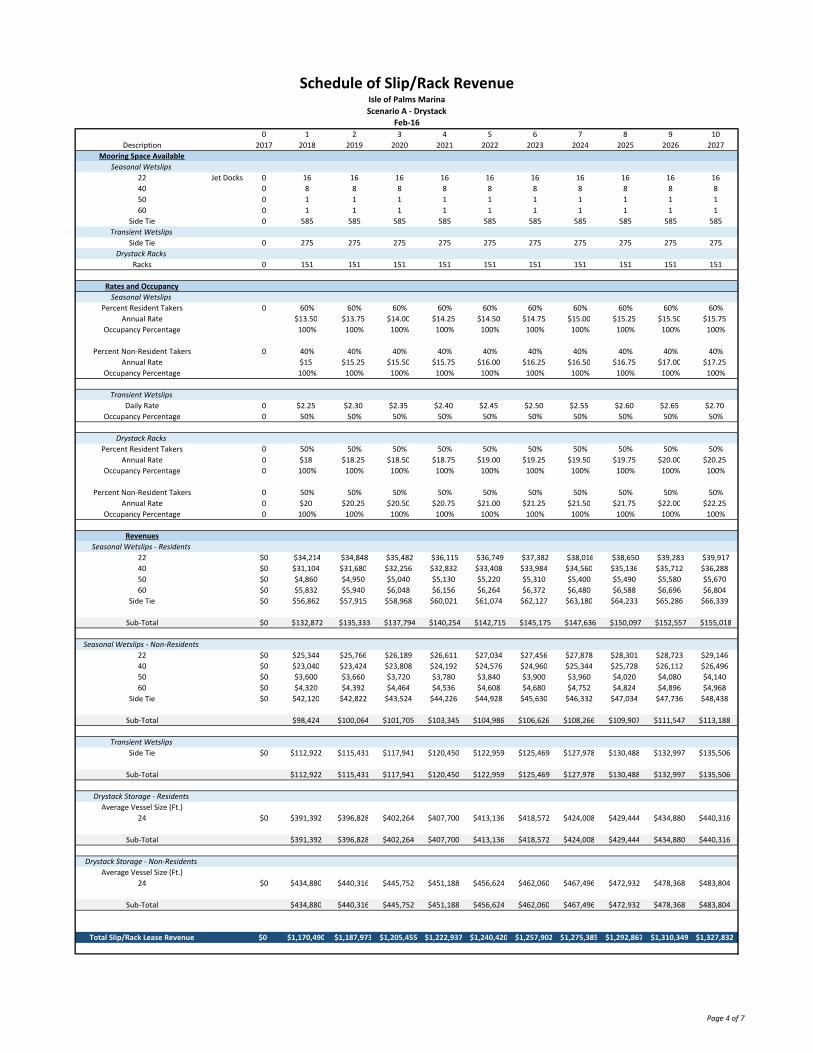
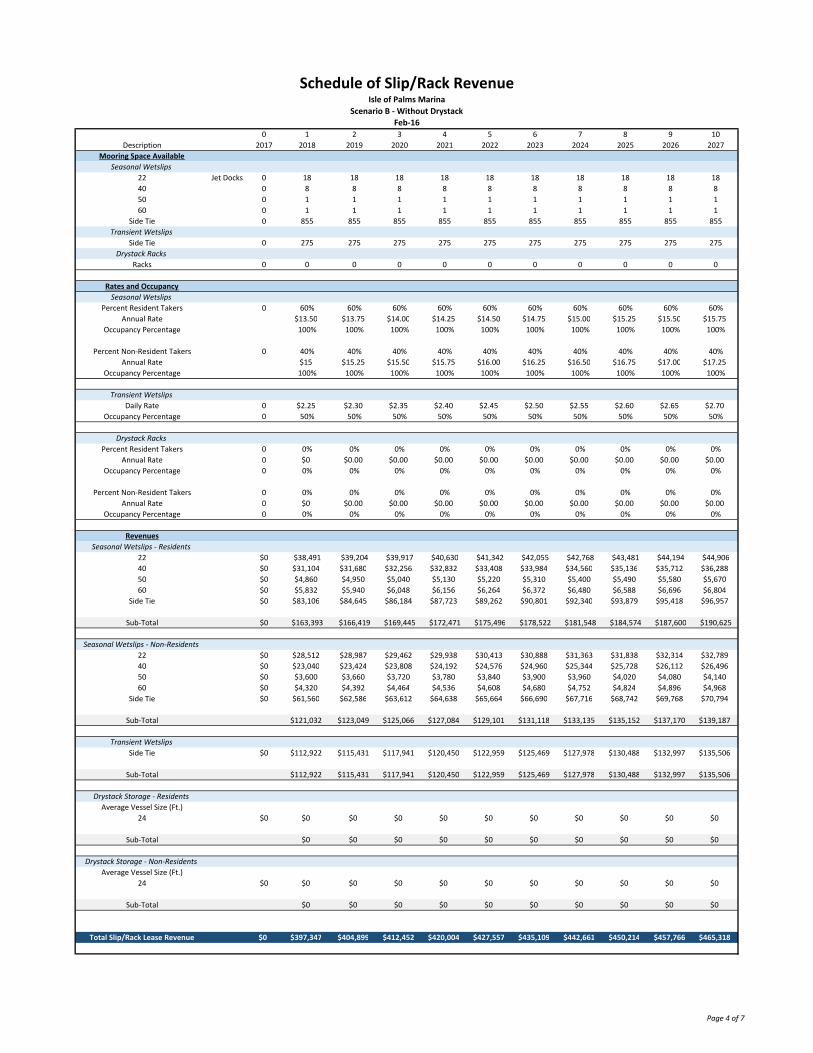
ScheduleofSlip/RackRevenuesThis schedule details anticipated revenues from the various slips and drystack storage racks in each plan.
Rates, occupancy, and other information is sourced from the schedule of assumptions and projected
over a 10‐year period.
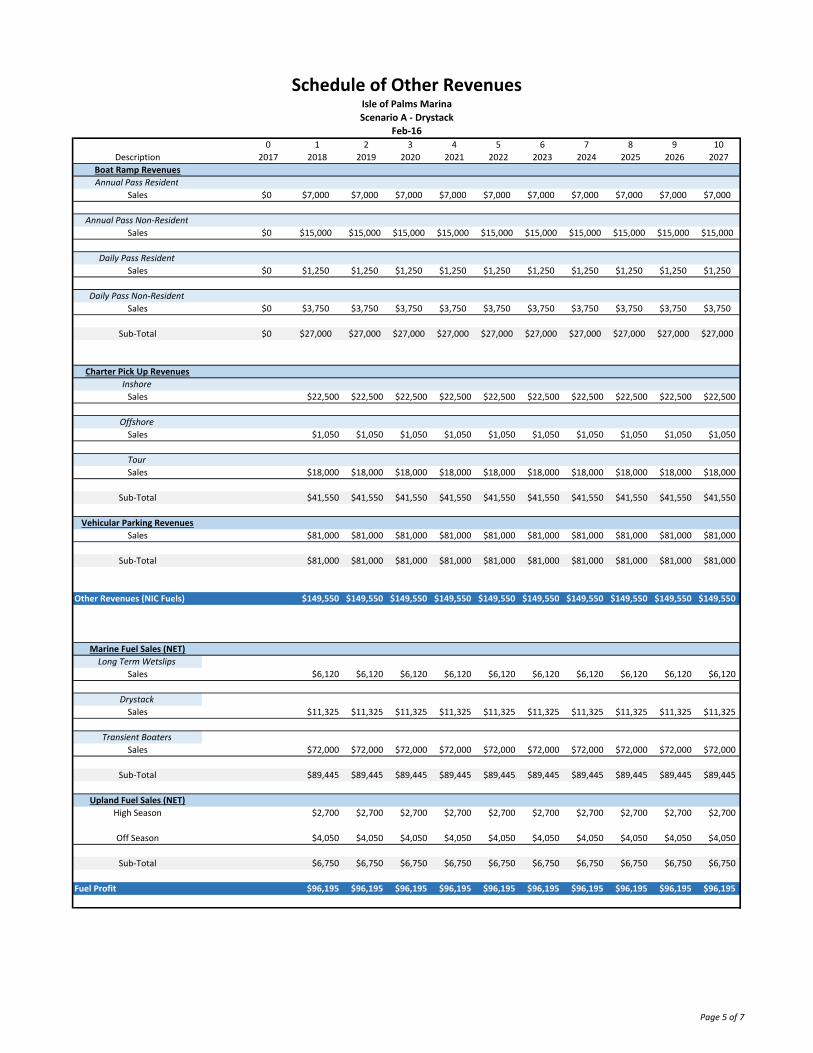
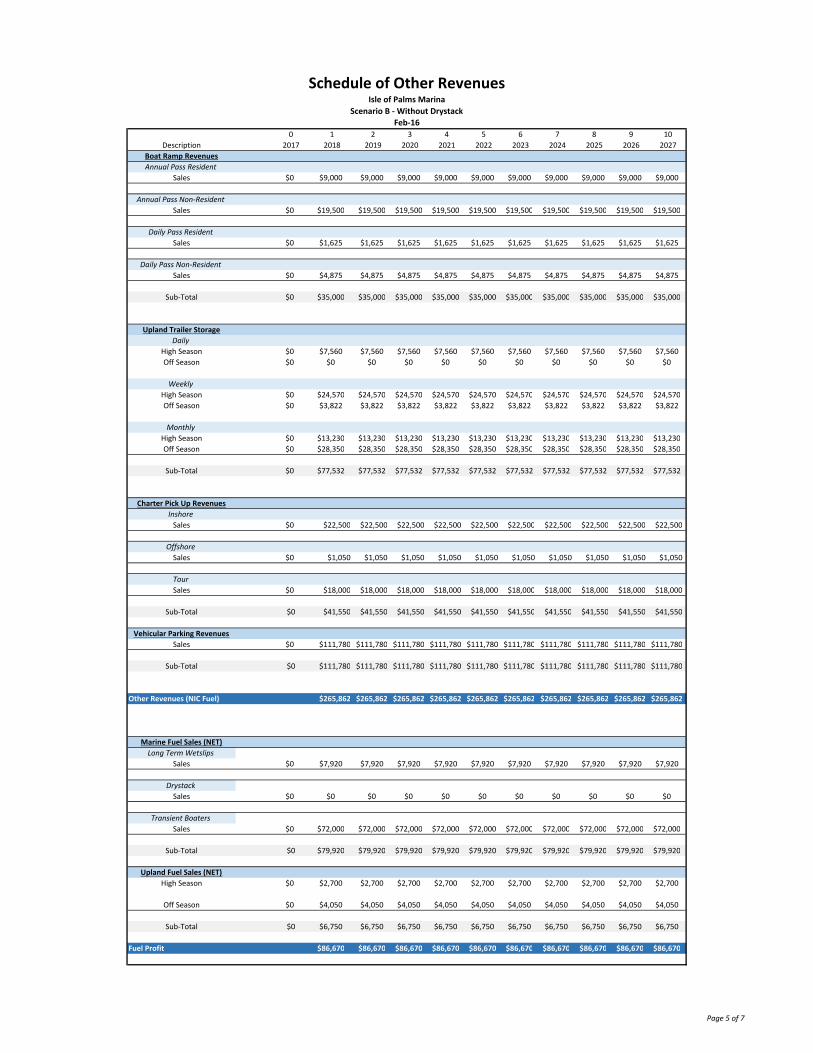
ScheduleofOtherRevenuesThis schedule includes projections for a variety of ancillary revenue streams at the subject site,
including:
Boat Ramp Fees
Charter Pick Up Fees
Vehicular Parking
Fuel Sales
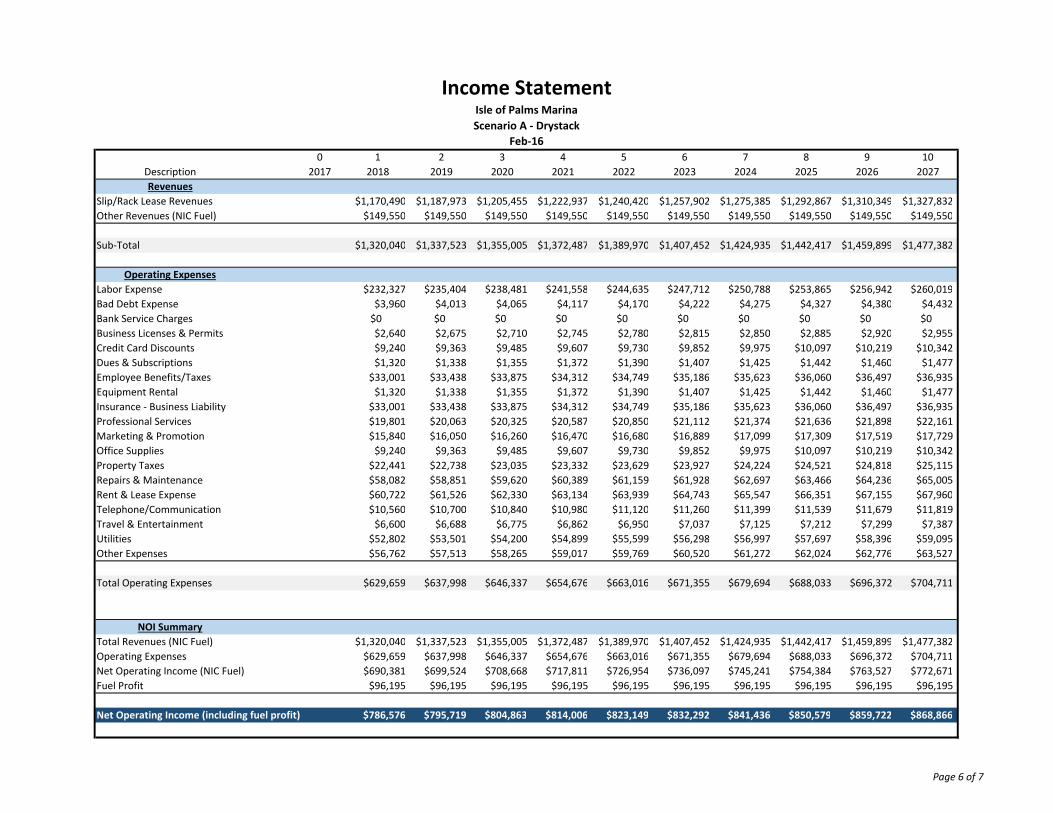
IncomeStatementThis sheet combines revenue and expense projections over a 10‐year period to arrive at annual
estimates of Net Operating Income (NOI).
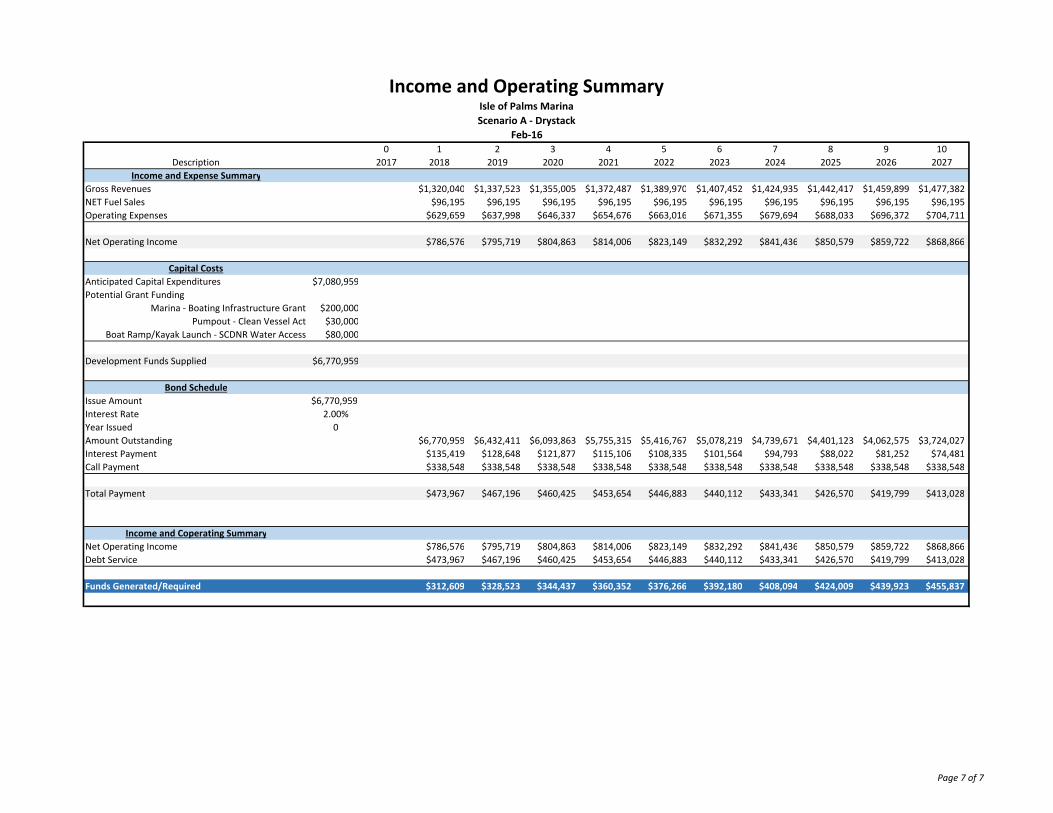
IncomeandOperatingSummaryThis sheet brings NOI over from the Income Statement and applies the anticipated debt service. Annual
funds generated/required for this project is presented on this sheet. Note: This does not include other
marina site revenues and obligations (e.g. restaurant lease, marina store, watersports, etc.). This sheet
also does not calculate the potential impact to marina lease payments. This will be addressed in the
below written analysis.
Note: Potential grant funding sources have been included in this summary for key project elements,
including:
Transient boating infrastructure, including docks, gangways, utilities and marine fuel
infrastructure. Assume the outside of the northernmost dock on Morgan Creek is dedicated for
transient use.
Marine Pumpout per the Clean Vessel Act. 75% of pumpout costs are reimbursable through the
CVA program.
Boat Ramp/Kayak Launch infrastructure is eligible for funding under SCDNR’s Water Access
Grant funding program.
Pro Forma Financial Analysis Isle of Palms Marina
4
Analysis
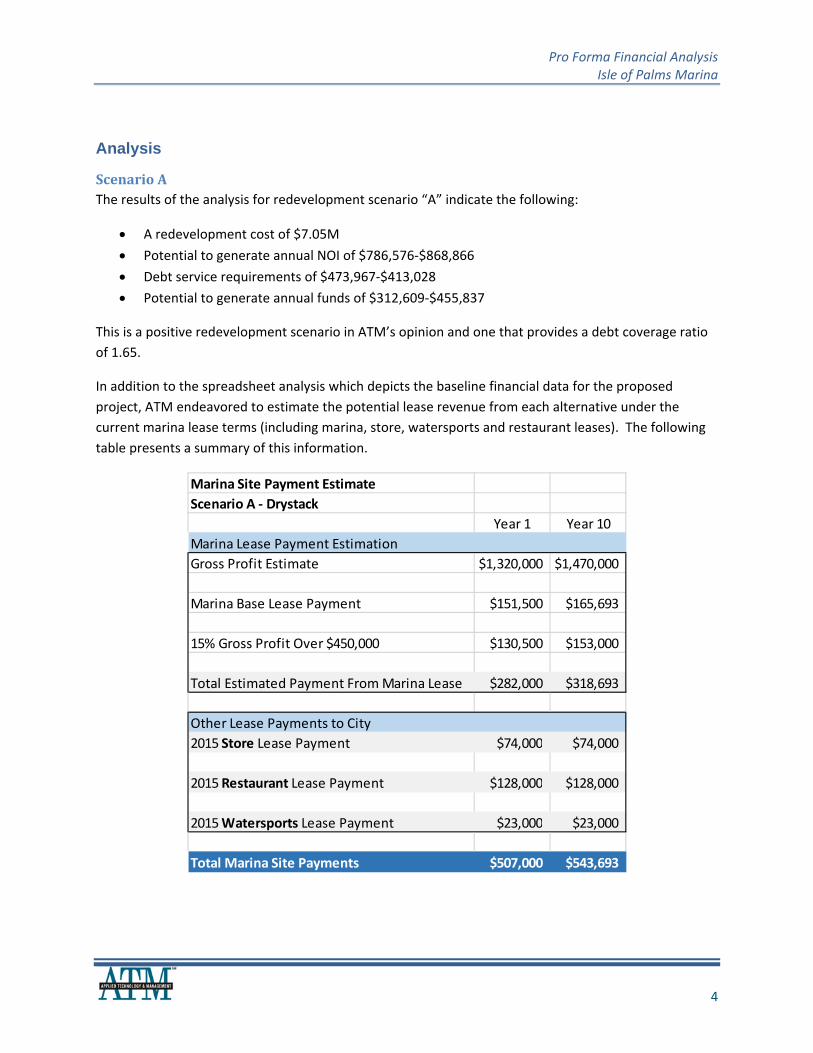
ScenarioAThe results of the analysis for redevelopment scenario “A” indicate the following:
A redevelopment cost of $7.05M
Potential to generate annual NOI of $786,576‐$868,866
Debt service requirements of $473,967‐$413,028
Potential to generate annual funds of $312,609‐$455,837
This is a positive redevelopment scenario in ATM’s opinion and one that provides a debt coverage ratio
of 1.65.
In addition to the spreadsheet analysis which depicts the baseline financial data for the proposed
project, ATM endeavored to estimate the potential lease revenue from each alternative under the
current marina lease terms (including marina, store, watersports and restaurant leases). The following
table presents a summary of this information.
Marina Site Payment Estimate
Scenario A ‐ Drystack
Year 1 Year 10
Marina Lease Payment Estimation
Gross Profit Estimate $1,320,000 $1,470,000
Marina Base Lease Payment $151,500 $165,693
15% Gross Profit Over $450,000 $130,500 $153,000
Total Estimated Payment From Marina Lease $282,000 $318,693
Other Lease Payments to City
2015 Store Lease Payment $74,000 $74,000
2015 Restaurant Lease Payment $128,000 $128,000
2015 Watersports Lease Payment $23,000 $23,000
Total Marina Site Payments $507,000 $543,693
Pro Forma Financial Analysis Isle of Palms Marina
5
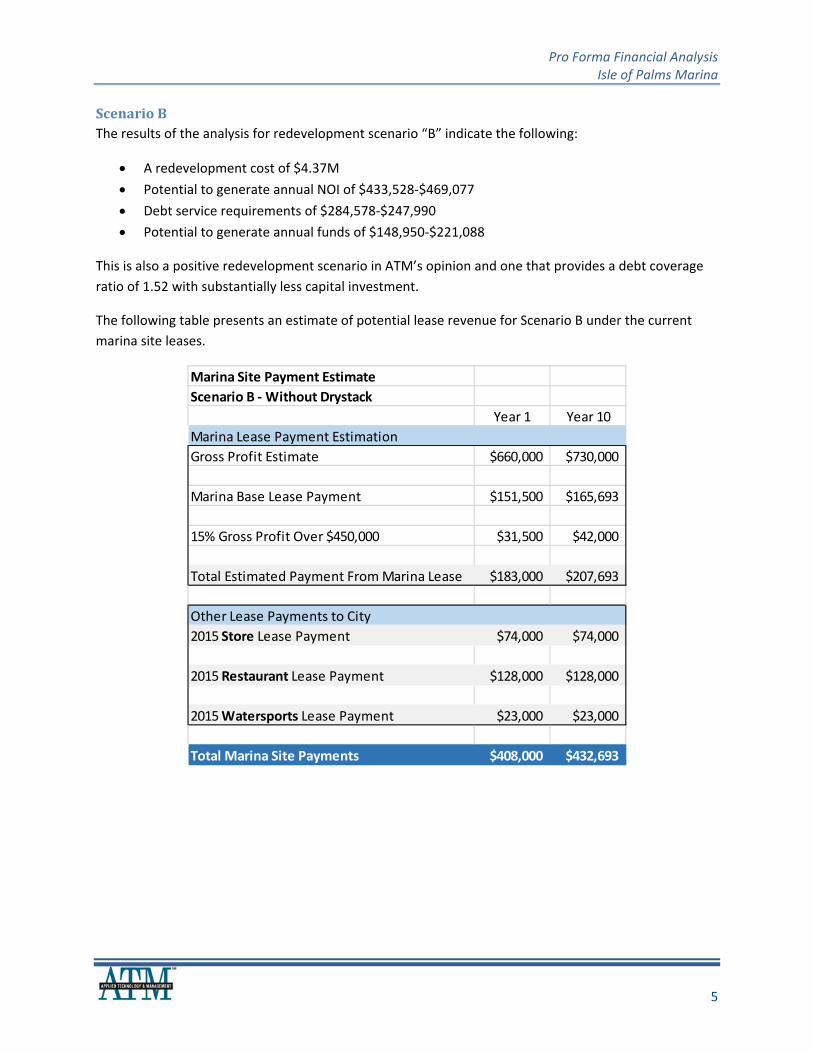
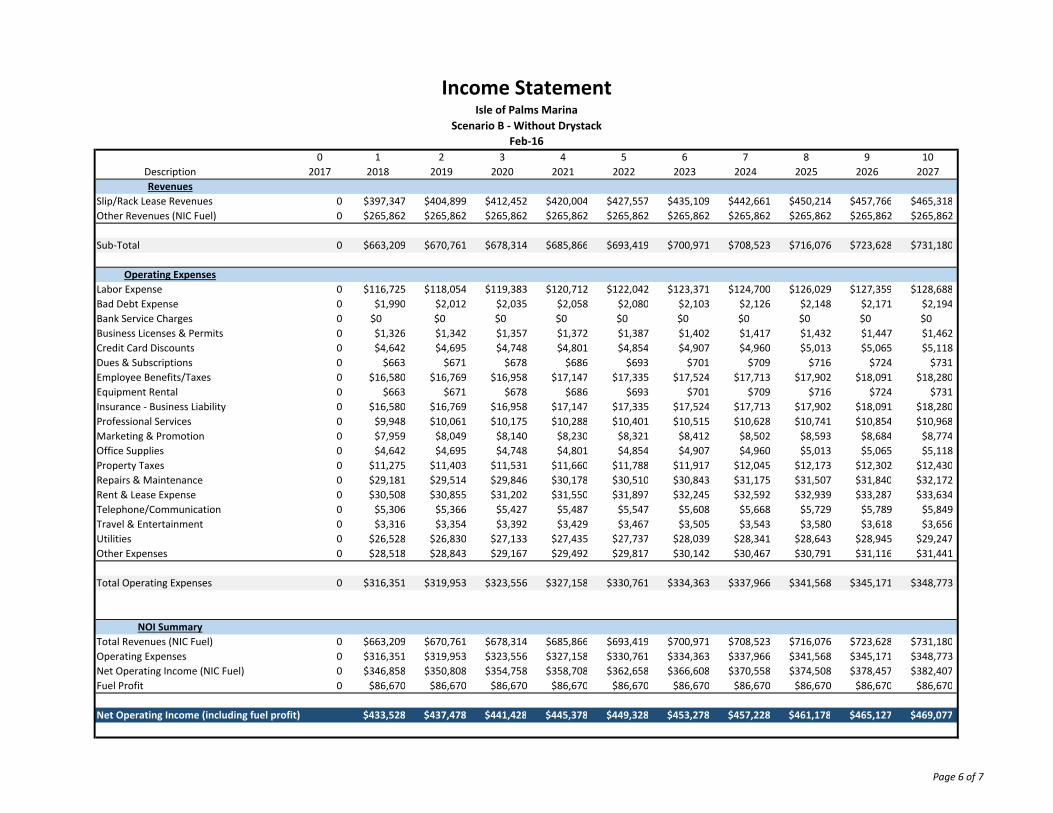
ScenarioBThe results of the analysis for redevelopment scenario “B” indicate the following:
A redevelopment cost of $4.37M
Potential to generate annual NOI of $433,528‐$469,077
Debt service requirements of $284,578‐$247,990
Potential to generate annual funds of $148,950‐$221,088
This is also a positive redevelopment scenario in ATM’s opinion and one that provides a debt coverage
ratio of 1.52 with substantially less capital investment.
The following table presents an estimate of potential lease revenue for Scenario B under the current
marina site leases.
Marina Site Payment Estimate
Scenario B ‐ Without Drystack
Year 1 Year 10
Marina Lease Payment Estimation
Gross Profit Estimate $660,000 $730,000
Marina Base Lease Payment $151,500 $165,693
15% Gross Profit Over $450,000 $31,500 $42,000
Total Estimated Payment From Marina Lease $183,000 $207,693
Other Lease Payments to City
2015 Store Lease Payment $74,000 $74,000
2015 Restaurant Lease Payment $128,000 $128,000
2015 Watersports Lease Payment $23,000 $23,000
Total Marina Site Payments $408,000 $432,693
Pro Forma Financial Analysis Isle of Palms Marina
6
Summary/Conclusions
Development of drystack storage at the subject site has the potential to generate additional funds for the
City at the subject site. Of course, if the City elects to fund the drystack construction it will require
substantially more capital. It is suggested that the City evaluate this preliminary information in
conjunction with the provided concept plans and feasibility analysis. As mentioned, ATM will be pleased
to adjust our financial model to review alternate project approaches and refined funding scenarios.
Slips/Racks Available
Wetslips
Annual Transient
Size (ft.) Number Occupancy Size (ft.) Occupancy
22‐ft. Jet Docks 16 100%
40 8 100%
50 1 100%
60 1 100%
Side Tie 585 100% 275 50%
Drystack Storage
Seasonal Occupancy
Size (ft.) Number
24‐ft. 151 100%
Marina Rates
Annual Wetslips
$/ft./mo. % Takers Annual Rate Increase
$15 Non‐Resident 40% $0.25
$13.50 Resident 60% $0.25
Transient Wetslips
$/ft./day Occupancy Annual Rate Increase
$2.25 50% $0.05
Drystack Storage
$/ft./mo. % Takers Annual Rate Increase
$20 Non‐Resident 50% $0.25
$18 Resident 50% $0.25
Upland Trailer Storage
No. Spaces High Season Low Season High Season Low Season
Apri‐Sept. Oct‐March Occupancy Occupancy
Daily 0 $10 $20 50% 0%
Weekly 0 $150 $70 75% 10%
Monthly 0 $300 $250 80% 100%
Boat Ramp Launching/Parking
Annual Pass No. Peak Usage Parking
Resident $100 70 30%
Non‐Resident $300 50
Daily Pass No.
Resident $5 250
Non‐Resident $15 250
Charter Pick Up Fees
Number of Charter and Tour Boats No. Slips Fee Trips/Year
Inshore 10 $15 150
Offshore 1 $35 30
Tour 3 $100 60
Standard Vehicular Parking
Number of Spaces Rate (per 2 hours) % Non Employee Takers Estimated Space Turnover/Day Usage Days/Yr.
100 $5 30% 3 180
Schedule of AssumptionsIsle of Palms Marina Redevelopment
Scenario A ‐ Drystack
Feb‐16
Page 1 of 7
Schedule of AssumptionsIsle of Palms Marina Redevelopment
Scenario A ‐ Drystack
Feb‐16
Fuel
Upland
High Season Duration (days) Fill Ups/Day Average Volume Fuel Mark Up
90 20 15 $0.10
Off Season 270 10 15 $0.10
Marina
Gall./slip/mo. No. Slips Fuel Mark Up
Long Term Wetslips 60 34 $0.25
Drystack 25 151 $0.25
gall/mo.
Transient Boating Sales 20,000 $0.30
Expenses
Operating Expenses
Region II IMI
% of Revenue
Labor Expense 17.6%
Bad Debt Expense 0.3%
Bank Service Charges 0.0%
Business Licenses & Permits 0.2%
Credit Card Discounts 0.7%
Dues & Subscriptions 0.1%
Employee Benefits/Taxes 2.5%
Equipment Rental 0.1%
Insurance ‐ Business Liability 2.5%
Professional Services 1.5%
Marketing & Promotion 1.2%
Office Supplies 0.7%
Property Taxes 1.7%
Repairs & Maintenance 4.4%
Rent & Lease Expense 4.6%
Telephone/Communication 0.8%
Travel & Entertainment 0.5%
Utilities 4.0%
Other Expenses 4.3%
Total 47.7%
Capital and Loan
Loan Details
Municipal Bond 20 Year Term
Interest Rate 2.00%
Year Issued 0
Coupon Annual
Annual Call Amount 5%
CPI Boost
Expenses Lease Pmt. Capital Cost
% of Revenue 1% 1%
Page 2 of 7
Item Estimated Quantity Units Unit Price Item Cost Comments/Assumptions
Preliminaries and Site Work
Mobilization 1 LS $100,000 $100,000
Demolition and Grading 1 LS $35,000 $35,000
Erosion and Sediment Control 1 LS $60,000 $60,000
Stormwater Management System 1 LS $150,000 $150,000
Asphalt Paving 7,150 SY $25 $178,750
Gravel Paving 4,300 SY $20 $86,000
Concrete Curb and Gutter 3,897 LF $10 $38,970
Road Parking and Striping 1 LS $5,000 $5,000
Traffic Signs 1 LS $35,000 $35,000
Concrete Sidewalk 360 SY $60 $21,600
Testing Allowance 1 LS $10,000 $10,000
Surveying 1 LS $10,000 $10,000
Site Electrical and Lighting 1 LS $175,000 $175,000
Site Potable Water and Sewer 1 LS $175,000 $175,000
Landscaping 1 LS $275,000 $275,000
AIWW Boardwalk 3,150 SF $30 $94,500 Assume timber frame on upland/cantilevered
Dumpster Screening 3 EA $2,500 $7,500
Shoulder Improvements on 41st Ave
Revetment Ditch Slope 350 LF $300 $105,000
Grading 600 SY $5 $3,000
Gravel Paving 400 SY $20 $8,000
Parking Meter System 6 EA $15,000 $90,000
Sub‐Total $1,663,320
Upland Filling Station
Fueling Infrastructure 1 EA $325,000 $325,000
Existing Infrastructure DEMO 1 LS $25,000 $25,000
Concrete paving 592 SY $60 $35,520
Sub‐Total $385,520
Marina
Morgan Creek
Demolition 1 LS $50,000 $50,000 Assume dispose of existing docks off site
Floating Docks 14,260 SF $50 $713,000 Timber Frame Floating Docks with Anchorage
Jet Docks 0 EA $8,000 $0 Assume relocated from existing marina
Gangways 2 EA $40,000 $80,000 6'x80' ADA Aluminum Gangways
Standard Slip‐Utilities 24 Slip $7,500 $180,000 Pedestals, Wire, Piping for Potable and Electrical
Small M/Y Slips ‐ Utilities 2 Slip $15,000 $30,000 Pedestals, Wire, Piping for Potable and Electrical
Jet Docks ‐ Utilities 16 Slip $5,000 $80,000 Pedestals, Wire, Piping for Potable and Electrical
Fuel Hut 225 SF $150 $33,750 Includes Floating Dock and Hut; no interior finishes
Marina Fuel System 0 LS $0 $0 Incl. in previous (upland). Includes service to docks and drystack.
Marina Pumpout System 1 LS $40,000 $40,000 Assume single stanchion at fuel dock
Marina Fire Protection 1 LS $50,000 $50,000 Assumes extinguishers and two hand carts
Sub‐Total $1,256,750
AIWW
Relocate and Modify Intracoastal Dock 1 LS $40,000 $40,000 Re‐use pilings; basic refurbishment/maintenance
Kayak Launch Dock 525 SF $75 $39,375
Kayak Launch Gangway 1 EA $45,000 $45,000 Assume 8'x80' ADA Gangway
Intracoastal Dock Utilities 11 Slips $5,000 $55,000 Incl. refurbishment and relocation of existing utilities
Sub‐Total $179,375
Drystack Storage
Racks 151 Rack $12,000 $1,812,000 Assume arch. treatment on 3 sides; no roof
High Strength Concrete Pad 14,400 SF $12 $172,800
Relieving Platform 1 LS $30,000 $30,000
Forklift 1 EA $285,000 $285,000
Staging Racks 3 EA $600 $1,800
Sub‐Total $2,301,600
Construction Cost Estimate Total $5,786,565
Soft Costs
Planning, Engineering, Permitting, CA 7% $405,060
Contingency
Conceptual Level Plan Contingency 15% $867,985
Project Total $7,059,609
Conceptual Cost EstimateIsle of Palms Marina Redevelopment
Scenario A ‐ Drystack
Feb‐16
Page 3 of 7
0 1 2 3 4 5 6 7 8 9 10
Description 2017 2018 2019 2020 2021 2022 2023 2024 2025 2026 2027
Mooring Space Available
Seasonal Wetslips
22 Jet Docks 0 16 16 16 16 16 16 16 16 16 16
40 0 8 8 8 8 8 8 8 8 8 8
50 0 1 1 1 1 1 1 1 1 1 1
60 0 1 1 1 1 1 1 1 1 1 1
Side Tie 0 585 585 585 585 585 585 585 585 585 585
Transient Wetslips
Side Tie 0 275 275 275 275 275 275 275 275 275 275
Drystack Racks
Racks 0 151 151 151 151 151 151 151 151 151 151
Rates and Occupancy
Seasonal Wetslips
Percent Resident Takers 0 60% 60% 60% 60% 60% 60% 60% 60% 60% 60%
Annual Rate $13.50 $13.75 $14.00 $14.25 $14.50 $14.75 $15.00 $15.25 $15.50 $15.75
Occupancy Percentage 100% 100% 100% 100% 100% 100% 100% 100% 100% 100%
Percent Non‐Resident Takers 0 40% 40% 40% 40% 40% 40% 40% 40% 40% 40%
Annual Rate $15 $15.25 $15.50 $15.75 $16.00 $16.25 $16.50 $16.75 $17.00 $17.25
Occupancy Percentage 100% 100% 100% 100% 100% 100% 100% 100% 100% 100%
Transient Wetslips
Daily Rate 0 $2.25 $2.30 $2.35 $2.40 $2.45 $2.50 $2.55 $2.60 $2.65 $2.70
Occupancy Percentage 0 50% 50% 50% 50% 50% 50% 50% 50% 50% 50%
Drystack Racks
Percent Resident Takers 0 50% 50% 50% 50% 50% 50% 50% 50% 50% 50%
Annual Rate 0 $18 $18.25 $18.50 $18.75 $19.00 $19.25 $19.50 $19.75 $20.00 $20.25
Occupancy Percentage 0 100% 100% 100% 100% 100% 100% 100% 100% 100% 100%
Percent Non‐Resident Takers 0 50% 50% 50% 50% 50% 50% 50% 50% 50% 50%
Annual Rate 0 $20 $20.25 $20.50 $20.75 $21.00 $21.25 $21.50 $21.75 $22.00 $22.25
Occupancy Percentage 0 100% 100% 100% 100% 100% 100% 100% 100% 100% 100%
Revenues
Seasonal Wetslips ‐ Residents
22 $0 $34,214 $34,848 $35,482 $36,115 $36,749 $37,382 $38,016 $38,650 $39,283 $39,917
40 $0 $31,104 $31,680 $32,256 $32,832 $33,408 $33,984 $34,560 $35,136 $35,712 $36,288
50 $0 $4,860 $4,950 $5,040 $5,130 $5,220 $5,310 $5,400 $5,490 $5,580 $5,670
60 $0 $5,832 $5,940 $6,048 $6,156 $6,264 $6,372 $6,480 $6,588 $6,696 $6,804
Side Tie $0 $56,862 $57,915 $58,968 $60,021 $61,074 $62,127 $63,180 $64,233 $65,286 $66,339
Sub‐Total $0 $132,872 $135,333 $137,794 $140,254 $142,715 $145,175 $147,636 $150,097 $152,557 $155,018
Seasonal Wetslips ‐ Non‐Residents
22 $0 $25,344 $25,766 $26,189 $26,611 $27,034 $27,456 $27,878 $28,301 $28,723 $29,146
40 $0 $23,040 $23,424 $23,808 $24,192 $24,576 $24,960 $25,344 $25,728 $26,112 $26,496
50 $0 $3,600 $3,660 $3,720 $3,780 $3,840 $3,900 $3,960 $4,020 $4,080 $4,140
60 $0 $4,320 $4,392 $4,464 $4,536 $4,608 $4,680 $4,752 $4,824 $4,896 $4,968
Side Tie $0 $42,120 $42,822 $43,524 $44,226 $44,928 $45,630 $46,332 $47,034 $47,736 $48,438
Sub‐Total $98,424 $100,064 $101,705 $103,345 $104,986 $106,626 $108,266 $109,907 $111,547 $113,188
Transient Wetslips
Side Tie $0 $112,922 $115,431 $117,941 $120,450 $122,959 $125,469 $127,978 $130,488 $132,997 $135,506
Sub‐Total $112,922 $115,431 $117,941 $120,450 $122,959 $125,469 $127,978 $130,488 $132,997 $135,506
Drystack Storage ‐ Residents
Average Vessel Size (Ft.)
24 $0 $391,392 $396,828 $402,264 $407,700 $413,136 $418,572 $424,008 $429,444 $434,880 $440,316
Sub‐Total $391,392 $396,828 $402,264 $407,700 $413,136 $418,572 $424,008 $429,444 $434,880 $440,316
Drystack Storage ‐ Non‐Residents
Average Vessel Size (Ft.)
24 $0 $434,880 $440,316 $445,752 $451,188 $456,624 $462,060 $467,496 $472,932 $478,368 $483,804
Sub‐Total $434,880 $440,316 $445,752 $451,188 $456,624 $462,060 $467,496 $472,932 $478,368 $483,804
Total Slip/Rack Lease Revenue $0 $1,170,490 $1,187,973 $1,205,455 $1,222,937 $1,240,420 $1,257,902 $1,275,385 $1,292,867 $1,310,349 $1,327,832
Schedule of Slip/Rack RevenueIsle of Palms Marina
Scenario A ‐ Drystack
Feb‐16
Page 4 of 7
0 1 2 3 4 5 6 7 8 9 10
Description 2017 2018 2019 2020 2021 2022 2023 2024 2025 2026 2027
Boat Ramp Revenues
Annual Pass Resident
Sales $0 $7,000 $7,000 $7,000 $7,000 $7,000 $7,000 $7,000 $7,000 $7,000 $7,000
Annual Pass Non‐Resident
Sales $0 $15,000 $15,000 $15,000 $15,000 $15,000 $15,000 $15,000 $15,000 $15,000 $15,000
Daily Pass Resident
Sales $0 $1,250 $1,250 $1,250 $1,250 $1,250 $1,250 $1,250 $1,250 $1,250 $1,250
Daily Pass Non‐Resident
Sales $0 $3,750 $3,750 $3,750 $3,750 $3,750 $3,750 $3,750 $3,750 $3,750 $3,750
Sub‐Total $0 $27,000 $27,000 $27,000 $27,000 $27,000 $27,000 $27,000 $27,000 $27,000 $27,000
Charter Pick Up Revenues
Inshore
Sales $22,500 $22,500 $22,500 $22,500 $22,500 $22,500 $22,500 $22,500 $22,500 $22,500
Offshore
Sales $1,050 $1,050 $1,050 $1,050 $1,050 $1,050 $1,050 $1,050 $1,050 $1,050
Tour
Sales $18,000 $18,000 $18,000 $18,000 $18,000 $18,000 $18,000 $18,000 $18,000 $18,000
Sub‐Total $41,550 $41,550 $41,550 $41,550 $41,550 $41,550 $41,550 $41,550 $41,550 $41,550
Vehicular Parking Revenues
Sales $81,000 $81,000 $81,000 $81,000 $81,000 $81,000 $81,000 $81,000 $81,000 $81,000
Sub‐Total $81,000 $81,000 $81,000 $81,000 $81,000 $81,000 $81,000 $81,000 $81,000 $81,000
Other Revenues (NIC Fuels) $149,550 $149,550 $149,550 $149,550 $149,550 $149,550 $149,550 $149,550 $149,550 $149,550
Marine Fuel Sales (NET)
Long Term Wetslips
Sales $6,120 $6,120 $6,120 $6,120 $6,120 $6,120 $6,120 $6,120 $6,120 $6,120
Drystack
Sales $11,325 $11,325 $11,325 $11,325 $11,325 $11,325 $11,325 $11,325 $11,325 $11,325
Transient Boaters
Sales $72,000 $72,000 $72,000 $72,000 $72,000 $72,000 $72,000 $72,000 $72,000 $72,000
Sub‐Total $89,445 $89,445 $89,445 $89,445 $89,445 $89,445 $89,445 $89,445 $89,445 $89,445
Upland Fuel Sales (NET)
High Season $2,700 $2,700 $2,700 $2,700 $2,700 $2,700 $2,700 $2,700 $2,700 $2,700
Off Season $4,050 $4,050 $4,050 $4,050 $4,050 $4,050 $4,050 $4,050 $4,050 $4,050
Sub‐Total $6,750 $6,750 $6,750 $6,750 $6,750 $6,750 $6,750 $6,750 $6,750 $6,750
Fuel Profit $96,195 $96,195 $96,195 $96,195 $96,195 $96,195 $96,195 $96,195 $96,195 $96,195
Schedule of Other RevenuesIsle of Palms Marina
Scenario A ‐ Drystack
Feb‐16
Page 5 of 7
0 1 2 3 4 5 6 7 8 9 10
Description 2017 2018 2019 2020 2021 2022 2023 2024 2025 2026 2027
Revenues
Slip/Rack Lease Revenues $1,170,490 $1,187,973 $1,205,455 $1,222,937 $1,240,420 $1,257,902 $1,275,385 $1,292,867 $1,310,349 $1,327,832
Other Revenues (NIC Fuel) $149,550 $149,550 $149,550 $149,550 $149,550 $149,550 $149,550 $149,550 $149,550 $149,550
Sub‐Total $1,320,040 $1,337,523 $1,355,005 $1,372,487 $1,389,970 $1,407,452 $1,424,935 $1,442,417 $1,459,899 $1,477,382
Operating Expenses
Labor Expense $232,327 $235,404 $238,481 $241,558 $244,635 $247,712 $250,788 $253,865 $256,942 $260,019
Bad Debt Expense $3,960 $4,013 $4,065 $4,117 $4,170 $4,222 $4,275 $4,327 $4,380 $4,432
Bank Service Charges $0 $0 $0 $0 $0 $0 $0 $0 $0 $0
Business Licenses & Permits $2,640 $2,675 $2,710 $2,745 $2,780 $2,815 $2,850 $2,885 $2,920 $2,955
Credit Card Discounts $9,240 $9,363 $9,485 $9,607 $9,730 $9,852 $9,975 $10,097 $10,219 $10,342
Dues & Subscriptions $1,320 $1,338 $1,355 $1,372 $1,390 $1,407 $1,425 $1,442 $1,460 $1,477
Employee Benefits/Taxes $33,001 $33,438 $33,875 $34,312 $34,749 $35,186 $35,623 $36,060 $36,497 $36,935
Equipment Rental $1,320 $1,338 $1,355 $1,372 $1,390 $1,407 $1,425 $1,442 $1,460 $1,477
Insurance ‐ Business Liability $33,001 $33,438 $33,875 $34,312 $34,749 $35,186 $35,623 $36,060 $36,497 $36,935
Professional Services $19,801 $20,063 $20,325 $20,587 $20,850 $21,112 $21,374 $21,636 $21,898 $22,161
Marketing & Promotion $15,840 $16,050 $16,260 $16,470 $16,680 $16,889 $17,099 $17,309 $17,519 $17,729
Office Supplies $9,240 $9,363 $9,485 $9,607 $9,730 $9,852 $9,975 $10,097 $10,219 $10,342
Property Taxes $22,441 $22,738 $23,035 $23,332 $23,629 $23,927 $24,224 $24,521 $24,818 $25,115
Repairs & Maintenance $58,082 $58,851 $59,620 $60,389 $61,159 $61,928 $62,697 $63,466 $64,236 $65,005
Rent & Lease Expense $60,722 $61,526 $62,330 $63,134 $63,939 $64,743 $65,547 $66,351 $67,155 $67,960
Telephone/Communication $10,560 $10,700 $10,840 $10,980 $11,120 $11,260 $11,399 $11,539 $11,679 $11,819
Travel & Entertainment $6,600 $6,688 $6,775 $6,862 $6,950 $7,037 $7,125 $7,212 $7,299 $7,387
Utilities $52,802 $53,501 $54,200 $54,899 $55,599 $56,298 $56,997 $57,697 $58,396 $59,095
Other Expenses $56,762 $57,513 $58,265 $59,017 $59,769 $60,520 $61,272 $62,024 $62,776 $63,527
Total Operating Expenses $629,659 $637,998 $646,337 $654,676 $663,016 $671,355 $679,694 $688,033 $696,372 $704,711
NOI Summary
Total Revenues (NIC Fuel) $1,320,040 $1,337,523 $1,355,005 $1,372,487 $1,389,970 $1,407,452 $1,424,935 $1,442,417 $1,459,899 $1,477,382
Operating Expenses $629,659 $637,998 $646,337 $654,676 $663,016 $671,355 $679,694 $688,033 $696,372 $704,711
Net Operating Income (NIC Fuel) $690,381 $699,524 $708,668 $717,811 $726,954 $736,097 $745,241 $754,384 $763,527 $772,671
Fuel Profit $96,195 $96,195 $96,195 $96,195 $96,195 $96,195 $96,195 $96,195 $96,195 $96,195
Net Operating Income (including fuel profit) $786,576 $795,719 $804,863 $814,006 $823,149 $832,292 $841,436 $850,579 $859,722 $868,866
Income StatementIsle of Palms Marina
Scenario A ‐ Drystack
Feb‐16
Page 6 of 7
0 1 2 3 4 5 6 7 8 9 10
Description 2017 2018 2019 2020 2021 2022 2023 2024 2025 2026 2027
Income and Expense Summary
Gross Revenues $1,320,040 $1,337,523 $1,355,005 $1,372,487 $1,389,970 $1,407,452 $1,424,935 $1,442,417 $1,459,899 $1,477,382
NET Fuel Sales $96,195 $96,195 $96,195 $96,195 $96,195 $96,195 $96,195 $96,195 $96,195 $96,195
Operating Expenses $629,659 $637,998 $646,337 $654,676 $663,016 $671,355 $679,694 $688,033 $696,372 $704,711
Net Operating Income $786,576 $795,719 $804,863 $814,006 $823,149 $832,292 $841,436 $850,579 $859,722 $868,866
Capital Costs
Anticipated Capital Expenditures $7,080,959
Potential Grant Funding
Marina ‐ Boating Infrastructure Grant $200,000
Pumpout ‐ Clean Vessel Act $30,000
Boat Ramp/Kayak Launch ‐ SCDNR Water Access $80,000
Development Funds Supplied $6,770,959
Bond Schedule
Issue Amount $6,770,959
Interest Rate 2.00%
Year Issued 0
Amount Outstanding $6,770,959 $6,432,411 $6,093,863 $5,755,315 $5,416,767 $5,078,219 $4,739,671 $4,401,123 $4,062,575 $3,724,027
Interest Payment $135,419 $128,648 $121,877 $115,106 $108,335 $101,564 $94,793 $88,022 $81,252 $74,481
Call Payment $338,548 $338,548 $338,548 $338,548 $338,548 $338,548 $338,548 $338,548 $338,548 $338,548
Total Payment $473,967 $467,196 $460,425 $453,654 $446,883 $440,112 $433,341 $426,570 $419,799 $413,028
Income and Coperating Summary
Net Operating Income $786,576 $795,719 $804,863 $814,006 $823,149 $832,292 $841,436 $850,579 $859,722 $868,866
Debt Service $473,967 $467,196 $460,425 $453,654 $446,883 $440,112 $433,341 $426,570 $419,799 $413,028
Funds Generated/Required $312,609 $328,523 $344,437 $360,352 $376,266 $392,180 $408,094 $424,009 $439,923 $455,837
Income and Operating SummaryIsle of Palms Marina
Scenario A ‐ Drystack
Feb‐16
Page 7 of 7
Slips/Racks Available
Wetslips
Annual Transient
Size (ft.) Number Occupancy Size (ft.) Occupancy
22‐ft. Jet Docks 18 100%
40 8 100%
50 1 100%
60 1 100%
Side Tie 855 100% 275 50%
Drystack Storage
Seasonal Occupancy
Size (ft.) Number
24‐ft. 0 0%
Marina Rates
Annual Wetslips
$/ft./mo. % Takers Annual Rate Increase
$15 Non‐Resident 40% $0.25
$13.50 Resident 60% $0.25
Transient Wetslips
$/ft./day Occupancy Annual Rate Increase
$2.25 50% $0.05
Drystack Storage
$/ft./mo. % Takers Annual Rate Increase
$0 Non‐Resident 0% $0.00
$0 Resident 0% $0.00
Upland Trailer Storage
Total Spaces High Season Low Season High Season Low Season
21 Apri‐Sept. Oct‐March Occupancy Occupancy
Daily $20 $10 10% 0%
Weekly $150 $70 30% 10%
Monthly $300 $250 35% 90%
Boat Ramp Launching/Parking
Annual Pass No. Peak Usage Parking
Resident $100 90 30%
Non‐Resident $300 65
Daily Pass No.
Resident $5 325
Non‐Resident $15 325
Charter Pick Up Fees
Number of Charter and Tour Boats No. Slips Fee Trips/Year
Inshore 10 $15 150
Offshore 1 $35 30
Tour 3 $100 60
Standard Vehicular Parking
Number of Spaces Rate (per 2 hours) % Non Employee Takers Estimated Space Turnover/Day Usage Days/Yr.
138 $5 30% 3 180
Fuel
Upland
High Season Duration (days) Fill Ups/Day Average Volume Fuel Mark Up
90 20 15 $0.10
Off Season 270 10 15 $0.10
Marina
Gall./slip/mo. No. Slips Fuel Mark Up
Long Term Wetslips 60 44 $0.25
Drystack 25 0 $0.25
gall/mo.
Transient Boating Sales 20,000 $0.30
Schedule of AssumptionsIsle of Palms Marina Redevelopment
Scenario B ‐ Without Drystack
Feb‐16
Page 1 of 7
Schedule of AssumptionsIsle of Palms Marina Redevelopment
Scenario B ‐ Without Drystack
Feb‐16
Expenses
Operating Expenses
Region II IMI
% of Revenue
Labor Expense 17.6%
Bad Debt Expense 0.3%
Bank Service Charges 0.0%
Business Licenses & Permits 0.2%
Credit Card Discounts 0.7%
Dues & Subscriptions 0.1%
Employee Benefits/Taxes 2.5%
Equipment Rental 0.1%
Insurance ‐ Business Liability 2.5%
Professional Services 1.5%
Marketing & Promotion 1.2%
Office Supplies 0.7%
Property Taxes 1.7%
Repairs & Maintenance 4.4%
Rent & Lease Expense 4.6%
Telephone/Communication 0.8%
Travel & Entertainment 0.5%
Utilities 4.0%
Other Expenses 4.3%
Total 47.7%
Capital and Loan
Loan Details
Municipal Bond 20 Year Term
Interest Rate 2.00%
Year Issued 0
Coupon Annual
Annual Call Amount 5%
CPI Boost
Expenses Lease Pmt. Capital Cost
% of Revenue 1% 1%
Page 2 of 7
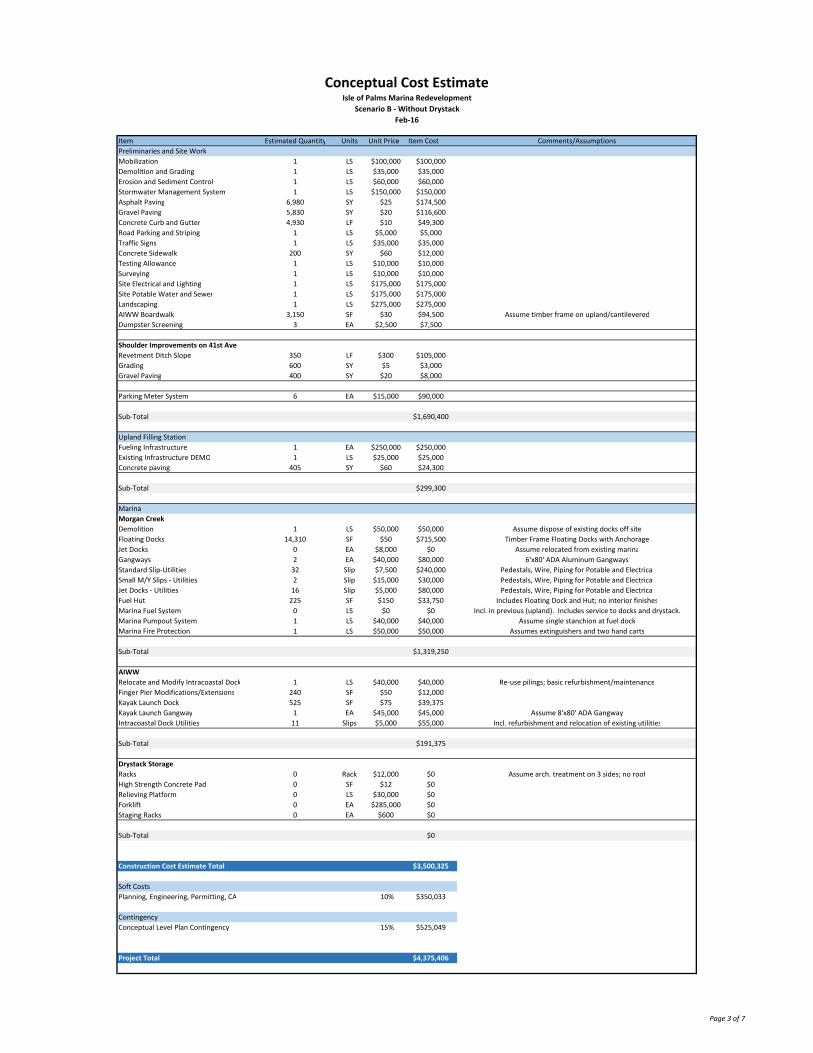
Item Estimated Quantity Units Unit Price Item Cost Comments/Assumptions
Preliminaries and Site Work
Mobilization 1 LS $100,000 $100,000
Demolition and Grading 1 LS $35,000 $35,000
Erosion and Sediment Control 1 LS $60,000 $60,000
Stormwater Management System 1 LS $150,000 $150,000
Asphalt Paving 6,980 SY $25 $174,500
Gravel Paving 5,830 SY $20 $116,600
Concrete Curb and Gutter 4,930 LF $10 $49,300
Road Parking and Striping 1 LS $5,000 $5,000
Traffic Signs 1 LS $35,000 $35,000
Concrete Sidewalk 200 SY $60 $12,000
Testing Allowance 1 LS $10,000 $10,000
Surveying 1 LS $10,000 $10,000
Site Electrical and Lighting 1 LS $175,000 $175,000
Site Potable Water and Sewer 1 LS $175,000 $175,000
Landscaping 1 LS $275,000 $275,000
AIWW Boardwalk 3,150 SF $30 $94,500 Assume timber frame on upland/cantilevered
Dumpster Screening 3 EA $2,500 $7,500
Shoulder Improvements on 41st Ave
Revetment Ditch Slope 350 LF $300 $105,000
Grading 600 SY $5 $3,000
Gravel Paving 400 SY $20 $8,000
Parking Meter System 6 EA $15,000 $90,000
Sub‐Total $1,690,400
Upland Filling Station
Fueling Infrastructure 1 EA $250,000 $250,000
Existing Infrastructure DEMO 1 LS $25,000 $25,000
Concrete paving 405 SY $60 $24,300
Sub‐Total $299,300
Marina
Morgan Creek
Demolition 1 LS $50,000 $50,000 Assume dispose of existing docks off site
Floating Docks 14,310 SF $50 $715,500 Timber Frame Floating Docks with Anchorage
Jet Docks 0 EA $8,000 $0 Assume relocated from existing marina
Gangways 2 EA $40,000 $80,000 6'x80' ADA Aluminum Gangways
Standard Slip‐Utilities 32 Slip $7,500 $240,000 Pedestals, Wire, Piping for Potable and Electrical
Small M/Y Slips ‐ Utilities 2 Slip $15,000 $30,000 Pedestals, Wire, Piping for Potable and Electrical
Jet Docks ‐ Utilities 16 Slip $5,000 $80,000 Pedestals, Wire, Piping for Potable and Electrical
Fuel Hut 225 SF $150 $33,750 Includes Floating Dock and Hut; no interior finishes
Marina Fuel System 0 LS $0 $0 Incl. in previous (upland). Includes service to docks and drystack.
Marina Pumpout System 1 LS $40,000 $40,000 Assume single stanchion at fuel dock
Marina Fire Protection 1 LS $50,000 $50,000 Assumes extinguishers and two hand carts
Sub‐Total $1,319,250
AIWW
Relocate and Modify Intracoastal Dock 1 LS $40,000 $40,000 Re‐use pilings; basic refurbishment/maintenance
Finger Pier Modifications/Extensions 240 SF $50 $12,000
Kayak Launch Dock 525 SF $75 $39,375
Kayak Launch Gangway 1 EA $45,000 $45,000 Assume 8'x80' ADA Gangway
Intracoastal Dock Utilities 11 Slips $5,000 $55,000 Incl. refurbishment and relocation of existing utilities
Sub‐Total $191,375
Drystack Storage
Racks 0 Rack $12,000 $0 Assume arch. treatment on 3 sides; no roof
High Strength Concrete Pad 0 SF $12 $0
Relieving Platform 0 LS $30,000 $0
Forklift 0 EA $285,000 $0
Staging Racks 0 EA $600 $0
Sub‐Total $0
Construction Cost Estimate Total $3,500,325
Soft Costs
Planning, Engineering, Permitting, CA 10% $350,033
Contingency
Conceptual Level Plan Contingency 15% $525,049
Project Total $4,375,406
Conceptual Cost EstimateIsle of Palms Marina Redevelopment
Scenario B ‐ Without Drystack
Feb‐16
Page 3 of 7
0 1 2 3 4 5 6 7 8 9 10
Description 2017 2018 2019 2020 2021 2022 2023 2024 2025 2026 2027
Mooring Space Available
Seasonal Wetslips
22 Jet Docks 0 18 18 18 18 18 18 18 18 18 18
40 0 8 8 8 8 8 8 8 8 8 8
50 0 1 1 1 1 1 1 1 1 1 1
60 0 1 1 1 1 1 1 1 1 1 1
Side Tie 0 855 855 855 855 855 855 855 855 855 855
Transient Wetslips
Side Tie 0 275 275 275 275 275 275 275 275 275 275
Drystack Racks
Racks 0 0 0 0 0 0 0 0 0 0 0
Rates and Occupancy
Seasonal Wetslips
Percent Resident Takers 0 60% 60% 60% 60% 60% 60% 60% 60% 60% 60%
Annual Rate $13.50 $13.75 $14.00 $14.25 $14.50 $14.75 $15.00 $15.25 $15.50 $15.75
Occupancy Percentage 100% 100% 100% 100% 100% 100% 100% 100% 100% 100%
Percent Non‐Resident Takers 0 40% 40% 40% 40% 40% 40% 40% 40% 40% 40%
Annual Rate $15 $15.25 $15.50 $15.75 $16.00 $16.25 $16.50 $16.75 $17.00 $17.25
Occupancy Percentage 100% 100% 100% 100% 100% 100% 100% 100% 100% 100%
Transient Wetslips
Daily Rate 0 $2.25 $2.30 $2.35 $2.40 $2.45 $2.50 $2.55 $2.60 $2.65 $2.70
Occupancy Percentage 0 50% 50% 50% 50% 50% 50% 50% 50% 50% 50%
Drystack Racks
Percent Resident Takers 0 0% 0% 0% 0% 0% 0% 0% 0% 0% 0%
Annual Rate 0 $0 $0.00 $0.00 $0.00 $0.00 $0.00 $0.00 $0.00 $0.00 $0.00
Occupancy Percentage 0 0% 0% 0% 0% 0% 0% 0% 0% 0% 0%
Percent Non‐Resident Takers 0 0% 0% 0% 0% 0% 0% 0% 0% 0% 0%
Annual Rate 0 $0 $0.00 $0.00 $0.00 $0.00 $0.00 $0.00 $0.00 $0.00 $0.00
Occupancy Percentage 0 0% 0% 0% 0% 0% 0% 0% 0% 0% 0%
Revenues
Seasonal Wetslips ‐ Residents
22 $0 $38,491 $39,204 $39,917 $40,630 $41,342 $42,055 $42,768 $43,481 $44,194 $44,906
40 $0 $31,104 $31,680 $32,256 $32,832 $33,408 $33,984 $34,560 $35,136 $35,712 $36,288
50 $0 $4,860 $4,950 $5,040 $5,130 $5,220 $5,310 $5,400 $5,490 $5,580 $5,670
60 $0 $5,832 $5,940 $6,048 $6,156 $6,264 $6,372 $6,480 $6,588 $6,696 $6,804
Side Tie $0 $83,106 $84,645 $86,184 $87,723 $89,262 $90,801 $92,340 $93,879 $95,418 $96,957
Sub‐Total $0 $163,393 $166,419 $169,445 $172,471 $175,496 $178,522 $181,548 $184,574 $187,600 $190,625
Seasonal Wetslips ‐ Non‐Residents
22 $0 $28,512 $28,987 $29,462 $29,938 $30,413 $30,888 $31,363 $31,838 $32,314 $32,789
40 $0 $23,040 $23,424 $23,808 $24,192 $24,576 $24,960 $25,344 $25,728 $26,112 $26,496
50 $0 $3,600 $3,660 $3,720 $3,780 $3,840 $3,900 $3,960 $4,020 $4,080 $4,140
60 $0 $4,320 $4,392 $4,464 $4,536 $4,608 $4,680 $4,752 $4,824 $4,896 $4,968
Side Tie $0 $61,560 $62,586 $63,612 $64,638 $65,664 $66,690 $67,716 $68,742 $69,768 $70,794
Sub‐Total $121,032 $123,049 $125,066 $127,084 $129,101 $131,118 $133,135 $135,152 $137,170 $139,187
Transient Wetslips
Side Tie $0 $112,922 $115,431 $117,941 $120,450 $122,959 $125,469 $127,978 $130,488 $132,997 $135,506
Sub‐Total $112,922 $115,431 $117,941 $120,450 $122,959 $125,469 $127,978 $130,488 $132,997 $135,506
Drystack Storage ‐ Residents
Average Vessel Size (Ft.)
24 $0 $0 $0 $0 $0 $0 $0 $0 $0 $0 $0
Sub‐Total $0 $0 $0 $0 $0 $0 $0 $0 $0 $0
Drystack Storage ‐ Non‐Residents
Average Vessel Size (Ft.)
24 $0 $0 $0 $0 $0 $0 $0 $0 $0 $0 $0
Sub‐Total $0 $0 $0 $0 $0 $0 $0 $0 $0 $0
Total Slip/Rack Lease Revenue $0 $397,347 $404,899 $412,452 $420,004 $427,557 $435,109 $442,661 $450,214 $457,766 $465,318
Schedule of Slip/Rack RevenueIsle of Palms Marina
Scenario B ‐ Without Drystack
Feb‐16
Page 4 of 7
0 1 2 3 4 5 6 7 8 9 10
Description 2017 2018 2019 2020 2021 2022 2023 2024 2025 2026 2027
Boat Ramp Revenues
Annual Pass Resident
Sales $0 $9,000 $9,000 $9,000 $9,000 $9,000 $9,000 $9,000 $9,000 $9,000 $9,000
Annual Pass Non‐Resident
Sales $0 $19,500 $19,500 $19,500 $19,500 $19,500 $19,500 $19,500 $19,500 $19,500 $19,500
Daily Pass Resident
Sales $0 $1,625 $1,625 $1,625 $1,625 $1,625 $1,625 $1,625 $1,625 $1,625 $1,625
Daily Pass Non‐Resident
Sales $0 $4,875 $4,875 $4,875 $4,875 $4,875 $4,875 $4,875 $4,875 $4,875 $4,875
Sub‐Total $0 $35,000 $35,000 $35,000 $35,000 $35,000 $35,000 $35,000 $35,000 $35,000 $35,000
Upland Trailer Storage
Daily
High Season $0 $7,560 $7,560 $7,560 $7,560 $7,560 $7,560 $7,560 $7,560 $7,560 $7,560
Off Season $0 $0 $0 $0 $0 $0 $0 $0 $0 $0 $0
Weekly
High Season $0 $24,570 $24,570 $24,570 $24,570 $24,570 $24,570 $24,570 $24,570 $24,570 $24,570
Off Season $0 $3,822 $3,822 $3,822 $3,822 $3,822 $3,822 $3,822 $3,822 $3,822 $3,822
Monthly
High Season $0 $13,230 $13,230 $13,230 $13,230 $13,230 $13,230 $13,230 $13,230 $13,230 $13,230
Off Season $0 $28,350 $28,350 $28,350 $28,350 $28,350 $28,350 $28,350 $28,350 $28,350 $28,350
Sub‐Total $0 $77,532 $77,532 $77,532 $77,532 $77,532 $77,532 $77,532 $77,532 $77,532 $77,532
Charter Pick Up Revenues
Inshore
Sales $0 $22,500 $22,500 $22,500 $22,500 $22,500 $22,500 $22,500 $22,500 $22,500 $22,500
Offshore
Sales $0 $1,050 $1,050 $1,050 $1,050 $1,050 $1,050 $1,050 $1,050 $1,050 $1,050
Tour
Sales $0 $18,000 $18,000 $18,000 $18,000 $18,000 $18,000 $18,000 $18,000 $18,000 $18,000
Sub‐Total $0 $41,550 $41,550 $41,550 $41,550 $41,550 $41,550 $41,550 $41,550 $41,550 $41,550
Vehicular Parking Revenues
Sales $0 $111,780 $111,780 $111,780 $111,780 $111,780 $111,780 $111,780 $111,780 $111,780 $111,780
Sub‐Total $0 $111,780 $111,780 $111,780 $111,780 $111,780 $111,780 $111,780 $111,780 $111,780 $111,780
Other Revenues (NIC Fuel) $265,862 $265,862 $265,862 $265,862 $265,862 $265,862 $265,862 $265,862 $265,862 $265,862
Marine Fuel Sales (NET)
Long Term Wetslips
Sales $0 $7,920 $7,920 $7,920 $7,920 $7,920 $7,920 $7,920 $7,920 $7,920 $7,920
Drystack
Sales $0 $0 $0 $0 $0 $0 $0 $0 $0 $0 $0
Transient Boaters
Sales $0 $72,000 $72,000 $72,000 $72,000 $72,000 $72,000 $72,000 $72,000 $72,000 $72,000
Sub‐Total $0 $79,920 $79,920 $79,920 $79,920 $79,920 $79,920 $79,920 $79,920 $79,920 $79,920
Upland Fuel Sales (NET)
High Season $0 $2,700 $2,700 $2,700 $2,700 $2,700 $2,700 $2,700 $2,700 $2,700 $2,700
Off Season $0 $4,050 $4,050 $4,050 $4,050 $4,050 $4,050 $4,050 $4,050 $4,050 $4,050
Sub‐Total $0 $6,750 $6,750 $6,750 $6,750 $6,750 $6,750 $6,750 $6,750 $6,750 $6,750
Fuel Profit $86,670 $86,670 $86,670 $86,670 $86,670 $86,670 $86,670 $86,670 $86,670 $86,670
Schedule of Other RevenuesIsle of Palms Marina
Scenario B ‐ Without Drystack
Feb‐16
Page 5 of 7
0 1 2 3 4 5 6 7 8 9 10
Description 2017 2018 2019 2020 2021 2022 2023 2024 2025 2026 2027
Revenues
Slip/Rack Lease Revenues 0 $397,347 $404,899 $412,452 $420,004 $427,557 $435,109 $442,661 $450,214 $457,766 $465,318
Other Revenues (NIC Fuel) 0 $265,862 $265,862 $265,862 $265,862 $265,862 $265,862 $265,862 $265,862 $265,862 $265,862
Sub‐Total 0 $663,209 $670,761 $678,314 $685,866 $693,419 $700,971 $708,523 $716,076 $723,628 $731,180
Operating Expenses
Labor Expense 0 $116,725 $118,054 $119,383 $120,712 $122,042 $123,371 $124,700 $126,029 $127,359 $128,688
Bad Debt Expense 0 $1,990 $2,012 $2,035 $2,058 $2,080 $2,103 $2,126 $2,148 $2,171 $2,194
Bank Service Charges 0 $0 $0 $0 $0 $0 $0 $0 $0 $0 $0
Business Licenses & Permits 0 $1,326 $1,342 $1,357 $1,372 $1,387 $1,402 $1,417 $1,432 $1,447 $1,462
Credit Card Discounts 0 $4,642 $4,695 $4,748 $4,801 $4,854 $4,907 $4,960 $5,013 $5,065 $5,118
Dues & Subscriptions 0 $663 $671 $678 $686 $693 $701 $709 $716 $724 $731
Employee Benefits/Taxes 0 $16,580 $16,769 $16,958 $17,147 $17,335 $17,524 $17,713 $17,902 $18,091 $18,280
Equipment Rental 0 $663 $671 $678 $686 $693 $701 $709 $716 $724 $731
Insurance ‐ Business Liability 0 $16,580 $16,769 $16,958 $17,147 $17,335 $17,524 $17,713 $17,902 $18,091 $18,280
Professional Services 0 $9,948 $10,061 $10,175 $10,288 $10,401 $10,515 $10,628 $10,741 $10,854 $10,968
Marketing & Promotion 0 $7,959 $8,049 $8,140 $8,230 $8,321 $8,412 $8,502 $8,593 $8,684 $8,774
Office Supplies 0 $4,642 $4,695 $4,748 $4,801 $4,854 $4,907 $4,960 $5,013 $5,065 $5,118
Property Taxes 0 $11,275 $11,403 $11,531 $11,660 $11,788 $11,917 $12,045 $12,173 $12,302 $12,430
Repairs & Maintenance 0 $29,181 $29,514 $29,846 $30,178 $30,510 $30,843 $31,175 $31,507 $31,840 $32,172
Rent & Lease Expense 0 $30,508 $30,855 $31,202 $31,550 $31,897 $32,245 $32,592 $32,939 $33,287 $33,634
Telephone/Communication 0 $5,306 $5,366 $5,427 $5,487 $5,547 $5,608 $5,668 $5,729 $5,789 $5,849
Travel & Entertainment 0 $3,316 $3,354 $3,392 $3,429 $3,467 $3,505 $3,543 $3,580 $3,618 $3,656
Utilities 0 $26,528 $26,830 $27,133 $27,435 $27,737 $28,039 $28,341 $28,643 $28,945 $29,247
Other Expenses 0 $28,518 $28,843 $29,167 $29,492 $29,817 $30,142 $30,467 $30,791 $31,116 $31,441
Total Operating Expenses 0 $316,351 $319,953 $323,556 $327,158 $330,761 $334,363 $337,966 $341,568 $345,171 $348,773
NOI Summary
Total Revenues (NIC Fuel) 0 $663,209 $670,761 $678,314 $685,866 $693,419 $700,971 $708,523 $716,076 $723,628 $731,180
Operating Expenses 0 $316,351 $319,953 $323,556 $327,158 $330,761 $334,363 $337,966 $341,568 $345,171 $348,773
Net Operating Income (NIC Fuel) 0 $346,858 $350,808 $354,758 $358,708 $362,658 $366,608 $370,558 $374,508 $378,457 $382,407
Fuel Profit 0 $86,670 $86,670 $86,670 $86,670 $86,670 $86,670 $86,670 $86,670 $86,670 $86,670
Net Operating Income (including fuel profit) $433,528 $437,478 $441,428 $445,378 $449,328 $453,278 $457,228 $461,178 $465,127 $469,077
Income StatementIsle of Palms Marina
Scenario B ‐ Without Drystack
Feb‐16
Page 6 of 7

0 1 2 3 4 5 6 7 8 9 10
Description 2017 2018 2019 2020 2021 2022 2023 2024 2025 2026 2027
Income and Expense Summary
Gross Revenues 0 $663,209 $670,761 $678,314 $685,866 $693,419 $700,971 $708,523 $716,076 $723,628 $731,180
NET Fuel Sales 0 $86,670 $86,670 $86,670 $86,670 $86,670 $86,670 $86,670 $86,670 $86,670 $86,670
Operating Expenses 0 $316,351 $319,953 $323,556 $327,158 $330,761 $334,363 $337,966 $341,568 $345,171 $348,773
Net Operating Income 0 $433,528 $437,478 $441,428 $445,378 $449,328 $453,278 $457,228 $461,178 $465,127 $469,077
Capital Costs
Anticipated Capital Expenditures $4,375,406
Potential Grant Funding
Marina ‐ Boating Infrastructure Grant $200,000
Pumpout ‐ Clean Vessel Act $30,000
Boat Ramp/Kayak Launch ‐ SCDNR Water Access $80,000
Development Funds Supplied $4,065,406
Bond Schedule
Issue Amount $4,065,406
Interest Rate 2.00%
Year Issued 0
Amount Outstanding 0 $4,065,406 $3,862,136 $3,658,866 $3,455,595 $3,252,325 $3,049,055 $2,845,784 $2,642,514 $2,439,244 $2,235,973
Interest Payment 0 $81,308 $77,243 $73,177 $69,112 $65,047 $60,981 $56,916 $52,850 $48,785 $44,719
Call Payment 0 $203,270 $203,270 $203,270 $203,270 $203,270 $203,270 $203,270 $203,270 $203,270 $203,270
Total Payment 0 $284,578 $280,513 $276,448 $272,382 $268,317 $264,251 $260,186 $256,121 $252,055 $247,990
Income and Coperating Summary
Net Operating Income 0 $433,528 $437,478 $441,428 $445,378 $449,328 $453,278 $457,228 $461,178 $465,127 $469,077
Debt Service 0 $284,578 $280,513 $276,448 $272,382 $268,317 $264,251 $260,186 $256,121 $252,055 $247,990
Funds Generated/Required $148,950 $156,965 $164,981 $172,996 $181,011 $189,026 $197,042 $205,057 $213,072 $221,088
Income and Operating SummaryIsle of Palms Marina
Scenario B ‐ Without Drystack
Feb‐16
Page 7 of 7