pritchard naturegenetics 2012 microrna profiling approaches and considerations
TRANSCRIPT
Since their discovery1–3, microRNAs (miRNAs) have come to be recognized as crucial regulators of gene expression in plants and animals. miRNAs are short (~22 nucleotides (nt) in length) non-coding RNAs (ncRNAs) that regulate gene expression by binding to specific mRNA targets and promoting their degrada-tion and/or translational inhibition. In most organisms, there are a limited number of miRNAs compared with the number of mRNAs and proteins; for example, the human genome is believed to encode ~1,000 miRNAs, whereas the number of mRNAs is typically estimated at ~30,000. However, one miRNA may regulate hundreds of mRNAs and, as a result, may have substantial effects on gene expression networks. miRNA expression pat-terns can therefore be especially rich in biological information, as variation in expression of hundreds of mRNAs may, to an extent, be captured in the expres-sion patterns of one or a few miRNAs that regulate them.
miRNA expression profiling has helped to identify miRNAs that regulate a range of processes, includ-ing organismal development and establishment and maintenance of tissue differentiation4,5. Consequently, miRNAs are being investigated as reagents for the reprogramming of cell fate in stem cell applications, as well as being applied as biomarkers for identifying the tissue differentiation state of cancers of unknown tissue origin6,7. Measuring miRNA expression can also be useful for systems-level studies of gene regulation, especially when miRNA measurements are combined with mRNA profiling and other genome-scale data. Finally, miRNAs have been shown to be unusually
well-preserved in a range of specimen types — includ-ing blood plasma or serum, urine and formalin-fixed tissue blocks — and are also measurable with a much greater sensitivity than proteins. This has led to consid-erable interest in the development of miRNAs as bio-markers for diverse molecular diagnostic applications, including in cancer6–8, cardiovascular and autoimmune diseases9 and forensics10. Applications of miRNA pro-filing are summarized in BOX 1. Accordingly, miRNA profiling has become of interest to investigators work-ing in diverse research areas of biology and medicine. Here we define miRNA profiling as the measurement of the relative abundance of a cohort of miRNAs, ranging from a group of several miRNAs of specific biologi-cal interest to comprehensive profiling of all miRNAs in a given species (typically numbering in the several hundreds). Assaying such small RNA molecules poses some inherent challenges, but technological advances in recent years have overcome many of these barriers, and a wide range of approaches and platforms is now available for miRNA profiling.
In this article, we aim to explain fundamental details of miRNAs that are relevant to miRNA-profiling experi-ments, to describe established and emerging methods for measuring miRNA expression profiles in various biolog-ical samples (for example, cells, tissues and body fluids) and to highlight the strengths and limitations of differ-ent profiling approaches for specific biological applica-tions. Our goal is to provide the reader with an informed perspective for embarking on miRNA-profiling studies or for interpreting miRNA-profiling results from the literature.
1Department of Laboratory Medicine, University of Washington, Seattle, Washington, USA.2Clinical Research, Fred Hutchinson Cancer Research Center, Seattle, Washington, USA.3Department of Medicine, University of Washington, Seattle, Washington, USA.4Human Biology Division, Fred Hutchinson Cancer Research Center, Seattle, Washington, USA.5Public Health Sciences Divisions, Fred Hutchinson Cancer Research Center, Seattle, Washington, USA.Correspondence to M.T. e-mail: [email protected]:10.1038/nrg3198
MicroRNA profiling: approaches and considerationsColin C. Pritchard1, Heather H. Cheng2,3 and Muneesh Tewari2,3,4,5
Abstract | MicroRNAs (miRNAs) are small RNAs that post-transcriptionally regulate the expression of thousands of genes in a broad range of organisms in both normal physiological contexts and in disease contexts. miRNA expression profiling is gaining popularity because miRNAs, as key regulators in gene expression networks, can influence many biological processes and also show promise as biomarkers for disease. Technological advances have spawned a multitude of platforms for miRNA profiling, and an understanding of the strengths and pitfalls of different approaches can aid in their effective use. Here, we review the major considerations for carrying out and interpreting results of miRNA-profiling studies.
N O N - C O D I N G R N A
R E V I E W S
358 | MAY 2012 | VOLUME 13 www.nature.com/reviews/genetics
© 2012 Macmillan Publishers Limited. All rights reserved
Box 1 | Some applications of miRNA profiling
Mechanisms of gene regulationDevelopmental biology. Comparing microRNA (miRNA) profiles between different stages of development has facilitated identification of miRNAs involved in developmental transitions or cell differentiation4,5. An emerging theme is that miRNA expression patterns can be cell-type-specific and that specific miRNAs can function to buffer developmental transitions and/or to maintain differentiation states, leading to interest in miRNA profiling for understanding stem cell biology and cellular reprogramming.
Novel miRNA discovery. Many investigators study gene regulation in organisms that are not well-characterized at the genomic or transcriptomic levels and therefore quantitative reverse transcription PCR (qRT-PCR) or microarray reagents are unavailable. RNA sequencing (RNA-seq) is a powerful approach for both discovering and profiling miRNAs in this setting100,101.
Studying miRNA–mRNA and miRNA–protein interactions. A popular approach is to analyse miRNAs that are associated with mRNA targets and/or with an RNA-binding protein of interest. Crosslinking with immunoprecipitation (CLIP)102,103 uses ultraviolet irradiation to create covalent bonds between RNA-binding proteins and RNA. Efficiency of crosslinking can be increased by the incorporation of photoreactive ribonucleoside analogues (which also permits later identification of sites of RNA crosslinking)104. RNA sequences that are bound by a protein of interest (for example, an Argonaute protein) can then be detected by high-throughput sequencing (HITS) in a combined approach known as HITS–CLIP or photoactivatable-ribonucleoside-enhanced CLIP (PAR-CLIP), in which photoreactive analogues are incorporated105.
Integrative analyses of miRNAs in the context of gene regulatory networks. miRNA profiles can be analysed with other large-scale genomic data sets and gene regulatory network models using in silico tools such as MAGIA95 and mirConnX96. Both tools interface with Cytoscape106, which is a network visualization tool, as well as with databases of miRNA expression patterns in human disease, such as miR2disease97. miConnX also interfaces with the miR Ontology database98, which is a compendium of miRNA–phenotype associations in humans.
Disease biomarkersMany features of miRNA profiles, including their rich information content, their accessibility in specimen types such as formalin-fixed tissue and plasma or serum and their potential for highly sensitive measurement, have made the study of miRNAs as disease biomarkers a popular area.
Tissue-based miRNA biomarkers. A common study design is to define differences in miRNA profiles between normal and affected tissues to look for biomarkers of disease, which may potentially be correlated with prognosis or therapeutic response. Each of the three main miRNA-profiling strategies has been used for biomarker discovery efforts in a wide variety of diseases, including cancer, autoimmune, psychiatric and neurological disorders107–111.
Tissues of unknown origin. miRNA profiles have been successfully applied to the classification of cancers of unknown origin difficult to classify otherwise6,7. Clinical diagnostic assays have been developed based on miRNA-based classifiers that are generated from microarray studies of known tumour types7,112,113.
Circulating biomarkers. miRNAs, including specific cancer-derived miRNAs, are detectable in the cell-free circulation (that is, in serum and plasma)34, 114 and thus circulating miRNAs have been eagerly sought as non-invasive biomarkers in many diseases and pathologic processes8,115. Accompanying these efforts is the need for rigorous control of pre-analytic and analytic variables when considering potential circulating miRNA markers35,37,116,117.
Forensics. miRNA profiles from different body fluids have been characterized and have been proposed as distinguishers of different body fluids in the forensic setting10,118.
MicroRNA characteristicsThe considerations for planning and interpreting miRNA-profiling experiments are related to the char-acteristics of these small RNAs and their mode of bio-genesis and function. The basic pathway of miRNA
biogenesis is described in Supplementary informa-tion S1 (figure) and is well-summarized in recent reviews11,12. There are a few key points to bear in mind. Although mature miRNAs are typically ~22 nt long, they originate from much longer primary transcripts that may be hundreds to thousands of nucleotides in length. Biogenesis of mature miRNAs occurs through a multi-step process that begins with the cleavage of the primary miRNA (pri-miRNA) to yield an approximately 70–100 nt hairpin precursor miRNA (pre-miRNA) and is followed by further cleavage to produce the mature miRNA, meaning that profiling platforms need to dis-tinguish pri- and pre-miRNAs from mature miRNAs. The average copy number of an individual miRNA species has been roughly estimated at ~500 per cell, which may be higher than the average expression of mRNA species13,14. However, different miRNA species in cells vary widely in concentration over a dynamic range of at least four orders of magnitude, and some cell-type-restricted miRNAs are present at >10,000 copies per cell14. To date, the total number of differ-ent mature miRNAs in humans is estimated at ~1,000, and numbers in other well-studied organisms, such as Drosophila melanogaster, Caenorhabditis elegans and Arabidopsis thaliana, range between ~200 and 300 (according to mirBase version 18.0, accessed 22 January 2012).
miRBase15,16 has emerged as a definitive repository of miRNA sequences as well as an authoritative source of miRNA nomenclature that is valuable for miRNA-profiling studies (Supplementary information S2 (box) provides detail on miRNA nomenclature). Originally called the microRNA Registry17, the current version of miRBase has a total of 18,226 entries of hairpin precur-sor miRNAs expressing 21,643 mature miRNA prod-ucts (miRBase version 18.0, accessed 22 January 2012) encompassing a range of plant and animal species. In addition to providing information about predicted precursor hairpin sequences and experimentally iden-tified mature miRNA sequences, miRBase provides an interface to quantitative RNA-sequencing (RNA-seq) data that are deposited in the US National Center for Biotechnology Information (NCBI) Gene Expression Omnibus (GEO) repository as well as links to miRNA target prediction databases.
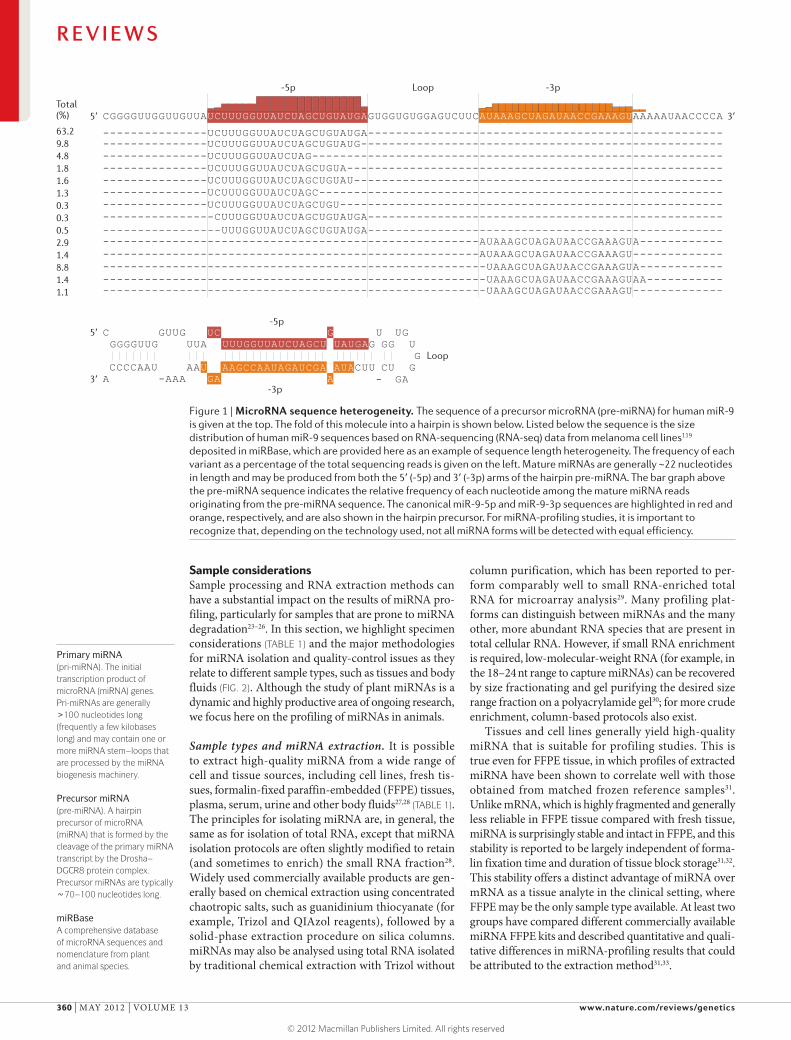
It is important to consider that different mature miRNA species can be produced from a single pre-miRNA molecule (FIG. 1). Distinct miRNAs are generated from the 3′ and 5′ arms of the pre-miRNA duplex 11. In addition, miRNA-sequencing studies indicate that a given mature miRNA can sometimes comprise a distribution of sizes centred around 22 nt rather than a discrete single length. For example, RNA-seq data deposited in miRBase for human miR-9 show that miRNA-sequencing reads are distributed between 15–23 nt (FIG. 1), although most are 22 or 23 nt. In many cases, this variation in mature miRNA length is due to 3′ or 5′ end post-transcriptional modifications (including additions and/or deletion of nucleotides), which have been shown to affect miRNA stability or function in some cases18–22.
R E V I E W S
NATURE REVIEWS | GENETICS VOLUME 13 | MAY 2012 | 359
© 2012 Macmillan Publishers Limited. All rights reserved
Nature Reviews | Genetics
-5p -3pLoop
3′5′
5′
3′
----------------CUUUGGUUAUCUAGCUGUAUGA--------------------------------------------------------------------UUUGGUUAUCUAGCUGUAUGA---------------------------------------------------------------------------------------------------------AUAAAGCUAGAUAACCGAAAGUA------------
-------------------------------------------------------UAAAGCUAGAUAACCGAAAGUA-------------------------------------------------------------------UAAAGCUAGAUAACCGAAAGUAA------------------------------------------------------------------UAAAGCUAGAUAACCGAAAGU-------------
------------------------------------------------------AUAAAGCUAGAUAACCGAAAGU-------------
CGGGGUUGGUUGUUAUCUUUGGUUAUCUAGCUGUAUGAGUGGUGUGGAGUCUUCAUAAAGCUAGAUAACCGAAAGUAAAAAUAACCCCA
GGGGUUG UUAUC
GA-AAA
G
AAAUCCCCAAU
UUUGGUUAUCUAGCUGUAUGA
---------------UCUUUGGUUAUCUAGCUGUAUG-------------------------------------------------------------------UCUUUGGUUAUCUAGCUGUAUGA---------------------------------------------------
---------------UCUUUGGUUAUCUAGCUGU----------------------------------------------------------------------UCUUUGGUUAUCUAGC-------------------------------------------------------------------------UCUUUGGUUAUCUAGCUGUAU--------------------------------------------------------------------UCUUUGGUUAUCUAGCUGUA---------------------------------------------------------------------UCUUUGGUUAUCUAG-----------------------------------------------------------
63.29.84.81.81.61.30.30.30.52.91.48.81.41.1
Total(%)
GUUG U UGG U
GG
GG
GA-AUACUU CUAAGCCAAUAGAUCGA
C
A
Loop
-5p
-3p
Figure 1 | MicroRNA sequence heterogeneity. The sequence of a precursor microRNA (pre-miRNA) for human miR-9 is given at the top. The fold of this molecule into a hairpin is shown below. Listed below the sequence is the size distribution of human miR-9 sequences based on RNA-sequencing (RNA-seq) data from melanoma cell lines119 deposited in miRBase, which are provided here as an example of sequence length heterogeneity. The frequency of each variant as a percentage of the total sequencing reads is given on the left. Mature miRNAs are generally ~22 nucleotides in length and may be produced from both the 5′ (-5p) and 3′ (-3p) arms of the hairpin pre-miRNA. The bar graph above the pre-miRNA sequence indicates the relative frequency of each nucleotide among the mature miRNA reads originating from the pre-miRNA sequence. The canonical miR-9-5p and miR-9-3p sequences are highlighted in red and orange, respectively, and are also shown in the hairpin precursor. For miRNA-profiling studies, it is important to recognize that, depending on the technology used, not all miRNA forms will be detected with equal efficiency.
Primary miRNA(pri-miRNA). The initial transcription product of microRNA (miRNA) genes. Pri-miRNAs are generally >100 nucleotides long (frequently a few kilobases long) and may contain one or more miRNA stem–loops that are processed by the miRNA biogenesis machinery.
Precursor miRNA(pre-miRNA). A hairpin precursor of microRNA (miRNA) that is formed by the cleavage of the primary miRNA transcript by the Drosha–DGCR8 protein complex. Precursor miRNAs are typically ~70–100 nucleotides long.
miRBaseA comprehensive database of microRNA sequences and nomenclature from plant and animal species.
Sample considerationsSample processing and RNA extraction methods can have a substantial impact on the results of miRNA pro-filing, particularly for samples that are prone to miRNA degradation23–26. In this section, we highlight specimen considerations (TABLE 1) and the major methodologies for miRNA isolation and quality-control issues as they relate to different sample types, such as tissues and body fluids (FIG. 2). Although the study of plant miRNAs is a dynamic and highly productive area of ongoing research, we focus here on the profiling of miRNAs in animals.
Sample types and miRNA extraction. It is possible to extract high-quality miRNA from a wide range of cell and tissue sources, including cell lines, fresh tis-sues, formalin-fixed paraffin-embedded (FFPE) tissues, plasma, serum, urine and other body fluids27,28 (TABLE 1). The principles for isolating miRNA are, in general, the same as for isolation of total RNA, except that miRNA isolation protocols are often slightly modified to retain (and sometimes to enrich) the small RNA fraction28. Widely used commercially available products are gen-erally based on chemical extraction using concentrated chaotropic salts, such as guanidinium thiocyanate (for example, Trizol and QIAzol reagents), followed by a solid-phase extraction procedure on silica columns. miRNAs may also be analysed using total RNA isolated by traditional chemical extraction with Trizol without
column purification, which has been reported to per-form comparably well to small RNA-enriched total RNA for microarray analysis29. Many profiling plat-forms can distinguish between miRNAs and the many other, more abundant RNA species that are present in total cellular RNA. However, if small RNA enrichment is required, low-molecular-weight RNA (for example, in the 18–24 nt range to capture miRNAs) can be recovered by size fractionating and gel purifying the desired size range fraction on a polyacrylamide gel30; for more crude enrichment, column-based protocols also exist.
Tissues and cell lines generally yield high-quality miRNA that is suitable for profiling studies. This is true even for FFPE tissue, in which profiles of extracted miRNA have been shown to correlate well with those obtained from matched frozen reference samples31. Unlike mRNA, which is highly fragmented and generally less reliable in FFPE tissue compared with fresh tissue, miRNA is surprisingly stable and intact in FFPE, and this stability is reported to be largely independent of forma-lin fixation time and duration of tissue block storage31,32. This stability offers a distinct advantage of miRNA over mRNA as a tissue analyte in the clinical setting, where FFPE may be the only sample type available. At least two groups have compared different commercially available miRNA FFPE kits and described quantitative and quali-tative differences in miRNA-profiling results that could be attributed to the extraction method31,33.
R E V I E W S
360 | MAY 2012 | VOLUME 13 www.nature.com/reviews/genetics
© 2012 Macmillan Publishers Limited. All rights reserved
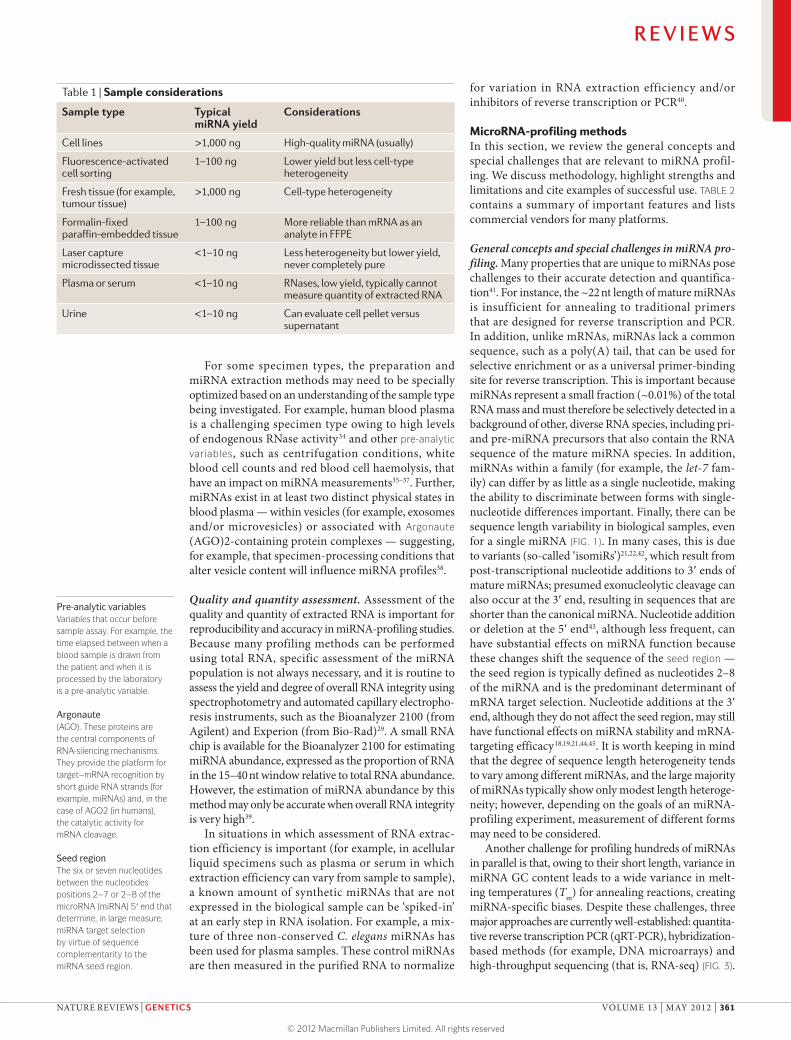
Table 1 | Sample considerations
Sample type Typical miRNA yield
Considerations
Cell lines >1,000 ng High-quality miRNA (usually)
Fluorescence-activated cell sorting
1–100 ng Lower yield but less cell-type heterogeneity
Fresh tissue (for example, tumour tissue)
>1,000 ng Cell-type heterogeneity
Formalin-fixed paraffin-embedded tissue
1–100 ng More reliable than mRNA as an analyte in FFPE
Laser capture microdissected tissue
<1–10 ng Less heterogeneity but lower yield, never completely pure
Plasma or serum <1–10 ng RNases, low yield, typically cannot measure quantity of extracted RNA
Urine <1–10 ng Can evaluate cell pellet versus supernatant
Pre-analytic variablesVariables that occur before sample assay. For example, the time elapsed between when a blood sample is drawn from the patient and when it is processed by the laboratory is a pre-analytic variable.
Argonaute(AGO). These proteins are the central components of RNA-silencing mechanisms. They provide the platform for target–mRNA recognition by short guide RNA strands (for example, miRNAs) and, in the case of AGO2 (in humans), the catalytic activity for mRNA cleavage.
Seed regionThe six or seven nucleotides between the nucleotides positions 2–7 or 2–8 of the microRNA (miRNA) 5′ end that determine, in large measure, miRNA target selection by virtue of sequence complementarity to the miRNA seed region.
For some specimen types, the preparation and miRNA extraction methods may need to be specially optimized based on an understanding of the sample type being investigated. For example, human blood plasma is a challenging specimen type owing to high levels of endogenous RNase activity34 and other pre-analytic variables, such as centrifugation conditions, white blood cell counts and red blood cell haemolysis, that have an impact on miRNA measurements35–37. Further, miRNAs exist in at least two distinct physical states in blood plasma — within vesicles (for example, exosomes and/or microvesicles) or associated with Argonaute (AGO)2-containing protein complexes — suggesting, for example, that specimen-processing conditions that alter vesicle content will influence miRNA profiles38.
Quality and quantity assessment. Assessment of the quality and quantity of extracted RNA is important for reproducibility and accuracy in miRNA-profiling studies. Because many profiling methods can be performed using total RNA, specific assessment of the miRNA population is not always necessary, and it is routine to assess the yield and degree of overall RNA integrity using spectrophotometry and automated capillary electropho-resis instruments, such as the Bioanalyzer 2100 (from Agilent) and Experion (from Bio-Rad)29. A small RNA chip is available for the Bioanalyzer 2100 for estimating miRNA abundance, expressed as the proportion of RNA in the 15–40 nt window relative to total RNA abundance. However, the estimation of miRNA abundance by this method may only be accurate when overall RNA integrity is very high39.
In situations in which assessment of RNA extrac-tion efficiency is important (for example, in acellular liquid specimens such as plasma or serum in which extraction efficiency can vary from sample to sample), a known amount of synthetic miRNAs that are not expressed in the biological sample can be ‘spiked-in’ at an early step in RNA isolation. For example, a mix-ture of three non-conserved C. elegans miRNAs has been used for plasma samples. These control miRNAs are then measured in the purified RNA to normalize
for variation in RNA extraction efficiency and/or inhibitors of reverse transcription or PCR40.
MicroRNA-profiling methodsIn this section, we review the general concepts and special challenges that are relevant to miRNA profil-ing. We discuss methodology, highlight strengths and limitations and cite examples of successful use. TABLE 2 contains a summary of important features and lists commercial vendors for many platforms.
General concepts and special challenges in miRNA pro-filing. Many properties that are unique to miRNAs pose challenges to their accurate detection and quantifica-tion41. For instance, the ~22 nt length of mature miRNAs is insufficient for annealing to traditional primers that are designed for reverse transcription and PCR. In addition, unlike mRNAs, miRNAs lack a common sequence, such as a poly(A) tail, that can be used for selective enrichment or as a universal primer-binding site for reverse transcription. This is important because miRNAs represent a small fraction (~0.01%) of the total RNA mass and must therefore be selectively detected in a background of other, diverse RNA species, including pri- and pre-miRNA precursors that also contain the RNA sequence of the mature miRNA species. In addition, miRNAs within a family (for example, the let‑7 fam-ily) can differ by as little as a single nucleotide, making the ability to discriminate between forms with single-nucleotide differences important. Finally, there can be sequence length variability in biological samples, even for a single miRNA (FIG. 1). In many cases, this is due to variants (so-called ‘isomiRs’)21,22,42, which result from post-transcriptional nucleotide additions to 3′ ends of mature miRNAs; presumed exonucleolytic cleavage can also occur at the 3′ end, resulting in sequences that are shorter than the canonical miRNA. Nucleotide addition or deletion at the 5′ end43, although less frequent, can have substantial effects on miRNA function because these changes shift the sequence of the seed region — the seed region is typically defined as nucleotides 2–8 of the miRNA and is the predominant determinant of mRNA target selection. Nucleotide additions at the 3′ end, although they do not affect the seed region, may still have functional effects on miRNA stability and mRNA-targeting efficacy18,19,21,44,45. It is worth keeping in mind that the degree of sequence length heterogeneity tends to vary among different miRNAs, and the large majority of miRNAs typically show only modest length heteroge-neity; however, depending on the goals of an miRNA-profiling experiment, measurement of different forms may need to be considered.
Another challenge for profiling hundreds of miRNAs in parallel is that, owing to their short length, variance in miRNA GC content leads to a wide variance in melt-ing temperatures (Tm) for annealing reactions, creating miRNA-specific biases. Despite these challenges, three major approaches are currently well-established: quantita-tive reverse transcription PCR (qRT-PCR), hybridization- based methods (for example, DNA microarrays) and high-throughput sequencing (that is, RNA-seq) (FIG. 3).
R E V I E W S
NATURE REVIEWS | GENETICS VOLUME 13 | MAY 2012 | 361
© 2012 Macmillan Publishers Limited. All rights reserved
Nature Reviews | Genetics
Specimens
RNA extraction
• Spectrophotometry: OD 260/280• Bioanalyzer or Experion• Measure endogenous control RNAs• Recovery of spike-in oligos (if plasma or serum)• Where possible and appropriate, standardize RNA input
Quantification and quality control
miRNA profiling
Fresh tissueor tumour
Fixed tissue or tumour
Modelorganisms
Cells
Deparaffinization,protease treatment
Microarray qRT-PCR RNA-seq
Plasma,serumor otherbodyfluids
Spike-incontrol oligos
Cell sorting
Homogenization
LCM
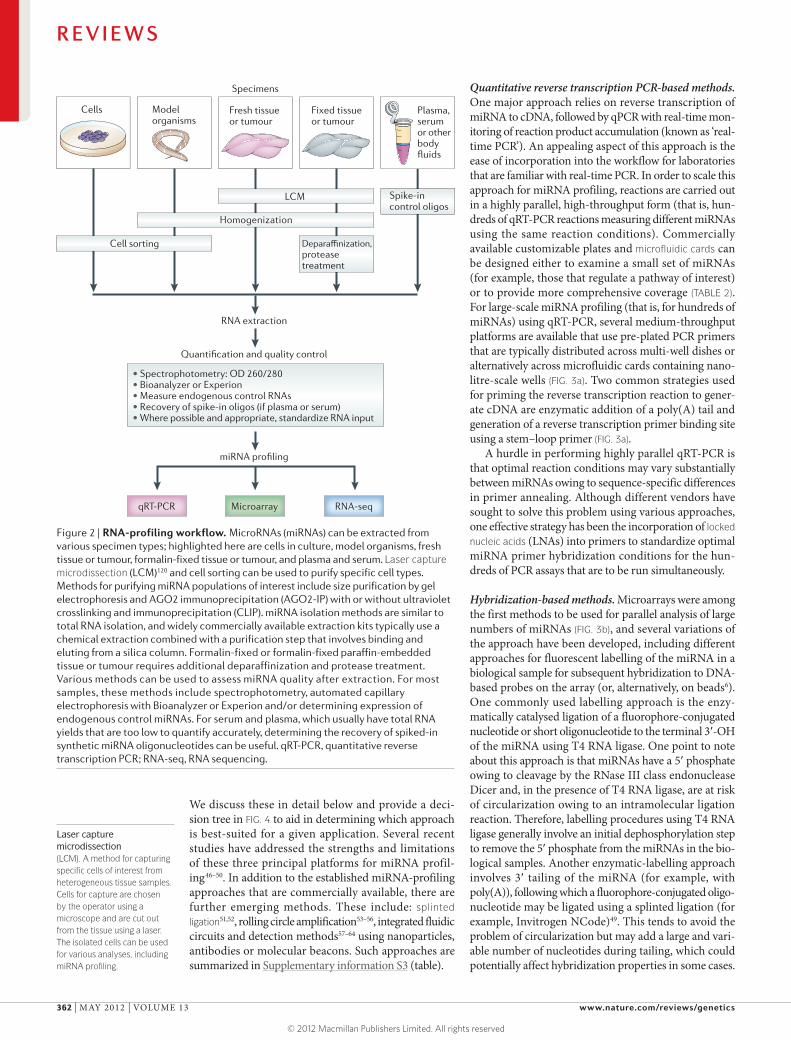
Figure 2 | RNA-profiling workflow. MicroRNAs (miRNAs) can be extracted from various specimen types; highlighted here are cells in culture, model organisms, fresh tissue or tumour, formalin-fixed tissue or tumour, and plasma and serum. Laser capture microdissection (LCM)120 and cell sorting can be used to purify specific cell types. Methods for purifying miRNA populations of interest include size purification by gel electrophoresis and AGO2 immunoprecipitation (AGO2-IP) with or without ultraviolet crosslinking and immunoprecipitation (CLIP). miRNA isolation methods are similar to total RNA isolation, and widely commercially available extraction kits typically use a chemical extraction combined with a purification step that involves binding and eluting from a silica column. Formalin-fixed or formalin-fixed paraffin-embedded tissue or tumour requires additional deparaffinization and protease treatment. Various methods can be used to assess miRNA quality after extraction. For most samples, these methods include spectrophotometry, automated capillary electrophoresis with Bioanalyzer or Experion and/or determining expression of endogenous control miRNAs. For serum and plasma, which usually have total RNA yields that are too low to quantify accurately, determining the recovery of spiked-in synthetic miRNA oligonucleotides can be useful. qRT-PCR, quantitative reverse transcription PCR; RNA-seq, RNA sequencing.
Laser capture microdissection(LCM). A method for capturing specific cells of interest from heterogeneous tissue samples. Cells for capture are chosen by the operator using a microscope and are cut out from the tissue using a laser. The isolated cells can be used for various analyses, including miRNA profiling.
We discuss these in detail below and provide a deci-sion tree in FIG. 4 to aid in determining which approach is best-suited for a given application. Several recent studies have addressed the strengths and limitations of these three principal platforms for miRNA profil-ing46–50. In addition to the established miRNA-profiling approaches that are commercially available, there are further emerging methods. These include: splinted ligation51,52, rolling circle amplification53–56, integrated fluidic circuits and detection methods57–64 using nanoparticles, antibodies or molecular beacons. Such approaches are summarized in Supplementary information S3 (table).
Quantitative reverse transcription PCR-based methods. One major approach relies on reverse transcription of miRNA to cDNA, followed by qPCR with real-time mon-itoring of reaction product accumulation (known as ‘real-time PCR’). An appealing aspect of this approach is the ease of incorporation into the workflow for laboratories that are familiar with real-time PCR. In order to scale this approach for miRNA profiling, reactions are carried out in a highly parallel, high-throughput form (that is, hun-dreds of qRT-PCR reactions measuring different miRNAs using the same reaction conditions). Commercially available customizable plates and microfluidic cards can be designed either to examine a small set of miRNAs (for example, those that regulate a pathway of interest) or to provide more comprehensive coverage (TABLE 2). For large-scale miRNA profiling (that is, for hundreds of miRNAs) using qRT-PCR, several medium-throughput platforms are available that use pre-plated PCR primers that are typically distributed across multi-well dishes or alternatively across microfluidic cards containing nano-litre-scale wells (FIG. 3a). Two common strategies used for priming the reverse transcription reaction to gener-ate cDNA are enzymatic addition of a poly(A) tail and generation of a reverse transcription primer binding site using a stem–loop primer (FIG. 3a).
A hurdle in performing highly parallel qRT-PCR is that optimal reaction conditions may vary substantially between miRNAs owing to sequence-specific differences in primer annealing. Although different vendors have sought to solve this problem using various approaches, one effective strategy has been the incorporation of locked nucleic acids (LNAs) into primers to standardize optimal miRNA primer hybridization conditions for the hun-dreds of PCR assays that are to be run simultaneously.
Hybridization-based methods. Microarrays were among the first methods to be used for parallel analysis of large numbers of miRNAs (FIG. 3b), and several variations of the approach have been developed, including different approaches for fluorescent labelling of the miRNA in a biological sample for subsequent hybridization to DNA-based probes on the array (or, alternatively, on beads6). One commonly used labelling approach is the enzy-matically catalysed ligation of a fluorophore-conjugated nucleotide or short oligonucleotide to the terminal 3′-OH of the miRNA using T4 RNA ligase. One point to note about this approach is that miRNAs have a 5′ phosphate owing to cleavage by the RNase III class endonuclease Dicer and, in the presence of T4 RNA ligase, are at risk of circularization owing to an intramolecular ligation reaction. Therefore, labelling procedures using T4 RNA ligase generally involve an initial dephosphorylation step to remove the 5′ phosphate from the miRNAs in the bio-logical samples. Another enzymatic-labelling approach involves 3′ tailing of the miRNA (for example, with poly(A)), following which a fluorophore-conjugated oligo-nucleotide may be ligated using a splinted ligation (for example, Invitrogen NCode)49. This tends to avoid the problem of circularization but may add a large and vari-able number of nucleotides during tailing, which could potentially affect hybridization properties in some cases.
R E V I E W S
362 | MAY 2012 | VOLUME 13 www.nature.com/reviews/genetics
© 2012 Macmillan Publishers Limited. All rights reserved
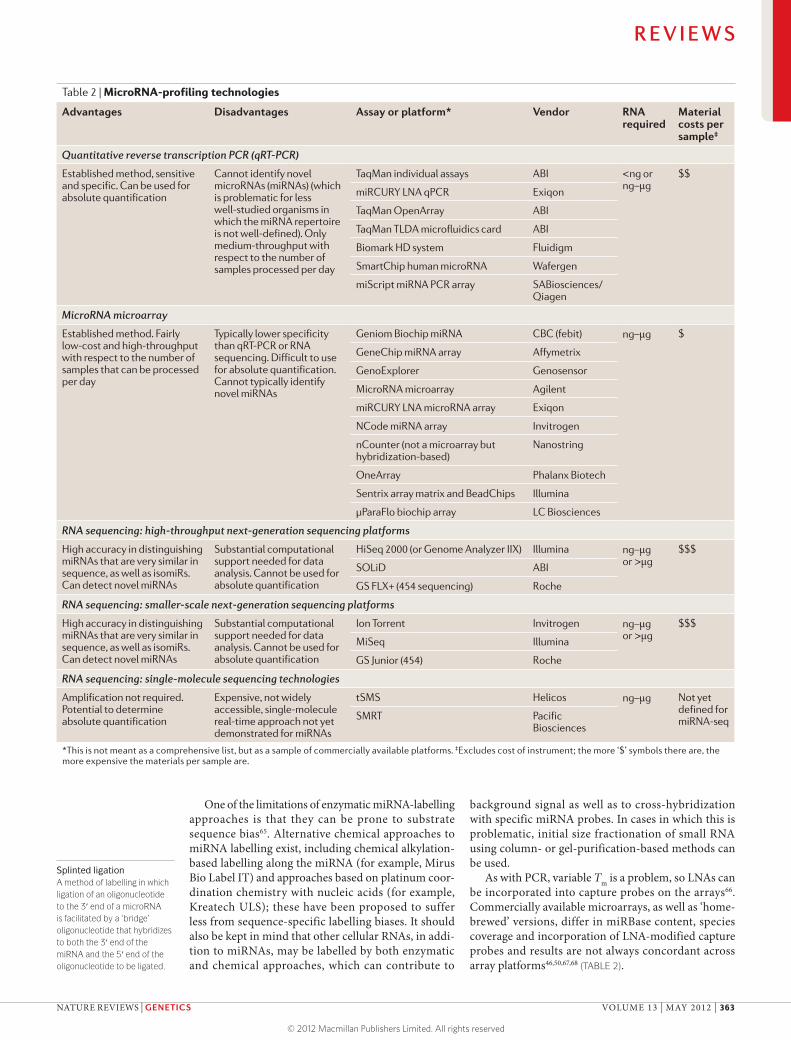
Table 2 | MicroRNA-profiling technologies
Advantages Disadvantages Assay or platform* Vendor RNA required
Material costs per sample‡
Quantitative reverse transcription PCR (qRT-PCR)
Established method, sensitive and specific. Can be used for absolute quantification
Cannot identify novel microRNAs (miRNAs) (which is problematic for less well-studied organisms in which the miRNA repertoire is not well-defined). Only medium-throughput with respect to the number of samples processed per day
TaqMan individual assays ABI <ng or ng–μg
$$
miRCURY LNA qPCR Exiqon
TaqMan OpenArray ABI
TaqMan TLDA microfluidics card ABI
Biomark HD system Fluidigm
SmartChip human microRNA Wafergen
miScript miRNA PCR array SABiosciences/Qiagen
MicroRNA microarray
Established method. Fairly low-cost and high-throughput with respect to the number of samples that can be processed per day
Typically lower specificity than qRT-PCR or RNA sequencing. Difficult to use for absolute quantification. Cannot typically identify novel miRNAs
Geniom Biochip miRNA CBC (febit) ng–μg $
GeneChip miRNA array Affymetrix
GenoExplorer Genosensor
MicroRNA microarray Agilent
miRCURY LNA microRNA array Exiqon
NCode miRNA array Invitrogen
nCounter (not a microarray but hybridization-based)
Nanostring
OneArray Phalanx Biotech
Sentrix array matrix and BeadChips Illumina
μParaFlo biochip array LC Biosciences
RNA sequencing: high-throughput next-generation sequencing platforms
High accuracy in distinguishing miRNAs that are very similar in sequence, as well as isomiRs. Can detect novel miRNAs
Substantial computational support needed for data analysis. Cannot be used for absolute quantification
HiSeq 2000 (or Genome Analyzer IIX) Illumina ng–μg or >μg
$$$
SOLiD ABI
GS FLX+ (454 sequencing) Roche
RNA sequencing: smaller-scale next-generation sequencing platforms
High accuracy in distinguishing miRNAs that are very similar in sequence, as well as isomiRs. Can detect novel miRNAs
Substantial computational support needed for data analysis. Cannot be used for absolute quantification
Ion Torrent Invitrogen ng–μg or >μg
$$$
MiSeq Illumina
GS Junior (454) Roche
RNA sequencing: single-molecule sequencing technologies
Amplification not required. Potential to determine absolute quantification
Expensive, not widely accessible, single-molecule real-time approach not yet demonstrated for miRNAs
tSMS Helicos ng–μg Not yet defined for miRNA-seqSMRT Pacific
Biosciences
*This is not meant as a comprehensive list, but as a sample of commercially available platforms. ‡Excludes cost of instrument; the more ‘$’ symbols there are, the more expensive the materials per sample are.
Splinted ligationA method of labelling in which ligation of an oligonucleotide to the 3′ end of a microRNA is facilitated by a ‘bridge’ oligonucleotide that hybridizes to both the 3′ end of the miRNA and the 5′ end of the oligonucleotide to be ligated.
One of the limitations of enzymatic miRNA-labelling approaches is that they can be prone to substrate sequence bias65. Alternative chemical approaches to miRNA labelling exist, including chemical alkylation-based labelling along the miRNA (for example, Mirus Bio Label IT) and approaches based on platinum coor-dination chemistry with nucleic acids (for example, Kreatech ULS); these have been proposed to suffer less from sequence-specific labelling biases. It should also be kept in mind that other cellular RNAs, in addi-tion to miRNAs, may be labelled by both enzymatic and chemical approaches, which can contribute to
background signal as well as to cross-hybridization with specific miRNA probes. In cases in which this is problematic, initial size fractionation of small RNA using column- or gel-purification-based methods can be used.
As with PCR, variable Tm is a problem, so LNAs can be incorporated into capture probes on the arrays66. Commercially available microarrays, as well as ‘home-brewed’ versions, differ in miRBase content, species coverage and incorporation of LNA-modified capture probes and results are not always concordant across array platforms46,50,67,68 (TABLE 2).
R E V I E W S
NATURE REVIEWS | GENETICS VOLUME 13 | MAY 2012 | 363
© 2012 Macmillan Publishers Limited. All rights reserved
Nature Reviews | Genetics
Capture onto surface (for example, streptavidin)Wash off unhybridizedprobesQuantify number of fluorescent codes corresponding to miRNA targets ofinterest
Microarray of spotted captureprobes
miRNAs inRNA sample
Hybridization and washing
miRNA reversetranscribed to cDNA library
Adaptorligation
Oligo-d(T)primer
Stem–loop primer
Poly(A) tailing
a qRT-PCR
c Nanostring nCounter
Mature miRNA
Mature miRNA
AAAAAAATTTTTTT
AAAAAAATTTTTTT
Q
miRNA-specificforward primer
3′5′
3′
5′3′
5′ 3′
5′ReverseprimerDetect by TaqMan
probe (real-time PCR)
Detect bySYBR green
AAAAAAA
384-well qPCR plate
Microfluidic card
∗∗
∗Fluorescent labelling of miRNAHybridization to array of DNA-based capture probesWashing and scanning of arrayData extraction and processing
Fluorescentlabelling
Illumina:HiSeq or GAIIX
Roche: GSFLX+ or 454
ABI: SOLiD
cDNA immobilizedon surfaceSolid-phase PCR
cDNA immobilizedon beadEmulsion PCR
d RNA-seq
b miRNA microarray
Captureprobe
Reporter probe with5′ colour code signal
miRNA Tag
Biotin
Ligation
Bridge
Reversetranscription
F
miRNA-specificforward primer
3′ 5′
Reverse primer
∗ ∗ ∗ ∗∗
∗ ∗12
34
1
2
1
2
1
2
3
R E V I E W S
364 | MAY 2012 | VOLUME 13 www.nature.com/reviews/genetics
© 2012 Macmillan Publishers Limited. All rights reserved
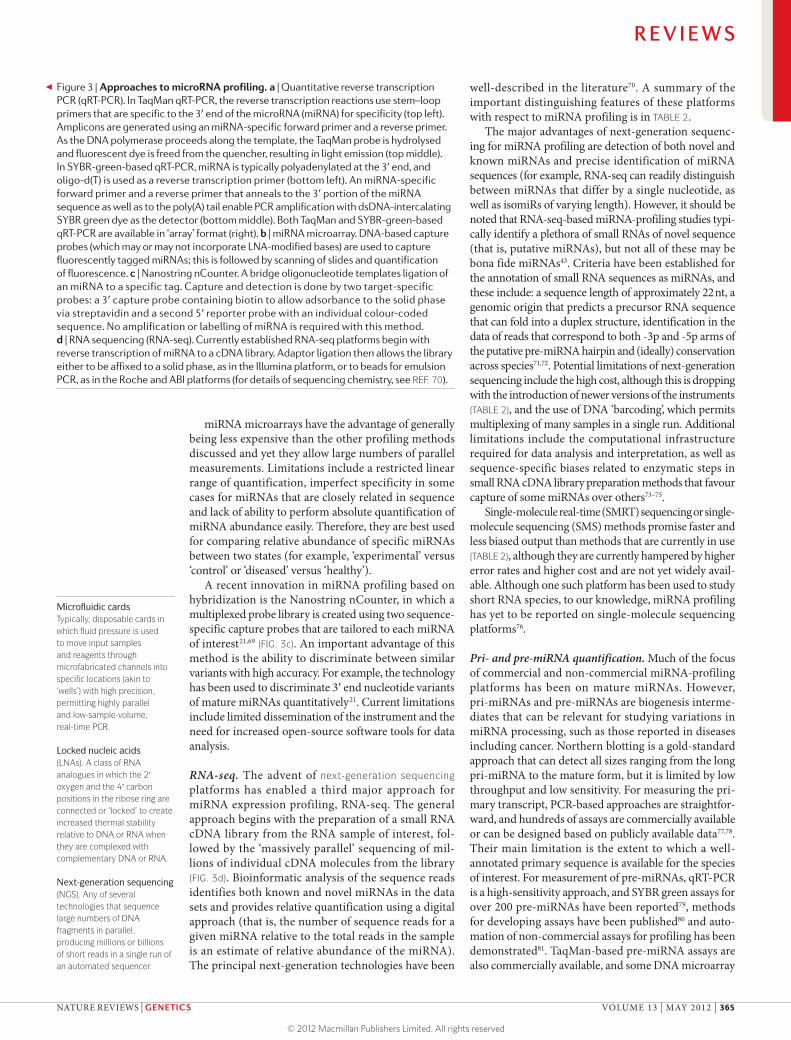
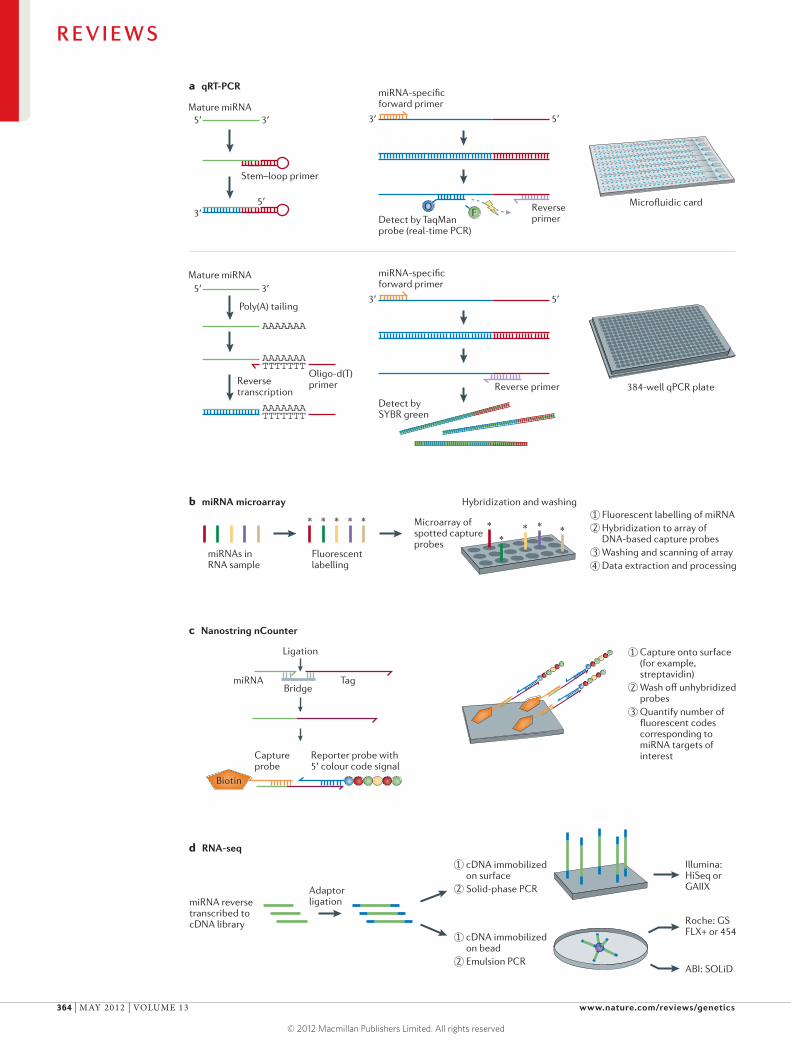
Figure 3 | Approaches to microRNA profiling. a | Quantitative reverse transcription PCR (qRT-PCR). In TaqMan qRT-PCR, the reverse transcription reactions use stem–loop primers that are specific to the 3′ end of the microRNA (miRNA) for specificity (top left). Amplicons are generated using an miRNA-specific forward primer and a reverse primer. As the DNA polymerase proceeds along the template, the TaqMan probe is hydrolysed and fluorescent dye is freed from the quencher, resulting in light emission (top middle). In SYBR-green-based qRT-PCR, miRNA is typically polyadenylated at the 3′ end, and oligo-d(T) is used as a reverse transcription primer (bottom left). An miRNA-specific forward primer and a reverse primer that anneals to the 3′ portion of the miRNA sequence as well as to the poly(A) tail enable PCR amplification with dsDNA-intercalating SYBR green dye as the detector (bottom middle). Both TaqMan and SYBR-green-based qRT-PCR are available in ‘array’ format (right). b | miRNA microarray. DNA-based capture probes (which may or may not incorporate LNA-modified bases) are used to capture fluorescently tagged miRNAs; this is followed by scanning of slides and quantification of fluorescence. c | Nanostring nCounter. A bridge oligonucleotide templates ligation of an miRNA to a specific tag. Capture and detection is done by two target-specific probes: a 3′ capture probe containing biotin to allow adsorbance to the solid phase via streptavidin and a second 5′ reporter probe with an individual colour-coded sequence. No amplification or labelling of miRNA is required with this method. d | RNA sequencing (RNA-seq). Currently established RNA-seq platforms begin with reverse transcription of miRNA to a cDNA library. Adaptor ligation then allows the library either to be affixed to a solid phase, as in the Illumina platform, or to beads for emulsion PCR, as in the Roche and ABI platforms (for details of sequencing chemistry, see REF. 70).
◀
Microfluidic cardsTypically, disposable cards in which fluid pressure is used to move input samples and reagents through microfabricated channels into specific locations (akin to ‘wells’) with high precision, permitting highly parallel and low-sample-volume, real-time PCR.
Locked nucleic acids(LNAs). A class of RNA analogues in which the 2′ oxygen and the 4′ carbon positions in the ribose ring are connected or ‘locked’ to create increased thermal stability relative to DNA or RNA when they are complexed with complementary DNA or RNA.
Next-generation sequencing(NGS). Any of several technologies that sequence large numbers of DNA fragments in parallel, producing millions or billions of short reads in a single run of an automated sequencer.
miRNA microarrays have the advantage of generally being less expensive than the other profiling methods discussed and yet they allow large numbers of parallel measurements. Limitations include a restricted linear range of quantification, imperfect specificity in some cases for miRNAs that are closely related in sequence and lack of ability to perform absolute quantification of miRNA abundance easily. Therefore, they are best used for comparing relative abundance of specific miRNAs between two states (for example, ‘experimental’ versus ‘control’ or ‘diseased’ versus ‘healthy’).
A recent innovation in miRNA profiling based on hybridization is the Nanostring nCounter, in which a multiplexed probe library is created using two sequence-specific capture probes that are tailored to each miRNA of interest21,69 (FIG. 3c). An important advantage of this method is the ability to discriminate between similar variants with high accuracy. For example, the technology has been used to discriminate 3′ end nucleotide variants of mature miRNAs quantitatively21. Current limitations include limited dissemination of the instrument and the need for increased open-source software tools for data analysis.
RNA-seq. The advent of next-generation sequencing platforms has enabled a third major approach for miRNA expression profiling, RNA-seq. The general approach begins with the preparation of a small RNA cDNA library from the RNA sample of interest, fol-lowed by the ‘massively parallel’ sequencing of mil-lions of individual cDNA molecules from the library (FIG. 3d). Bioinformatic analysis of the sequence reads identifies both known and novel miRNAs in the data sets and provides relative quantification using a digital approach (that is, the number of sequence reads for a given miRNA relative to the total reads in the sample is an estimate of relative abundance of the miRNA). The principal next-generation technologies have been
well-described in the literature70. A summary of the important distinguishing features of these platforms with respect to miRNA profiling is in TABLE 2.
The major advantages of next-generation sequenc-ing for miRNA profiling are detection of both novel and known miRNAs and precise identification of miRNA sequences (for example, RNA-seq can readily distinguish between miRNAs that differ by a single nucleotide, as well as isomiRs of varying length). However, it should be noted that RNA-seq-based miRNA-profiling studies typi-cally identify a plethora of small RNAs of novel sequence (that is, putative miRNAs), but not all of these may be bona fide miRNAs43. Criteria have been established for the annotation of small RNA sequences as miRNAs, and these include: a sequence length of approximately 22 nt, a genomic origin that predicts a precursor RNA sequence that can fold into a duplex structure, identification in the data of reads that correspond to both -3p and -5p arms of the putative pre-miRNA hairpin and (ideally) conservation across species71,72. Potential limitations of next-generation sequencing include the high cost, although this is dropping with the introduction of newer versions of the instruments (TABLE 2), and the use of DNA ‘barcoding’, which permits multiplexing of many samples in a single run. Additional limitations include the computational infrastructure required for data analysis and interpretation, as well as sequence-specific biases related to enzymatic steps in small RNA cDNA library preparation methods that favour capture of some miRNAs over others73–75.
Single-molecule real-time (SMRT) sequencing or single- molecule sequencing (SMS) methods promise faster and less biased output than methods that are currently in use (TABLE 2), although they are currently hampered by higher error rates and higher cost and are not yet widely avail-able. Although one such platform has been used to study short RNA species, to our knowledge, miRNA profiling has yet to be reported on single-molecule sequencing platforms76.
Pri- and pre-miRNA quantification. Much of the focus of commercial and non-commercial miRNA-profiling platforms has been on mature miRNAs. However, pri-miRNAs and pre-miRNAs are biogenesis interme-diates that can be relevant for studying variations in miRNA processing, such as those reported in diseases including cancer. Northern blotting is a gold-standard approach that can detect all sizes ranging from the long pri-miRNA to the mature form, but it is limited by low throughput and low sensitivity. For measuring the pri-mary transcript, PCR-based approaches are straightfor-ward, and hundreds of assays are commercially available or can be designed based on publicly available data77,78. Their main limitation is the extent to which a well-annotated primary sequence is available for the species of interest. For measurement of pre-miRNAs, qRT-PCR is a high-sensitivity approach, and SYBR green assays for over 200 pre-miRNAs have been reported79, methods for developing assays have been published80 and auto-mation of non-commercial assays for profiling has been demonstrated81. TaqMan-based pre-miRNA assays are also commercially available, and some DNA microarray
R E V I E W S
NATURE REVIEWS | GENETICS VOLUME 13 | MAY 2012 | 365
© 2012 Macmillan Publishers Limited. All rights reserved
Nature Reviews | Genetics
Nanostring
SensitivityDynamic range
No
No
Yes
Cost $$ $ $$$*++++ + ++++++ +/++ ++
qRT-PCR Microarray RNA-seq
qRT-PCR
RNA-seq
Low
Is accurate quantification important?
Is it important to measure novel miRNAs?
Is it important to distinguish isomiRs?
High
RNA input
Yes
No Yes
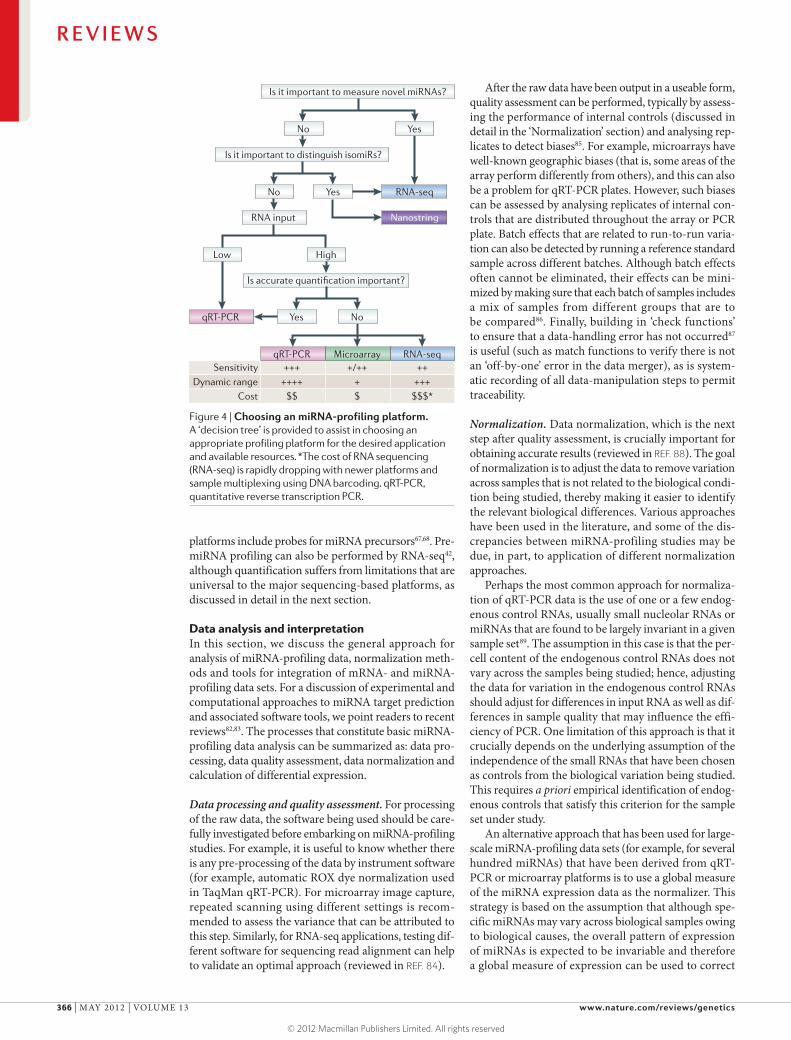
Figure 4 | Choosing an miRNA-profiling platform. A ‘decision tree’ is provided to assist in choosing an appropriate profiling platform for the desired application and available resources. *The cost of RNA sequencing (RNA-seq) is rapidly dropping with newer platforms and sample multiplexing using DNA barcoding. qRT-PCR, quantitative reverse transcription PCR.
platforms include probes for miRNA precursors67,68. Pre-miRNA profiling can also be performed by RNA-seq42, although quantification suffers from limitations that are universal to the major sequencing-based platforms, as discussed in detail in the next section.
Data analysis and interpretationIn this section, we discuss the general approach for analysis of miRNA-profiling data, normalization meth-ods and tools for integration of mRNA- and miRNA-profiling data sets. For a discussion of experimental and computational approaches to miRNA target prediction and associated software tools, we point readers to recent reviews82,83. The processes that constitute basic miRNA-profiling data analysis can be summarized as: data pro-cessing, data quality assessment, data normalization and calculation of differential expression.
Data processing and quality assessment. For processing of the raw data, the software being used should be care-fully investigated before embarking on miRNA-profiling studies. For example, it is useful to know whether there is any pre-processing of the data by instrument software (for example, automatic ROX dye normalization used in TaqMan qRT-PCR). For microarray image capture, repeated scanning using different settings is recom-mended to assess the variance that can be attributed to this step. Similarly, for RNA-seq applications, testing dif-ferent software for sequencing read alignment can help to validate an optimal approach (reviewed in REF. 84).
After the raw data have been output in a useable form, quality assessment can be performed, typically by assess-ing the performance of internal controls (discussed in detail in the ‘Normalization’ section) and analysing rep-licates to detect biases85. For example, microarrays have well-known geographic biases (that is, some areas of the array perform differently from others), and this can also be a problem for qRT-PCR plates. However, such biases can be assessed by analysing replicates of internal con-trols that are distributed throughout the array or PCR plate. Batch effects that are related to run-to-run varia-tion can also be detected by running a reference standard sample across different batches. Although batch effects often cannot be eliminated, their effects can be mini-mized by making sure that each batch of samples includes a mix of samples from different groups that are to be compared86. Finally, building in ‘check functions’ to ensure that a data-handling error has not occurred87 is useful (such as match functions to verify there is not an ‘off-by-one’ error in the data merger), as is system-atic recording of all data-manipulation steps to permit traceability.
Normalization. Data normalization, which is the next step after quality assessment, is crucially important for obtaining accurate results (reviewed in REF. 88). The goal of normalization is to adjust the data to remove variation across samples that is not related to the biological condi-tion being studied, thereby making it easier to identify the relevant biological differences. Various approaches have been used in the literature, and some of the dis-crepancies between miRNA-profiling studies may be due, in part, to application of different normalization approaches.
Perhaps the most common approach for normaliza-tion of qRT-PCR data is the use of one or a few endog-enous control RNAs, usually small nucleolar RNAs or miRNAs that are found to be largely invariant in a given sample set89. The assumption in this case is that the per-cell content of the endogenous control RNAs does not vary across the samples being studied; hence, adjusting the data for variation in the endogenous control RNAs should adjust for differences in input RNA as well as dif-ferences in sample quality that may influence the effi-ciency of PCR. One limitation of this approach is that it crucially depends on the underlying assumption of the independence of the small RNAs that have been chosen as controls from the biological variation being studied. This requires a priori empirical identification of endog-enous controls that satisfy this criterion for the sample set under study.
An alternative approach that has been used for large-scale miRNA-profiling data sets (for example, for several hundred miRNAs) that have been derived from qRT-PCR or microarray platforms is to use a global measure of the miRNA expression data as the normalizer. This strategy is based on the assumption that although spe-cific miRNAs may vary across biological samples owing to biological causes, the overall pattern of expression of miRNAs is expected to be invariable and therefore a global measure of expression can be used to correct
R E V I E W S
366 | MAY 2012 | VOLUME 13 www.nature.com/reviews/genetics
© 2012 Macmillan Publishers Limited. All rights reserved
PIWI-interacting RNAs(piRNAs). Small (23–32 nt) RNAs that are associated with PIWI clade proteins of the Argonaute family. They ensure genome stability in the germline of flies, mice and zebrafish by silencing transposable and repetitive elements.
for technical and/or sample quality differences. Several authors have discussed approaches along this line90–92, including quantile normalization and variations on this for microarray data. One of the most thorough inves-tigations for qRT-PCR data was a study93 in which the global mean expression of all miRNAs that were found to be expressed in a given sample was shown to be a more stable normalizer within sample sets being studied than a range of small nucleolar RNAs (snoRNAs) and miRNAs that had been proposed as endogenous controls in previous studies. The approach was validated using multiple data sets and extended to microarray data as well. An independent group has subsequently confirmed the performance of this method91, making it an appealing, straightforward method for normalization of large-scale miRNA-profiling data sets. For cases in which a small number of miRNAs are being profiled (for example, a few dozen or less), the global mean of expressed miRNAs is not an appropriate strategy. However, in such cases, a pilot large-scale profiling study on a subset of samples can be done to identify specific endogenous control miRNAs using the global mean approach; these control miRNAs can then be used as normalizers for small-scale miRNA profiling93.
A third approach is the use of spiked-in synthetic control miRNAs that are introduced into the RNA sample at a range of known input amounts and that are not normally present in the sample (for example, miRNAs from plants may be used as spike-ins into ani-mal RNA samples)40,85. This approach has the advan-tages of providing rigorous quality control, correcting for many aspects of technical variation (for example, sample-to-sample differences in miRNA-labelling efficiency for microarrays or reverse transcription for qRT-PCR-based profiling) and providing normaliza-tion over a range of signal intensities, as the spiked-in miRNAs represent a range of input amounts. However, it requires that assays for the spiked-in controls be avail-able on the platform that is being used and does not control for some technical variation, such as that due to measurement error in initial RNA quantification or pipetting. Combining the spiked-in control approach with ‘endogenous’ normalizer approaches, such as the global mean expression normalization method, may offer an ideal normalization strategy, although this has yet to be rigorously tested.
For miRNA profiling by next-generation sequencing analysis, normalization methods are much less well-developed, and the platform suffers from the limitation that the measurement of a particular miRNA is not inde-pendent of other miRNAs88. That is, unlike microarray or qRT-PCR technologies, if a given miRNA is present at high abundance in an RNA-seq sample, this reduces the number of sequence reads that are available for detec-tion and quantification of other miRNAs in the sample. Currently, a common approach is to represent the abun-dance of a given miRNA in a sample as the percentage of total reads (or, in some cases, total mappable reads) obtained. It is important to examine the overall fre-quency distribution of miRNA reads between samples; if the distributions are substantially different, differential
expression results may need to be interpreted with cau-tion. In the future, the development of a statistical frame-work for adjusting for differences in miRNA frequency distribution, and the use of synthetic miRNA spike-in approaches may provide improved data normalization between samples and improved quantification ability in RNA-seq experiments.
Calculating differential expression. miRNA-profiling experiments typically involve making comparisons between two or more groups, and therefore the next stage of analysis is usually the calculation of differen-tial miRNA expression between groups. The degree of fold-difference that constitutes meaningful differential expression will depend on the experimental context, although it is always useful to assess the statistical sig-nificance and false discovery rate that is associated with the differential miRNA expression. It is important to consider the dynamic range and accuracy of quantifi-cation of the platform when performing these calcu-lations. Generally, qRT-PCR has the widest dynamic range, highest accuracy and is the only method that can easily provide absolute miRNA quantification (for example, by generating standard curves from dilutions of synthetic miRNA oligonucleotides of known con-centration). miRNA microarrays are less expensive but tend to have a lower sensitivity and dynamic range and are therefore best used as discovery tools rather than as quantitative assay platforms. For RNA-seq, it is worth noting that miRNA quantification is expressed as a value relative to the total number of sequence reads for a given sample; thus, as mentioned earlier, comparisons between samples with high variance in miRNA distri-bution of expression may not be reliable, and absolute quantification is not possible.
Integrative analyses of miRNAs and mRNA profiles in gene regulatory networks. A major area of interest in miRNA-profiling analysis is integration of miRNA pro-files with mRNA profiles and other large-scale genomic data sets (reviewed in REF. 94); this has the potential to yield a better understanding of gene regulation and to improve systems-level modelling. In silico tools are increasingly becoming available for functional analy-sis of altered miRNA subsets and for interrogation of miRNA regulatory networks95–99 (BOX 1).
Future directionsIn order to understand the roles of miRNAs in gene regulation and disease better, further work on profiling pri-miRNAs and pre-miRNAs is likely to be useful, as is more extensive integration with other large-scale data sets. In addition, it is becoming increasingly appreciated that miRNAs are subcompartmentalized within cells (for example, miRNA in the nucleus versus the cytoplasm or miRNAs present in different protein complexes). Therefore, new insights may be provided by miRNA pro-filing of specific subcellular compartments rather than extracts from whole cells, as has been the most prevalent approach. Profiling of miRNAs that are bound to their targets (for example, by HITS–CLIP or PAR-CLIP) is likely
R E V I E W S
NATURE REVIEWS | GENETICS VOLUME 13 | MAY 2012 | 367
© 2012 Macmillan Publishers Limited. All rights reserved
1. Lee, R. C., Feinbaum, R. L. & Ambros, V. The C. elegans heterochronic gene lin-4 encodes small RNAs with antisense complementarity to lin-14. Cell 75, 843–854 (1993).
2. Wightman, B., Ha, I. & Ruvkun, G. Posttranscriptional regulation of the heterochronic gene lin-14 by lin-4 mediates temporal pattern formation in C. elegans. Cell 75, 855–862 (1993).
3. Reinhart, B. J. et al. The 21-nucleotide let-7 RNA regulates developmental timing in Caenorhabditis elegans. Nature 403, 901–906 (2000).
4. Wienholds, E. et al. MicroRNA expression in zebrafish embryonic development. Science 309, 310–311 (2005).
5. Alvarez-Garcia, I. & Miska, E. A. MicroRNA functions in animal development and human disease. Development 132, 4653–4662 (2005).
6. Lu, J. et al. MicroRNA expression profiles classify human cancers. Nature 435, 834–838 (2005).This was one of the earliest large-scale studies demonstrating the use of tissue-based miRNA profiles to classify human cancers.
7. Rosenfeld, N. et al. MicroRNAs accurately identify cancer tissue origin. Nature Biotech. 26, 462–469 (2008).Results from this study were used to create a commercial miRNA profile-based ‘tissue of origin’ test to aid clinicians in the classification of cancers for which the site of origin is otherwise not discernible.
8. Boeri, M. et al. MicroRNA signatures in tissues and plasma predict development and prognosis of computed tomography detected lung cancer. Proc. Natl Acad. Sci. USA 108, 3713–3718 (2011).
9. Tili, E., Michaille, J. J., Costinean, S. & Croce, C. M. MicroRNAs, the immune system and rheumatic disease. Nature Clin. Pract. Rheum. 4, 534–541 (2008).
10. Courts, C. & Madea, B. Specific micro-RNA signatures for the detection of saliva and blood in forensic body-fluid identification. J. Forensic Sci. 56, 1464–1470 (2011).
11. Krol, J., Loedige, I. & Filipowicz, W. The widespread regulation of microRNA biogenesis, function and decay. Nature Rev. Genet. 11, 597–610 (2010).This comprehensive Review nicely outlines aspects of miRNA biogenesis that are beyond the scope of the present Review.
12. Davis-Dusenbery, B. N. & Hata, A. Mechanisms of control of microRNA biogenesis. J. Biochem. 148, 381–392 (2010).
13. Ragan, C., Zuker, M. & Ragan, M. A. Quantitative prediction of miRNA-mRNA interaction based on equilibrium concentrations. PLoS Comput. Biol. 7, e1001090 (2011).
14. Liang, Y., Ridzon, D., Wong, L. & Chen, C. Characterization of microRNA expression profiles in normal human tissues. BMC Genomics 8, 166 (2007).
15. Griffiths-Jones, S., Grocock, R. J., van Dongen, S., Bateman, A. & Enright, A. J. miRBase: microRNA sequences, targets and gene nomenclature. Nucleic Acids Res. 34, D140–D144 (2006).
16. Griffiths-Jones, S., Saini, H. K., van Dongen, S. & Enright, A. J. miRBase: tools for microRNA genomics. Nucleic Acids Res. 36, D154–D158 (2008).
17. Griffiths-Jones, S. The microRNA Registry. Nucleic Acids Res. 32, D109–D111 (2004).
18. Katoh, T. et al. Selective stabilization of mammalian microRNAs by 3′ adenylation mediated by the cytoplasmic poly(A) polymerase GLD-2. Genes Dev. 23, 433–438 (2009).
19. Jones, M. R. et al. Zcchc11-dependent uridylation of microRNA directs cytokine expression. Nature Cell Biol. 11, 1157–1163 (2009).
20. Kozomara, A. & Griffiths-Jones, S. miRBase: integrating microRNA annotation and deep-sequencing data. Nucleic Acids Res. 39, D152–D157 (2011).
21. Wyman, S. K. et al. Post-transcriptional generation of miRNA variants by multiple nucleotidyl transferases contributes to miRNA transcriptome complexity. Genome Res. 21, 1450–1461 (2011).
22. Cloonan, N. et al. MicroRNAs and their isomiRs function cooperatively to target common biological pathways. Genome Biol. 12, R126 (2011).
23. Ibberson, D., Benes, V., Muckenthaler, M. U. & Castoldi, M. RNA degradation compromises the reliability of microRNA expression profiling. BMC Biotechnol. 9, 102 (2009).
24. Podolska, A., Kaczkowski, B., Litman, T., Fredholm, M. & Cirera, S. How the RNA isolation method can affect microRNA microarray results. Acta Biochim. Pol. 58, 535–540 (2011).
25. Wang, W. X. et al. Focus on RNA isolation: obtaining RNA for microRNA (miRNA) expression profiling analyses of neural tissue. Biochim. Biophys. Acta 1779, 749–757 (2008).
26. Hammerle-Fickinger, A. et al. Validation of extraction methods for total RNA and miRNA from bovine blood prior to quantitative gene expression analyses. Biotechnol. Lett. 32, 35–44 (2010).
27. Weber, J. A. et al. The microRNA spectrum in 12 body fluids. Clin. Chem. 56, 1733–1741 (2010).
28. Accerbi, M. et al. Methods for isolation of total RNA to recover miRNAs and other small RNAs from diverse species. Methods Mol. Biol. 592, 31–50 (2010).
29. Castoldi, M., Benes, V., Hentze, M. W. & Muckenthaler, M. U. miChip: a microarray platform for expression profiling of microRNAs based on locked nucleic acid (LNA) oligonucleotide capture probes. Methods 43, 146–152 (2007).
30. Aravin, A. & Tuschl, T. Identification and characterization of small RNAs involved in RNA silencing. FEBS Lett. 579, 5830–5840 (2005).
31. Doleshal, M. et al. Evaluation and validation of total RNA extraction methods for microRNA expression analyses in formalin-fixed, paraffin-embedded tissues. J. Mol. Diagn. 10, 203–211 (2008).
32. Xi, Y. et al. Systematic analysis of microRNA expression of RNA extracted from fresh frozen and formalin-fixed paraffin-embedded samples. RNA 13, 1668–1674 (2007).
33. Dahlgaard, J. et al. Analytical variables influencing the performance of a miRNA based laboratory assay for prediction of relapse in stage I non-small cell lung cancer (NSCLC). BMC Res. Notes 4, 424 (2011).
34. Mitchell, P. S. et al. Circulating microRNAs as stable blood-based markers for cancer detection. Proc. Natl Acad. Sci. USA 105, 10513–10518 (2008).This study demonstrated that miRNAs are present at high concentrations in human serum and plasma, are surprisingly stable and are changed in the setting of disease.
35. McDonald, J. S., Milosevic, D., Reddi, H. V., Grebe, S. K. & Algeciras-Schimnich, A. Analysis of circulating microRNA: preanalytical and analytical challenges. Clin. Chem. 57, 833–840 (2011).
36. Duttagupta, R., Jiang, R., Gollub, J., Getts, R. C. & Jones, K. W. Impact of cellular miRNAs on circulating miRNA biomarker signatures. PLoS ONE 6, e20769 (2011).
37. Pritchard, C. C. et al. Blood cell origin of circulating microRNAs: a cautionary note for cancer biomarker studies. Cancer Prev. Res. 5, 492–497 (2011).
38. Arroyo, J. D. et al. Argonaute2 complexes carry a population of circulating microRNAs independent of vesicles in human plasma. Proc. Natl Acad. Sci. USA 108, 5003–5008 (2011).
39. Becker, C., Hammerle-Fickinger, A., Riedmaier, I. & Pfaffl, M. W. mRNA and microRNA quality control for RT-qPCR analysis. Methods 50, 237–243 (2010).
40. Kroh, E. M., Parkin, R. K., Mitchell, P. S. & Tewari, M. Analysis of circulating microRNA biomarkers in plasma and serum using quantitative reverse transcription-PCR (qRT-PCR). Methods 50, 298–301 (2010).
41. Wark, A. W., Lee, H. J. & Corn, R. M. Multiplexed detection methods for profiling microRNA expression in biological samples. Angew. Chem. Int. Edn Engl. 47, 644–652 (2008).
42. Newman, M. A., Mani, V. & Hammond, S. M. Deep sequencing of microRNA precursors reveals extensive 3′ end modification. RNA 17, 1795–1803 (2011).This study demonstrated the usefulness of RNA-seq for pre-miRNA analysis and identified end modifications to the miRNA precursor, which may lead to sequence variation of mature miRNA forms as well.
43. Chiang, H. R. et al. Mammalian microRNAs: experimental evaluation of novel and previously annotated genes. Genes Dev. 24, 992–1009 (2010).
44. Wei, C., Salichos, L., Wittgrove, C. M., Rokas, A. & Patton, J. G. Transcriptome-wide analysis of small RNA expression in early zebrafish development. RNA (2012).
45. Burroughs, A. M. et al. A comprehensive survey of 3′ animal miRNA modification events and a possible role for 3′ adenylation in modulating miRNA targeting effectiveness. Genome Res. 20, 1398–1410 (2010).
46. Ach, R. A., Wang, H. & Curry, B. Measuring microRNAs: comparisons of microarray and quantitative PCR measurements, and of different total RNA prep methods. BMC Biotechnology 8, 69 (2008).This study systematically addressed the effect of different RNA preparation methods on miRNA profiling.
47. Chen, Y., Gelfond, J. A., McManus, L. M. & Shireman, P. K. Reproducibility of quantitative RT-PCR array in miRNA expression profiling and comparison with microarray analysis. BMC Genomics 10, 407 (2009).
48. Jensen, S. G. et al. Evaluation of two commercial global miRNA expression profiling platforms for detection of less abundant miRNAs. BMC Genomics 12, 435 (2011).
49. Git, A. et al. Systematic comparison of microarray profiling, real-time PCR, and next-generation sequencing technologies for measuring differential microRNA expression. RNA 16, 991–1006 (2010).
50. Pradervand, S. et al. Concordance among digital gene expression, microarrays, and qPCR when measuring differential expression of microRNAs. BioTechniques 48, 219–222 (2010).
51. Chamnongpol, S., Maroney, P. A. & Nilsen, T. W. A rapid, quantitative assay for direct detection of microRNAs and other small RNAs using splinted ligation. Methods Mol. Biol. 667, 3–17 (2010).
52. Maroney, P. A., Chamnongpol, S., Souret, F. & Nilsen, T. W. Direct detection of small RNAs using splinted ligation. Nature Protoc. 3, 279–287 (2008).
53. Chapin, S. C. & Doyle, P. S. Ultrasensitive multiplexed microRNA quantification on encoded gel microparticles using rolling circle amplification. Anal. Chem. 83, 7179–7185 (2011).
54. Harcourt, E. M. & Kool, E. T. Amplified microRNA detection by templated chemistry. Nucleic Acids Res. 25 Jan 2012 (doi:10.1093/nar/gkr1313).
55. Mashimo, Y., Mie, M., Suzuki, S. & Kobatake, E. Detection of small RNA molecules by a combination of branched rolling circle amplification and bioluminescent pyrophosphate assay. Anal. Bioanal. Chem. 401, 221–227 (2011).
56. Zhou, Y. et al. A dumbbell probe-mediated rolling circle amplification strategy for highly sensitive microRNA detection. Nucleic Acids Res. 38, e156 (2010).
57. Chan, H. M., Chan, L. S., Wong, R. N. & Li, H. W. Direct quantification of single-molecules of microRNA by total internal reflection fluorescence microscopy. Anal. Chem. 82, 6911–6918 (2010).
58. Jiang, L., Duan, D., Shen, Y. & Li, J. Direct microRNA detection with universal tagged probe and time-resolved fluorescence technology. Biosens. Bioelectron. 34, 291–295 (2012).
59. Nasheri, N. et al. An enzyme-linked assay for the rapid quantification of microRNAs based on the viral suppressor of RNA silencing protein p19. Anal. Biochem. 412, 165–172 (2011).
to improve as experimental methods and sequencing technologies progress. This could pay large dividends for investigations of biological processes in which miRNAs have an important regulatory role. We should also men-tion that other non-coding RNAs, such as PIWI-interacting RNAs (piRNAs), as well as long intergenic non-coding
RNAs (lincRNAs), are increasingly recognized as having important roles in cellular physiology, and it is likely that new classes of non-coding RNA remain to be discovered. In the future, profiling methods such as RNA-seq that have the potential to detect all classes of RNA are likely to shed light on the entirety of the transcriptome.
R E V I E W S
368 | MAY 2012 | VOLUME 13 www.nature.com/reviews/genetics
© 2012 Macmillan Publishers Limited. All rights reserved
60. Peng, Y. & Gao, Z. Amplified detection of microRNA based on ruthenium oxide nanoparticle-initiated deposition of an insulating film. Anal. Chem. 83, 820–827 (2011).
61. Persat, A., Chivukula, R. R., Mendell, J. T. & Santiago, J. G. Quantification of global microRNA abundance by selective isotachophoresis. Anal. Chem. 82, 9631–9635 (2010).
62. Persat, A. & Santiago, J. G. MicroRNA profiling by simultaneous selective isotachophoresis and hybridization with molecular beacons. Anal. Chem. 83, 2310–2316 (2011).
63. Qavi, A. J., Kindt, J. T., Gleeson, M. A. & Bailey, R. C. Anti-DNA:RNA antibodies and silicon photonic microring resonators: increased sensitivity for multiplexed microRNA detection. Anal. Chem. 83, 5949–5956 (2011).
64. Sipova, H. et al. Surface plasmon resonance biosensor for rapid label-free detection of microribonucleic acid at subfemtomole level. Anal. Chem. 82, 10110–10115 (2010).
65. Nelson, P. T., Wang, W. X., Wilfred, B. R. & Tang, G. Technical variables in high-throughput miRNA expression profiling: much work remains to be done. Biochim. Biophys. Acta 1779, 758–765 (2008).
66. Castoldi, M. et al. A sensitive array for microRNA expression profiling (miChip) based on locked nucleic acids (LNA). RNA 12, 913–920 (2006).
67. Liu, C. G., Calin, G. A., Volinia, S. & Croce, C. M. MicroRNA expression profiling using microarrays. Nature Protoc. 3, 563–578 (2008).
68. Yin, J. Q., Zhao, R. C. & Morris, K. V. Profiling microRNA expression with microarrays. Trends Biotechnol. 26, 70–76 (2008).
69. Geiss, G. K. et al. Direct multiplexed measurement of gene expression with color-coded probe pairs. Nature Biotech. 26, 317–325 (2008).
70. Metzker, M. L. Sequencing technologies — the next generation. Nature Rev. Genet. 11, 31–46 (2010).This is an excellent Review of the major next-generation sequencing platforms.
71. Ambros, V. et al. A uniform system for microRNA annotation. RNA 9, 277–279 (2003).
72. Ruby, J. G. et al. Large-scale sequencing reveals 21U-RNAs and additional microRNAs and endogenous siRNAs in C. elegans. Cell 127, 1193–207 (2006).
73. Linsen, S. E. et al. Limitations and possibilities of small RNA digital gene expression profiling. Nature Methods 6, 474–476 (2009).
74. Tian, G. et al. Sequencing bias: comparison of different protocols of microRNA library construction. BMC Biotechnology 10, 64 (2010).
75. Hafner, M. et al. RNA-ligase-dependent biases in miRNA representation in deep-sequenced small RNA cDNA libraries. RNA 17, 1697–1712 (2011).
76. Kapranov, P. et al. New class of gene-termini-associated human RNAs suggests a novel RNA copying mechanism. Nature 466, 642–646 (2010).
77. Schmittgen, T. D. et al. Real-time PCR quantification of precursor and mature microRNA. Methods 44, 31–38 (2008).
78. Benes, V. & Castoldi, M. Expression profiling of microRNA using real-time quantitative PCR, how to use it and what is available. Methods 50, 244–249 (2010).
79. Jiang, J., Lee, E. J., Gusev, Y. & Schmittgen, T. D. Real-time expression profiling of microRNA precursors in human cancer cell lines. Nucleic Acids Res. 33, 5394–5403 (2005).
80. Schmittgen, T. D., Jiang, J., Liu, Q. & Yang, L. A high-throughput method to monitor the expression of microRNA precursors. Nucleic Acids Res. 32, e43 (2004).This was one of the first studies to describe methods for profiling pre-miRNAs.
81. Chugh, P., Tamburro, K. & Dittmer, D. P. Profiling of pre-micro RNAs and microRNAs using quantitative real-time PCR (qPCR) arrays. J. Vis. Exp. 3 Dec 2010 (doi:10.3791/2210).
82. Thomas, M., Lieberman, J. & Lal, A. Desperately seeking microRNA targets. Nature Struct. Mol. Biol. 17, 1169–1174 (2010).
83. Thomson, D. W., Bracken, C. P. & Goodall, G. J. Experimental strategies for microRNA target identification. Nucleic Acids Res. 39, 6845–6853 (2011).
84. Garber, M., Grabherr, M. G., Guttman, M. & Trapnell, C. Computational methods for transcriptome annotation and quantification using RNA-seq. Nature Methods 8, 469–477 (2011).
85. Sarkar, D. et al. Quality assessment and data analysis for microRNA expression arrays. Nucleic Acids Res. 37, e17 (2009).
86. Leek, J. T. et al. Tackling the widespread and critical impact of batch effects in high-throughput data. Nature Rev. Genet. 11, 733–739 (2010).
87. Hutson, S. Data handling errors spur debate over clinical trial. Nature Med. 16, 618 (2010).
88. Meyer, S. U., Pfaffl, M. W. & Ulbrich, S. E. Normalization strategies for microRNA profiling experiments: a ‘normal’ way to a hidden layer of complexity? Biotechnol. Lett. 32, 1777–1788 (2010).
89. Peltier, H. J. & Latham, G. J. Normalization of microRNA expression levels in quantitative RT-PCR assays: identification of suitable reference RNA targets in normal and cancerous human solid tissues. RNA 14, 844–852 (2008).
90. Pradervand, S. et al. Impact of normalization on miRNA microarray expression profiling. RNA 15, 493–501 (2009).
91. Wylie, D., Shelton, J., Choudhary, A. & Adai, A. T. A novel mean-centering method for normalizing microRNA expression from high-throughput RT-qPCR data. BMC Res. Notes 4, 555 (2011).
92. Risso, D., Massa, M. S., Chiogna, M. & Romualdi, C. A modified LOESS normalization applied to microRNA arrays: a comparative evaluation. Bioinformatics 25, 2685–2691 (2009).
93. Mestdagh, P. et al. A novel and universal method for microRNA RT-qPCR data normalization. Genome Biol. 10, R64 (2009).
94. Gunaratne, P. H., Creighton, C. J., Watson, M. & Tennakoon, J. B. Large-scale integration of microRNA and gene expression data for identification of enriched microRNA–mRNA associations in biological systems. Methods Mol. Biol. 667, 297–315 (2010).
95. Sales, G. et al. MAGIA, a web-based tool for miRNA and genes integrated analysis. Nucleic Acids Res. 38, W352–W359 (2010).
96. Huang, G. T., Athanassiou, C. & Benos, P. V. mirConnX: condition-specific mRNA–microRNA network integrator. Nucleic Acids Res. 39, W416–W423 (2011).
97. Jiang, Q. et al. miR2Disease: a manually curated database for microRNA deregulation in human disease. Nucleic Acids Res. 37, D98–D104 (2009).
98. Lagana, A. et al. miRo: a miRNA knowledge base. Database 2009, bap008 (2009).
99. Ulitsky, I. et al. Expander: from expression microarrays to networks and functions. Nature Protoc. 5, 303–322 (2010).
100. Bizuayehu, T. T. et al. Differential expression patterns of conserved miRNAs and isomiRs during Atlantic halibut development. BMC Genomics 13, 11 (2012).
101. Yao, Y. et al. Cloning and characterization of microRNAs from wheat (Triticum aestivum L.). Genome Biol. 8, R96 (2007).
102. Ule, J., Jensen, K., Mele, A. & Darnell, R. B. CLIP: a method for identifying protein-RNA interaction sites in living cells. Methods 37, 376–386 (2005).
103. Ule, J. et al. CLIP identifies Nova-regulated RNA networks in the brain. Science 302, 1212–1215 (2003).
104. Hafner, M. et al. PAR-CliP—a method to identify transcriptome-wide the binding sites of RNA binding proteins. J. Vis. Exp. 2 Jul 2010 (doi:10.3791/2034).
105. Hafner, M. et al. Transcriptome-wide identification of RNA-binding protein and microRNA target sites by PAR-CLIP. Cell 141, 129–141 (2010).
106. Lopes, C. T. et al. Cytoscape Web: an interactive web-based network browser. Bioinformatics 26, 2347–2348 (2010).
107. Buckley, P. G. et al. Chromosomal and microRNA expression patterns reveal biologically distinct subgroups of 11q- neuroblastoma. Clin. Cancer Res. 16, 2971–2978 (2010).
108. Ji, J. et al. MicroRNA expression, survival, and response to interferon in liver cancer. New Engl. J. Med. 361, 1437–1447 (2009).
109. Lai, C. Y. et al. MicroRNA expression aberration as potential peripheral blood biomarkers for schizophrenia. PLoS ONE 6, e21635 (2011).
110. Saal, S. & Harvey, S. J. MicroRNAs and the kidney: coming of age. Curr. Opin. Nephrol. Hypertens. 18, 317–323 (2009).
111. Guerau-de-Arellano, M., Alder, H., Ozer, H. G., Lovett-Racke, A. & Racke, M. K. miRNA profiling for biomarker discovery in multiple sclerosis: from microarray to deep sequencing. J. Neuroimmunol. 9 Nov 2011 (doi:10.1016/j.jneuroim.2011.10.006).
112. Ferracin, M. et al. MicroRNA profiling for the identification of cancers with unknown primary tissue-of-origin. J. Pathol. 225, 43–53 (2011).
113. Varadhachary, G. R. et al. Prospective gene signature study using microRNA to identify the tissue of origin in patients with carcinoma of unknown primary. Clin. Cancer Res. 17, 4063–4070 (2011).
114. Lawrie, C. H. et al. Detection of elevated levels of tumour-associated microRNAs in serum of patients with diffuse large B-cell lymphoma. Br. J. Haematol. 141, 672–675 (2008).
115. Chen, X. et al. Characterization of microRNAs in serum: a novel class of biomarkers for diagnosis of cancer and other diseases. Cell Res. 18, 997–1006 (2008).
116. Kim, D. J. et al. Plasma components affect accuracy of circulating cancer-related microRNA quantitation. J. Mol. Diagn.14, 71–80 (2012).
117. Watson, A. K. & Witwer, K. W. Do platform-specific factors explain microRNA profiling disparities? Clin. Chem. 58, 472–474 (2011).
118. Zubakov, D. et al. MicroRNA markers for forensic body fluid identification obtained from microarray screening and quantitative RT-PCR confirmation. Int. J. Legal Med. 124, 217–226 (2010).
119. Stark, M. S. et al. Characterization of the melanoma miRNAome by deep sequencing. PLoS ONE 5, e9685 (2010).
120. Hoefig, K. P. & Heissmeyer, V. Measuring microRNA expression in size-limited FACS-sorted and microdissected samples. Methods Mol. Biol. 667, 47–63 (2010).
AcknowledgementsWe thank J. Tait for helpful comments on the manuscript. We acknowledge the many authors whose work could not be cited owing to space constraints. M.T. acknowledges generous support from a Damon Runyon-Rachleff Innovation Award, a Stand Up To Cancer Innovative Research Grant (Innovative Research Grant SU2C-AACR-IRG1109), a Prostate Cancer Foundation Creativity Award and funding from the US National Institutes of Health (R01DK085714; P50 CA83636; 5 P30 CA015704; P50 CA97186) and Department of Defense (PC074012; OC080159).
Competing interests statementThe authors declare competing financial interests: see Web version for details.
FURTHER INFORMATIONMuneesh Tewari’s homepage: http://labs.fhcrc.org/tewari/index.htmlDiscussion of miRNA naming conventions: http://www.mirbase.org/blog/2011/04/whats-in-a-name/MAGIA: http://gencomp.bio.unipd.it/magiamiR2disease: http://www.mir2disease.orgmiRanda: http://www.microRNA.orgmiRBase: http://www.mirbase.orgmirConnX: http://www.benoslab.pitt.edu/mirconnxmiR-Ontology database: http://ferrolab.dmi.unict.it/miroNature Reviews Genetics Series on Non-coding RNA: http://www.nature.com/nrg/series/noncoding/index.htmlNature Reviews Genetics Series on Translational genetics: http://www.nature.com/nrg/series/translational/index.htmlPicTar: http://pictar.mdc-berlin.deTargetscan: http://www.targetscan.org
SUPPLEMENTARY INFORMATIONSee online article: S1 (figure) | S2 (box) | S3 (table)
ALL LINKS ARE ACTIVE IN THE ONLINE PDF
R E V I E W S
NATURE REVIEWS | GENETICS VOLUME 13 | MAY 2012 | 369
© 2012 Macmillan Publishers Limited. All rights reserved