principles in effective incentive design - · pdf fileprinciples in effective incentive...
TRANSCRIPT

Copyright © 2015 by The Segal Group, Inc. All rights reserved.
Principles In Effective Incentive Design
Executive, broad-based, and sales force employees September 2015
2
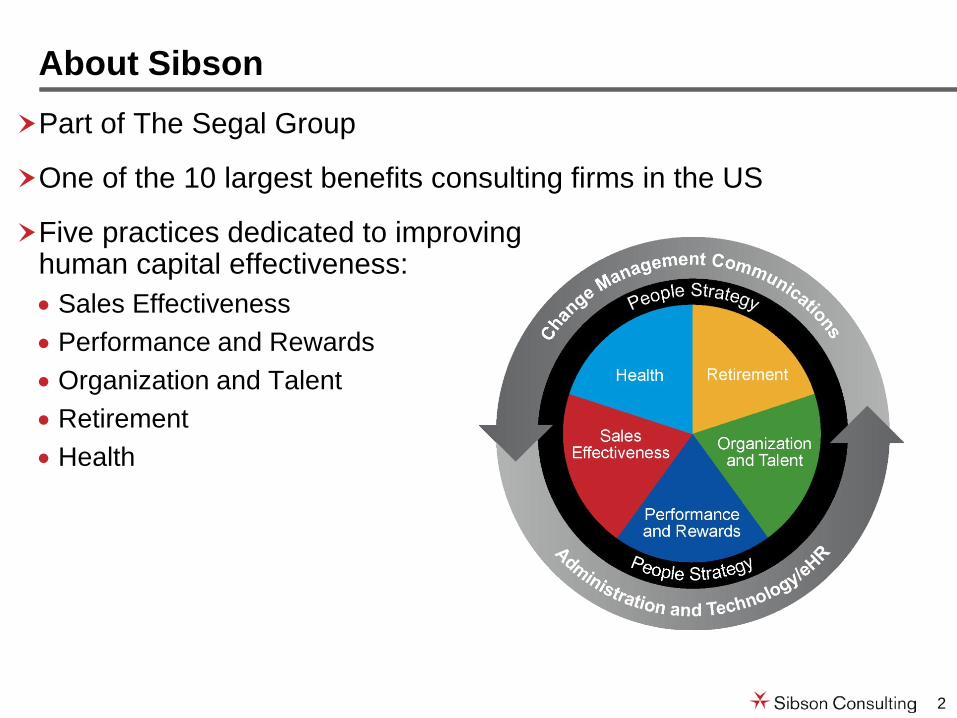
Part of The Segal Group
One of the 10 largest benefits consulting firms in the US
Five practices dedicated to improving human capital effectiveness: • Sales Effectiveness • Performance and Rewards • Organization and Talent • Retirement • Health
About Sibson

3
Incentive Design Principles
Special Considerations for Sales Compensation
Administration & Communication
4
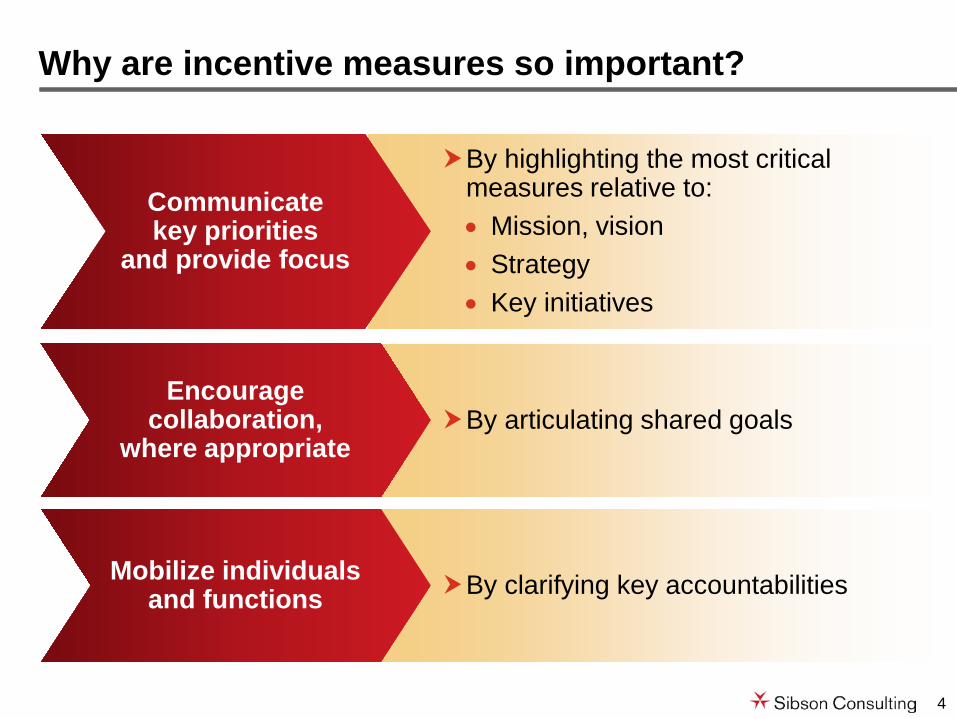
By clarifying key accountabilities
By articulating shared goals
By highlighting the most critical measures relative to: • Mission, vision • Strategy • Key initiatives
Why are incentive measures so important?
Mobilize individuals and functions
Communicate key priorities
and provide focus
Encourage collaboration,
where appropriate

5
Incentive Design Framework Design Elements
Purpose and Type
• What is the purpose of the plan (i.e., How should the plan support business performance)?
• What is the focus of the plan—individual, team?
Participation and Eligibility
• What criteria must be met to participate in the plan? – Business Impact: Which positions and workforce
segments have an impact on company performance? – Internal Equity: Which position should be included
from an internal equity perspective? – Market Practice: Which positions are typically
incentive eligible among peer companies?
• What is the process for selecting measures? • What criteria are used to measure performance? What is
the goal setting process?
Measures and Performance
Targets

6
Funding • What is the best funding approach—budgeted, self-funded,
discretionary, blended? • Are funding guidelines aligned with the economics of the business?
Payout Mechanics
• What is the target award opportunity? Leverage? How is the award calculated?
• What should be the frequency of awards? • How should payments be made—cash, deferred cash, stock? • What testing / cost modeling will be done before implementation
• How will potential participants learn about and buy in to the program?
Governance and
Administration
• What is the form of review? How is the performance evaluated (managerial, HR, forced, etc.)?
• How are award decisions reviewed and calibrated across the division/organization?
• Who will monitor the compensation / risk profile of the plan? • Who will manage the day-to-day aspects of the plan? • What happens if an employee is terminated, transferred or goes
on disability?
Incentive Design Framework Design Elements continued
Communication

7
Key Inputs to Incentive Plan Design
KEY INPUTS TO INCENTIVE DESIGN
Sustainable Incentive Design Solutions
Business Strategy and Annual Goals
Employment Value
Exchange
Market Trends and
Best Practices

8
Remember the Context: A Distinct EVP May Emphasize Areas Other Than Compensation
• Wealth through stock options • Competitive base pay • Large differentiation for
performance
• Big name: great resume value
• High growth
• Save the world mission • Good citizen • Philanthropy
• Family-like work environment
• Big company
• Slightly below competitive base pay
• Little differentiation
• 50th percentile on all compensation
• Little differentiation
• Competitive benefits • Incredible benefits: daycare, lunch subsidy, time off
• Competitive benefits
• Long hours; high energy • Technical skills revered
• Work/life balance • Be on the team
• Work/life balance • Flexibility to do job
• Company growth provides career options
• You can work here a long time
• Slow steady career • Promote from within
Company 1 Company 2 Company 3
Wealth Creation Make a Difference in the World Great Lifestyle
Emphasis of EVP
Compensation
Career
Benefits
Work Content
Affiliation

9
Industry
Role Banking Professional
Services Manufacturing
Executives
Upper Middle Management
Supervisory
Professional
The Prominence of Incentives Vary By Level and Industry
Dominant Partial
RELATIVE PROMINENCE OF INCENTIVES BY ROLE AND INDUSTRY
(ILLUSTRATIVE)
Low
10
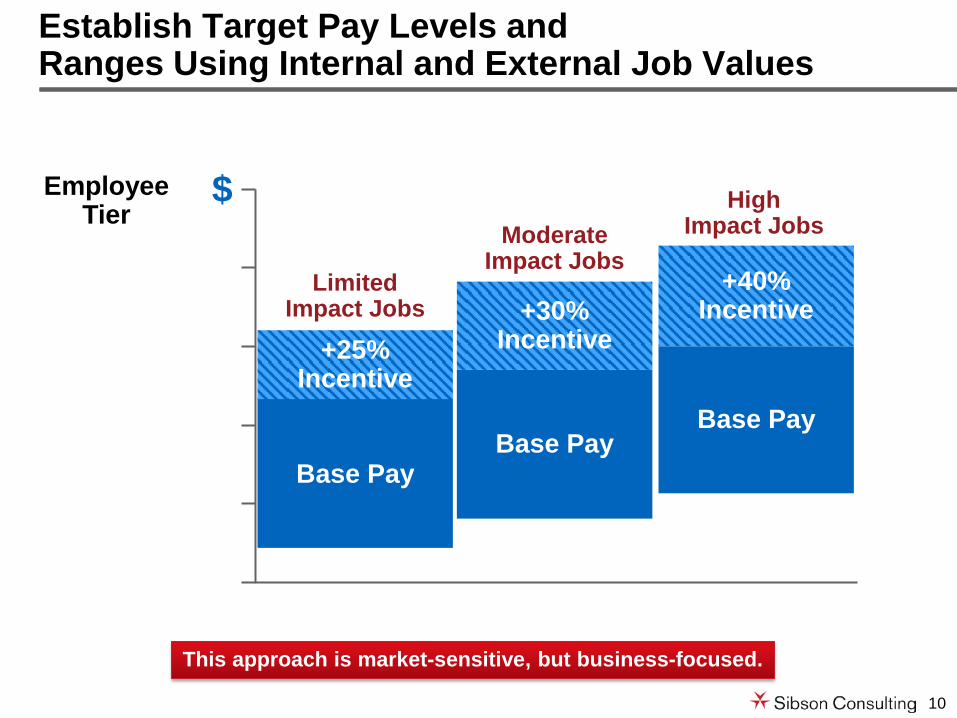
Establish Target Pay Levels and Ranges Using Internal and External Job Values
Limited Impact Jobs
Base Pay
+25% Incentive
Moderate Impact Jobs
Base Pay
+30% Incentive
High Impact Jobs
Base Pay
+40% Incentive
$
This approach is market-sensitive, but business-focused.
Employee Tier

11
Performance Measures
Incentive Measure Selection Involves a Number of Considerations
5. Standard
3. Level
1. Nature
4. Timing
2. Hardness
What specific results should be measured?
Will these results be assessed on a quantitative or qualitative basis?
At what organization level should results be measured?
Over what timeframe should results be
measured?
How should performance targets
be established?
12
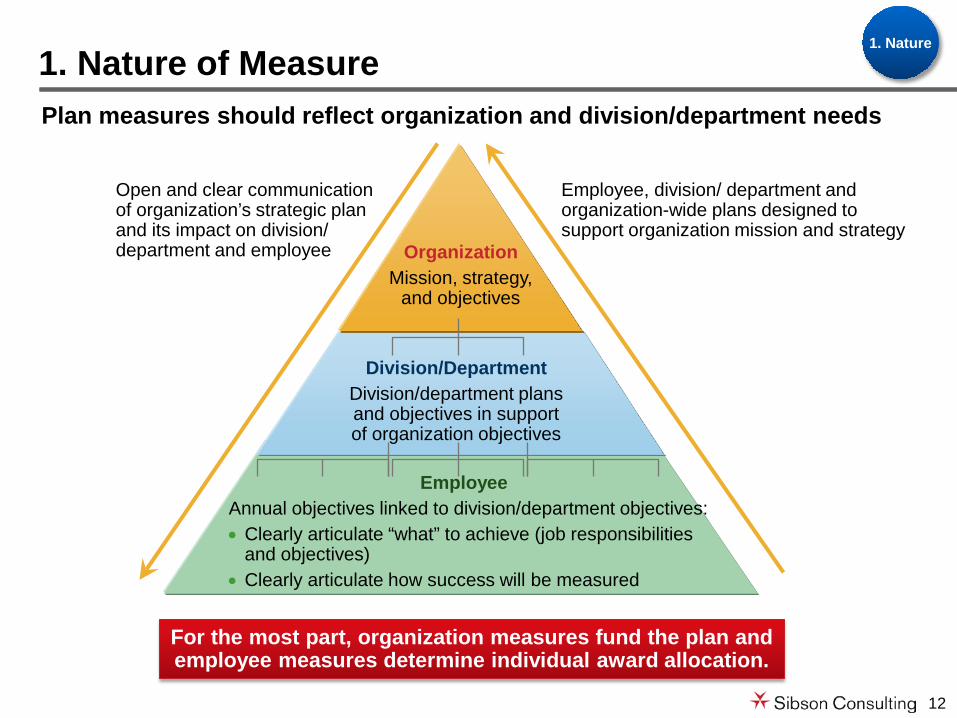
1. Nature of Measure
Open and clear communication of organization’s strategic plan and its impact on division/ department and employee
Employee, division/ department and organization-wide plans designed to support organization mission and strategy
Organization Mission, strategy,
and objectives
Division/Department Division/department plans and objectives in support of organization objectives
Employee Annual objectives linked to division/department objectives: • Clearly articulate “what” to achieve (job responsibilities
and objectives) • Clearly articulate how success will be measured
Plan measures should reflect organization and division/department needs
For the most part, organization measures fund the plan and employee measures determine individual award allocation.
1. Nature

13
1. Nature of Measure continued
Executive Operational/Individual Line-of-Sight
Value creation can be linked to financial and non-financial measures.
ILLUSTRATIVE VALUE TREE
Asset Turnover
Inventory Turnover
Receivables Turnover Payable Turnover
Net Profit Margin
Revenue
Cost of Goods Sold
Revenue from new customers/ existing products (expansion)
Revenue from existing customers/ existing products (retention)
Revenue from existing customers/ new products (penetration)
Revenue from new customers/ new products (development)
Gross Profit Margin
SG&A
Customer Satisfaction
Efficient Work Processes
Value Creation
Key Financial Measures Non-Financial Success Driver
Depending on the level of the employee, you can use different measures to provide line-of-sight and accountability to different employee populations.
1. Nature
14
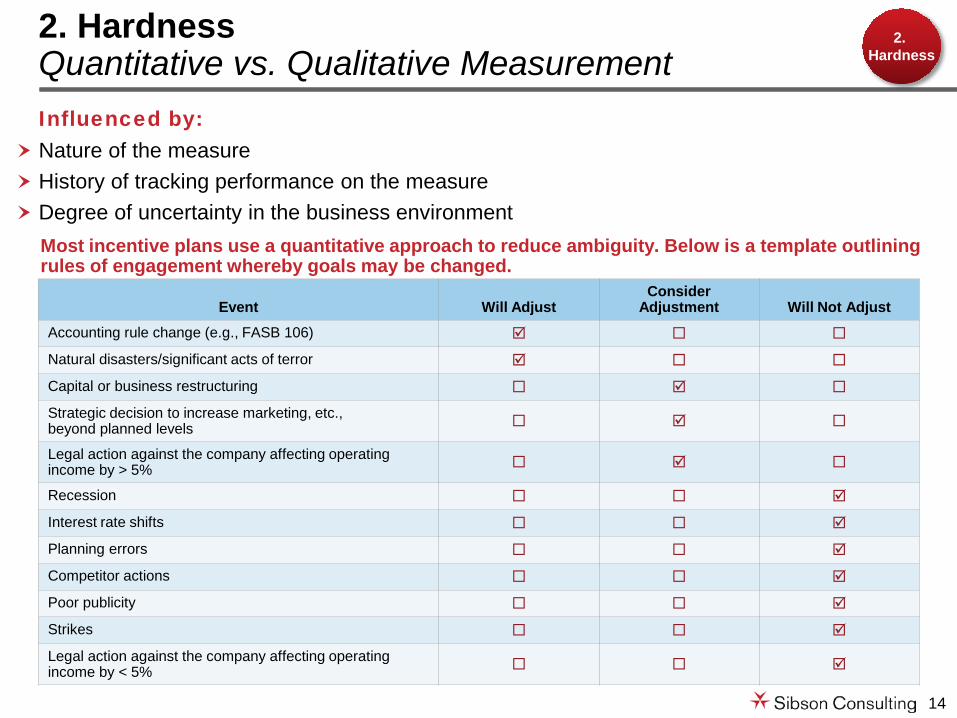
2. Hardness Quantitative vs. Qualitative Measurement
Influenced by: Nature of the measure History of tracking performance on the measure Degree of uncertainty in the business environment
Most incentive plans use a quantitative approach to reduce ambiguity. Below is a template outlining rules of engagement whereby goals may be changed.
2. Hardness
Event Will Adjust Consider
Adjustment Will Not Adjust Accounting rule change (e.g., FASB 106) Natural disasters/significant acts of terror Capital or business restructuring Strategic decision to increase marketing, etc., beyond planned levels
Legal action against the company affecting operating income by > 5%
Recession Interest rate shifts Planning errors Competitor actions Poor publicity Strikes Legal action against the company affecting operating income by < 5%
15
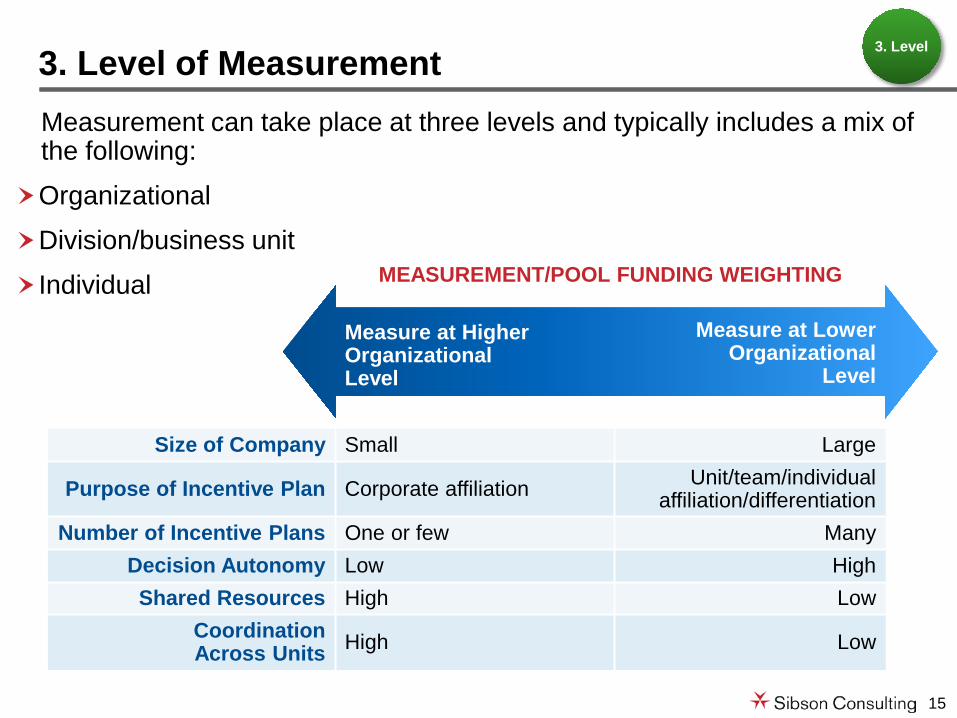
Size of Company Small Large
Purpose of Incentive Plan Corporate affiliation Unit/team/individual affiliation/differentiation
Number of Incentive Plans One or few Many Decision Autonomy Low High Shared Resources High Low
Coordination Across Units High Low
Measurement can take place at three levels and typically includes a mix of the following:
Organizational
Division/business unit
Individual
3. Level of Measurement
Measure at Higher Organizational Level
MEASUREMENT/POOL FUNDING WEIGHTING
Measure at Lower Organizational
Level
3. Level

16
Influenced by:
Time span for actions/results/consequences
Business cycles
What is the performance cycle of the proposed measure?
How long after results are known might the actions have significant consequences?
Residual Impact
How long after actions are taken are they likely to show up in measurable results? Lag Time
How long after knowing the measure and goal, can plan participants be expected to take actions to affect the measure?
Lead Time
4. Timing
17
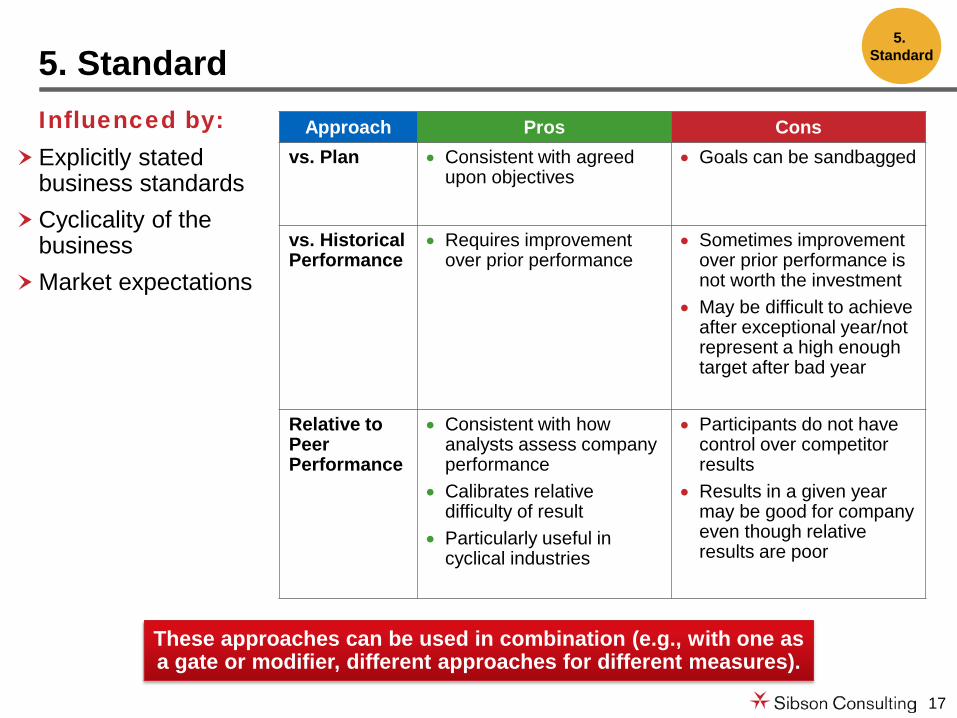
Influenced by: Explicitly stated
business standards Cyclicality of the
business Market expectations
5. Standard
These approaches can be used in combination (e.g., with one as a gate or modifier, different approaches for different measures).
Approach Pros Cons vs. Plan • Consistent with agreed
upon objectives • Goals can be sandbagged
vs. Historical Performance
• Requires improvement over prior performance
• Sometimes improvement over prior performance is not worth the investment
• May be difficult to achieve after exceptional year/not represent a high enough target after bad year
Relative to Peer Performance
• Consistent with how analysts assess company performance
• Calibrates relative difficulty of result
• Particularly useful in cyclical industries
• Participants do not have control over competitor results
• Results in a given year may be good for company even though relative results are poor
5. Standard
18
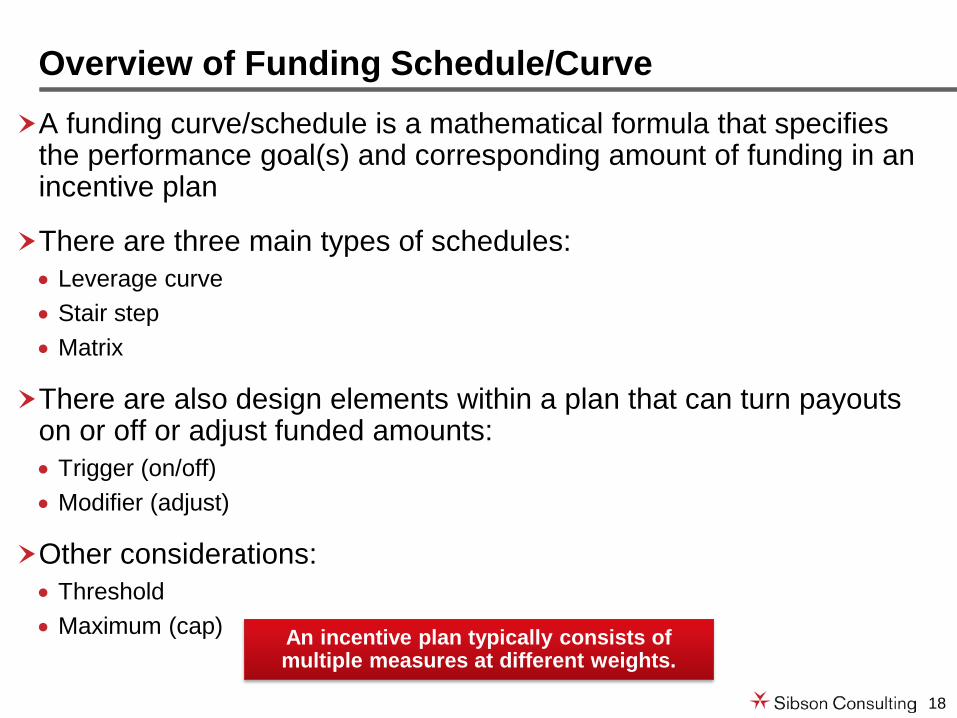
A funding curve/schedule is a mathematical formula that specifies the performance goal(s) and corresponding amount of funding in an incentive plan
There are three main types of schedules: • Leverage curve • Stair step • Matrix
There are also design elements within a plan that can turn payouts on or off or adjust funded amounts: • Trigger (on/off) • Modifier (adjust)
Other considerations: • Threshold • Maximum (cap)
Overview of Funding Schedule/Curve
An incentive plan typically consists of multiple measures at different weights.

19
CONSIDERATION DESCRIPTION
Funding Mechanics What Levers Can You Pull to Improve The Funding Relationship?
Relationship between company performance and funding Curve Shape/Slope
The amount of funding at the threshold performance level
Funding Level at Threshold Performance
The minimal level of performance required to begin pool funding
Threshold Performance Level
The maximum level of funding High Performance Scenario

20
Illustrative Funding Curve
ILLUSTRATIVE CORPORATE FUNDING CURVE
Threshold (75%)
Target (100%)
Maximum (200%)
Minimum
100%
150%
CORPORATE EBIT PERFORMANCE
FUN
DIN
G
50%
Standard Plan: Corporate EBIT meets or exceeds Threshold (75% of Target) • Threshold Performance: 50% funding • Maximum Performance: 150% funding

21
Risk versus Reward Relationship
AMOUNT OF LEVERAGE
Predictability of Results Predictable Highly Unpredictable
Availability of Talent Abundant Scarce
Company Position Lead the market Lag the market
Prominence of Incentives in Total Pay Package Not prominent Highly prominent
Pay Positioning vs. Peers Above Below
Degree of Stretch in Performance Targets Conservative Aggressive
Low High

22
An incentive award matrix determines individual incentive awards, expressed as a multiple of individual incentive opportunity (x) Actual award determination will be based on: • Company performance to budget • Performance distribution • Individual performance ratings
Bringing Together Company And Individual Performance
Individual Performance Rating 4
Partially Meets
Expectations
3 Fully Meets
Expectations
2 Exceeds
Expectations
1 Far Exceeds Expectations
Performance to Budget
Threshold (<80%) 0x 0x 0x 0x Below (90%) 0x .25x .5x .75x Budget (100%) .25x .5x .75x 1x Above (105%) .25x .75x 1x 1.5x Far Above (110%) .5x 1x 1.5x 2x
ILLUSTRATIVE INCENTIVE PAYMENT MATRIX (Expressed as multiple of individual opportunity)

23
Incentive Design Principles
Special Considerations for Sales Compensation
Administration & Communication

24
90 8050
10 2050
10 2050
1020
50
Pay mix matches the desired job behaviors as well as characteristics of the buying and sales processes.
Pay Mix & Upside
MIX AND UPSIDE POTENTIAL
Low High Influence Long Short Sales Process
Complex Simple Buying Process
2:1 Upside Potential
1:1 Upside Potential
100% TTC
25
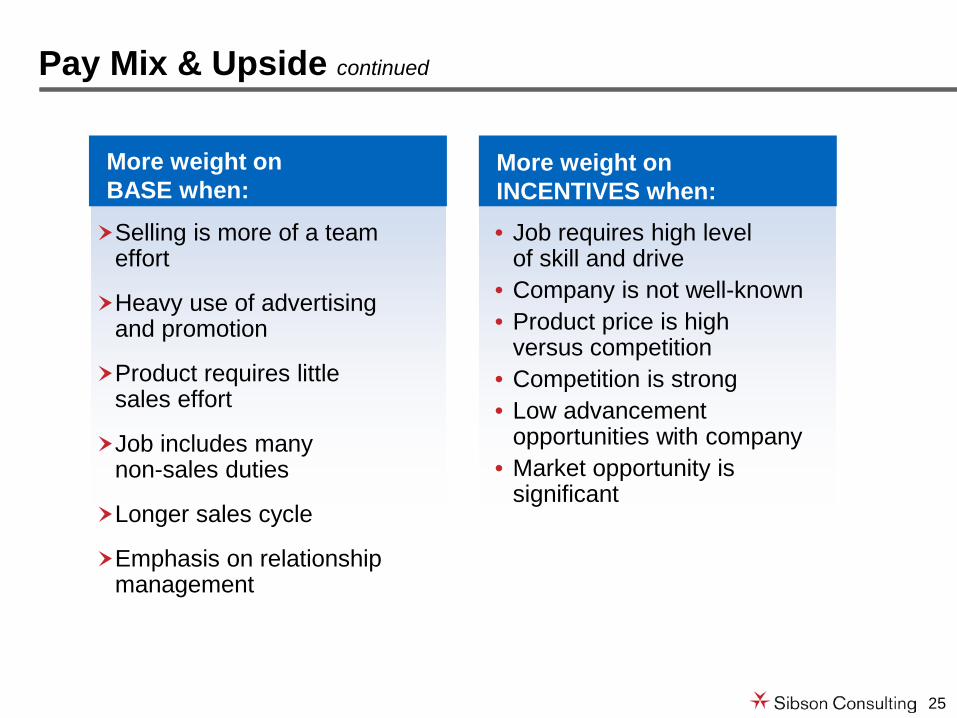
Selling is more of a team effort
Heavy use of advertising and promotion
Product requires little sales effort
Job includes many non-sales duties
Longer sales cycle
Emphasis on relationship management
More weight on BASE when:
More weight on INCENTIVES when:
Pay Mix & Upside continued
• Job requires high level of skill and drive
• Company is not well-known • Product price is high
versus competition • Competition is strong • Low advancement
opportunities with company • Market opportunity is
significant

26
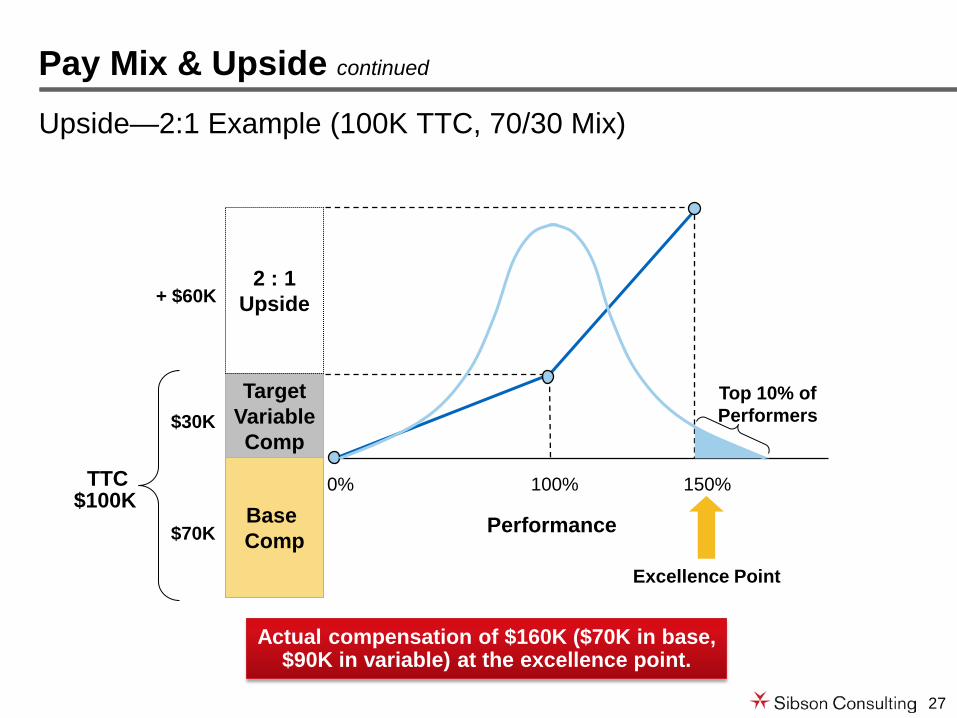
Pay Mix & Upside continued
Upside—1:1 Example (100K TTC, 70/30 Mix)
Performance
100% 150% 0%
Base Comp
Target Variable Comp
1 : 1 Upside
Excellence Point
Top 10% of Performers
TTC
$70K
$30K
$100K
+ $30K
Actual compensation of $130K ($70K in base, $60K in variable) at the excellence point.
27
Performance
100% 150% 0%
Base Comp
Target Variable Comp
2 : 1 Upside
Excellence Point
Top 10% of Performers
TTC
$70K
$30K
$100K
+ $60K
Pay Mix & Upside continued
Upside—2:1 Example (100K TTC, 70/30 Mix)
Actual compensation of $160K ($70K in base, $90K in variable) at the excellence point.

28
Incentive Measures & Weights
Sales Volume Profitability Productivity / Effectiveness Non-Sales Event Customer Based
• Sales Revenue • Billed Revenue • Recognized
Revenue • Items
─ Units ─ Contracts ─ Specifications
• Gross Profit Dollars • Gross Profit % • Gross Profit Dollar
Growth • % of Gross Profit
Rate
• Accounts ⇒ # New Accounts ⇒ Close Rate ⇒ Receivables
• Product and Service Mix
• New Product Launch
• Price Management ⇒ Discounts ⇒ Realization
• Average Revenue per Product or Service
• Sales Expense • Cost Per Order • Pipeline
Management
• Sales Referrals • Matriculation • RFP Qualification • CRM Activities • Customer
Commitment • Subordinates
─ Participation (# Achieving Sales Targets)
─ New Hire Ramp-Up Time
─ Turnover
• Sales Satisfaction ─ Customer
Survey Ratings ─ # Order
Changes • Customer Loyalty
─ Churn Rate ─ Customer
Satisfaction • Share of Wallet
TYPICAL SALES INCENTIVE MEASURES
29
Incentive Design Principles
Special Considerations for Sales Compensation
Administration & Communication

30
Summary of design and used to capture legal terms for administration
Administrative Provisions/Terms and Conditions/Policies
Country specific addendums that supersede the applicable section of the plan
Definitions of language used in plan documents: compensation elements, measures and mechanic language, etc.
Provides clarity for what governance exists, how the plan can be modified, who can modify it, and arbitration rules
Establishes clarity of plan administration. Included are rules of engagement, the process for goal-setting and adjustments, etc.
Defines compensation elements
Defines who is eligible under the sales incentive plan as well as for which sub-plan (e.g., measures, upside) each participant is eligible
Outlines the code of conduct and consequences associated with not following the code
Defines the effective start and end dates of the plan
Defines the purpose of the plan. Similar to a defined compensation strategy
Includes all additional legal clauses required to ensure legal binding of contract
8. Country Addendums
9. Definitions
7. Governance
6. Plan Administration
5. Compensation Elements
4. Eligibility
3. Code of Conduct
2. Effective Date
1. Purpose
10. Errata

31
Since leadership support is the key to effective performance management and compensation, HR leaders need to spend a significant portion of their effort building this support.
Things you can do:
1. Help leaders send the right communication messages at the right time especially the expectation to do performance management and differentiate rewards
2. Help leaders get it right for their own groups
3. Help leaders lead the calibration process
4. Help leaders with how to handle poor performers and stars
5. Train in how to hold effective performance conversations
6. Measure and report what happens: Make the process and outcomes visible
Building Leadership Support

32
Consider incorporating the following effective practices into the communication plan:
Effective Practices for Communicating Change
• Surface and manage resistance—publicly raise the “water cooler” issues
• Get brutally honest with your employees—and yourself
• Question everything
• Kick-off the change with undeniable statements (actions speak louder than words)
• Respect the past, but slaughter the “sacred cows”
• Model and encourage the new behaviors consistently in all communications
• Provide information that is relevant and personal to each employee group
• Be preemptive about the concerns of each employee group
Speak the “Unspeakables”
Make loud statements of change
Fill all knowledge gaps
33
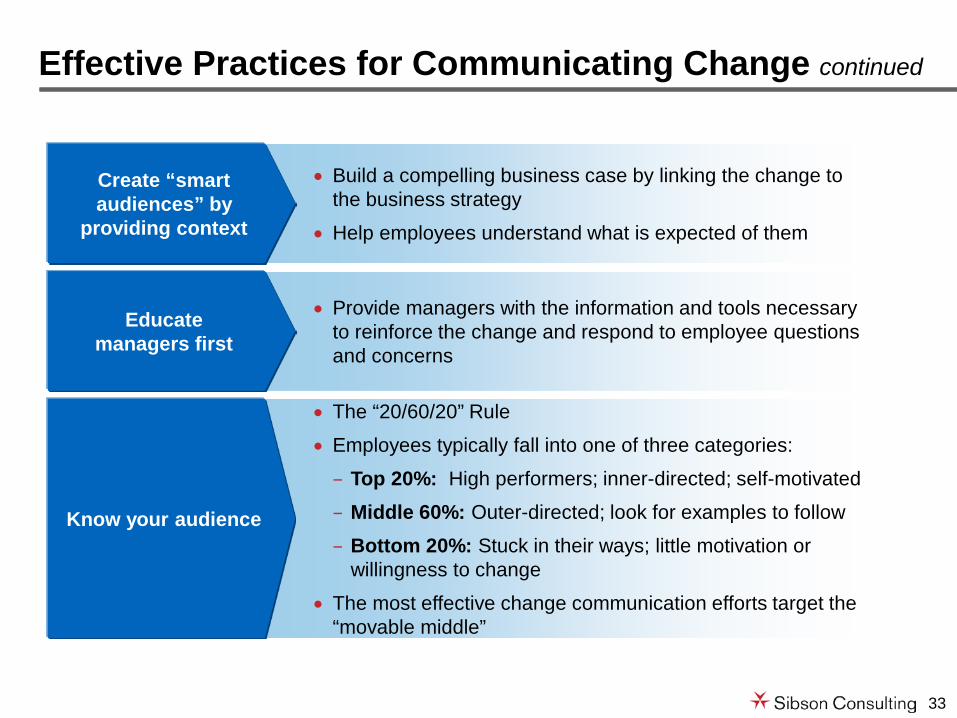
Effective Practices for Communicating Change continued
• Build a compelling business case by linking the change to the business strategy
• Help employees understand what is expected of them
Create “smart audiences” by
providing context
• Provide managers with the information and tools necessary to reinforce the change and respond to employee questions and concerns
Educate managers first
• The “20/60/20” Rule
• Employees typically fall into one of three categories:
– Top 20%: High performers; inner-directed; self-motivated
– Middle 60%: Outer-directed; look for examples to follow
– Bottom 20%: Stuck in their ways; little motivation or willingness to change
• The most effective change communication efforts target the “movable middle”
Know your audience
34
It is expected that some elements of a new program will need to be adjusted during or at the end of the first year
An effective evaluation program will determine: • Plan rollout effectiveness • Employee understanding • Employee satisfaction • Alignment with business strategy • Plan’s impact on actual sales performance (organization and individual)
In addition, an effective evaluation may provide: • An assessment of plan payouts versus performance to determine whether there is
an appropriate correlation • An examination of turnover rates, including a review of exit interview data to
determine whether the pay process is a factor in turnover • Insight on pay process errors and disparities in pay practices
Measure the Program’s Success
